UNITED STATES
SECURITIES AND EXCHANGE COMMISSION
Washington, D.C. 20549
FORM N-CSR
CERTIFIED SHAREHOLDER REPORT OF REGISTERED
MANAGEMENT INVESTMENT COMPANIES
Investment Company Act file number 811-4008
Fidelity Investment Trust
(Exact name of registrant as specified in charter)
245 Summer St., Boston, Massachusetts 02210
(Address of principal executive offices) (Zip code)
Scott C. Goebel, Secretary
245 Summer St.
Boston, Massachusetts 02210
(Name and address of agent for service)
Registrant's telephone number, including area code: 617-563-7000
Date of fiscal year end: | October 31 |
| |
Date of reporting period: | October 31, 2013 |
This report on Form N-CSR relates solely to the Registrant's Fidelity Emerging Europe, Middle East, Africa (EMEA) Fund, Fidelity Emerging Markets Discovery Fund, Fidelity Global Commodity Stock Fund, Fidelity Global Equity Income Fund, Fidelity International Discovery Fund, Fidelity International Growth Fund, Fidelity International Small Cap Fund, Fidelity International Small Cap Opportunities Fund, Fidelity International Value Fund, Fidelity Series Emerging Markets Fund, Fidelity Series International Growth Fund, Fidelity Series International Small Cap Fund, Fidelity Series International Value Fund, Fidelity Total Emerging Markets Fund, and Fidelity Total International Equity Fund (each, a "Fund" and collectively, the "Funds").
Item 1. Reports to Stockholders
Fidelity®
International Discovery
Fund
Annual Report
October 31, 2013
(Fidelity Cover Art)
Contents
Performance | (Click Here) | How the fund has done over time. |
Management's Discussion of Fund Performance | (Click Here) | The Portfolio Manager's review of fund performance and strategy. |
Shareholder Expense Example | (Click Here) | An example of shareholder expenses. |
Investment Changes | (Click Here) | A summary of major shifts in the fund's investments over the past six months. |
Investments | (Click Here) | A complete list of the fund's investments with their market values. |
Financial Statements | (Click Here) | Statements of assets and liabilities, operations, and changes in net assets, as well as financial highlights. |
Notes | (Click Here) | Notes to the financial statements. |
Report of Independent Registered Public Accounting Firm | (Click Here) | |
Trustees and Officers | (Click Here) | |
Distributions | (Click Here) | |
Board Approval of Investment Advisory Contracts and Management Fees | (Click Here) | |
To view a fund's proxy voting guidelines and proxy voting record for the 12-month period ended June 30, visit http://www.fidelity.com/proxyvotingresults or visit the Securities and Exchange Commission's (SEC) web site at http://www.sec.gov. You may also call 1-800-544-8544 to request a free copy of the proxy voting guidelines.
Standard & Poor's, S&P and S&P 500 are registered service marks of The McGraw-Hill Companies, Inc. and have been licensed for use by Fidelity Distributors Corporation.
Other third-party marks appearing herein are the property of their respective owners.
All other marks appearing herein are registered or unregistered trademarks or service marks of FMR LLC or an affiliated company. © 2013 FMR LLC. All rights reserved.
Annual Report
This report and the financial statements contained herein are submitted for the general information of the shareholders of the fund. This report is not authorized for distribution to prospective investors in the fund unless preceded or accompanied by an effective prospectus.
A fund files its complete schedule of portfolio holdings with the SEC for the first and third quarters of each fiscal year on Form N-Q. Forms N-Q are available on the SEC's web site at http://www.sec.gov. A fund's Forms N-Q may be reviewed and copied at the SEC's Public Reference Room in Washington, DC. Information regarding the operation of the SEC's Public Reference Room may be obtained by calling 1-800-SEC-0330. For a complete list of a fund's portfolio holdings, view the most recent holdings listing, semiannual report, or annual report on Fidelity's web site at http://www.fidelity.com, http://www.advisor.fidelity.com, or http://www.401k.com, as applicable.
NOT FDIC INSURED • MAY LOSE VALUE • NO BANK GUARANTEE
Neither the fund nor Fidelity Distributors Corporation is a bank.
Annual Report
Average annual total return reflects the change in the value of an investment, assuming reinvestment of the class' distributions from dividend income and capital gains (the profits earned upon the sale of securities that have grown in value, if any) and assuming a constant rate of performance each year. The $10,000 table and the fund's returns do not reflect the deduction of taxes that a shareholder would pay on fund distributions or the redemption of fund shares. During periods of reimbursement by Fidelity, a fund's total return will be greater than it would be had the reimbursement not occurred. How a fund did yesterday is no guarantee of how it will do tomorrow.
Average Annual Total Returns
Periods ended October 31, 2013 | Past 1
year | Past 5
years | Past 10
years |
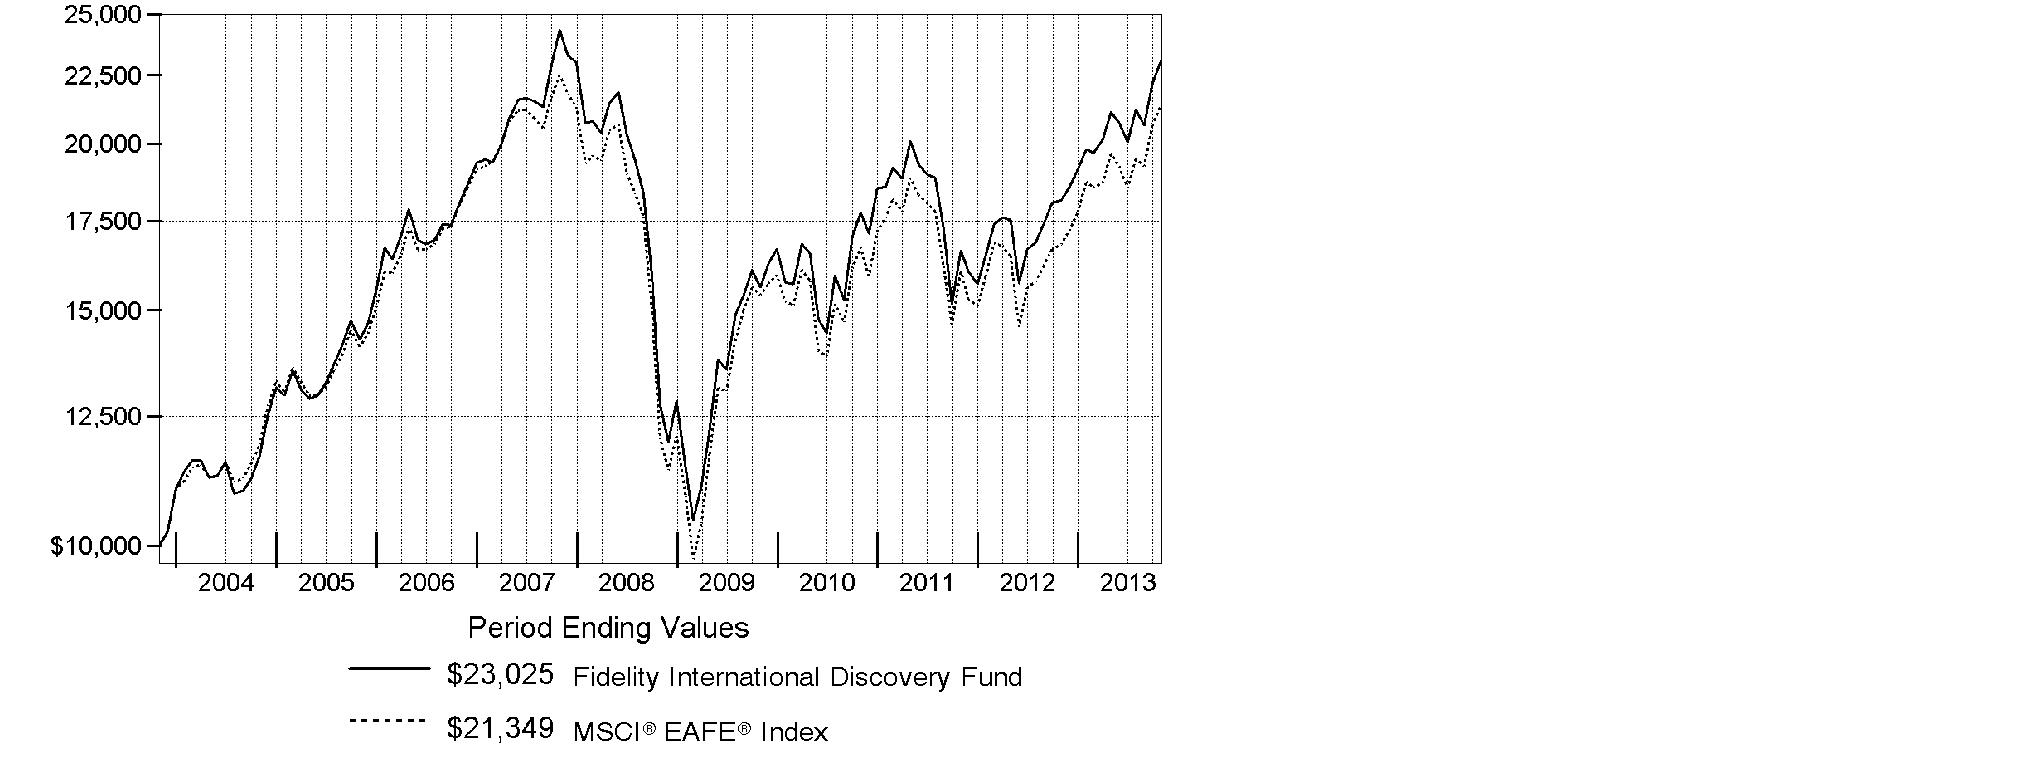
Fidelity® International Discovery Fund A | 27.03% | 12.55% | 8.70% |
A Prior to October 1, 2004, Fidelity International Discovery Fund operated under certain different investment policies. The fund's historical performance may not represent its current investment policies.
$10,000 Over 10 Years
Let's say hypothetically that $10,000 was invested in Fidelity® International Discovery Fund, a class of the fund, on October 31, 2003. The chart shows how the value of your investment would have changed, and also shows how the MSCI® EAFE ® Index performed over the same period.
Annual Report
Market Recap: On balance, global equity markets remained upbeat for the 12-month period ending October 31, 2013. The MSCI® ACWI® (All Country World Index) Index gained 23.75% for the period, amid investor preference for higher-risk assets. The period was not without turbulence, however. In the spring and summer, central banks worldwide, especially in the U.S. and China, made clear their intentions to maintain accommodative monetary policies. That stance, combined with modest cyclical improvements around the globe and generally low valuations, underpinned the broad rally in equities. Europe (+32%) shone brightly, with most markets in the region - large and small - registering solid, index-beating gains. Another bright spot was Japan, which, despite a struggling yen and taking a second-half breather, posted a 34% result for the full year. The U.S. - by far the index's biggest constituent - also outperformed the global market with a roughly 28% advance. Meanwhile, Asia-Pacific ex Japan (+14%) lagged, hurt in part by a slowdown in Australia's mining industry as well as currency headwinds. Foreign-exchange and commodity weakness also curbed results in resource-heavy Canada and emerging markets (EM), both of which were up 7%. Country-level EM performance diverged meaningfully for the period, as evidenced by performance in Brazil (-1%), Russia (+12%), India (+1%) and China (+8%).
Comments from William Kennedy, Portfolio Manager of Fidelity® International Discovery Fund: For the year, the fund's Retail Class shares returned 27.03%, tracking the 27.02% gain of its benchmark, the MSCI® EAFE® Index. Security selection aided relative performance, with notable outperformance in the U.K. and Japan. Positioning in the Asia Pacific ex Japan region and the materials sector also contributed, as did security selection in information technology. Top individual contributors included U.K.-based online-only supermarket Ocado Group, an out-of-index position that rallied after the company significantly expanded its business capacity. An overweighting in real estate leasing company ORIX stood out, as improved economic activity drove up real estate prices in Japan. By contrast, stock picks in core European countries, emerging markets and the automobiles & components segment of consumer discretionary detracted, along with a small cash position in an up market. Individual disappointments included Housing Development Finance, a large mortgage provider in India, whose stock declined along with the Indian rupee. An average underweighting in Toyota Motor also hurt, as the weakening yen combined with the company's market-share increases to propel the stock higher.
The views expressed above reflect those of the portfolio manager(s) only through the end of the period as stated on the cover of this report and do not necessarily represent the views of Fidelity or any other person in the Fidelity organization. Any such views are subject to change at any time based upon market or other conditions and Fidelity disclaims any responsibility to update such views. These views may not be relied on as investment advice and, because investment decisions for a Fidelity fund are based on numerous factors, may not be relied on as an indication of trading intent on behalf of any Fidelity fund.
Annual Report
Shareholder Expense Example
As a shareholder of the Fund, you incur two types of costs: (1) transaction costs, including sales charges (loads) on purchase payments or redemption proceeds, redemption fees and (2) ongoing costs, including management fees, distribution and/or service (12b-1) fees and other Fund expenses. This Example is intended to help you understand your ongoing costs (in dollars) of investing in the Fund and to compare these costs with the ongoing costs of investing in other mutual funds.
The actual expense Example is based on an investment of $1,000 invested at the beginning of the period and held for the entire period (May 1, 2013 to October 31, 2013) for Class A, Class T, Class B, Class C, International Discovery, Class K and Institutional Class and for the period (August 13, 2013 to October 31, 2013) for Class Z. The hypothetical expense Example is based on an investment of $1,000 invested for the one-half year period (May 1, 2013 to October 31, 2013).
Actual Expenses
The first line of the accompanying table for each class of the Fund provides information about actual account values and actual expenses. You may use the information in this line, together with the amount you invested, to estimate the expenses that you paid over the period. Simply divide your account value by $1,000.00 (for example, an $8,600 account value divided by $1,000.00 = 8.6), then multiply the result by the number in the first line for a class of the Fund under the heading entitled "Expenses Paid During Period" to estimate the expenses you paid on your account during this period. A small balance maintenance fee of $12.00 that is charged once a year may apply for certain accounts with a value of less than $2,000. This fee is not included in the table below. If it was, the estimate of expenses you paid during the period would be higher, and your ending account value lower, by this amount. In addition, the Fund, as a shareholder in the underlying Fidelity Central Funds, will indirectly bear its pro-rata share of the fees and expenses incurred by the underlying Fidelity Central Funds. These fees and expenses are not included in the Fund's annualized expense ratio used to calculate the expense estimate in the table below.
Hypothetical Example for Comparison Purposes
The second line of the accompanying table for each class of the Fund provides information about hypothetical account values and hypothetical expenses based on a Class' actual expense ratio and an assumed rate of return of 5% per year before expenses, which is not the Class' actual return. The hypothetical account values and expenses may not be used to estimate the actual ending account balance or expenses you paid for the period. You may use this information to compare the ongoing costs of investing in the Fund and other funds. To do so, compare this 5% hypothetical example with the 5% hypothetical examples that appear in the shareholder reports of the other funds. A small balance maintenance fee of $12.00 that is charged once a year may apply for certain accounts with a value of less than $2,000. This fee is not included in the table below. If it was, the estimate of expenses you paid during the period would be higher, and your ending account value lower, by this amount. In addition, the Fund, as a shareholder in the underlying Fidelity Central Funds, will indirectly bear its pro-rata share of the fees and expenses incurred by the underlying Fidelity Central Funds. These fees and expenses are not included in the Fund's annualized expense ratio used to calculate the expense estimate in the table below.
Annual Report
Please note that the expenses shown in the table are meant to highlight your ongoing costs only and do not reflect any transaction costs. Therefore, the second line of the table is useful in comparing ongoing costs only, and will not help you determine the relative total costs of owning different funds. In addition, if these transactional costs were included, your costs would have been higher.
| Annualized
Expense Ratio B | Beginning
Account Value | Ending
Account Value
October 31, 2013 | Expenses Paid
During Period |
Class A | 1.34% | | | |
Actual | | $ 1,000.00 | $ 1,089.10 | $ 7.06 C |
HypotheticalA | | $ 1,000.00 | $ 1,018.45 | $ 6.82 D |
Class T | 1.58% | | | |
Actual | | $ 1,000.00 | $ 1,087.90 | $ 8.31 C |
HypotheticalA | | $ 1,000.00 | $ 1,017.24 | $ 8.03 D |
Class B | 2.09% | | | |
Actual | | $ 1,000.00 | $ 1,085.00 | $ 10.98 C |
HypotheticalA | | $ 1,000.00 | $ 1,014.67 | $ 10.61 D |
Class C | 2.09% | | | |
Actual | | $ 1,000.00 | $ 1,085.30 | $ 10.99 C |
HypotheticalA | | $ 1,000.00 | $ 1,014.67 | $ 10.61 D |
International Discovery | .99% | | | |
Actual | | $ 1,000.00 | $ 1,091.00 | $ 5.22 C |
HypotheticalA | | $ 1,000.00 | $ 1,020.21 | $ 5.04 D |
Class K | .85% | | | |
Actual | | $ 1,000.00 | $ 1,092.00 | $ 4.48 C |
HypotheticalA | | $ 1,000.00 | $ 1,020.92 | $ 4.33 D |
Institutional Class | .99% | | | |
Actual | | $ 1,000.00 | $ 1,091.10 | $ 5.22 C |
HypotheticalA | | $ 1,000.00 | $ 1,020.21 | $ 5.04 D |
Class Z | .85% | | | |
Actual | | $ 1,000.00 | $ 1,068.50 | $ 1.93 C |
HypotheticalA | | $ 1,000.00 | $ 1,020.92 | $ 4.33 D |
A 5% return per year before expenses
B Annualized expense ratio reflects expenses net of applicable fee waivers.
Annual Report
Shareholder Expense Example - continued
C Actual expenses are equal to each Class' annualized expense ratio; multiplied by the average account value over the period, multiplied by 184/365 (to reflect the one-half year period) for Class A, Class T, Class B, Class C, International Discovery, Class K and Institutional Class and multiplied by 80/365 (to reflect the period August 13, 2013 to October 31, 2013) for Class Z.
D Hypothetical expenses are equal to each Class' annualized expense ratio, multiplied by the average account value over the period, multiplied by 184/365 (to reflect the one-half year period).
Annual Report
Investment Changes (Unaudited)
Geographic Diversification (% of fund's net assets) |
As of October 31, 2013 |
 | Japan 18.2% | |
 | United Kingdom 15.9% | |
 | France 10.9% | |
 | Germany 8.7% | |
 | Switzerland 6.4% | |
 | United States of America* 5.5% | |
 | Sweden 4.1% | |
 | Spain 3.6% | |
 | Netherlands 3.3% | |
 | Other 23.4% | |

Percentages are based on country or territory of incorporation and are adjusted for the effect of futures contracts, if applicable. |
* Includes Short-Term Investments and Net Other Assets (Liabilities) |
As of April 30, 2013 |
| Japan 20.5% | |
| United Kingdom 16.1% | |
| France 9.7% | |
| Germany 7.5% | |
| Switzerland 6.3% | |
| United States of America* 5.2% | |
| Australia 3.9% | |
| Sweden 2.7% | |
| Netherlands 2.5% | |
| Other 25.6% | |

Percentages are based on country or territory of incorporation and are adjusted for the effect of futures contracts, if applicable. |
* Includes Short-Term Investments and Net Other Assets (Liabilities) |
Asset Allocation as of October 31, 2013 |
| % of fund's
net assets | % of fund's net assets
6 months ago |
Stocks and Equity Futures | 97.2 | 96.6 |
Short-Term Investments and Net Other Assets (Liabilities) | 2.8 | 3.4 |
Top Ten Stocks as of October 31, 2013 |
| % of fund's
net assets | % of fund's net assets
6 months ago |
Roche Holding AG (participation certificate) (Switzerland, Pharmaceuticals) | 2.0 | 1.0 |
Australia & New Zealand Banking Group Ltd. (Australia, Commercial Banks) | 1.8 | 1.6 |
Bayer AG (Germany, Pharmaceuticals) | 1.6 | 0.8 |
Toyota Motor Corp. (Japan, Automobiles) | 1.6 | 0.7 |
Total SA (France, Oil, Gas & Consumable Fuels) | 1.5 | 0.0 |
Volkswagen AG (Germany, Automobiles) | 1.5 | 0.7 |
UBS AG (Switzerland, Capital Markets) | 1.4 | 1.1 |
ORIX Corp. (Japan, Diversified Financial Services) | 1.4 | 1.1 |
SoftBank Corp. (Japan, Wireless Telecommunication Services) | 1.4 | 0.6 |
Banco Bilbao Vizcaya Argentaria SA (Spain, Commercial Banks) | 1.3 | 0.7 |
| 15.5 | |
Market Sectors as of October 31, 2013 |
| % of fund's
net assets | % of fund's net assets
6 months ago |
Financials | 24.8 | 24.3 |
Consumer Discretionary | 16.4 | 16.5 |
Industrials | 13.0 | 12.1 |
Consumer Staples | 10.1 | 11.3 |
Health Care | 9.5 | 8.9 |
Information Technology | 7.7 | 7.5 |
Materials | 5.2 | 5.7 |
Telecommunication Services | 5.1 | 4.1 |
Energy | 3.8 | 3.0 |
Utilities | 0.6 | 1.1 |
Annual Report
Investments October 31, 2013
Showing Percentage of Net Assets
Common Stocks - 94.7% |
| Shares | | Value (000s) |
Australia - 3.2% |
Ansell Ltd. | 2,268,950 | | $ 41,796 |
Australia & New Zealand Banking Group Ltd. | 6,493,040 | | 207,673 |
Ramsay Health Care Ltd. | 1,619,364 | | 59,385 |
Woodside Petroleum Ltd. | 1,461,485 | | 53,623 |
TOTAL AUSTRALIA | | 362,477 |
Austria - 0.2% |
Andritz AG | 455,300 | | 28,047 |
Bailiwick of Jersey - 2.6% |
Experian PLC | 6,115,400 | | 124,529 |
Wolseley PLC | 1,508,304 | | 81,283 |
WPP PLC | 3,996,700 | | 84,910 |
TOTAL BAILIWICK OF JERSEY | | 290,722 |
Belgium - 2.1% |
Anheuser-Busch InBev SA NV | 1,183,927 | | 122,730 |
KBC Groupe SA | 2,102,810 | | 114,632 |
TOTAL BELGIUM | | 237,362 |
Bermuda - 0.3% |
Cheung Kong Infrastructure Holdings Ltd. | 5,048,000 | | 35,127 |
Brazil - 0.1% |
Arezzo Industria e Comercio SA | 1,051,500 | | 15,724 |
British Virgin Islands - 0.4% |
Mail.Ru Group Ltd. GDR (Reg. S) | 1,193,800 | | 44,027 |
Canada - 1.0% |
Constellation Software, Inc. | 159,200 | | 29,002 |
InterOil Corp. (a)(d) | 204,400 | | 14,196 |
Suncor Energy, Inc. | 2,012,600 | | 73,138 |
TOTAL CANADA | | 116,336 |
Cayman Islands - 1.2% |
Baidu.com, Inc. sponsored ADR (a) | 123,100 | | 19,807 |
Cimc Enric Holdings Ltd. | 16,316,000 | | 22,981 |
ENN Energy Holdings Ltd. | 5,084,000 | | 30,132 |
Eurasia Drilling Co. Ltd. GDR (Reg. S) | 630,200 | | 26,689 |
Greatview Aseptic Pack Co. Ltd. | 26,392,000 | | 16,612 |
Sands China Ltd. | 1,460,800 | | 10,382 |
Youku Tudou, Inc. ADR (a)(d) | 300,200 | | 8,177 |
TOTAL CAYMAN ISLANDS | | 134,780 |
Common Stocks - continued |
| Shares | | Value (000s) |
Cyprus - 0.0% |
SPDI Secure Property Development & Investment PLC (a) | 529,830 | | $ 597 |
Denmark - 0.6% |
Novo Nordisk A/S Series B | 396,489 | | 66,036 |
Finland - 0.7% |
Sampo Oyj (A Shares) | 1,739,800 | | 82,418 |
France - 10.9% |
Arkema SA | 487,670 | | 55,368 |
Atos Origin SA | 388,851 | | 33,198 |
AXA SA | 5,364,600 | | 134,022 |
BNP Paribas SA | 1,544,345 | | 114,361 |
Bureau Veritas SA | 1,413,000 | | 42,667 |
Danone SA | 905,500 | | 67,152 |
Edenred SA | 1,177,900 | | 40,022 |
Havas SA | 5,201,268 | | 43,333 |
Iliad SA | 213,972 | | 48,924 |
Kering SA | 373,000 | | 84,753 |
Lafarge SA (Bearer) (d) | 605,900 | | 41,939 |
LVMH Moet Hennessy - Louis Vuitton SA | 612,502 | | 117,924 |
Sanofi SA | 890,979 | | 94,999 |
Schneider Electric SA | 1,383,800 | | 116,583 |
Technip SA | 192,300 | | 20,144 |
Total SA | 2,831,600 | | 173,727 |
TOTAL FRANCE | | 1,229,116 |
Germany - 7.2% |
Aareal Bank AG (a) | 1,044,895 | | 40,185 |
adidas AG | 541,900 | | 61,863 |
BASF AG | 1,265,455 | | 131,663 |
Bayer AG | 1,471,500 | | 182,890 |
Brenntag AG | 444,700 | | 75,353 |
GEA Group AG | 1,254,770 | | 54,602 |
GSW Immobilien AG | 430,481 | | 20,019 |
HeidelbergCement Finance AG | 860,300 | | 67,818 |
KION Group AG (a) | 577,867 | | 23,538 |
LEG Immobilien AG | 184,948 | | 10,547 |
Siemens AG | 1,110,885 | | 141,963 |
TOTAL GERMANY | | 810,441 |
Common Stocks - continued |
| Shares | | Value (000s) |
Hong Kong - 1.8% |
AIA Group Ltd. | 20,789,200 | | $ 105,515 |
Techtronic Industries Co. Ltd. | 39,683,000 | | 99,809 |
TOTAL HONG KONG | | 205,324 |
India - 0.6% |
Housing Development Finance Corp. Ltd. | 3,139,461 | | 43,561 |
United Spirits Ltd. | 444,545 | | 18,569 |
TOTAL INDIA | | 62,130 |
Indonesia - 0.1% |
PT Tower Bersama Infrastructure Tbk | 17,734,500 | | 8,967 |
Ireland - 2.0% |
Actavis PLC (a) | 308,100 | | 47,626 |
Bank of Ireland (a) | 146,718,100 | | 53,399 |
James Hardie Industries PLC CDI | 6,070,470 | | 62,711 |
Kerry Group PLC Class A | 945,600 | | 60,555 |
TOTAL IRELAND | | 224,291 |
Italy - 1.0% |
De Longhi SpA | 2,248,100 | | 34,797 |
Moleskine SpA | 4,183,000 | | 10,223 |
Tod's SpA | 117,793 | | 19,624 |
UniCredit SpA | 3,689,800 | | 27,754 |
World Duty Free SpA (a) | 2,253,904 | | 24,972 |
TOTAL ITALY | | 117,370 |
Japan - 17.2% |
ABC-MART, Inc. | 826,300 | | 41,324 |
Aozora Bank Ltd. | 16,056,000 | | 46,675 |
ARNEST ONE Corp. (d) | 306,200 | | 8,395 |
Astellas Pharma, Inc. | 768,700 | | 42,852 |
Cosmos Pharmaceutical Corp. | 245,800 | | 29,946 |
Daikin Industries Ltd. | 1,089,400 | | 62,677 |
Don Quijote Co. Ltd. | 1,818,400 | | 121,044 |
Hajime Construction Co. Ltd. | 34,900 | | 2,406 |
Hitachi Ltd. | 5,121,000 | | 35,822 |
Japan Exchange Group, Inc. | 2,589,500 | | 60,201 |
Japan Tobacco, Inc. | 3,948,700 | | 142,879 |
Kakaku.com, Inc. | 1,903,000 | | 36,807 |
KDDI Corp. | 2,082,700 | | 112,792 |
Keyence Corp. | 304,060 | | 130,317 |
Leopalace21 Corp. (a) | 6,899,700 | | 47,901 |
Common Stocks - continued |
| Shares | | Value (000s) |
Japan - continued |
Miraca Holdings, Inc. | 196,700 | | $ 8,863 |
Mitsubishi UFJ Financial Group, Inc. | 18,169,200 | | 115,706 |
Nomura Real Estate Holdings, Inc. | 563,300 | | 14,252 |
Omron Corp. | 1,225,300 | | 46,759 |
ORIX Corp. | 9,072,900 | | 157,152 |
Park24 Co. Ltd. | 1,342,800 | | 26,218 |
Rakuten, Inc. | 5,237,700 | | 68,245 |
Santen Pharmaceutical Co. Ltd. | 1,166,900 | | 59,239 |
Seven & i Holdings Co., Ltd. | 2,167,000 | | 80,198 |
Shinsei Bank Ltd. | 24,904,000 | | 58,308 |
Ship Healthcare Holdings, Inc. | 1,076,700 | | 44,182 |
SoftBank Corp. | 2,099,300 | | 156,773 |
Toyota Motor Corp. | 2,789,300 | | 180,853 |
USS Co. Ltd. | 450,400 | | 6,596 |
TOTAL JAPAN | | 1,945,382 |
Korea (South) - 0.9% |
Hyundai Motor Co. | 206,848 | | 49,311 |
NHN Corp. | 69,296 | | 38,981 |
Orion Corp. | 14,973 | | 14,602 |
TOTAL KOREA (SOUTH) | | 102,894 |
Luxembourg - 0.3% |
Brait SA | 6,048,833 | | 29,465 |
Mexico - 0.2% |
Alsea S.A.B. de CV | 7,662,195 | | 23,831 |
Netherlands - 3.3% |
AEGON NV | 5,028,800 | | 40,014 |
ASML Holding NV | 772,233 | | 73,084 |
European Aeronautic Defence and Space Co. (EADS) NV | 176,700 | | 12,142 |
Koninklijke Ahold NV | 2,412,842 | | 45,930 |
Koninklijke Philips Electronics NV | 2,496,700 | | 88,235 |
Randstad Holding NV | 717,740 | | 44,296 |
Royal DSM NV | 536,200 | | 40,617 |
Yandex NV (a) | 861,400 | | 31,751 |
TOTAL NETHERLANDS | | 376,069 |
New Zealand - 0.4% |
Ryman Healthcare Group Ltd. | 7,311,565 | | 45,597 |
Norway - 1.0% |
DNB ASA | 6,068,755 | | 107,551 |
Common Stocks - continued |
| Shares | | Value (000s) |
Philippines - 0.1% |
Alliance Global Group, Inc. | 26,741,800 | | $ 16,306 |
Russia - 0.5% |
Mobile TeleSystems OJSC sponsored ADR | 2,313,400 | | 52,746 |
Singapore - 0.4% |
Global Logistic Properties Ltd. | 16,214,205 | | 40,333 |
South Africa - 1.1% |
Naspers Ltd. Class N | 1,302,700 | | 121,851 |
Spain - 3.6% |
Amadeus IT Holding SA Class A | 1,319,900 | | 49,014 |
Antena 3 de Television SA | 1,515,400 | | 25,411 |
Banco Bilbao Vizcaya Argentaria SA | 12,546,524 | | 146,630 |
Criteria CaixaCorp SA | 4,210,900 | | 21,892 |
Distribuidora Internacional de Alimentacion SA | 5,726,396 | | 52,349 |
Grifols SA ADR | 1,208,550 | | 36,450 |
Inditex SA (d) | 481,679 | | 79,134 |
TOTAL SPAIN | | 410,880 |
Sweden - 4.1% |
ASSA ABLOY AB (B Shares) | 1,783,400 | | 88,536 |
Intrum Justitia AB | 1,835,800 | | 48,869 |
Investment AB Kinnevik (B Shares) | 2,363,300 | | 87,091 |
Nordea Bank AB | 6,100,600 | | 78,140 |
Svenska Cellulosa AB (SCA) (B Shares) | 3,591,900 | | 101,991 |
Svenska Handelsbanken AB (A Shares) | 1,258,200 | | 57,007 |
TOTAL SWEDEN | | 461,634 |
Switzerland - 6.4% |
Credit Suisse Group | 1,039,246 | | 32,329 |
Lonza Group AG | 476,868 | | 42,623 |
Partners Group Holding AG | 230,056 | | 59,609 |
Roche Holding AG (participation certificate) | 821,773 | | 227,506 |
Schindler Holding AG (participation certificate) | 260,065 | | 36,888 |
SGS SA (Reg.) | 7,770 | | 18,206 |
Swatch Group AG (Bearer) | 36,702 | | 23,481 |
Syngenta AG (Switzerland) | 179,374 | | 72,398 |
UBS AG | 8,311,378 | | 160,751 |
Zurich Insurance Group AG | 180,481 | | 49,907 |
TOTAL SWITZERLAND | | 723,698 |
Common Stocks - continued |
| Shares | | Value (000s) |
Taiwan - 0.6% |
ECLAT Textile Co. Ltd. | 2,457,180 | | $ 27,005 |
Taiwan Semiconductor Manufacturing Co. Ltd. | 11,289,000 | | 41,528 |
TOTAL TAIWAN | | 68,533 |
United Kingdom - 15.9% |
Aberdeen Asset Management PLC | 5,975,132 | | 42,432 |
Alabama Noor Hospitals Group PLC (a) | 1,829,400 | | 24,933 |
Associated British Foods PLC | 1,571,500 | | 57,123 |
Barclays PLC | 22,636,113 | | 95,241 |
BG Group PLC | 3,923,700 | | 80,119 |
BHP Billiton PLC | 2,080,582 | | 64,204 |
British American Tobacco PLC (United Kingdom) | 881,200 | | 48,618 |
Croda International PLC | 630,000 | | 24,607 |
Diageo PLC | 4,394,219 | | 140,077 |
Foxtons Group PLC | 2,178,500 | | 11,134 |
Hikma Pharmaceuticals PLC | 3,197,720 | | 61,578 |
HSBC Holdings PLC (United Kingdom) | 12,266,193 | | 134,454 |
Intertek Group PLC | 893,600 | | 47,741 |
ITV PLC | 11,642,037 | | 35,635 |
Jazztel PLC (a) | 4,681,964 | | 51,364 |
Legal & General Group PLC | 26,720,558 | | 92,671 |
Liberty Global PLC Class A (a) | 610,800 | | 47,868 |
London Stock Exchange Group PLC | 1,729,000 | | 45,521 |
Meggitt PLC | 6,842,366 | | 62,809 |
Next PLC | 781,744 | | 68,250 |
Ocado Group PLC (a) | 8,103,297 | | 56,389 |
Persimmon PLC | 2,082,200 | | 42,233 |
Reckitt Benckiser Group PLC | 788,600 | | 61,300 |
Rolls-Royce Group PLC | 4,197,715 | | 77,402 |
Rotork PLC | 717,800 | | 32,951 |
Royal Mail PLC | 788,800 | | 7,083 |
SABMiller PLC | 1,478,600 | | 77,145 |
Taylor Wimpey PLC | 18,277,100 | | 32,295 |
The Restaurant Group PLC | 1,992,100 | | 18,398 |
Ultra Electronics Holdings PLC | 614,667 | | 19,061 |
Vodafone Group PLC | 36,632,743 | | 134,177 |
TOTAL UNITED KINGDOM | | 1,794,813 |
United States of America - 2.7% |
Beam, Inc. | 387,400 | | 26,072 |
Google, Inc. Class A (a) | 60,100 | | 61,938 |
Illumina, Inc. (a) | 12,500 | | 1,169 |
Common Stocks - continued |
| Shares | | Value (000s) |
United States of America - continued |
MasterCard, Inc. Class A | 160,100 | | $ 114,808 |
McGraw-Hill Companies, Inc. | 488,400 | | 34,032 |
Sohu.com, Inc. (a) | 313,700 | | 21,005 |
Visa, Inc. Class A | 260,000 | | 51,134 |
TOTAL UNITED STATES OF AMERICA | | 310,158 |
TOTAL COMMON STOCKS (Cost $8,462,801) |
10,703,033
|
Nonconvertible Preferred Stocks - 1.5% |
| | | |
Germany - 1.5% |
Volkswagen AG | 650,200 | | 165,262 |
United Kingdom - 0.0% |
Rolls-Royce Group PLC Series C | 361,003,490 | | 579 |
TOTAL NONCONVERTIBLE PREFERRED STOCKS (Cost $133,620) |
165,841
|
Government Obligations - 0.1% |
| Principal Amount (000s) | | |
United States of America - 0.1% |
U.S. Treasury Bills, yield at date of purchase 0.02% to 0.04% 1/2/14 (e)
(Cost $6,960) | | $ 6,960 | |
6,960
|
Money Market Funds - 4.0% |
| Shares | | |
Fidelity Cash Central Fund, 0.09% (b) | 431,996,301 | | 431,996 |
Fidelity Securities Lending Cash Central Fund, 0.09% (b)(c) | 22,072,034 | | 22,072 |
TOTAL MONEY MARKET FUNDS (Cost $454,068) |
454,068
|
TOTAL INVESTMENT PORTFOLIO - 100.3% (Cost $9,057,449) | | 11,329,902 |
NET OTHER ASSETS (LIABILITIES) - (0.3)% | | (35,016) |
NET ASSETS - 100% | $ 11,294,886 |
Futures Contracts |
| Expiration Date | | Underlying Face Amount at Value (000s) | | Unrealized Appreciation/
(Depreciation) (000s) |
Purchased |
Equity Index Contracts |
1,572 Nikkei 225 Index Contracts (Japan) | Dec. 2013 | | $ 113,695 | | $ 4,238 |
|
The face value of futures purchased as a percentage of net assets is 1% |
Legend |
(a) Non-income producing |
(b) Affiliated fund that is generally available only to investment companies and other accounts managed by Fidelity Investments. The rate quoted is the annualized seven-day yield of the fund at period end. A complete unaudited listing of the fund's holdings as of its most recent quarter end is available upon request. In addition, each Fidelity Central Fund's financial statements, which are not covered by the Fund's Report of Independent Registered Public Accounting Firm, are available on the SEC's website or upon request. |
(c) Investment made with cash collateral received from securities on loan. |
(d) Security or a portion of the security is on loan at period end. |
(e) Security or a portion of the security was pledged to cover margin requirements for futures contracts. At period end, the value of securities pledged amounted to $6,960,000. |
Affiliated Central Funds |
Information regarding fiscal year to date income earned by the Fund from investments in Fidelity Central Funds is as follows: |
Fund | Income earned
(Amounts in thousands) |
Fidelity Cash Central Fund | $ 420 |
Fidelity Securities Lending Cash Central Fund | 5,441 |
Total | $ 5,861 |
Other Affiliated Issuers |
An affiliated company is a company in which the Fund has ownership of at least 5% of the voting securities. Fiscal year to date transactions with companies which are or were affiliates are as follows: |
Affiliate
(Amounts in thousands) | Value, beginning of period | Purchases | Sales Proceeds | Dividend Income | Value,
end of
period |
Boyner Buyuk Magazacilik A/S | $ 10,764 | $ - | $ 16,020 | $ - | $ - |
Other Information |
Categorizations in the Schedule of Investments are based on country or territory of incorporation. |
The following is a summary of the inputs used, as of October 31, 2013, involving the Fund's assets and liabilities carried at fair value. The inputs or methodology used for valuing securities may not be an indication of the risk associated with investing in those securities. For more information on valuation inputs, and their aggregation into the levels used in the table below, please refer to the Investment Valuation section in the accompanying Notes to Financial Statements. |
Valuation Inputs at Reporting Date: |
Description
(Amounts in thousands) | Total | Level 1 | Level 2 | Level 3 |
Investments in Securities: | | | | |
Equities: | | | | |
Consumer Discretionary | $ 1,843,308 | $ 1,414,445 | $ 418,062 | $ 10,801 |
Consumer Staples | 1,147,236 | 582,788 | 564,448 | - |
Energy | 441,636 | 267,909 | 173,727 | - |
Financials | 2,821,082 | 1,658,069 | 1,163,013 | - |
Health Care | 1,087,724 | 771,553 | 316,171 | - |
Industrials | 1,451,790 | 1,132,697 | 319,093 | - |
Information Technology | 867,159 | 575,926 | 291,233 | - |
Materials | 577,937 | 441,335 | 136,602 | - |
Telecommunication Services | 565,743 | 162,001 | 403,742 | - |
Utilities | 65,259 | 65,259 | - | - |
Government Obligations | 6,960 | - | 6,960 | - |
Money Market Funds | 454,068 | 454,068 | - | - |
Total Investments in Securities: | $ 11,329,902 | $ 7,526,050 | $ 3,793,051 | $ 10,801 |
Derivative Instruments: | | | | |
Assets | | | | |
Futures Contracts | $ 4,238 | $ 4,238 | $ - | $ - |
The following is a summary of transfers between Level 1 and Level 2 for the period ended October 31, 2013. Transfers are assumed to have occurred at the beginning of the period, and are primarily attributable to the valuation techniques used for foreign equity securities, as discussed in the accompanying Notes to Financial Statements: |
Transfers | Total (000s) |
Level 1 to Level 2 | $ 712,449 |
Level 2 to Level 1 | $ 0 |
Value of Derivative Instruments |
The following table is a summary of the Fund's value of derivative instruments by primary risk exposure as of October 31, 2013. For additional information on derivative instruments, please refer to the Derivative Instruments section in the accompanying Notes to Financial Statements. |
Primary Risk Exposure /
Derivative Type | Value |
| Asset | Liability |
Equity Risk | | |
Futures Contracts (a) | $ 4,238 | $ - |
(a) Reflects gross cumulative appreciation (depreciation) on futures contracts as presented in the Schedule of Investments. Only the period end receivable or payable for daily variation margin and net unrealized appreciation (depreciation) are presented in the Statement of Assets and Liabilities. |
See accompanying notes which are an integral part of the financial statements.
Annual Report
Statement of Assets and Liabilities
Amounts in thousands (except per-share amounts) | October 31, 2013 |
| | |
Assets | | |
Investment in securities, at value (including securities loaned of $21,646) - See accompanying schedule: Unaffiliated issuers (cost $8,603,381) | $ 10,875,834 | |
Fidelity Central Funds (cost $454,068) | 454,068 | |
Total Investments (cost $9,057,449) | | $ 11,329,902 |
Foreign currency held at value (cost $934) | | 924 |
Receivable for investments sold | | 8,555 |
Receivable for fund shares sold | | 7,336 |
Dividends receivable | | 20,216 |
Distributions receivable from Fidelity Central Funds | | 122 |
Prepaid expenses | | 35 |
Other receivables | | 4,081 |
Total assets | | 11,371,171 |
| | |
Liabilities | | |
Payable for investments purchased | $ 38,436 | |
Payable for fund shares redeemed | 5,719 | |
Accrued management fee | 6,631 | |
Distribution and service plan fees payable | 128 | |
Payable for daily variation margin for derivative instruments | 983 | |
Other affiliated payables | 1,581 | |
Other payables and accrued expenses | 735 | |
Collateral on securities loaned, at value | 22,072 | |
Total liabilities | | 76,285 |
| | |
Net Assets | | $ 11,294,886 |
Net Assets consist of: | | |
Paid in capital | | $ 9,866,929 |
Undistributed net investment income | | 131,430 |
Accumulated undistributed net realized gain (loss) on investments and foreign currency transactions | | (979,010) |
Net unrealized appreciation (depreciation) on investments and assets and liabilities in foreign currencies | | 2,275,537 |
Net Assets | | $ 11,294,886 |
See accompanying notes which are an integral part of the financial statements.
Annual Report
Statement of Assets and Liabilities - continued
Amounts in thousands (except per-share amounts) | October 31, 2013 |
| | |
Calculation of Maximum Offering Price Class A:
Net Asset Value and redemption price per share ($346,717.68 ÷ 8,780.120 shares) | | $ 39.49 |
| | |
Maximum offering price per share (100/94.25 of $39.49) | | $ 41.90 |
Class T:
Net Asset Value and redemption price per share ($53,183.51 ÷ 1,355.789 shares) | | $ 39.23 |
| | |
Maximum offering price per share (100/96.50 of $39.23) | | $ 40.65 |
Class B:
Net Asset Value and offering price per share ($6,686.96 ÷ 171.088 shares)A | | $ 39.08 |
| | |
Class C:
Net Asset Value and offering price per share ($36,470.54 ÷ 933.457 shares)A | | $ 39.07 |
| | |
International Discovery:
Net Asset Value, offering price and redemption price per share ($7,799,575.78 ÷ 195,853.386 shares) | | $ 39.82 |
| | |
Class K:
Net Asset Value, offering price and redemption price per share ($2,576,018.46 ÷ 64,786.777 shares) | | $ 39.76 |
| | |
Institutional Class:
Net Asset Value, offering price and redemption price per share ($476,126.48 ÷ 11,975.218 shares) | | $ 39.76 |
| | |
Class Z:
Net Asset Value, offering price and redemption price per share ($106.86 ÷ 2.687 shares) | | $ 39.77 |
A Redemption price per share is equal to net asset value less any applicable contingent deferred sales charge.
See accompanying notes which are an integral part of the financial statements.
Annual Report
Financial Statements - continued
Statement of Operations
Amounts in thousands | Year ended October 31, 2013 |
| | |
Investment Income | | |
Dividends | | $ 233,738 |
Interest | | 3 |
Income from Fidelity Central Funds | | 5,861 |
Income before foreign taxes withheld | | 239,602 |
Less foreign taxes withheld | | (17,198) |
Total income | | 222,404 |
| | |
Expenses | | |
Management fee
Basic fee | $ 67,899 | |
Performance adjustment | 6,089 | |
Transfer agent fees | 16,474 | |
Distribution and service plan fees | 1,432 | |
Accounting and security lending fees | 1,778 | |
Custodian fees and expenses | 1,352 | |
Independent trustees' compensation | 54 | |
Registration fees | 215 | |
Audit | 119 | |
Legal | 24 | |
Miscellaneous | 76 | |
Total expenses before reductions | 95,512 | |
Expense reductions | (2,311) | 93,201 |
Net investment income (loss) | | 129,203 |
Realized and Unrealized Gain (Loss) Net realized gain (loss) on: | | |
Investment securities: | | |
Unaffiliated issuers | 671,713 | |
Other affiliated issuers | 4,258 | |
Foreign currency transactions | (1,963) | |
Futures contracts | 51,368 | |
Total net realized gain (loss) | | 725,376 |
Change in net unrealized appreciation (depreciation) on: Investment securities | 1,459,188 | |
Assets and liabilities in foreign currencies | (54) | |
Futures contracts | 4,238 | |
Total change in net unrealized appreciation (depreciation) | | 1,463,372 |
Net gain (loss) | | 2,188,748 |
Net increase (decrease) in net assets resulting from operations | | $ 2,317,951 |
See accompanying notes which are an integral part of the financial statements.
Annual Report
Statement of Changes in Net Assets
Amounts in thousands | Year ended
October 31,
2013 | Year ended
October 31,
2012 |
Increase (Decrease) in Net Assets | | |
Operations | | |
Net investment income (loss) | $ 129,203 | $ 143,212 |
Net realized gain (loss) | 725,376 | (207,579) |
Change in net unrealized appreciation (depreciation) | 1,463,372 | 762,141 |
Net increase (decrease) in net assets resulting
from operations | 2,317,951 | 697,774 |
Distributions to shareholders from net investment income | (146,031) | (118,968) |
Distributions to shareholders from net realized gain | (8,413) | - |
Total distributions | (154,444) | (118,968) |
Share transactions - net increase (decrease) | 714,712 | (915,362) |
Redemption fees | 128 | 128 |
Total increase (decrease) in net assets | 2,878,347 | (336,428) |
| | |
Net Assets | | |
Beginning of period | 8,416,539 | 8,752,967 |
End of period (including undistributed net investment income of $131,430 and undistributed net investment income of $126,507, respectively) | $ 11,294,886 | $ 8,416,539 |
See accompanying notes which are an integral part of the financial statements.
Annual Report
Financial Highlights - Class A
Years ended October 31, | 2013 | 2012 | 2011 | 2010 | 2009 |
Selected Per-Share Data | | | | | |
Net asset value, beginning of period | $ 31.66 | $ 29.43 | $ 32.07 | $ 28.57 | $ 23.68 |
Income from Investment Operations | | | | | |
Net investment income (loss) C | .34 | .41 | .42 | .31 | .31 |
Net realized and unrealized gain (loss) | 7.97 | 2.11 | (2.52) | 3.51 | 4.84 |
Total from investment operations | 8.31 | 2.52 | (2.10) | 3.82 | 5.15 |
Distributions from net investment income | (.45) | (.29) | (.38) | (.28) | (.26) |
Distributions from net realized gain | (.03) | - | (.16) | (.04) | - |
Total distributions | (.48) | (.29) | (.54) | (.32) | (.26) |
Redemption fees added to paid in capital C,G | - | - | - | - | - |
Net asset value, end of period | $ 39.49 | $ 31.66 | $ 29.43 | $ 32.07 | $ 28.57 |
Total Return A,B | 26.59% | 8.70% | (6.71)% | 13.43% | 22.14% |
Ratios to Average Net Assets D,F | | | | |
Expenses before reductions | 1.35% | 1.34% | 1.30% | 1.33% | 1.37% |
Expenses net of fee waivers, if any | 1.35% | 1.34% | 1.29% | 1.33% | 1.37% |
Expenses net of all reductions | 1.33% | 1.31% | 1.25% | 1.28% | 1.32% |
Net investment income (loss) | .97% | 1.41% | 1.31% | 1.06% | 1.28% |
Supplemental Data | | | | | |
Net assets, end of period (in millions) | $ 347 | $ 299 | $ 320 | $ 392 | $ 414 |
Portfolio turnover rate E | 65% | 68% | 75% | 82% | 98% |
A Total returns would have been lower if certain expenses had not been reduced during the applicable periods shown.
B Total returns do not include the effect of the sales charges.
C Calculated based on average shares outstanding during the period.
D Fees and expenses of any underlying Fidelity Central Funds are not included in the Fund's expense ratio. The Fund indirectly bears its proportionate share of the expenses of any underlying Fidelity Central Funds.
E Amount does not include the portfolio activity of any underlying Fidelity Central Funds.
F Expense ratios reflect operating expenses of the class. Expenses before reductions do not reflect amounts reimbursed by the investment adviser or reductions from brokerage service arrangements or reductions from other expense offset arrangements and do not represent the amount paid by the class during periods when reimbursements or reductions occur. Expenses net of fee waivers reflect expenses after reimbursement by the investment adviser but prior to reductions from brokerage service arrangements or other expense offset arrangements. Expenses net of all reductions represent the net expenses paid by the class.
G Amount represents less than $.01 per share.
See accompanying notes which are an integral part of the financial statements.
Annual Report
Financial Highlights - Class T
Years ended October 31, | 2013 | 2012 | 2011 | 2010 | 2009 |
Selected Per-Share Data | | | | | |
Net asset value, beginning of period | $ 31.42 | $ 29.18 | $ 31.81 | $ 28.35 | $ 23.49 |
Income from Investment Operations | | | | | |
Net investment income (loss) C | .26 | .34 | .34 | .23 | .24 |
Net realized and unrealized gain (loss) | 7.92 | 2.09 | (2.51) | 3.48 | 4.81 |
Total from investment operations | 8.18 | 2.43 | (2.17) | 3.71 | 5.05 |
Distributions from net investment income | (.34) | (.19) | (.30) | (.21) | (.19) |
Distributions from net realized gain | (.03) | - | (.16) | (.04) | - |
Total distributions | (.37) | (.19) | (.46) | (.25) | (.19) |
Redemption fees added to paid in capital C,G | - | - | - | - | - |
Net asset value, end of period | $ 39.23 | $ 31.42 | $ 29.18 | $ 31.81 | $ 28.35 |
Total Return A,B | 26.31% | 8.41% | (6.96)% | 13.14% | 21.79% |
Ratios to Average Net Assets D,F | | | | |
Expenses before reductions | 1.59% | 1.59% | 1.56% | 1.60% | 1.65% |
Expenses net of fee waivers, if any | 1.59% | 1.59% | 1.55% | 1.60% | 1.65% |
Expenses net of all reductions | 1.57% | 1.56% | 1.51% | 1.56% | 1.60% |
Net investment income (loss) | .73% | 1.16% | 1.05% | .79% | 1.00% |
Supplemental Data | | | | | |
Net assets, end of period (in millions) | $ 53 | $ 46 | $ 61 | $ 92 | $ 83 |
Portfolio turnover rate E | 65% | 68% | 75% | 82% | 98% |
A Total returns would have been lower if certain expenses had not been reduced during the applicable periods shown.
B Total returns do not include the effect of the sales charges.
C Calculated based on average shares outstanding during the period.
D Fees and expenses of any underlying Fidelity Central Funds are not included in the Fund's expense ratio. The Fund indirectly bears its proportionate share of the expenses of any underlying Fidelity Central Funds.
E Amount does not include the portfolio activity of any underlying Fidelity Central Funds.
F Expense ratios reflect operating expenses of the class. Expenses before reductions do not reflect amounts reimbursed by the investment adviser or reductions from brokerage service arrangements or reductions from other expense offset arrangements and do not represent the amount paid by the class during periods when reimbursements or reductions occur. Expenses net of fee waivers reflect expenses after reimbursement by the investment adviser but prior to reductions from brokerage service arrangements or other expense offset arrangements. Expenses net of all reductions represent the net expenses paid by the class.
G Amount represents less than $.01 per share.
See accompanying notes which are an integral part of the financial statements.
Annual Report
Financial Highlights - Class B
Years ended October 31, | 2013 | 2012 | 2011 | 2010 | 2009 |
Selected Per-Share Data | | | | | |
Net asset value, beginning of period | $ 31.28 | $ 29.02 | $ 31.60 | $ 28.18 | $ 23.25 |
Income from Investment Operations | | | | | |
Net investment income (loss) C | .08 | .19 | .17 | .08 | .12 |
Net realized and unrealized gain (loss) | 7.90 | 2.09 | (2.48) | 3.44 | 4.81 |
Total from investment operations | 7.98 | 2.28 | (2.31) | 3.52 | 4.93 |
Distributions from net investment income | (.15) | (.02) | (.12) | (.06) | - |
Distributions from net realized gain | (.03) | - | (.16) | (.04) | - |
Total distributions | (.18) | (.02) | (.27) H | (.10) | - |
Redemption fees added to paid in capital C,G | - | - | - | - | - |
Net asset value, end of period | $ 39.08 | $ 31.28 | $ 29.02 | $ 31.60 | $ 28.18 |
Total Return A,B | 25.64% | 7.85% | (7.39)% | 12.52% | 21.20% |
Ratios to Average Net Assets D,F | | | | |
Expenses before reductions | 2.10% | 2.09% | 2.06% | 2.12% | 2.16% |
Expenses net of fee waivers, if any | 2.10% | 2.09% | 2.06% | 2.12% | 2.16% |
Expenses net of all reductions | 2.08% | 2.06% | 2.02% | 2.08% | 2.11% |
Net investment income (loss) | .22% | .66% | .54% | .27% | .49% |
Supplemental Data | | | | | |
Net assets, end of period (in millions) | $ 7 | $ 8 | $ 10 | $ 14 | $ 16 |
Portfolio turnover rate E | 65% | 68% | 75% | 82% | 98% |
A Total returns would have been lower if certain expenses had not been reduced during the applicable periods shown.
B Total returns do not include the effect of the contingent deferred sales charge.
C Calculated based on average shares outstanding during the period.
D Fees and expenses of any underlying Fidelity Central Funds are not included in the Fund's expense ratio. The Fund indirectly bears its proportionate share of the expenses of any underlying Fidelity Central Funds.
E Amount does not include the portfolio activity of any underlying Fidelity Central Funds.
F Expense ratios reflect operating expenses of the class. Expenses before reductions do not reflect amounts reimbursed by the investment adviser or reductions from brokerage service arrangements or reductions from other expense offset arrangements and do not represent the amount paid by the class during periods when reimbursements or reductions occur. Expenses net of fee waivers reflect expenses after reimbursement by the investment adviser but prior to reductions from brokerage service arrangements or other expense offset arrangements. Expenses net of all reductions represent the net expenses paid by the class.
G Amount represents less than $.01 per share.
H Total distributions of $.27 per share is comprised of distributions from net investment income of $.115 and distributions from net realized gain of $.155 per share.
See accompanying notes which are an integral part of the financial statements.
Annual Report
Financial Highlights - Class C
Years ended October 31, | 2013 | 2012 | 2011 | 2010 | 2009 |
Selected Per-Share Data | | | | | |
Net asset value, beginning of period | $ 31.32 | $ 29.08 | $ 31.68 | $ 28.23 | $ 23.31 |
Income from Investment Operations | | | | | |
Net investment income (loss) C | .08 | .19 | .18 | .09 | .12 |
Net realized and unrealized gain (loss) | 7.90 | 2.09 | (2.49) | 3.45 | 4.82 |
Total from investment operations | 7.98 | 2.28 | (2.31) | 3.54 | 4.94 |
Distributions from net investment income | (.20) | (.04) | (.14) | (.05) | (.02) |
Distributions from net realized gain | (.03) | - | (.16) | (.04) | - |
Total distributions | (.23) | (.04) | (.29) H | (.09) | (.02) |
Redemption fees added to paid in capital C,G | - | - | - | - | - |
Net asset value, end of period | $ 39.07 | $ 31.32 | $ 29.08 | $ 31.68 | $ 28.23 |
Total Return A,B | 25.65% | 7.86% | (7.37)% | 12.54% | 21.22% |
Ratios to Average Net Assets D,F | | | | |
Expenses before reductions | 2.10% | 2.09% | 2.05% | 2.09% | 2.14% |
Expenses net of fee waivers, if any | 2.09% | 2.09% | 2.04% | 2.09% | 2.14% |
Expenses net of all reductions | 2.07% | 2.06% | 2.00% | 2.05% | 2.09% |
Net investment income (loss) | .23% | .66% | .56% | .30% | .51% |
Supplemental Data | | | | | |
Net assets, end of period (in millions) | $ 36 | $ 30 | $ 33 | $ 44 | $ 43 |
Portfolio turnover rate E | 65% | 68% | 75% | 82% | 98% |
A Total returns would have been lower if certain expenses had not been reduced during the applicable periods shown.
B Total returns do not include the effect of the contingent deferred sales charge.
C Calculated based on average shares outstanding during the period.
D Fees and expenses of any underlying Fidelity Central Funds are not included in the Fund's expense ratio. The Fund indirectly bears its proportionate share of the expenses of any underlying Fidelity Central Funds.
E Amount does not include the portfolio activity of any underlying Fidelity Central Funds.
F Expense ratios reflect operating expenses of the class. Expenses before reductions do not reflect amounts reimbursed by the investment adviser or reductions from brokerage service arrangements or reductions from other expense offset arrangements and do not represent the amount paid by the class during periods when reimbursements or reductions occur. Expenses net of fee waivers reflect expenses after reimbursement by the investment adviser but prior to reductions from brokerage service arrangements or other expense offset arrangements. Expenses net of all reductions represent the net expenses paid by the class.
G Amount represents less than $.01 per share.
H Total distributions of $.29 per share is comprised of distributions from net investment income of $.137 and distributions from net realized gain of $.155 per share.
See accompanying notes which are an integral part of the financial statements.
Annual Report
Financial Highlights - International Discovery
Years ended October 31, | 2013 | 2012 | 2011 | 2010 | 2009 |
Selected Per-Share Data | | | | | |
Net asset value, beginning of period | $ 31.91 | $ 29.69 | $ 32.34 | $ 28.79 | $ 23.88 |
Income from Investment Operations | | | | | |
Net investment income (loss) B | .47 | .51 | .53 | .40 | .37 |
Net realized and unrealized gain (loss) | 8.02 | 2.12 | (2.54) | 3.54 | 4.88 |
Total from investment operations | 8.49 | 2.63 | (2.01) | 3.94 | 5.25 |
Distributions from net investment income | (.55) | (.41) | (.48) | (.35) | (.34) |
Distributions from net realized gain | (.03) | - | (.16) | (.04) | - |
Total distributions | (.58) | (.41) | (.64) | (.39) | (.34) |
Redemption fees added to paid in capital B,F | - | - | - | - | - |
Net asset value, end of period | $ 39.82 | $ 31.91 | $ 29.69 | $ 32.34 | $ 28.79 |
Total Return A | 27.03% | 9.03% | (6.39)% | 13.76% | 22.47% |
Ratios to Average Net Assets C,E | | | | |
Expenses before reductions | 1.00% | 1.01% | .97% | 1.05% | 1.12% |
Expenses net of fee waivers, if any | 1.00% | 1.01% | .96% | 1.05% | 1.12% |
Expenses net of all reductions | .98% | .98% | .92% | 1.00% | 1.07% |
Net investment income (loss) | 1.32% | 1.73% | 1.64% | 1.35% | 1.53% |
Supplemental Data | | | | | |
Net assets, end of period (in millions) | $ 7,800 | $ 5,965 | $ 6,806 | $ 8,133 | $ 8,114 |
Portfolio turnover rate D | 65% | 68% | 75% | 82% | 98% |
A Total returns would have been lower if certain expenses had not been reduced during the applicable periods shown.
B Calculated based on average shares outstanding during the period.
C Fees and expenses of any underlying Fidelity Central Funds are not included in the Fund's expense ratio. The Fund indirectly bears its proportionate share of the expenses of any underlying Fidelity Central Funds.
D Amount does not include the portfolio activity of any underlying Fidelity Central Funds.
E Expense ratios reflect operating expenses of the class. Expenses before reductions do not reflect amounts reimbursed by the investment adviser or reductions from brokerage service arrangements or reductions from other expense offset arrangements and do not represent the amount paid by the class during periods when reimbursements or reductions occur. Expenses net of fee waivers reflect expenses after reimbursement by the investment adviser but prior to reductions from brokerage service arrangements or other expense offset arrangements. Expenses net of all reductions represent the net expenses paid by the class.
F Amount represents less than $.01 per share.
See accompanying notes which are an integral part of the financial statements.
Annual Report
Financial Highlights - Class K
Years ended October 31, | 2013 | 2012 | 2011 | 2010 | 2009 |
Selected Per-Share Data | | | | | |
Net asset value, beginning of period | $ 31.87 | $ 29.66 | $ 32.32 | $ 28.78 | $ 23.90 |
Income from Investment Operations | | | | | |
Net investment income (loss) B | .52 | .57 | .58 | .46 | .44 |
Net realized and unrealized gain (loss) | 8.01 | 2.11 | (2.54) | 3.53 | 4.86 |
Total from investment operations | 8.53 | 2.68 | (1.96) | 3.99 | 5.30 |
Distributions from net investment income | (.61) | (.47) | (.55) | (.41) | (.42) |
Distributions from net realized gain | (.03) | - | (.16) | (.04) | - |
Total distributions | (.64) | (.47) | (.70) G | (.45) | (.42) |
Redemption fees added to paid in capital B,F | - | - | - | - | - |
Net asset value, end of period | $ 39.76 | $ 31.87 | $ 29.66 | $ 32.32 | $ 28.78 |
Total Return A | 27.23% | 9.24% | (6.24)% | 13.96% | 22.80% |
Ratios to Average Net Assets C,E | | | | |
Expenses before reductions | .85% | .83% | .80% | .84% | .88% |
Expenses net of fee waivers, if any | .85% | .83% | .79% | .84% | .88% |
Expenses net of all reductions | .83% | .80% | .75% | .79% | .83% |
Net investment income (loss) | 1.47% | 1.91% | 1.81% | 1.55% | 1.77% |
Supplemental Data | | | | | |
Net assets, end of period (in millions) | $ 2,576 | $ 1,776 | $ 1,245 | $ 1,078 | $ 674 |
Portfolio turnover rate D | 65% | 68% | 75% | 82% | 98% |
A Total returns would have been lower if certain expenses had not been reduced during the applicable periods shown.
B Calculated based on average shares outstanding during the period.
C Fees and expenses of any underlying Fidelity Central Funds are not included in the Fund's expense ratio. The Fund indirectly bears its proportionate share of the expenses of any underlying Fidelity Central Funds.
D Amount does not include the portfolio activity of any underlying Fidelity Central Funds.
E Expense ratios reflect operating expenses of the class. Expenses before reductions do not reflect amounts reimbursed by the investment adviser or reductions from brokerage service arrangements or reductions from other expense offset arrangements and do not represent the amount paid by the class during periods when reimbursements or reductions occur. Expenses net of fee waivers reflect expenses after reimbursement by the investment adviser but prior to reductions from brokerage service arrangements or other expense offset arrangements. Expenses net of all reductions represent the net expenses paid by the class.
F Amount represents less than $.01 per share.
G Total distributions of $.70 per share is comprised of distributions from net investment income of $.548 and distributions from net realized gain of $.155 per share.
See accompanying notes which are an integral part of the financial statements.
Annual Report
Financial Highlights - Institutional Class
Years ended October 31, | 2013 | 2012 | 2011 | 2010 | 2009 |
Selected Per-Share Data | | | | | |
Net asset value, beginning of period | $ 31.87 | $ 29.65 | $ 32.31 | $ 28.77 | $ 23.91 |
Income from Investment Operations | | | | | |
Net investment income (loss) B | .47 | .52 | .54 | .41 | .39 |
Net realized and unrealized gain (loss) | 8.01 | 2.11 | (2.55) | 3.55 | 4.86 |
Total from investment operations | 8.48 | 2.63 | (2.01) | 3.96 | 5.25 |
Distributions from net investment income | (.56) | (.41) | (.50) | (.38) | (.39) |
Distributions from net realized gain | (.03) | - | (.16) | (.04) | - |
Total distributions | (.59) | (.41) | (.65) G | (.42) | (.39) |
Redemption fees added to paid in capital B,F | - | - | - | - | - |
Net asset value, end of period | $ 39.76 | $ 31.87 | $ 29.65 | $ 32.31 | $ 28.77 |
Total Return A | 27.03% | 9.07% | (6.39)% | 13.84% | 22.52% |
Ratios to Average Net Assets C,E | | | | |
Expenses before reductions | 1.00% | 1.00% | .95% | .99% | 1.05% |
Expenses net of fee waivers, if any | 1.00% | 1.00% | .94% | .99% | 1.05% |
Expenses net of all reductions | .97% | .97% | .90% | .95% | 1.00% |
Net investment income (loss) | 1.33% | 1.75% | 1.66% | 1.40% | 1.60% |
Supplemental Data | | | | | |
Net assets, end of period (in millions) | $ 476 | $ 294 | $ 278 | $ 319 | $ 267 |
Portfolio turnover rate D | 65% | 68% | 75% | 82% | 98% |
A Total returns would have been lower if certain expenses had not been reduced during the applicable periods shown.
B Calculated based on average shares outstanding during the period.
C Fees and expenses of any underlying Fidelity Central Funds are not included in the Fund's expense ratio. The Fund indirectly bears its proportionate share of the expenses of any underlying Fidelity Central Funds.
D Amount does not include the portfolio activity of any underlying Fidelity Central Funds.
E Expense ratios reflect operating expenses of the class. Expenses before reductions do not reflect amounts reimbursed by the investment adviser or reductions from brokerage service arrangements or reductions from other expense offset arrangements and do not represent the amount paid by the class during periods when reimbursements or reductions occur. Expenses net of fee waivers reflect expenses after reimbursement by the investment adviser but prior to reductions from brokerage service arrangements or other expense offset arrangements. Expenses net of all reductions represent the net expenses paid by the class.
F Amount represents less than $.01 per share.
G Total distributions of $.65 per share is comprised of distributions from net investment income of $.497 and distributions from net realized gain of $.155 per share.
See accompanying notes which are an integral part of the financial statements.
Annual Report
Financial Highlights - Class Z
Year ended October 31, | 2013 G |
Selected Per-Share Data | |
Net asset value, beginning of period | $ 37.22 |
Income from Investment Operations | |
Net investment income (loss) D | .07 |
Net realized and unrealized gain (loss) | 2.48 |
Total from investment operations | 2.55 |
Redemption fees added to paid in capital D,I | - |
Net asset value, end of period | $ 39.77 |
Total Return B,C | 6.85% |
Ratios to Average Net Assets E,H | |
Expenses before reductions | .85% A |
Expenses net of fee waivers, if any | .85% A |
Expenses net of all reductions | .83% A |
Net investment income (loss) | .76% A |
Supplemental Data | |
Net assets, end of period (000 omitted) | $ 107 |
Portfolio turnover rate F | 65% |
A Annualized
B Total returns for periods of less than one year are not annualized.
C Total returns would have been lower if certain expenses had not been reduced during the applicable periods shown.
D Calculated based on average shares outstanding during the period.
E Fees and expenses of any underlying Fidelity Central Funds are not included in the Fund's expense ratio. The Fund indirectly bears its proportionate share of the expenses of any underlying Fidelity Central Funds.
F Amount does not include the portfolio activity of any underlying Fidelity Central Funds.
G For the period August 13, 2013 (commencement of sale of shares) to October 31, 2013.
H Expense ratios reflect operating expenses of the class. Expenses before reductions do not reflect amounts reimbursed by the investment adviser or reductions from brokerage service arrangements or reductions from other expense offset arrangements and do not represent the amount paid by the class during periods when reimbursements or reductions occur. Expense ratios before reductions for start-up periods may not be representative of longer-term operating periods. Expenses net of fee waivers reflect expenses after reimbursement by the investment adviser but prior to reductions from brokerage service arrangements or other expense offset arrangements. Expenses net of all reductions represent the net expenses paid by the class.
I Amount represents less than $.01 per share.
See accompanying notes which are an integral part of the financial statements.
Annual Report
Notes to Financial Statements
For the period ended October 31, 2013
(Amounts in thousands except percentages)
1. Organization.
Fidelity International Discovery Fund (the Fund) is a fund of Fidelity Investment Trust (the Trust) and is authorized to issue an unlimited number of shares. The Trust is registered under the Investment Company Act of 1940, as amended (the 1940 Act), as an open-end management investment company organized as a Massachusetts business trust. The Fund commenced sale of Class Z shares on August 13, 2013. The Fund offers Class A, Class T, Class C, International Discovery, Class K, Institutional Class and Class Z shares, each of which, along with Class B shares, has equal rights as to assets and voting privileges. Class B shares are closed to new accounts and additional purchases, except for exchanges and reinvestments. Each class has exclusive voting rights with respect to matters that affect that class. Class B shares will automatically convert to Class A shares after a holding period of seven years from the initial date of purchase.
2. Investments in Fidelity Central Funds.
The Fund invests in Fidelity Central Funds, which are open-end investment companies generally available only to other investment companies and accounts managed by Fidelity Management & Research Company (FMR) and its affiliates. The Fund's Schedule of Investments lists each of the Fidelity Central Funds held as of period end, if any, as an investment of the Fund, but does not include the underlying holdings of each Fidelity Central Fund. As an Investing Fund, the Fund indirectly bears its proportionate share of the expenses of the underlying Fidelity Central Funds.
The Money Market Central Funds seek preservation of capital and current income and are managed by Fidelity Investments Money Management, Inc. (FIMM), an affiliate of FMR.
A complete unaudited list of holdings for each Fidelity Central Fund is available upon request or at the Securities and Exchange Commission (the SEC) website at www.sec.gov. In addition, the financial statements of the Fidelity Central Funds, which are not covered by the Fund's Report of Independent Registered Public Accounting Firm, are available on the SEC website or upon request.
3. Significant Accounting Policies.
The financial statements have been prepared in conformity with accounting principles generally accepted in the United States of America (GAAP), which require management to make certain estimates and assumptions at the date of the financial statements. Actual results could differ from those estimates. Subsequent events, if any, through the date that the financial statements were issued have been evaluated in the preparation of
Annual Report
3. Significant Accounting Policies - continued
the financial statements. The following summarizes the significant accounting policies of the Fund:
Investment Valuation. Investments are valued as of 4:00 p.m. Eastern time on the last calendar day of the period. In accordance with valuation policies and procedures approved by the Board of Trustees (the Board), the Fund attempts to obtain prices from one or more third party pricing vendors or brokers to value its investments. When current market prices, quotations or currency exchange rates are not readily available or reliable, investments will be fair valued in good faith by the FMR Fair Value Committee (the Committee), in accordance with procedures adopted by the Board. Factors used in determining fair value vary by investment type and may include market or investment specific events, changes in interest rates and credit quality. The frequency with which these procedures are used cannot be predicted and they may be utilized to a significant extent. The Committee oversees the Fund's valuation policies and procedures and is responsible for approving and reporting to the Board all fair value determinations.
The Fund categorizes the inputs to valuation techniques used to value its investments into a disclosure hierarchy consisting of three levels as shown below:
Level 1 - quoted prices in active markets for identical investments
Level 2 - other significant observable inputs (including quoted prices for similar investments, interest rates, prepayment speeds, etc.)
Level 3 - unobservable inputs (including the Fund's own assumptions based on the best information available)
Valuation techniques used to value the Fund's investments by major category are as follows:
Equity securities, including restricted securities, for which market quotations are readily available, are valued at the last reported sale price or official closing price as reported by a third party pricing vendor on the primary market or exchange on which they are traded and are categorized as Level 1 in the hierarchy. In the event there were no sales during the day or closing prices are not available, securities are valued at the last quoted bid price or may be valued using the last available price and are generally categorized as Level 2 in the hierarchy. For foreign equity securities, when market or security specific events arise, comparisons to the valuation of American Depositary Receipts (ADRs), futures contracts, Exchange-Traded Funds (ETFs) and certain indexes as well as quoted prices for similar securities may be used and would be categorized as Level 2 in the hierarchy. Utilizing these techniques may result in transfers between Level 1 and Level 2. For equity securities, including restricted securities, where observable inputs are
Annual Report
Notes to Financial Statements - continued
(Amounts in thousands except percentages)
3. Significant Accounting Policies - continued
Investment Valuation - continued
limited, assumptions about market activity and risk are used and these securities may be categorized as Level 3 in the hierarchy.
Debt securities, including restricted securities, are valued based on evaluated prices received from third party pricing vendors or from brokers who make markets in such securities. For U.S. government and government agency obligations, pricing vendors utilize matrix pricing which considers yield or price of bonds of comparable quality, coupon, maturity and type as well as broker-supplied prices. When independent prices are unavailable or unreliable, debt securities may be valued utilizing pricing methodologies which consider similar factors that would be used by third party pricing vendors. Debt securities are generally categorized as Level 2 in the hierarchy but may be Level 3 depending on the circumstances.
Futures contracts are valued at the settlement price established each day by the board of trade or exchange on which they are traded and are categorized as Level 1 in the hierarchy. Investments in open-end mutual funds, including the Fidelity Central Funds, are valued at their closing net asset value (NAV) each business day and are categorized as Level 1 in the hierarchy.
Changes in valuation techniques may result in transfers in or out of an assigned level within the disclosure hierarchy. The aggregate value of investments by input level, as of October 31, 2013, including information on transfers between Levels 1 and 2, is included at the end of the Fund's Schedule of Investments.
Foreign Currency. The Fund may use foreign currency contracts to facilitate transactions in foreign-denominated securities. Gains and losses from these transactions may arise from changes in the value of the foreign currency or if the counterparties do not perform under the contracts' terms.
Foreign-denominated assets, including investment securities, and liabilities are translated into U.S. dollars at the exchange rates at period end. Purchases and sales of investment securities, income and dividends received and expenses denominated in foreign currencies are translated into U.S. dollars at the exchange rate in effect on the transaction date.
The effects of exchange rate fluctuations on investments are included with the net realized and unrealized gain (loss) on investment securities. Other foreign currency transactions resulting in realized and unrealized gain (loss) are disclosed separately.
Investment Transactions and Income. For financial reporting purposes, the Fund's investment holdings and NAV include trades executed through the end of the last business day of the period. The NAV per share for processing shareholder transactions is
Annual Report
3. Significant Accounting Policies - continued
Investment Transactions and Income - continued
calculated as of the close of business of the New York Stock Exchange (NYSE), normally 4:00 p.m. Eastern time and includes trades executed through the end of the prior business day. Gains and losses on securities sold are determined on the basis of identified cost. Dividend income is recorded on the ex-dividend date, except for certain dividends from foreign securities where the ex-dividend date may have passed, which are recorded as soon as the Fund is informed of the ex-dividend date. Non-cash dividends included in dividend income, if any, are recorded at the fair market value of the securities received. Distributions received on securities that represent a return of capital or capital gain are recorded as a reduction of cost of investments and/or as a realized gain. Subsequent to ex-dividend date the Fund determines the components of these distributions, based upon receipt of tax filings or other correspondence relating to the underlying investment. Interest income and distributions from the Fidelity Central Funds are accrued as earned. Interest income includes coupon interest and amortization of premium and accretion of discount on debt securities. Investment income is recorded net of foreign taxes withheld where recovery of such taxes is uncertain.
Class Allocations and Expenses. Investment income, realized and unrealized capital gains and losses, common expenses of the Fund, and certain fund-level expense reductions, if any, are allocated daily on a pro-rata basis to each class based on the relative net assets of each class to the total net assets of the Fund. Each class differs with respect to transfer agent and distribution and service plan fees incurred. Certain expense reductions may also differ by class. For the reporting period, the allocated portion of income and expenses to each class as a percent of its average net assets may vary due to the timing of recording these transactions in relation to fluctuating net assets of the classes. Expenses directly attributable to a fund are charged to that fund. Expenses attributable to more than one fund are allocated among the respective funds on the basis of relative net assets or other appropriate methods. Expense estimates are accrued in the period to which they relate and adjustments are made when actual amounts are known.
Deferred Trustee Compensation. Under a Deferred Compensation Plan (the Plan), independent Trustees may elect to defer receipt of a portion of their annual compensation. Deferred amounts are invested in a cross-section of Fidelity funds, are marked-to-market and remain in the Fund until distributed in accordance with the Plan. The investment of deferred amounts and the offsetting payable to the Trustees are included in the accompanying Statement of Assets and Liabilities.
Income Tax Information and Distributions to Shareholders. Each year, the Fund intends to qualify as a regulated investment company under Subchapter M of the Internal Revenue Code, including distributing substantially all of its taxable income and realized gains. As a result, no provision for U.S. Federal income taxes is required. As of
Annual Report
Notes to Financial Statements - continued
(Amounts in thousands except percentages)
3. Significant Accounting Policies - continued
Income Tax Information and Distributions to Shareholders - continued
October 31, 2013, the Fund did not have any unrecognized tax benefits in the financial statements; nor is the Fund aware of any tax positions for which it is reasonably possible that the total amounts of unrecognized tax benefits will significantly change in the next twelve months. The Fund files a U.S. federal tax return, in addition to state and local tax returns as required. The Fund's federal income tax returns are subject to examination by the Internal Revenue Service (IRS) for a period of three fiscal years after they are filed. State and local tax returns may be subject to examination for an additional fiscal year depending on the jurisdiction. Foreign taxes are provided for based on the Fund's understanding of the tax rules and rates that exist in the foreign markets in which it invests.
Distributions are declared and recorded on the ex-dividend date. Income dividends and capital gain distributions are declared separately for each class. Income and capital gain distributions are determined in accordance with income tax regulations, which may differ from GAAP.
Capital accounts within the financial statements are adjusted for permanent book-tax differences. These adjustments have no impact on net assets or the results of operations. Temporary book-tax differences will reverse in a subsequent period.
Book-tax differences are primarily due to futures contracts, foreign currency transactions, passive foreign investment companies (PFIC), market discount, deferred trustees compensation, capital loss carryforwards and losses deferred due to wash sales.
The federal tax cost of investment securities and unrealized appreciation (depreciation) as of period end were as follows:
Gross unrealized appreciation | $ 2,288,825 |
Gross unrealized depreciation | (128,376) |
Net unrealized appreciation (depreciation) on securities and other investments | $ 2,160,449 |
| |
Tax Cost | $ 9,169,453 |
The tax-based components of distributable earnings as of period end were as follows:
Undistributed ordinary income | $ 219,779 |
Capital loss carryforward | $ (950,903) |
Net unrealized appreciation (depreciation) | $ 2,159,295 |
Annual Report
3. Significant Accounting Policies - continued
Income Tax Information and Distributions to Shareholders - continued
Capital loss carryforwards are only available to offset future capital gains of the Fund to the extent provided by regulations and may be limited. Under the Regulated Investment Company Modernization Act of 2010 (the Act), the Fund is permitted to carry forward capital losses incurred in taxable years beginning after December 22, 2010 for an unlimited period and such capital losses are required to be used prior to any losses that expire. The capital loss carryforward information presented below, including any applicable limitation, is estimated as of fiscal period end and is subject to adjustment.
Fiscal year of expiration | |
2017 | $ (950,903) |
The tax character of distributions paid was as follows:
| October 31, 2013 | October 31, 2012 |
Ordinary Income | $ 154,444 | $ 118,968 |
Short-Term Trading (Redemption) Fees. Shares held by investors in the Fund less than 30 days may have been subject to a redemption fee equal to 1.00% of the net asset value of shares redeemed. All redemption fees, which reduce the proceeds of the shareholder redemption, are retained by the Fund and accounted for as an addition to paid in capital.
New Accounting Pronouncement. The Financial Accounting Standards Board issued in December 2011, Accounting Standard Update No. 2011-11, Disclosures about Offsetting Assets and Liabilities, and in January 2013, Accounting Standards Update No. 2013-1 Clarifying the Scope of Disclosures about Offsetting Assets and Liabilities. These updates create new disclosure requirements requiring entities to disclose both gross and net information for derivatives and other financial instruments that are either offset in the Statement of Assets and Liabilities or subject to an enforceable master netting arrangement or similar agreement. The disclosure requirements are effective for annual reporting periods beginning on or after January 1, 2013, and interim periods within those annual periods. Management expects that the impact of the updates' adoption will be limited to additional financial statement disclosures as applicable.
4. Derivative Instruments.
Risk Exposures and the Use of Derivative Instruments. The Fund's investment objective allows the Fund to enter into various types of derivative contracts, including futures contracts. Derivatives are investments whose value is primarily derived from underlying assets, indices or reference rates and may be transacted on an exchange or
Annual Report
Notes to Financial Statements - continued
(Amounts in thousands except percentages)
4. Derivative Instruments - continued
Risk Exposures and the Use of Derivative Instruments - continued
over-the-counter (OTC). Derivatives may involve a future commitment to buy or sell a specified asset based on specified terms, to exchange future cash flows at periodic intervals based on a notional principal amount, or for one party to make one or more payments upon the occurrence of specified events in exchange for periodic payments from the other party.
The Fund used derivatives to increase returns and to manage exposure to certain risks as defined below. The success of any strategy involving derivatives depends on analysis of numerous economic factors, and if the strategies for investment do not work as intended, the Fund may not achieve its objectives.
The Fund's use of derivatives increased or decreased its exposure to the following risk:
Equity Risk | Equity risk relates to the fluctuations in the value of financial instruments as a result of changes in market prices (other than those arising from interest rate risk or foreign exchange risk), whether caused by factors specific to an individual investment, its issuer, or all factors affecting all instruments traded in a market or market segment. |
The Fund is also exposed to additional risks from investing in derivatives, such as liquidity risk and counterparty credit risk. Liquidity risk is the risk that the Fund will be unable to close out the derivative in the open market in a timely manner. Counterparty credit risk is the risk that the counterparty will not be able to fulfill its obligation to the Fund. Counterparty credit risk related to exchange-traded futures contracts may be mitigated by the protection provided by the exchange on which they trade.
Investing in derivatives may involve greater risks than investing in the underlying assets directly and, to varying degrees, may involve risk of loss in excess of any initial investment and collateral received and amounts recognized in the Statement of Assets and Liabilities. In addition, there may be the risk that the change in value of the derivative contract does not correspond to the change in value of the underlying instrument.
Futures Contracts. A futures contract is an agreement between two parties to buy or sell a specified underlying instrument for a fixed price at a specified future date. The Fund used futures contracts to manage its exposure to the stock market.
Upon entering into a futures contract, a fund is required to deposit either cash or securities (initial margin) with a clearing broker in an amount equal to a certain percentage of the face value of the contract. Futures contracts are marked-to-market daily and subsequent daily payments (variation margin) are made or received by a fund depending on the daily fluctuations in the value of the futures contracts and are recorded as unrealized
Annual Report
4. Derivative Instruments - continued
Futures Contracts - continued
appreciation or (depreciation). This receivable and/or payable, if any, is included in daily variation margin for derivative instruments in the Statement of Assets and Liabilities. Realized gain or (loss) is recorded upon the expiration or closing of a futures contract.
Any open futures contracts at period end are presented in the Schedule of Investments under the caption "Futures Contracts." The underlying face amount at value reflects each contract's exposure to the underlying instrument or index at period end and is representative of activity for the period. Securities deposited to meet initial margin requirements are identified in the Schedule of Investments.
During the period the Fund recognized net realized gain (loss) of $51,368 and a change in net unrealized appreciation (depreciation) of $4,238 related to its investment in futures contracts. These amounts are included in the Statement of Operations.
5. Purchases and Sales of Investments.
Purchases and sales of securities, other than short-term securities, aggregated $6,591,378 and $5,993,057, respectively.
6. Fees and Other Transactions with Affiliates.
Management Fee. FMR and its affiliates provide the Fund with investment management related services for which the Fund pays a monthly management fee. The management fee is the sum of an individual fund fee rate that is based on an annual rate of .45% of the Fund's average net assets and an annualized group fee rate that averaged .25% during the period. The group fee rate is based upon the average net assets of all the mutual funds advised by FMR, including any mutual funds previously advised by FMR that are currently advised by Fidelity SelectCo, LLC, an affiliate of FMR. The group fee rate decreases as assets under management increase and increases as assets under management decrease. In addition, the management fee is subject to a performance adjustment (up to a maximum of ± .20% of the Fund's average net assets over a 36 month performance period). The upward or downward adjustment to the management fee is based on the relative investment performance of International Discovery as compared to an appropriate benchmark index over the same 36 month performance period. For the reporting period, the total annual management fee rate, including the performance adjustment, was .77% of the Fund's average net assets. The performance adjustment included in the management fee rate may be higher or lower than the maximum performance adjustment rate due to the difference between the average net assets for the reporting and performance periods.
Annual Report
Notes to Financial Statements - continued
(Amounts in thousands except percentages)
6. Fees and Other Transactions with Affiliates - continued
Distribution and Service Plan Fees. In accordance with Rule 12b-1 of the 1940 Act, the Fund has adopted separate Distribution and Service Plans for each class of shares. Certain classes pay Fidelity Distributors Corporation (FDC), an affiliate of FMR, separate Distribution and Service Fees, each of which is based on an annual percentage of each class' average net assets. In addition, FDC may pay financial intermediaries for selling shares of the Fund and providing shareholder support services. For the period, the Distribution and Service Fee rates, total fees and amounts retained by FDC were as follows:
| Distribution
Fee | Service
Fee | Total Fees | Retained
by FDC |
Class A | -% | .25% | $ 796 | $ 9 |
Class T | .25% | .25% | 243 | 2 |
Class B | .75% | .25% | 69 | 52 |
Class C | .75% | .25% | 324 | 25 |
| | | $ 1,432 | $ 88 |
Sales Load. FDC may receive a front-end sales charge of up to 5.75% for selling Class A shares and 3.50% for selling Class T shares, some of which is paid to financial intermediaries for selling shares of the Fund. Depending on the holding period, FDC may receive contingent deferred sales charges levied on Class A, Class T, Class B, and Class C redemptions. The deferred sales charges range from 5.00% to 1.00% for Class B shares, 1.00% for Class C shares, 1.00% for certain purchases of Class A shares and .25% for certain purchases of Class T shares.
For the period, sales charge amounts retained by FDC were as follows:
| Retained
by FDC |
Class A | $ 56 |
Class T | 5 |
Class B* | 9 |
Class C* | 2 |
| $ 72 |
* When Class B and Class C shares are initially sold, FDC pays commissions from its own resources to financial intermediaries through which the sales are made.
Transfer Agent Fees. Fidelity Investments Institutional Operations Company, Inc., (FIIOC), an affiliate of FMR, is the transfer, dividend disbursing and shareholder servicing agent for each class of the Fund. FIIOC receives account fees and asset-based fees that vary according to the account size and type of account of the shareholders of the respective classes of the Fund, except for Class Z. FIIOC receives an asset-based fee of
Annual Report
6. Fees and Other Transactions with Affiliates - continued
Transfer Agent Fees - continued
Class K's and Class Z's average net assets. FIIOC pays for typesetting, printing and mailing of shareholder reports, except proxy statements.
For the period, transfer agent fees for each applicable class were as follows:
| Amount | % of
Average
Net Assets |
Class A | $ 954 | .30 |
Class T | 141 | .29 |
Class B | 21 | .30 |
Class C | 96 | .29 |
International Discovery | 13,480 | .20 |
Class K | 1,069 | .05 |
Institutional Class | 713 | .19 |
Class Z | -* | .05** |
| $ 16,474 | |
* Amount represents eleven dollars.
** Annualized
Accounting and Security Lending Fees. Fidelity Service Company, Inc. (FSC), an affiliate of FMR, maintains the Fund's accounting records. The accounting fee is based on the level of average net assets for each month. Under a separate contract, FSC administers the security lending program. The security lending fee is based on the number and duration of lending transactions.
Brokerage Commissions. The Fund placed a portion of its portfolio transactions with brokerage firms which are affiliates of the investment adviser. Brokerage commissions are included in net realized gain (loss) and change in net unrealized appreciation (depreciation) in the Statement of Operations. The commissions paid to these affiliated firms were $4 for the period.
7. Committed Line of Credit.
The Fund participates with other funds managed by FMR or an affiliate in a $4.25 billion credit facility (the "line of credit") to be utilized for temporary or emergency purposes to fund shareholder redemptions or for other short-term liquidity purposes. The Fund has agreed to pay commitment fees on its pro-rata portion of the line of credit, which amounted to $20 and is reflected in Miscellaneous expenses on the Statement of Operations. During the period, there were no borrowings on this line of credit.
Annual Report
Notes to Financial Statements - continued
(Amounts in thousands except percentages)
8. Security Lending.
The Fund lends portfolio securities through a lending agent from time to time in order to earn additional income. For equity securities, a lending agent is used and may loan securities to certain qualified borrowers, including Fidelity Capital Markets (FCM), a broker-dealer affiliated with the Fund. On the settlement date of the loan, the Fund receives collateral (in the form of U.S. Treasury obligations, letters of credit and/or cash) against the loaned securities and maintains collateral in an amount not less than 100% of the market value of the loaned securities during the period of the loan. The market value of the loaned securities is determined at the close of business of the Fund and any additional required collateral is delivered to the Fund on the next business day. If the borrower defaults on its obligation to return the securities loaned because of insolvency or other reasons, the Fund may apply collateral received from the borrower against the obligation. The Fund may experience delays and costs in recovering the securities loaned. Any cash collateral received is invested in the Fidelity Securities Lending Cash Central Fund. The value of loaned securities and cash collateral at period end are disclosed on the Fund's Statement of Assets and Liabilities. At period end, there were no security loans outstanding with FCM. Security lending income represents the income earned on investing cash collateral, less rebates paid to borrowers and any lending agent fees associated with the loan, plus any premium payments received for lending certain types of securities. Security lending income is presented in the Statement of Operations as a component of income from Fidelity Central Funds. Total security lending income during the period amounted to $5,441, including $40 from securities loaned to FCM.
9. Expense Reductions.
FMR voluntarily agreed to reimburse a portion of the following class' operating expense.
During the period, this reimbursement reduced expenses as follows:
| Reimbursement |
International Discovery | $ 10 |
Class K | 3 |
Institutional Class | 1 |
| $ 14 |
Commissions paid to certain brokers with whom FMR, or its affiliates, places trades on behalf of the Fund include an amount in addition to trade execution, which may be rebated back to the Fund to offset certain expenses. This amount totaled $2,236 for the period.
In addition, FMR reimbursed a portion of the Fund's operating expenses during the period in the amount of $61.
Annual Report
10. Distributions to Shareholders.
Distributions to shareholders of each class were as follows:
Years ended October 31, | 2013 | 2012 |
From net investment income | | |
Class A | $ 4,138 | $ 3,123 |
Class T | 492 | 388 |
Class B | 34 | 6 |
Class C | 186 | 44 |
International Discovery | 101,466 | 90,633 |
Class K | 34,651 | 20,917 |
Institutional Class | 5,064 | 3,857 |
Total | $ 146,031 | $ 118,968 |
From net realized gain | | |
Class A | $ 297 | $ - |
Class T | 46 | - |
Class B | 7 | - |
Class C | 30 | - |
International Discovery | 5,914 | - |
Class K | 1,827 | - |
Institutional Class | 292 | - |
Total | $ 8,413 | $ - |
11. Share Transactions.
Transactions for each class of shares were as follows:
| Shares | Dollars |
Years ended October 31, | 2013 A | 2012 | 2013 A | 2012 |
Class A | | | | |
Shares sold | 1,772 | 1,927 | $ 62,186 | $ 56,732 |
Reinvestment of distributions | 132 | 101 | 4,249 | 2,828 |
Shares redeemed | (2,553) | (3,468) | (88,988) | (100,935) |
Net increase (decrease) | (649) | (1,440) | $ (22,553) | $ (41,375) |
Class T | | | | |
Shares sold | 227 | 220 | $ 7,911 | $ 6,409 |
Reinvestment of distributions | 16 | 13 | 512 | 369 |
Shares redeemed | (347) | (860) | (11,997) | (25,207) |
Net increase (decrease) | (104) | (627) | $ (3,574) | $ (18,429) |
Class B | | | | |
Shares sold | 4 | 3 | $ 137 | $ 87 |
Reinvestment of distributions | 1 | - | 39 | 5 |
Shares redeemed | (75) | (113) | (2,570) | (3,297) |
Net increase (decrease) | (70) | (110) | $ (2,394) | $ (3,205) |
Annual Report
Notes to Financial Statements - continued
(Amounts in thousands except percentages)
11. Share Transactions - continued
| Shares | Dollars |
Years ended October 31, | 2013 A | 2012 | 2013 A | 2012 |
Class C | | | | |
Shares sold | 184 | 212 | $ 6,532 | $ 6,111 |
Reinvestment of distributions | 6 | 1 | 193 | 39 |
Shares redeemed | (207) | (395) | (7,250) | (11,440) |
Net increase (decrease) | (17) | (182) | $ (525) | $ (5,290) |
International Discovery | | | | |
Shares sold | 37,338 | 20,324 | $ 1,332,523 | $ 608,478 |
Reinvestment of distributions | 3,176 | 3,081 | 102,608 | 86,858 |
Shares redeemed | (31,569) | (65,748) | (1,103,313) | (1,937,202) |
Net increase (decrease) | 8,945 | (42,343) | $ 331,818 | $ (1,241,866) |
Class K | | | | |
Shares sold | 19,989 | 26,836 | $ 699,723 | $ 788,860 |
Reinvestment of distributions | 1,132 | 744 | 36,478 | 20,917 |
Shares redeemed | (12,053) | (13,817) | (423,712) | (410,022) |
Net increase (decrease) | 9,068 | 13,763 | $ 312,489 | $ 399,755 |
Institutional Class | | | | |
Shares sold | 4,893 | 2,049 | $ 175,669 | $ 59,460 |
Reinvestment of distributions | 68 | 53 | 2,182 | 1,502 |
Shares redeemed | (2,219) | (2,256) | (78,500) | (65,914) |
Net increase (decrease) | 2,742 | (154) | $ 99,351 | $ (4,952) |
Class Z | | | | |
Shares sold | 3 | - | $ 100 | $ - |
Net increase (decrease) | 3 | - | $ 100 | $ - |
A Share transactions for Class Z are for the period August 13, 2013 (commencement of sale of shares) to October 31, 2013.
12. Other.
The Fund's organizational documents provide former and current trustees and officers with a limited indemnification against liabilities arising in connection with the performance of their duties to the Fund. In the normal course of business, the Fund may also enter into contracts that provide general indemnifications. The Fund's maximum exposure under these arrangements is unknown as this would be dependent on future claims that may be made against the Fund. The risk of material loss from such claims is considered remote.
At the end of the period, Strategic Advisers International Fund was the owner of record of approximately 11% of the total outstanding shares of the Fund.
Annual Report
To the Trustees of Fidelity Investment Trust and the Shareholders of Fidelity International Discovery Fund:
In our opinion, the accompanying statement of assets and liabilities, including the schedule of investments, and the related statements of operations and of changes in net assets and the financial highlights present fairly, in all material respects, the financial position of Fidelity International Discovery Fund (a fund of Fidelity Investment Trust) at October 31, 2013, the results of its operations for the year then ended, the changes in its net assets for each of the two years in the period then ended and the financial highlights for each of the periods indicated, in conformity with accounting principles generally accepted in the United States of America. These financial statements and financial highlights (hereafter referred to as "financial statements") are the responsibility of the Fidelity International Discovery Fund's management. Our responsibility is to express an opinion on these financial statements based on our audits. We conducted our audits of these financial statements in accordance with the standards of the Public Company Accounting Oversight Board (United States). Those standards require that we plan and perform the audit to obtain reasonable assurance about whether the financial statements are free of material misstatement. An audit includes examining, on a test basis, evidence supporting the amounts and disclosures in the financial statements, assessing the accounting principles used and significant estimates made by management, and evaluating the overall financial statement presentation. We believe that our audits, which included confirmation of securities at October 31, 2013 by correspondence with the custodian and brokers, provide a reasonable basis for our opinion.
PricewaterhouseCoopers LLP
Boston, Massachusetts
December 16, 2013
Annual Report
The Trustees, Member of the Advisory Board, and executive officers of the trust and fund, as applicable, are listed below. The Board of Trustees governs the fund and is responsible for protecting the interests of shareholders. The Trustees are experienced executives who meet periodically throughout the year to oversee the fund's activities, review contractual arrangements with companies that provide services to the fund, oversee management of the risks associated with such activities and contractual arrangements, and review the fund's performance. Except for James C. Curvey, Ned C. Lautenbach, Ronald P. O'Hanley, and William S. Stavropoulos, each of the Trustees oversees 171 funds. Mr. Curvey oversees 394 funds. Mr. Lautenbach, Mr. O'Hanley, and Mr. Stavropoulos each oversees 245 funds.
The Trustees hold office without limit in time except that (a) any Trustee may resign; (b) any Trustee may be removed by written instrument, signed by at least two-thirds of the number of Trustees prior to such removal; (c) any Trustee who requests to be retired or who has become incapacitated by illness or injury may be retired by written instrument signed by a majority of the other Trustees; and (d) any Trustee may be removed at any special meeting of shareholders by a two-thirds vote of the outstanding voting securities of the trust. Each Trustee who is not an interested person of the trust and the fund (as defined in the 1940 Act) (Independent Trustee), shall retire not later than the last day of the calendar year in which his or her 75th birthday occurs. The Independent Trustees may waive this mandatory retirement age policy with respect to individual Trustees. The executive officers and Advisory Board Member hold office without limit in time, except that any officer and Advisory Board Member may resign or may be removed by a vote of a majority of the Trustees at any regular meeting or any special meeting of the Trustees. Except as indicated, each individual has held the office shown or other offices in the same company for the past five years.
Experience, Skills, Attributes, and Qualifications of the Fund's Trustees. The Governance and Nominating Committee has adopted a statement of policy that describes the experience, qualifications, attributes, and skills that are necessary and desirable for potential Independent Trustee candidates (Statement of Policy). The Board believes that each Trustee satisfied at the time he or she was initially elected or appointed a Trustee, and continues to satisfy, the standards contemplated by the Statement of Policy. The Governance and Nominating Committee also engages professional search firms to help identify potential Independent Trustee candidates who have the experience, qualifications, attributes, and skills consistent with the Statement of Policy. From time to time, additional criteria based on the composition and skills of the current Independent Trustees, as well as experience or skills that may be appropriate in light of future changes to board composition, business conditions, and regulatory or other developments, have also been considered by the professional search firms and the Governance and Nominating Committee. In addition, the Board takes into account the Trustees' commitment and participation in Board and committee meetings, as well as their leadership of standing and ad hoc committees throughout their tenure.
Annual Report
In determining that a particular Trustee was and continues to be qualified to serve as a Trustee, the Board has considered a variety of criteria, none of which, in isolation, was controlling. The Board believes that, collectively, the Trustees have balanced and diverse experience, qualifications, attributes, and skills, which allow the Board to operate effectively in governing the fund and protecting the interests of shareholders. Information about the specific experience, skills, attributes, and qualifications of each Trustee, which in each case led to the Board's conclusion that the Trustee should serve (or continue to serve) as a trustee of the fund, is provided below.
Board Structure and Oversight Function. James C. Curvey is an interested person (as defined in the 1940 Act) and currently serves as Chairman. The Trustees have determined that an interested Chairman is appropriate and benefits shareholders because an interested Chairman has a personal and professional stake in the quality and continuity of services provided to the fund. Independent Trustees exercise their informed business judgment to appoint an individual of their choosing to serve as Chairman, regardless of whether the Trustee happens to be independent or a member of management. The Independent Trustees have determined that they can act independently and effectively without having an Independent Trustee serve as Chairman and that a key structural component for assuring that they are in a position to do so is for the Independent Trustees to constitute a substantial majority for the Board. The Independent Trustees also regularly meet in executive session. Ned C. Lautenbach serves as Chairman of the Independent Trustees and as such (i) acts as a liaison between the Independent Trustees and management with respect to matters important to the Independent Trustees and (ii) with management prepares agendas for Board meetings.
Fidelity funds are overseen by different Boards of Trustees. The fund's Board oversees Fidelity's equity and high income funds and another Board oversees Fidelity's investment-grade bond, money market, and asset allocation funds. The asset allocation funds may invest in Fidelity funds overseen by the fund's Board. The use of separate Boards, each with its own committee structure, allows the Trustees of each group of Fidelity funds to focus on the unique issues of the funds they oversee, including common research, investment, and operational issues. On occasion, the separate Boards establish joint committees to address issues of overlapping consequences for the Fidelity funds overseen by each Board.
The Trustees operate using a system of committees to facilitate the timely and efficient consideration of all matters of importance to the Trustees, the fund, and fund shareholders and to facilitate compliance with legal and regulatory requirements and oversight of the fund's activities and associated risks. The Board, acting through its committees, has charged FMR and its affiliates with (i) identifying events or circumstances the occurrence of which could have demonstrably adverse effects on the fund's business and/or reputation; (ii) implementing processes and controls to lessen the possibility that such events or circumstances occur or to mitigate the effects of such events or circumstances if they do occur; and (iii) creating and maintaining a system designed to evaluate continuously business and market conditions in order to facilitate the identification and implementation processes described in (i) and (ii) above. Because the day-to-day operations and activities of the fund are carried out by or through FMR, its affiliates and other service providers, the fund's exposure to risks is mitigated but not eliminated by the processes overseen by the Trustees. While each of the Board's committees has responsibility for overseeing different aspects of the fund's activities, oversight is exercised primarily through the Operations, Audit, and Compliance Committees. In addition, the Independent Trustees have worked with FMR to enhance the Board's oversight of investment and financial risks, legal and regulatory risks, technology risks, and operational risks, including the development of additional risk reporting to the Board. For example, a working group comprised of Independent Trustees and FMR has worked and continues to work to review the Fidelity funds' valuation-related activities, reporting and risk management. Appropriate personnel, including but not limited to the fund's Chief Compliance Officer (CCO), FMR's internal auditor, the independent accountants, the fund's Treasurer and portfolio management personnel, make periodic reports to the Board's committees, as appropriate, including an annual review of FMR's risk management program for the Fidelity funds. The responsibilities of each standing committee, including their oversight responsibilities, are described further under "Standing Committees of the Fund's Trustees."
Annual Report
Trustees and Officers - continued
The fund's Statement of Additional Information (SAI) includes more information about the Trustees. To request a free copy, call Fidelity at 1-800-544-8544.
Interested Trustees*:
Correspondence intended for each Trustee who is an interested person may be sent to Fidelity Investments, 245 Summer Street, Boston, Massachusetts 02210.
Name, Year of Birth; Principal Occupations and Other Relevant Experience+ |
James C. Curvey (1935) |
Year of Election or Appointment: 2007 Trustee Chairman of the Board of Trustees |
| Mr. Curvey also serves as Trustee of other Fidelity funds. Mr. Curvey is a Director of Fidelity Investments Money Management, Inc. (2009-present), Director of Fidelity Research & Analysis Co. (2009-present) and Director of FMR and FMR Co., Inc. (2007-present). Mr. Curvey is also Vice Chairman (2007-present) and Director of FMR LLC. In addition, Mr. Curvey serves as an Overseer for the Boston Symphony Orchestra and a member of the Trustees of Villanova University. Previously, Mr. Curvey was the Vice Chairman (2006-2007) and Director (2000-2007) of FMR Corp. |
Ronald P. O'Hanley (1957) |
Year of Election or Appointment: 2011 Trustee |
| Mr. O'Hanley also serves as Trustee of other Fidelity funds. He is Director of Fidelity SelectCo, LLC (2013-present), FMR Co., Inc. (2010-present), Director of Fidelity Investments Money Management, Inc. (2010-present), Director of Fidelity Research & Analysis Company (2010-present), President of Fidelity Asset Management and Corporate Services and a Member of Fidelity's Executive Committee (2010-present). Previously, Mr. O'Hanley served as President and Chief Executive Officer of BNY Mellon Asset Management (2007-2010). Mr. O'Hanley also served as Vice Chairman of Bank New York Mellon Corp. and a member of that firm's Executive Committee. Prior to the 2007 merger of The Bank of New York and Mellon Financial Corporation, he was Vice Chairman of Mellon Financial Corporation and President and Chief Executive Officer of Mellon Asset Management. He joined Mellon in February 1997. Mr. O'Hanley currently serves as Chairman of the Boston Public Library Foundation Board of Directors and sits on the Board of Directors of Beth Israel Deaconess Medical Center, the Board of Trustees of the Marine Biological Laboratory and the Advisory Board of the Maxwell School of Citizenship and Public Administration at Syracuse University. Mr. O'Hanley also chairs the Council on Asset Management for the Financial Services Roundtable and is a member of the Board of Directors of Institutional Investor's U.S. Institute. |
* Trustees have been determined to be "Interested Trustees" by virtue of, among other things, their affiliation with the trust or various entities under common control with FMR.
+ The information above includes each Trustee's principal occupation during the last five years and other information relating to the experience, attributes, and skills relevant to each Trustee's qualifications to serve as a Trustee, which led to the conclusion that each Trustee should serve as a Trustee for the fund.
Annual Report
Trustees and Officers - continued
Independent Trustees:
Correspondence intended for each Independent Trustee (that is, the Trustees other than the Interested Trustees) may be sent to Fidelity Investments, P.O. Box 55235, Boston, Massachusetts 02205-5235.
Name, Year of Birth; Principal Occupations and Other Relevant Experience+ |
Dennis J. Dirks (1948) |
Year of Election or Appointment: 2005 Trustee |
| Mr. Dirks also serves as Trustee of other Fidelity funds. Prior to his retirement in May 2003, Mr. Dirks was Chief Operating Officer and a member of the Board of The Depository Trust & Clearing Corporation (DTCC). He also served as President, Chief Operating Officer, and Board member of The Depository Trust Company (DTC) and President and Board member of the National Securities Clearing Corporation (NSCC). In addition, Mr. Dirks served as Chief Executive Officer and Board member of the Government Securities Clearing Corporation, Chief Executive Officer and Board member of the Mortgage-Backed Securities Clearing Corporation, as a Trustee and a member of the Finance Committee of Manhattan College (2005-2008), and as a Trustee and a member of the Finance Committee of AHRC of Nassau County (2006-2008). Mr. Dirks is a member of the Independent Directors Council (IDC) Governing Council (2010-present) and Board of Directors for The Brookville Center for Children's Services, Inc. (2009-present). |
Alan J. Lacy (1953) |
Year of Election or Appointment: 2008 Trustee |
| Mr. Lacy also serves as Trustee of other Fidelity funds. Mr. Lacy serves as Senior Adviser (2007-present) of Oak Hill Capital Partners, L.P. (private equity). Mr. Lacy also served as Chief Executive Officer (2000-2005) and Vice Chairman (2005-2006) of Sears Holdings Corporation and Sears, Roebuck and Co. (retail). In addition, Mr. Lacy serves as a member of the Board of Directors of Dave & Buster's Entertainment, Inc. (restaurant and entertainment complexes, 2010-present), Earth Fare, Inc. (retail grocery, 2012-present), The Hillman Companies, Inc. (hardware wholesalers, 2010-present), and Bristol-Myers Squibb Company (global pharmaceuticals, 2008-present). Mr. Lacy is a member of the Board of Trustees of The National Parks Conservation Association (2006-present). Previously, Mr. Lacy served as Chairman of the Board of Trustees of the National Parks Conservation Association (2008-2011) and as a member of the Board of Directors for the Western Union Company (global money transfer, 2006-2011). |
Ned C. Lautenbach (1944) |
Year of Election or Appointment: 2000 Trustee Chairman of the Independent Trustees |
| Mr. Lautenbach also serves as Trustee of other Fidelity funds. Mr. Lautenbach currently serves as the Lead Director of the Eaton Corporation Board of Directors (diversified industrial, 1997-present). Mr. Lautenbach is Chairman of the Board of Directors of the Philharmonic Center for the Arts in Naples, Florida (2012-present) and a member of the Council on Foreign Relations (1994-present). Previously, Mr. Lautenbach was a Partner/Advisory Partner at Clayton, Dubilier & Rice, LLC (private equity investment, 1998-2010), as well as a Director of Sony Corporation (2006-2007). |
Joseph Mauriello (1944) |
Year of Election or Appointment: 2008 Trustee |
| Mr. Mauriello also serves as Trustee of other Fidelity funds. Prior to his retirement in January 2006, Mr. Mauriello served in numerous senior management positions including Deputy Chairman and Chief Operating Officer (2004-2005), and Vice Chairman of Financial Services (2002-2004) of KPMG LLP US (professional services, 1965-2005). Mr. Mauriello currently serves as a member of the Board of Directors of XL Group plc. (global insurance and re-insurance, 2006-present). Previously, Mr. Mauriello served as a Director of the Hamilton Funds of the Bank of New York (2006-2007) and of Arcadia Resources Inc. (health care services and products, 2007-2012). |
Robert W. Selander (1950) |
Year of Election or Appointment: 2011 Trustee |
| Mr. Selander also serves as Trustee of other Fidelity funds. Previously, Mr. Selander served as a Member of the Advisory Board of other Fidelity funds (2011), and Executive Vice Chairman (2010), Chief Executive Officer (2009-2010), and President and Chief Executive Officer (1997-2009) of Mastercard, Inc. |
Cornelia M. Small (1944) |
Year of Election or Appointment: 2005 Trustee |
| Ms. Small also serves as Trustee of other Fidelity funds. Ms. Small is a member of the Board of Directors (2009-present) and Chair of the Investment Committee (2010-present) of the Teagle Foundation. Ms. Small also serves on the Investment Committee of the Berkshire Taconic Community Foundation (2008-present). Previously, Ms. Small served as Chairperson (2002-2008) and a member of the Investment Committee and Chairperson (2008-2012) and a member of the Board of Trustees of Smith College. In addition, Ms. Small served as Chief Investment Officer, Director of Global Equity Investments, and a member of the Board of Directors of Scudder, Stevens & Clark and Scudder Kemper Investments. |
William S. Stavropoulos (1939) |
Year of Election or Appointment: 2001 Trustee Vice Chairman of the Independent Trustees |
| Mr. Stavropoulos also serves as Trustee of other Fidelity funds. Mr. Stavropoulos serves as President and Founder of the Michigan Baseball Foundation, the Great Lakes Loons (2007-present). Mr. Stavropoulos is Chairman Emeritus of the Board of Directors of The Dow Chemical Company, where he previously served in numerous senior management positions, including President, CEO (1995-2000; 2002-2004), Chairman of the Executive Committee (2000-2006), and as a member of the Board of Directors (1990-2006). Currently, Mr. Stavropoulos is Chairman of the Board of Directors of Univar Inc. (global distributor of commodity and specialty chemicals), a Director of Teradata Corporation (data warehousing and technology solutions), and Maersk Inc. (industrial conglomerate), and a member of the Advisory Board for Metalmark Capital LLC (private equity investment, 2005-present). Mr. Stavropoulos is an operating advisor to Clayton, Dubilier & Rice, LLC (private equity investment). In addition, Mr. Stavropoulos is a member of the University of Notre Dame Advisory Council for the College of Science, a Trustee of the Rollin L. Gerstacker Foundation, and a Director of the Naples Philharmonic Center for the Arts. Previously, Mr. Stavropoulos served as a Director of Chemical Financial Corporation (bank holding company, 1993-2012) and Tyco International, Ltd. (multinational manufacturing and services, 2007-2012). |
David M. Thomas (1949) |
Year of Election or Appointment: 2008 Trustee |
| Mr. Thomas also serves as Trustee of other Fidelity funds. Mr. Thomas serves as Non-Executive Chairman of the Board of Directors of Fortune Brands Home and Security (home and security products, 2011-present), and as a member of the Board of Directors of Interpublic Group of Companies, Inc. (marketing communication, 2004-present). Previously, Mr. Thomas served as Executive Chairman (2005-2006) and Chairman and Chief Executive Officer (2000-2005) of IMS Health, Inc. (pharmaceutical and healthcare information solutions), and a Director of Fortune Brands, Inc. (consumer products, 2000-2011). |
+ The information above includes each Trustee's principal occupation during the last five years and other information relating to the experience, attributes, and skills relevant to each Trustee's qualifications to serve as a Trustee, which led to the conclusion that each Trustee should serve as a Trustee for the fund.
Advisory Board Member and Executive Officers:
Correspondence intended for each executive officer and Peter S. Lynch may be sent to Fidelity Investments, 245 Summer Street, Boston, Massachusetts 02210. Executive officers appear below in alphabetical order.
Name, Year of Birth; Principal Occupation |
Peter S. Lynch (1944) |
Year of Election or Appointment: 2003 Member of the Advisory Board |
| Mr. Lynch also serves as Member of the Advisory Board of other Fidelity funds. Mr. Lynch is Vice Chairman and a Director of FMR and FMR Co., Inc. In addition, Mr. Lynch serves as a Trustee of Boston College and as the Chairman of the Inner-City Scholarship Fund. Previously, Mr. Lynch served on the Special Olympics International Board of Directors (1997-2006). |
Elizabeth Paige Baumann (1968) |
Year of Election or Appointment: 2012 Anti-Money Laundering (AML) Officer |
| Ms. Baumann also serves as AML Officer of other funds. She is Chief AML Officer of FMR LLC (2012-present) and is an employee of Fidelity Investments. Previously, Ms. Baumann served as Vice President and Deputy Anti-Money Laundering Officer (2007-2012). |
William C. Coffey (1969) |
Year of Election or Appointment: 2009 Assistant Secretary |
| Mr. Coffey also serves as Assistant Secretary of other funds. He is Senior Vice President and Deputy General Counsel of FMR LLC (2010-present), and is an employee of Fidelity Investments. Previously, Mr. Coffey served as Vice President and Associate General Counsel of FMR LLC (2005-2009). |
Jonathan Davis (1968) |
Year of Election or Appointment: 2010 Assistant Treasurer |
| Mr. Davis also serves as Assistant Treasurer of other funds. Mr. Davis is an employee of Fidelity Investments. Previously, Mr. Davis served as Vice President and Associate General Counsel of FMR LLC (2003-2010). |
Adrien E. Deberghes (1967) |
Year of Election or Appointment: 2008 Deputy Treasurer |
| Mr. Deberghes also serves as an officer of other funds. He is an employee of Fidelity Investments (2008-present). Prior to joining Fidelity Investments, Mr. Deberghes was Senior Vice President of Mutual Fund Administration at State Street Corporation (2007-2008), Senior Director of Mutual Fund Administration at Investors Bank & Trust (2005-2007), and Director of Finance for Dunkin' Brands (2000-2005). |
Stephanie J. Dorsey (1969) |
Year of Election or Appointment: 2010 Assistant Treasurer |
| Ms. Dorsey also serves as an officer of other funds. She is an employee of Fidelity Investments (2008-present) and has served in other fund officer roles. Prior to joining Fidelity Investments, Ms. Dorsey served as Treasurer (2004-2008) of the JPMorgan Mutual Funds and Vice President (2004-2008) of JPMorgan Chase Bank. |
Scott C. Goebel (1968) |
Year of Election or Appointment: 2008 Secretary and Chief Legal Officer (CLO) |
| Mr. Goebel serves as Secretary and CLO of other funds. Mr. Goebel also serves as Secretary of Fidelity Investments Money Management, Inc. (FIMM) (2010-present) and Fidelity Research and Analysis Company (FRAC) (2010-present); General Counsel, Secretary, and Senior Vice President of FMR (2008-present) and FMR Co., Inc. (2008-present); Chief Legal Officer of Fidelity Management & Research (Hong Kong) Limited (2008-present) and Assistant Secretary of Fidelity Management & Research (Japan) Inc. (2008-present), and Fidelity Management & Research (U.K.) Inc. (2008-present). Previously, Mr. Goebel served as Secretary and CLO of other Fidelity funds (2008-2013), Assistant Secretary of FIMM (2008-2010), FRAC (2008-2010), and certain funds (2007-2008); and as Vice President and Secretary of Fidelity Distributors Corporation (FDC) (2005-2007). Mr. Goebel has been employed by FMR LLC or an affiliate since 2001. |
Joseph A. Hanlon (1968) |
Year of Election or Appointment: 2012 Chief Compliance Officer |
| Mr. Hanlon also serves as Chief Compliance Officer of other funds. Mr. Hanlon serves as Compliance Officer of FMR, FMR Co., Inc., Fidelity Investments Money Management, Inc. (FIMM), Fidelity Research and Analysis Company (FRAC), and Fidelity Management & Research (Hong Kong) (2009-present), as Senior Vice President of the Fidelity Asset Management Division (2009-present), and is an employee of Fidelity Investments. Previously, Mr. Hanlon served as Compliance Officer of Fidelity Management & Research (Japan) Inc. (2009-2013), Strategic Advisers, Inc. (2009-2013), and Fidelity Management & Research (U.K.) Inc. (2009-2013). |
Bruce T. Herring (1965) |
Year of Election or Appointment: 2006 Vice President of certain Equity Funds |
| Mr. Herring also serves as Vice President of other funds. He serves as Chief Investment Officer of Fidelity Global Asset Allocation (GAA) (2013-present), Chief Investment Officer and Director of Fidelity Management & Research (U.K.) Inc. (2010-present), Group Chief Investment Officer of FMR, and President of Fidelity Research & Analysis Company (2010-present). Previously, Mr. Herring served as Vice President (2005-2006) and Senior Vice President (2006-2007) of Fidelity Management & Research Company, Vice President of FMR Co., Inc. (2001-2007), and as a portfolio manager for Fidelity U.S. Equity Funds. |
Brian B. Hogan (1964) |
Year of Election or Appointment: 2009 Vice President |
| Mr. Hogan also serves as Vice President of other funds. Mr. Hogan serves as President of FMR's Equity Division (2009-present). Previously, Mr. Hogan served as Senior Vice President, Equity Research of FMR (2006-2009) and as a portfolio manager. |
Chris Maher (1972) |
Year of Election or Appointment: 2013 Assistant Treasurer |
| Mr. Maher serves as Assistant Treasurer of other funds. Mr. Maher is Vice President of Valuation Oversight and is an employee of Fidelity Investments. Previously, Mr. Maher served as Vice President of Asset Management Compliance (2013), Vice President of FMR's Program Management Group (2010-2013), and Vice President of Valuation Oversight (2008-2010). |
Christine Reynolds (1958) |
Year of Election or Appointment: 2008 Chief Financial Officer |
| Ms. Reynolds also serves as Chief Financial Officer of other funds. Ms. Reynolds became President of Fidelity Pricing and Cash Management Services (FPCMS) in August 2008. Ms. Reynolds served as Chief Operating Officer of FPCMS (2007-2008). Previously, Ms. Reynolds served as President, Treasurer, and Anti-Money Laundering officer of the Fidelity funds (2004-2007). |
Kenneth B. Robins (1969) |
Year of Election or Appointment: 2008 President and Treasurer |
| Mr. Robins also serves as an officer of other funds. Mr. Robins serves as Executive Vice President of Fidelity Investments Money Management, Inc. (FIMM) (2013-present) and is an employee of Fidelity Investments (2004-present). Previously, Mr. Robins served in other fund officer roles. |
Gary W. Ryan (1958) |
Year of Election or Appointment: 2005 Assistant Treasurer |
| Mr. Ryan also serves as Assistant Treasurer of other funds. Mr. Ryan is an employee of Fidelity Investments and has served in other fund officer roles. Previously, Mr. Ryan served as Vice President of Fund Reporting in Fidelity Pricing and Cash Management Services (FPCMS) (1999-2005). |
Stephen Sadoski (1971) |
Year of Election or Appointment: 2012 Deputy Treasurer |
| Mr. Sadoski also serves as Deputy Treasurer of other funds. He is an employee of Fidelity Investments (2012-present) and has served in another fund officer role. Prior to joining Fidelity Investments, Mr. Sadoski served as an assistant chief accountant in the Division of Investment Management of the Securities and Exchange Commission (SEC) (2009-2012) and as a senior manager at Deloitte & Touche LLP (1997-2009). |
Stacie M. Smith (1974) |
Year of Election or Appointment: 2013 Deputy Treasurer |
| Ms. Smith also serves as an officer of other funds. She is an employee of Fidelity Investments (2009-present) and has served in other fund officer roles. Prior to joining Fidelity Investments, Ms. Smith served as Senior Audit Manager of Ernst & Young LLP (1996-2009). |
Renee Stagnone (1975) |
Year of Election or Appointment: 2013 Deputy Treasurer |
| Ms. Stagnone also serves as Deputy Treasurer of other funds. Ms. Stagnone is an employee of Fidelity Investments. |
Joseph F. Zambello (1957) |
Year of Election or Appointment: 2011 Deputy Treasurer |
| Mr. Zambello also serves as Deputy Treasurer of other funds. Mr. Zambello is an employee of Fidelity Investments. Previously, Mr. Zambello served as Vice President of FMR's Program Management Group (2009-2011) and Vice President of the Transfer Agent Oversight Group (2005-2009). |
Annual Report
The Board of Trustees of Fidelity Advisor International Discovery Fund voted to pay to shareholders of record at the opening of business on record date, the following distributions per share derived from capital gains realized from sales of portfolio securities, and dividends derived from net investment income:
| Pay Date | Record Date | Dividends | Capital Gains |
International Discovery | 12/09/13 | 12/06/13 | $0.473 | $0.311 |
International Discovery Fund designates 1% of the dividends distributed during the fiscal year as qualifying for the dividends-received deduction for corporate shareholders.
International Discovery Fund designates 100% of the dividends during the fiscal year as amounts which may be taken into account as a dividend for the purposes of the maximum rate under section 1(h)(11) of the Internal Revenue Code.
The amounts per share which represent income derived from sources within, and taxes paid to, foreign countries or possessions of the United States are as follows:
| Pay Date | Income | Taxes |
International Discovery Fund | 12/10/12 | $0.506 | $0.0260 |
The fund will notify shareholders in January 2014 of amounts for use in preparing 2013 income tax returns.
Annual Report
Board Approval of Investment Advisory Contracts and Management Fees
Fidelity International Discovery Fund
Each year, the Board of Trustees, including the Independent Trustees (together, the Board), votes on the renewal of the management contract and sub-advisory agreements (together, the Advisory Contracts) for the fund. The Board, assisted by the advice of fund counsel and Independent Trustees' counsel, requests and considers a broad range of information relevant to the renewal of the Advisory Contracts throughout the year.
The Board meets regularly and, at each of its meetings, covers an extensive agenda of topics and materials and considers factors that are relevant to its annual consideration of the renewal of the fund's Advisory Contracts, including the services and support provided to the fund and its shareholders. The Board has established various standing committees, each composed of and chaired by Independent Trustees with varying backgrounds, to which the Board has assigned specific subject matter responsibilities in order to enhance effective decision-making by the Board. The Board, acting directly and through its Committees, requests and receives information concerning the annual consideration of the renewal of the fund's Advisory Contracts. The Board also meets as needed to consider matters specifically related to the Board's annual consideration of the renewal of Advisory Contracts. Members of the Board may also meet with trustees of other Fidelity funds through ad hoc joint committees to discuss certain matters relevant to the Fidelity funds.
At its July 2013 meeting, the Board, including the Independent Trustees, unanimously determined to renew the fund's Advisory Contracts. In reaching its determination, the Board considered all factors it believed relevant, including (i) the nature, extent, and quality of the services to be provided to the fund and its shareholders (including the investment performance of the fund); (ii) the competitiveness of the fund's management fee and total expense ratio relative to peer funds; (iii) the total costs of the services to be provided by and the profits to be realized by Fidelity from its relationship with the fund; (iv) the extent to which economies of scale exist and would be realized as the fund grows; and (v) whether fee levels reflect these economies of scale, if any, for the benefit of fund shareholders.
In considering whether to renew the Advisory Contracts for the fund, the Board reached a determination, with the assistance of fund counsel and Independent Trustees' counsel and through the exercise of its business judgment, that the renewal of the Advisory Contracts was in the best interests of the fund and its shareholders and that the compensation payable under the Advisory Contracts was fair and reasonable. The Board's decision to renew the Advisory Contracts was not based on any single factor, but rather was based on a comprehensive consideration of all the information provided to the Board at its meetings throughout the year. The Board, in reaching its determination to renew the Advisory Contracts, was aware that shareholders in the fund have a broad range of investment choices available to them, including a wide choice among mutual funds offered by Fidelity's competitors, and that the fund's shareholders, who have the opportunity to review and weigh the disclosure provided by the fund in its prospectus and other public disclosures, have chosen to invest in this fund, which is a part of the Fidelity family of funds.
Annual Report
Board Approval of Investment Advisory Contracts and
Management Fees - continued
Nature, Extent, and Quality of Services Provided. The Board considered the staffing within the investment adviser, Fidelity Management & Research Company (FMR), and the sub-advisers (together, the Investment Advisers) as it relates to the fund, including the backgrounds of the fund's investment personnel, and also considered the fund's investment objective, strategies, and related investment philosophy. The Independent Trustees also had discussions with senior management of Fidelity's investment operations and investment groups. The Board considered the structure of the portfolio manager compensation program and whether this structure provides appropriate incentives to act in the best interests of the fund.
Resources Dedicated to Investment Management and Support Services. The Board and the Fund Oversight and Research Committees reviewed the general qualifications and capabilities of the Investment Advisers' investment staff, including its size, education, experience, and resources, as well as the Investment Advisers' approach to recruiting, training, managing, and compensating investment personnel. The Board noted that FMR has continued to increase the resources devoted to non-U.S. offices, including expansion of Fidelity's global investment organization. The Board also noted that Fidelity's analysts have extensive resources, tools and capabilities that allow them to conduct sophisticated quantitative and fundamental analysis, as well as credit analysis of issuers, counterparties and guarantors. Further, the Board believes that Fidelity's investment professionals have sufficient access to global information and data so as to provide competitive investment results over time, and that those professionals also have access to sophisticated tools that permit them to assess portfolio construction and risk and performance attribution characteristics continuously, as well as to transmit new information and research conclusions rapidly around the world. Additionally, in its deliberations, the Board considered the Investment Advisers' trading and risk management capabilities and resources, which are an integral part of the investment management process.
Shareholder and Administrative Services. The Board considered (i) the nature, extent, quality, and cost of advisory, administrative, and shareholder services performed by the Investment Advisers and their affiliates under the Advisory Contracts and under separate agreements covering transfer agency, pricing and bookkeeping, and securities lending services for the fund; (ii) the nature and extent of the supervision of third party service providers, principally custodians and subcustodians; and (iii) the resources devoted to, and the record of compliance with, the fund's compliance policies and procedures. The Board also reviewed the allocation of fund brokerage, including allocations to brokers affiliated with the Investment Advisers, the use of brokerage commissions to pay fund expenses, and the use of "soft" commission dollars to pay for research services.
Annual Report
The Board noted that the growth of fund assets over time across the complex allows Fidelity to reinvest in the development of services designed to enhance the value or convenience of the Fidelity funds as investment vehicles. These services include 24-hour access to account information and market information through telephone representatives and over the Internet, investor education materials and asset allocation tools, and the expanded availability of Fidelity Investor Centers.
Investment in a Large Fund Family. The Board considered the benefits to shareholders of investing in a Fidelity fund, including the benefits of investing in a fund that is part of a large family of funds offering a variety of investment disciplines and providing a large variety of mutual fund investor services. The Board noted that Fidelity had taken, or had made recommendations that resulted in the Fidelity funds taking, a number of actions over the previous year that benefited particular funds, including (i) continuing to dedicate additional resources to investment research and to the support of the senior management team that oversees asset management; (ii) persisting in efforts to enhance Fidelity's global research capabilities; (iii) launching new funds and making other enhancements to meet client needs for global and income-oriented solutions; (iv) continuing to launch dedicated lower cost underlying funds to meet portfolio construction needs related to expanding underlying fund options for Fidelity funds of funds, specifically for the Freedom Fund product lines; (v) rationalizing product lines and gaining increased efficiencies through the mergers of several funds into other funds; (vi) strengthening Fidelity's index fund offerings by reducing investment minimums and adopting or lowering existing expense caps for certain funds and classes; (vii) enhancing Global Asset Allocation product offerings by launching new funds and strategies, including "open architecture" target date funds that utilize affiliated and unaffiliated sub-advisers; (viii) modifying the eligibility criteria for Institutional Class shares of Advisor funds to increase their marketability to a portion of the defined contribution plan market; (ix) creating a new low-cost retirement share class for certain Advisor funds to appeal to large retirement plans; (x) transitioning the management of certain Fidelity commodity funds to Geode Capital Management LLC, a registered commodity pool operator, while retaining administrative responsibilities for the funds; (xi) reorganizing a number of funds; and (xii) taking steps toward establishing a new Fidelity adviser to manage sector-based funds and products.
Investment Performance. The Board considered whether the fund has operated in accordance with its investment objective, as well as its record of compliance with its investment restrictions and its performance history.
The Board took into account discussions with the Investment Advisers about fund investment performance that occur at Board meetings throughout the year. In this regard the Board noted that as part of regularly scheduled fund reviews and other reports to the Board on fund performance, the Board periodically considers annualized return information for the fund, for different time periods, measured against a securities market index ("benchmark index") and a peer group of mutual funds with similar objectives ("peer group"). In its evaluation of fund investment performance, the Board gave particular attention to information indicating changes in performance of certain Fidelity funds for specific time periods and the Investment Advisers' explanations for any overperformance or underperformance.
Annual Report
Board Approval of Investment Advisory Contracts and
Management Fees - continued
In addition to reviewing absolute and relative fund performance, the Independent Trustees periodically consider the appropriateness of fund performance metrics in evaluating the results achieved. In general, the Independent Trustees believe that fund performance should be evaluated based on net performance (after fees and expenses) of both the highest performing and lowest performing classes, where applicable, compared to appropriate benchmark indices, over appropriate time periods which may include full market cycles, and compared to peer groups, as applicable, over the same periods, taking into account relevant factors including the following: general market conditions; issuer-specific information; tactical opportunities for investment; and fund cash flows and other factors.
The Independent Trustees recognize that shareholders evaluate performance on a net basis over their own holding periods, for which one-, three-, and five-year periods are used as a proxy. For this reason, the performance information reviewed by the Board also included net cumulative calendar year total return information for the fund and an appropriate benchmark index and peer group for the most recent one-, three-, and five-year periods, as shown below. Returns are shown compared to the 25th percentile (top of box) and 75th percentile (bottom of box) of the peer universe. Returns of the benchmark index are "net MA," i.e., adjusted for tax withholding rates applicable to U.S.-based mutual funds organized as Massachusetts business trusts.
Annual Report
Fidelity International Discovery Fund

The Board also considered that the fund's management fee is subject to upward or downward adjustment depending upon whether, and to what extent, the fund's investment performance for the performance period exceeds, or is exceeded by, a securities index, thus leading to a performance adjustment for the same period. The Board noted that the performance adjustment provides FMR with a strong economic incentive to seek to achieve superior performance for the fund's shareholders and helps to more closely align the interests of FMR and the fund's shareholders.
Based on its review, the Board concluded that the nature, extent, and quality of services provided to the fund under the Advisory Contracts should benefit the fund's shareholders.
Competitiveness of Management Fee and Total Expense Ratio. The Board considered the fund's management fee and total expense ratio compared to "mapped groups" of competitive funds and classes. Fidelity creates "mapped groups" by combining similar Lipper investment objective categories that have comparable management fee characteristics. Combining Lipper investment objective categories aids the Board's management fee and total expense ratio comparisons by broadening the competitive group used for comparison and by reducing the number of universes to which various Fidelity funds are compared.
Management Fee. The Board considered two proprietary management fee comparisons for the 12-month periods shown in the chart below. The group of Lipper funds used by the Board for management fee comparisons is referred to below as the "Total Mapped Group." The Total Mapped Group comparison focuses on a fund's standing in terms of gross management fees before expense reimbursements or caps, and without giving effect to the fund's performance adjustment, relative to the total universe of funds with comparable investment mandates, regardless of whether their management fee structures also are comparable. Funds with comparable investment mandates offer exposure to similar types of securities. Funds with comparable management fee structures have similar management fee contractual arrangements (e.g., flat rate charged for advisory services, all-inclusive fee rate, etc.). "TMG %" represents the percentage of funds in the Total Mapped Group that had management fees that were lower than the fund's. For example, a TMG % of 16% means that 84% of the funds in the Total Mapped Group had higher management fees than the fund. The "Asset-Size Peer Group" (ASPG) comparison focuses on a fund's standing relative to a subset of non-Fidelity funds within the Total Mapped Group that are similar in size and management fee structure. The ASPG represents at least 15% of the funds in the Total Mapped Group with comparable asset size and management fee structures, subject to a minimum of 50 funds (or all funds in the Total Mapped Group if fewer than 50). Additional information, such as the ASPG quartile in which the fund's management fee ranked and the impact of the fund's performance adjustment, is also included in the chart and considered by the Board.
Annual Report
Board Approval of Investment Advisory Contracts and
Management Fees - continued
Fidelity International Discovery Fund

The Board noted that the fund's management fee ranked below the median of its Total Mapped Group and below the median of its ASPG for 2012. The Board also noted the effect of the fund's positive performance adjustment on the fund's management fee ranking.
Annual Report
Based on its review, the Board concluded that the fund's management fee is fair and reasonable in light of the services that the fund receives and the other factors considered.
Total Expense Ratio. In its review of each class's total expense ratio, the Board considered the fund's management fee as well as other fund or class expenses, as applicable, such as transfer agent fees, pricing and bookkeeping fees, fund-paid 12b-1 fees, and custodial, legal, and audit fees. The Board also noted the effects of any waivers and reimbursements on fees and expenses, as well as the impact of the fund's performance adjustment. As part of its review, the Board also considered the current and historical total expense ratios of each class of the fund compared to competitive fund median expenses. Each class of the fund is compared to those funds and classes in the Total Mapped Group (used by the Board for management fee comparisons) that have a similar sales load structure.
The Board noted that the total expense ratio of each of Class A, Class B, Class C, Institutional Class, the retail class, and Class K ranked below its competitive median for 2012 and the total expense ratio of Class T ranked above its competitive median for 2012. The Board considered that, in general, various factors can affect total expense ratios. The Board noted that the total expense ratio of Class T was above the competitive median primarily because of higher 12b-1 fees on Class T. Class T has a higher 12b-1 fee, but a lower front-end sales charge, than traditionally priced front-end sales charge classes. The Board considered that Class T is primarily sold load-waived in the retirement plan market where its 0.50% 12b-1 fee is comparable to competing no-load, higher 12b-1 fee classes designed specifically for retirement plans. The Board noted that the fund offers multiple classes, each of which has a different sales load and 12b-1 fee structure, and that the multiple structures are intended to offer a range of pricing options for the intermediary market. The Board also noted that the total expense ratios of the classes vary primarily by the level of their 12b-1 fees, although differences in transfer agent fees may also cause expenses to vary from class to class.
Fees Charged to Other Fidelity Clients. The Board also considered Fidelity fee structures and other information with respect to clients of FMR and its affiliates, such as other mutual funds advised or subadvised by FMR or its affiliates, pension plan clients, and other institutional clients. The Board noted the findings of the 2013 ad hoc joint committee (created with the board of other Fidelity funds), which reviewed and compared Fidelity's institutional investment advisory business with its business of providing services to the Fidelity funds, including the differences in services provided, fees charged, and costs incurred, as well as competition in their respective marketplaces.
Based on its review of total expense ratios and fees charged to other Fidelity clients, the Board concluded that the total expense ratio of each class of the fund was reasonable, although Class T was above the median of the universe presented for comparison, in light of the services that the fund and its shareholders receive and the other factors considered.
Annual Report
Board Approval of Investment Advisory Contracts and
Management Fees - continued
Costs of the Services and Profitability. The Board considered the revenues earned and the expenses incurred by Fidelity in conducting the business of developing, marketing, distributing, managing, administering and servicing the fund and servicing the fund's shareholders. The Board also considered the level of Fidelity's profits in respect of all the Fidelity funds.
On an annual basis, FMR presents to the Board Fidelity's profitability for the fund. Fidelity calculates the profitability for each fund, as well as aggregate profitability for groups of Fidelity funds and all Fidelity funds, using a series of detailed revenue and cost allocation methodologies which originate with the books and records of Fidelity on which Fidelity's audited financial statements are based. The Audit Committee of the Board reviews any significant changes from the prior year's methodologies.
PricewaterhouseCoopers LLP (PwC), independent registered public accounting firm and auditor to Fidelity and certain Fidelity funds, has been engaged annually by the Board as part of the Board's assessment of Fidelity's profitability analysis. PwC's engagement includes the review and assessment of the methodologies used by Fidelity in determining the revenues and expenses attributable to Fidelity's mutual fund business, and completion of agreed-upon procedures surrounding the mathematical accuracy of fund profitability and its conformity to allocation methodologies. After considering PwC's reports issued under the engagement and information provided by Fidelity, the Board concluded that while other allocation methods may also be reasonable, Fidelity's profitability methodologies are reasonable in all material respects.
The Board also reviewed Fidelity's non-fund businesses and fall-out benefits related to the mutual fund business as well as cases where Fidelity's affiliates may benefit from or be related to the fund's business.
The Board considered the costs of the services provided by and the profits realized by Fidelity in connection with the operation of the fund and was satisfied that the profitability was not excessive in the circumstances.
Economies of Scale. The Board considered whether there have been economies of scale in respect of the management of the Fidelity funds, whether the Fidelity funds (including the fund) have appropriately benefited from any such economies of scale, and whether there is potential for realization of any further economies of scale. The Board considered the extent to which the fund will benefit from economies of scale through increased services to the fund, through waivers or reimbursements, or through fee or expense reductions. The Board also noted that in 2009, it and the board of other Fidelity funds created an ad hoc committee (the Economies of Scale Committee) to analyze whether FMR attains economies of scale in respect of the management and servicing of the Fidelity funds, whether the Fidelity funds have appropriately benefited from such economies of scale, and whether there is potential for realization of any further economies of scale.
Annual Report
The Board recognized that the fund's management contract incorporates a "group fee" structure, which provides for lower group fee rates as total fund assets under FMR's management increase, and for higher group fee rates as total fund assets under FMR's management decrease. FMR calculates the group fee rates based on a tiered asset "breakpoint" schedule that varies based on asset class. The Board considered that the group fee is designed to deliver the benefits of economies of scale to fund shareholders when total Fidelity fund assets increase, even if assets of any particular fund are unchanged or have declined, because some portion of Fidelity's costs are attributable to services provided to all Fidelity funds, and all funds benefit if those costs can be allocated among more assets. The Board concluded that, given the group fee structure, fund shareholders will benefit from lower management fees as assets under FMR's management increase at the fund complex level, regardless of whether Fidelity achieves any such economies of scale.
The Board concluded, taking into account the analysis of the Economies of Scale Committee, that economies of scale, if any, are being appropriately shared between fund shareholders and Fidelity.
Amendment to Description of Group Fee Rate. At its July 2013 meeting, the Board voted to approve an amendment to the fund's management contract to modify the description of the "group fee rate" effective August 1, 2013. The Board noted that under the prior description in the contract, the group fee rate was based on the average net assets of all registered investment companies with which FMR has management contracts. Under the contract's tiered asset breakpoint schedule, the group fee rate is lower as total fund assets under FMR's management increase, and higher as total fund assets under FMR's management decrease. The Board considered that the prior description would have excluded the assets of 64 Fidelity sector funds from the group fee rate calculation once Fidelity SelectCo, LLC, an affiliate of FMR, assumed management responsibilities for those funds. The Board noted that modifying the description of the group fee rate to continue to include the assets of those 64 funds for purposes of determining group fee rate breakpoints would avoid an immediate adverse impact on the group fee rate for any fund.
Additional Information Requested by the Board. In order to develop fully the factual basis for consideration of the Fidelity funds' Advisory Contracts, the Board requested and received additional information on certain topics, including: (i) fund performance trends and Fidelity's long-term strategies for certain funds; (ii) the potential to further rationalize the Fidelity fund lineup with the possibility of achieving savings for the funds and Fidelity; (iii) the methodology with respect to competitive fund data and peer group classifications; (iv) the arrangements with, and performance of, certain sub-advisers on behalf of the Fidelity funds, as well as certain proposed participating affiliate arrangements; (v) the realization of fall-out benefits in certain Fidelity business units; (vi) Fidelity's group fee structures, including the rationale for the individual fee rates of certain categories of funds and the definition of group assets; (vii) trends regarding industry use of performance fee structures and the performance adjustment methodologies applicable to the Fidelity funds; (viii) additional competitive analysis regarding the total expenses for certain classes; and (ix) fund profitability methodology, including Fidelity's cost allocation methodology, and the impact of certain factors on fund profitability results.
Annual Report
Board Approval of Investment Advisory Contracts and
Management Fees - continued
Based on its evaluation of all of the conclusions noted above, and after considering all factors it believed relevant, the Board ultimately concluded that the advisory fee structures are fair and reasonable, and that the fund's Advisory Contracts should be renewed.
Annual Report
Investment Adviser
Fidelity Management & Research Company
Boston, MA
Investment Sub-Advisers
FMR Co., Inc.
Fidelity Management & Research
(U.K.) Inc.
FIL Investment Advisors
FIL Investments (Japan) Limited
FIL Investment Advisors (U.K.) Limited
Fidelity Management & Research
(Hong Kong) Limited
Fidelity Management & Research
(Japan) Inc.
General Distributor
Fidelity Distributors Corporation
Smithfield, RI
Transfer and Service Agents
Fidelity Investments Institutional
Operations Company, Inc.
Boston, MA
Fidelity Service Company, Inc.
Boston, MA
Custodian
The Northern Trust Company
Chicago, IL
The Fidelity Telephone Connection
Mutual Fund 24-Hour Service
Exchanges/Redemptions
and Account Assistance 1-800-544-6666
Product Information 1-800-544-8888
Retirement Accounts 1-800-544-4774
(8 a.m. - 9 p.m.)
TDD Service 1-800-544-0118
for the deaf and hearing impaired
(9 a.m. - 9 p.m. Eastern time)
Fidelity Automated Service
Telephone (FAST®)
1-800-544-5555
Automated line for quickest service
(Fidelity Investment logo)(registered trademark)
Corporate Headquarters
245 Summer St., Boston, MA 02210
www.fidelity.com
IGI-UANN-1213
1.807257.109
Fidelity®
International Discovery
Fund -
Class K
Annual Report
October 31, 2013
(Fidelity Cover Art)
Contents
Performance | (Click Here) | How the fund has done over time. |
Management's Discussion of Fund Performance | (Click Here) | The Portfolio Manager's review of fund performance and strategy. |
Shareholder Expense Example | (Click Here) | An example of shareholder expenses. |
Investment Changes | (Click Here) | A summary of major shifts in the fund's investments over the past six months. |
Investments | (Click Here) | A complete list of the fund's investments with their market values. |
Financial Statements | (Click Here) | Statements of assets and liabilities, operations, and changes in net assets, as well as financial highlights. |
Notes | (Click Here) | Notes to the financial statements. |
Report of Independent Registered Public Accounting Firm | (Click Here) | |
Trustees and Officers | (Click Here) | |
Distributions | (Click Here) | |
Board Approval of Investment Advisory Contracts and Management Fees | (Click Here) | |
To view a fund's proxy voting guidelines and proxy voting record for the 12-month period ended June 30, visit http://www.fidelity.com/proxyvotingresults or visit the Securities and Exchange Commission's (SEC) web site at http://www.sec.gov. You may also call 1-800-835-5092 to request a free copy of the proxy voting guidelines.
Standard & Poor's, S&P and S&P 500 are registered service marks of The McGraw-Hill Companies, Inc. and have been licensed for use by Fidelity Distributors Corporation.
Other third-party marks appearing herein are the property of their respective owners.
All other marks appearing herein are registered or unregistered trademarks or service marks of FMR LLC or an affiliated company. © 2013 FMR LLC. All rights reserved.
Annual Report
This report and the financial statements contained herein are submitted for the general information of the shareholders of the fund. This report is not authorized for distribution to prospective investors in the fund unless preceded or accompanied by an effective prospectus.
A fund files its complete schedule of portfolio holdings with the SEC for the first and third quarters of each fiscal year on Form N-Q. Forms N-Q are available on the SEC's web site at http://www.sec.gov. A fund's Forms N-Q may be reviewed and copied at the SEC's Public Reference Room in Washington, DC. Information regarding the operation of the SEC's Public Reference Room may be obtained by calling 1-800-SEC-0330. For a complete list of a fund's portfolio holdings, view the most recent holdings listing, semiannual report, or annual report on Fidelity's web site at http://www.fidelity.com, http://www.advisor.fidelity.com, or http://www.401k.com, as applicable.
NOT FDIC INSURED • MAY LOSE VALUE • NO BANK GUARANTEE
Neither the fund nor Fidelity Distributors Corporation is a bank.
Annual Report
Average annual total return reflects the change in the value of an investment, assuming reinvestment of the class' distributions from dividend income and capital gains (the profits earned upon the sale of securities that have grown in value, if any) and assuming a constant rate of performance each year. The $10,000 table and the fund's returns do not reflect the deduction of taxes that a shareholder would pay on fund distributions or the redemption of fund shares. During periods of reimbursement by Fidelity, a fund's total return will be greater than it would be had the reimbursement not occurred. How a fund did yesterday is no guarantee of how it will do tomorrow.
Average Annual Total Returns
Periods ended October 31, 2013 | Past 1
year | Past 5
years | Past 10
years |
Class KA,B | 27.23% | 12.77% | 8.81% |
A The initial offering of Class K shares took place on May 9, 2008. Returns prior to May 9, 2008 are those of Fidelity® International Discovery Fund, the original class of the fund.
B Prior to October 1, 2004, the fund operated under certain different investment policies. The fund's historical performance may not represent its current investment policies.
$10,000 Over 10 Years
Let's say hypothetically that $10,000 was invested in Fidelity® International Discovery Fund - Class K on October 31, 2003. The chart shows how the value of your investment would have changed, and also shows how the MSCI® EAFE ® Index performed over the same period. See footnote A above for additional information regarding the performance of Class K.
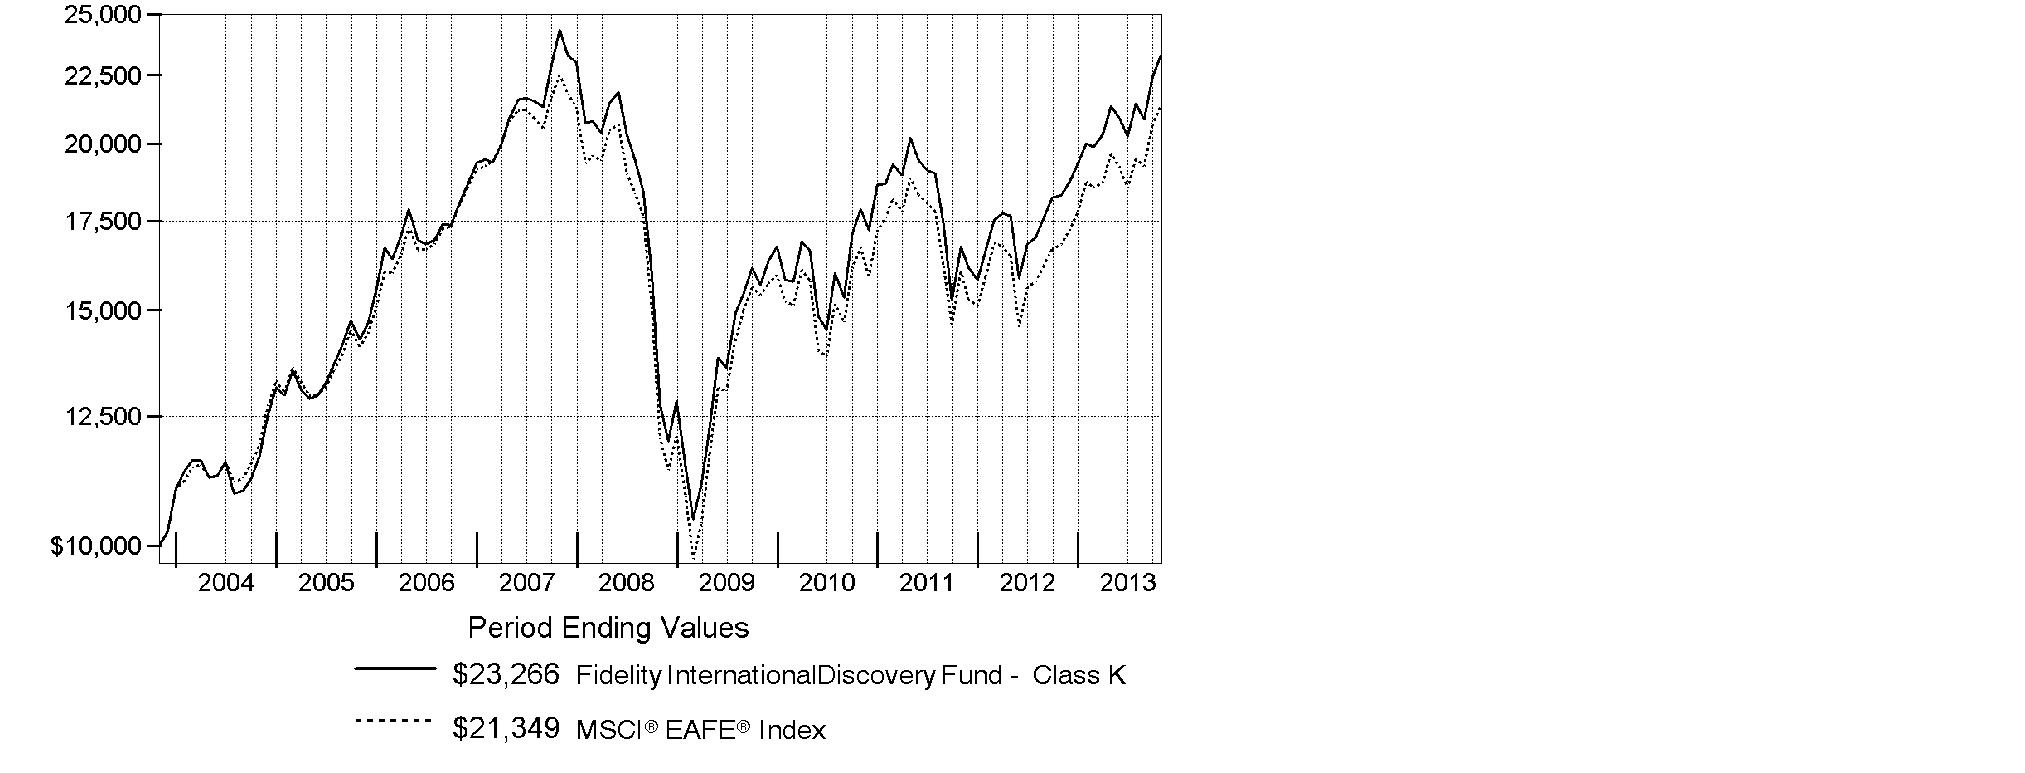
Annual Report
Market Recap: On balance, global equity markets remained upbeat for the 12-month period ending October 31, 2013. The MSCI® ACWI® (All Country World Index) Index gained 23.75% for the period, amid investor preference for higher-risk assets. The period was not without turbulence, however. In the spring and summer, central banks worldwide, especially in the U.S. and China, made clear their intentions to maintain accommodative monetary policies. That stance, combined with modest cyclical improvements around the globe and generally low valuations, underpinned the broad rally in equities. Europe (+32%) shone brightly, with most markets in the region - large and small - registering solid, index-beating gains. Another bright spot was Japan, which, despite a struggling yen and taking a second-half breather, posted a 34% result for the full year. The U.S. - by far the index's biggest constituent - also outperformed the global market with a roughly 28% advance. Meanwhile, Asia-Pacific ex Japan (+14%) lagged, hurt in part by a slowdown in Australia's mining industry as well as currency headwinds. Foreign-exchange and commodity weakness also curbed results in resource-heavy Canada and emerging markets (EM), both of which were up 7%. Country-level EM performance diverged meaningfully for the period, as evidenced by performance in Brazil (-1%), Russia (+12%), India (+1%) and China (+8%).
Comments from William Kennedy, Portfolio Manager of Fidelity® International Discovery Fund: For the year, the fund's Class K shares returned 27.23%, tracking the 27.02% gain of its benchmark, the MSCI® EAFE® Index. Security selection aided relative performance, with notable outperformance in the U.K. and Japan. Positioning in the Asia Pacific ex Japan region and the materials sector also contributed, as did security selection in information technology. Top individual contributors included U.K.-based online-only supermarket Ocado Group, an out-of-index position that rallied after the company significantly expanded its business capacity. An overweighting in real estate leasing company ORIX stood out, as improved economic activity drove up real estate prices in Japan. By contrast, stock picks in core European countries, emerging markets and the automobiles & components segment of consumer discretionary detracted, along with a small cash position in an up market. Individual disappointments included Housing Development Finance, a large mortgage provider in India, whose stock declined along with the Indian rupee. An average underweighting in Toyota Motor also hurt, as the weakening yen combined with the company's market-share increases to propel the stock higher.
The views expressed above reflect those of the portfolio manager(s) only through the end of the period as stated on the cover of this report and do not necessarily represent the views of Fidelity or any other person in the Fidelity organization. Any such views are subject to change at any time based upon market or other conditions and Fidelity disclaims any responsibility to update such views. These views may not be relied on as investment advice and, because investment decisions for a Fidelity fund are based on numerous factors, may not be relied on as an indication of trading intent on behalf of any Fidelity fund.
Annual Report
Shareholder Expense Example
As a shareholder of the Fund, you incur two types of costs: (1) transaction costs, including sales charges (loads) on purchase payments or redemption proceeds, redemption fees and (2) ongoing costs, including management fees, distribution and/or service (12b-1) fees and other Fund expenses. This Example is intended to help you understand your ongoing costs (in dollars) of investing in the Fund and to compare these costs with the ongoing costs of investing in other mutual funds.
The actual expense Example is based on an investment of $1,000 invested at the beginning of the period and held for the entire period (May 1, 2013 to October 31, 2013) for Class A, Class T, Class B, Class C, International Discovery, Class K and Institutional Class and for the period (August 13, 2013 to October 31, 2013) for Class Z. The hypothetical expense Example is based on an investment of $1,000 invested for the one-half year period (May 1, 2013 to October 31, 2013).
Actual Expenses
The first line of the accompanying table for each class of the Fund provides information about actual account values and actual expenses. You may use the information in this line, together with the amount you invested, to estimate the expenses that you paid over the period. Simply divide your account value by $1,000.00 (for example, an $8,600 account value divided by $1,000.00 = 8.6), then multiply the result by the number in the first line for a class of the Fund under the heading entitled "Expenses Paid During Period" to estimate the expenses you paid on your account during this period. A small balance maintenance fee of $12.00 that is charged once a year may apply for certain accounts with a value of less than $2,000. This fee is not included in the table below. If it was, the estimate of expenses you paid during the period would be higher, and your ending account value lower, by this amount. In addition, the Fund, as a shareholder in the underlying Fidelity Central Funds, will indirectly bear its pro-rata share of the fees and expenses incurred by the underlying Fidelity Central Funds. These fees and expenses are not included in the Fund's annualized expense ratio used to calculate the expense estimate in the table below.
Hypothetical Example for Comparison Purposes
The second line of the accompanying table for each class of the Fund provides information about hypothetical account values and hypothetical expenses based on a Class' actual expense ratio and an assumed rate of return of 5% per year before expenses, which is not the Class' actual return. The hypothetical account values and expenses may not be used to estimate the actual ending account balance or expenses you paid for the period. You may use this information to compare the ongoing costs of investing in the Fund and other funds. To do so, compare this 5% hypothetical example with the 5% hypothetical examples that appear in the shareholder reports of the other funds. A small balance maintenance fee of $12.00 that is charged once a year may apply for certain accounts with a value of less than $2,000. This fee is not included in the table below. If it was, the estimate of expenses you paid during the period would be higher, and your ending account value lower, by this amount. In addition, the Fund, as a shareholder in the underlying Fidelity Central Funds, will indirectly bear its pro-rata share of the fees and expenses incurred by the underlying Fidelity Central Funds. These fees and expenses are not included in the Fund's annualized expense ratio used to calculate the expense estimate in the table below.
Annual Report
Please note that the expenses shown in the table are meant to highlight your ongoing costs only and do not reflect any transaction costs. Therefore, the second line of the table is useful in comparing ongoing costs only, and will not help you determine the relative total costs of owning different funds. In addition, if these transactional costs were included, your costs would have been higher.
| Annualized
Expense Ratio B | Beginning
Account Value | Ending
Account Value
October 31, 2013 | Expenses Paid
During Period |
Class A | 1.34% | | | |
Actual | | $ 1,000.00 | $ 1,089.10 | $ 7.06 C |
HypotheticalA | | $ 1,000.00 | $ 1,018.45 | $ 6.82 D |
Class T | 1.58% | | | |
Actual | | $ 1,000.00 | $ 1,087.90 | $ 8.31 C |
HypotheticalA | | $ 1,000.00 | $ 1,017.24 | $ 8.03 D |
Class B | 2.09% | | | |
Actual | | $ 1,000.00 | $ 1,085.00 | $ 10.98 C |
HypotheticalA | | $ 1,000.00 | $ 1,014.67 | $ 10.61 D |
Class C | 2.09% | | | |
Actual | | $ 1,000.00 | $ 1,085.30 | $ 10.99 C |
HypotheticalA | | $ 1,000.00 | $ 1,014.67 | $ 10.61 D |
International Discovery | .99% | | | |
Actual | | $ 1,000.00 | $ 1,091.00 | $ 5.22 C |
HypotheticalA | | $ 1,000.00 | $ 1,020.21 | $ 5.04 D |
Class K | .85% | | | |
Actual | | $ 1,000.00 | $ 1,092.00 | $ 4.48 C |
HypotheticalA | | $ 1,000.00 | $ 1,020.92 | $ 4.33 D |
Institutional Class | .99% | | | |
Actual | | $ 1,000.00 | $ 1,091.10 | $ 5.22 C |
HypotheticalA | | $ 1,000.00 | $ 1,020.21 | $ 5.04 D |
Class Z | .85% | | | |
Actual | | $ 1,000.00 | $ 1,068.50 | $ 1.93 C |
HypotheticalA | | $ 1,000.00 | $ 1,020.92 | $ 4.33 D |
A 5% return per year before expenses
B Annualized expense ratio reflects expenses net of applicable fee waivers.
Annual Report
Shareholder Expense Example - continued
C Actual expenses are equal to each Class' annualized expense ratio; multiplied by the average account value over the period, multiplied by 184/365 (to reflect the one-half year period) for Class A, Class T, Class B, Class C, International Discovery, Class K and Institutional Class and multiplied by 80/365 (to reflect the period August 13, 2013 to October 31, 2013) for Class Z.
D Hypothetical expenses are equal to each Class' annualized expense ratio, multiplied by the average account value over the period, multiplied by 184/365 (to reflect the one-half year period).
Annual Report
Investment Changes (Unaudited)
Geographic Diversification (% of fund's net assets) |
As of October 31, 2013 |
 | Japan 18.2% | |
 | United Kingdom 15.9% | |
 | France 10.9% | |
 | Germany 8.7% | |
 | Switzerland 6.4% | |
 | United States of America* 5.5% | |
 | Sweden 4.1% | |
 | Spain 3.6% | |
 | Netherlands 3.3% | |
 | Other 23.4% | |

Percentages are based on country or territory of incorporation and are adjusted for the effect of futures contracts, if applicable. |
* Includes Short-Term Investments and Net Other Assets (Liabilities) |
As of April 30, 2013 |
| Japan 20.5% | |
| United Kingdom 16.1% | |
| France 9.7% | |
| Germany 7.5% | |
| Switzerland 6.3% | |
| United States of America* 5.2% | |
| Australia 3.9% | |
| Sweden 2.7% | |
| Netherlands 2.5% | |
| Other 25.6% | |

Percentages are based on country or territory of incorporation and are adjusted for the effect of futures contracts, if applicable. |
* Includes Short-Term Investments and Net Other Assets (Liabilities) |
Asset Allocation as of October 31, 2013 |
| % of fund's
net assets | % of fund's net assets
6 months ago |
Stocks and Equity Futures | 97.2 | 96.6 |
Short-Term Investments and Net Other Assets (Liabilities) | 2.8 | 3.4 |
Top Ten Stocks as of October 31, 2013 |
| % of fund's
net assets | % of fund's net assets
6 months ago |
Roche Holding AG (participation certificate) (Switzerland, Pharmaceuticals) | 2.0 | 1.0 |
Australia & New Zealand Banking Group Ltd. (Australia, Commercial Banks) | 1.8 | 1.6 |
Bayer AG (Germany, Pharmaceuticals) | 1.6 | 0.8 |
Toyota Motor Corp. (Japan, Automobiles) | 1.6 | 0.7 |
Total SA (France, Oil, Gas & Consumable Fuels) | 1.5 | 0.0 |
Volkswagen AG (Germany, Automobiles) | 1.5 | 0.7 |
UBS AG (Switzerland, Capital Markets) | 1.4 | 1.1 |
ORIX Corp. (Japan, Diversified Financial Services) | 1.4 | 1.1 |
SoftBank Corp. (Japan, Wireless Telecommunication Services) | 1.4 | 0.6 |
Banco Bilbao Vizcaya Argentaria SA (Spain, Commercial Banks) | 1.3 | 0.7 |
| 15.5 | |
Market Sectors as of October 31, 2013 |
| % of fund's
net assets | % of fund's net assets
6 months ago |
Financials | 24.8 | 24.3 |
Consumer Discretionary | 16.4 | 16.5 |
Industrials | 13.0 | 12.1 |
Consumer Staples | 10.1 | 11.3 |
Health Care | 9.5 | 8.9 |
Information Technology | 7.7 | 7.5 |
Materials | 5.2 | 5.7 |
Telecommunication Services | 5.1 | 4.1 |
Energy | 3.8 | 3.0 |
Utilities | 0.6 | 1.1 |
Annual Report
Investments October 31, 2013
Showing Percentage of Net Assets
Common Stocks - 94.7% |
| Shares | | Value (000s) |
Australia - 3.2% |
Ansell Ltd. | 2,268,950 | | $ 41,796 |
Australia & New Zealand Banking Group Ltd. | 6,493,040 | | 207,673 |
Ramsay Health Care Ltd. | 1,619,364 | | 59,385 |
Woodside Petroleum Ltd. | 1,461,485 | | 53,623 |
TOTAL AUSTRALIA | | 362,477 |
Austria - 0.2% |
Andritz AG | 455,300 | | 28,047 |
Bailiwick of Jersey - 2.6% |
Experian PLC | 6,115,400 | | 124,529 |
Wolseley PLC | 1,508,304 | | 81,283 |
WPP PLC | 3,996,700 | | 84,910 |
TOTAL BAILIWICK OF JERSEY | | 290,722 |
Belgium - 2.1% |
Anheuser-Busch InBev SA NV | 1,183,927 | | 122,730 |
KBC Groupe SA | 2,102,810 | | 114,632 |
TOTAL BELGIUM | | 237,362 |
Bermuda - 0.3% |
Cheung Kong Infrastructure Holdings Ltd. | 5,048,000 | | 35,127 |
Brazil - 0.1% |
Arezzo Industria e Comercio SA | 1,051,500 | | 15,724 |
British Virgin Islands - 0.4% |
Mail.Ru Group Ltd. GDR (Reg. S) | 1,193,800 | | 44,027 |
Canada - 1.0% |
Constellation Software, Inc. | 159,200 | | 29,002 |
InterOil Corp. (a)(d) | 204,400 | | 14,196 |
Suncor Energy, Inc. | 2,012,600 | | 73,138 |
TOTAL CANADA | | 116,336 |
Cayman Islands - 1.2% |
Baidu.com, Inc. sponsored ADR (a) | 123,100 | | 19,807 |
Cimc Enric Holdings Ltd. | 16,316,000 | | 22,981 |
ENN Energy Holdings Ltd. | 5,084,000 | | 30,132 |
Eurasia Drilling Co. Ltd. GDR (Reg. S) | 630,200 | | 26,689 |
Greatview Aseptic Pack Co. Ltd. | 26,392,000 | | 16,612 |
Sands China Ltd. | 1,460,800 | | 10,382 |
Youku Tudou, Inc. ADR (a)(d) | 300,200 | | 8,177 |
TOTAL CAYMAN ISLANDS | | 134,780 |
Common Stocks - continued |
| Shares | | Value (000s) |
Cyprus - 0.0% |
SPDI Secure Property Development & Investment PLC (a) | 529,830 | | $ 597 |
Denmark - 0.6% |
Novo Nordisk A/S Series B | 396,489 | | 66,036 |
Finland - 0.7% |
Sampo Oyj (A Shares) | 1,739,800 | | 82,418 |
France - 10.9% |
Arkema SA | 487,670 | | 55,368 |
Atos Origin SA | 388,851 | | 33,198 |
AXA SA | 5,364,600 | | 134,022 |
BNP Paribas SA | 1,544,345 | | 114,361 |
Bureau Veritas SA | 1,413,000 | | 42,667 |
Danone SA | 905,500 | | 67,152 |
Edenred SA | 1,177,900 | | 40,022 |
Havas SA | 5,201,268 | | 43,333 |
Iliad SA | 213,972 | | 48,924 |
Kering SA | 373,000 | | 84,753 |
Lafarge SA (Bearer) (d) | 605,900 | | 41,939 |
LVMH Moet Hennessy - Louis Vuitton SA | 612,502 | | 117,924 |
Sanofi SA | 890,979 | | 94,999 |
Schneider Electric SA | 1,383,800 | | 116,583 |
Technip SA | 192,300 | | 20,144 |
Total SA | 2,831,600 | | 173,727 |
TOTAL FRANCE | | 1,229,116 |
Germany - 7.2% |
Aareal Bank AG (a) | 1,044,895 | | 40,185 |
adidas AG | 541,900 | | 61,863 |
BASF AG | 1,265,455 | | 131,663 |
Bayer AG | 1,471,500 | | 182,890 |
Brenntag AG | 444,700 | | 75,353 |
GEA Group AG | 1,254,770 | | 54,602 |
GSW Immobilien AG | 430,481 | | 20,019 |
HeidelbergCement Finance AG | 860,300 | | 67,818 |
KION Group AG (a) | 577,867 | | 23,538 |
LEG Immobilien AG | 184,948 | | 10,547 |
Siemens AG | 1,110,885 | | 141,963 |
TOTAL GERMANY | | 810,441 |
Common Stocks - continued |
| Shares | | Value (000s) |
Hong Kong - 1.8% |
AIA Group Ltd. | 20,789,200 | | $ 105,515 |
Techtronic Industries Co. Ltd. | 39,683,000 | | 99,809 |
TOTAL HONG KONG | | 205,324 |
India - 0.6% |
Housing Development Finance Corp. Ltd. | 3,139,461 | | 43,561 |
United Spirits Ltd. | 444,545 | | 18,569 |
TOTAL INDIA | | 62,130 |
Indonesia - 0.1% |
PT Tower Bersama Infrastructure Tbk | 17,734,500 | | 8,967 |
Ireland - 2.0% |
Actavis PLC (a) | 308,100 | | 47,626 |
Bank of Ireland (a) | 146,718,100 | | 53,399 |
James Hardie Industries PLC CDI | 6,070,470 | | 62,711 |
Kerry Group PLC Class A | 945,600 | | 60,555 |
TOTAL IRELAND | | 224,291 |
Italy - 1.0% |
De Longhi SpA | 2,248,100 | | 34,797 |
Moleskine SpA | 4,183,000 | | 10,223 |
Tod's SpA | 117,793 | | 19,624 |
UniCredit SpA | 3,689,800 | | 27,754 |
World Duty Free SpA (a) | 2,253,904 | | 24,972 |
TOTAL ITALY | | 117,370 |
Japan - 17.2% |
ABC-MART, Inc. | 826,300 | | 41,324 |
Aozora Bank Ltd. | 16,056,000 | | 46,675 |
ARNEST ONE Corp. (d) | 306,200 | | 8,395 |
Astellas Pharma, Inc. | 768,700 | | 42,852 |
Cosmos Pharmaceutical Corp. | 245,800 | | 29,946 |
Daikin Industries Ltd. | 1,089,400 | | 62,677 |
Don Quijote Co. Ltd. | 1,818,400 | | 121,044 |
Hajime Construction Co. Ltd. | 34,900 | | 2,406 |
Hitachi Ltd. | 5,121,000 | | 35,822 |
Japan Exchange Group, Inc. | 2,589,500 | | 60,201 |
Japan Tobacco, Inc. | 3,948,700 | | 142,879 |
Kakaku.com, Inc. | 1,903,000 | | 36,807 |
KDDI Corp. | 2,082,700 | | 112,792 |
Keyence Corp. | 304,060 | | 130,317 |
Leopalace21 Corp. (a) | 6,899,700 | | 47,901 |
Common Stocks - continued |
| Shares | | Value (000s) |
Japan - continued |
Miraca Holdings, Inc. | 196,700 | | $ 8,863 |
Mitsubishi UFJ Financial Group, Inc. | 18,169,200 | | 115,706 |
Nomura Real Estate Holdings, Inc. | 563,300 | | 14,252 |
Omron Corp. | 1,225,300 | | 46,759 |
ORIX Corp. | 9,072,900 | | 157,152 |
Park24 Co. Ltd. | 1,342,800 | | 26,218 |
Rakuten, Inc. | 5,237,700 | | 68,245 |
Santen Pharmaceutical Co. Ltd. | 1,166,900 | | 59,239 |
Seven & i Holdings Co., Ltd. | 2,167,000 | | 80,198 |
Shinsei Bank Ltd. | 24,904,000 | | 58,308 |
Ship Healthcare Holdings, Inc. | 1,076,700 | | 44,182 |
SoftBank Corp. | 2,099,300 | | 156,773 |
Toyota Motor Corp. | 2,789,300 | | 180,853 |
USS Co. Ltd. | 450,400 | | 6,596 |
TOTAL JAPAN | | 1,945,382 |
Korea (South) - 0.9% |
Hyundai Motor Co. | 206,848 | | 49,311 |
NHN Corp. | 69,296 | | 38,981 |
Orion Corp. | 14,973 | | 14,602 |
TOTAL KOREA (SOUTH) | | 102,894 |
Luxembourg - 0.3% |
Brait SA | 6,048,833 | | 29,465 |
Mexico - 0.2% |
Alsea S.A.B. de CV | 7,662,195 | | 23,831 |
Netherlands - 3.3% |
AEGON NV | 5,028,800 | | 40,014 |
ASML Holding NV | 772,233 | | 73,084 |
European Aeronautic Defence and Space Co. (EADS) NV | 176,700 | | 12,142 |
Koninklijke Ahold NV | 2,412,842 | | 45,930 |
Koninklijke Philips Electronics NV | 2,496,700 | | 88,235 |
Randstad Holding NV | 717,740 | | 44,296 |
Royal DSM NV | 536,200 | | 40,617 |
Yandex NV (a) | 861,400 | | 31,751 |
TOTAL NETHERLANDS | | 376,069 |
New Zealand - 0.4% |
Ryman Healthcare Group Ltd. | 7,311,565 | | 45,597 |
Norway - 1.0% |
DNB ASA | 6,068,755 | | 107,551 |
Common Stocks - continued |
| Shares | | Value (000s) |
Philippines - 0.1% |
Alliance Global Group, Inc. | 26,741,800 | | $ 16,306 |
Russia - 0.5% |
Mobile TeleSystems OJSC sponsored ADR | 2,313,400 | | 52,746 |
Singapore - 0.4% |
Global Logistic Properties Ltd. | 16,214,205 | | 40,333 |
South Africa - 1.1% |
Naspers Ltd. Class N | 1,302,700 | | 121,851 |
Spain - 3.6% |
Amadeus IT Holding SA Class A | 1,319,900 | | 49,014 |
Antena 3 de Television SA | 1,515,400 | | 25,411 |
Banco Bilbao Vizcaya Argentaria SA | 12,546,524 | | 146,630 |
Criteria CaixaCorp SA | 4,210,900 | | 21,892 |
Distribuidora Internacional de Alimentacion SA | 5,726,396 | | 52,349 |
Grifols SA ADR | 1,208,550 | | 36,450 |
Inditex SA (d) | 481,679 | | 79,134 |
TOTAL SPAIN | | 410,880 |
Sweden - 4.1% |
ASSA ABLOY AB (B Shares) | 1,783,400 | | 88,536 |
Intrum Justitia AB | 1,835,800 | | 48,869 |
Investment AB Kinnevik (B Shares) | 2,363,300 | | 87,091 |
Nordea Bank AB | 6,100,600 | | 78,140 |
Svenska Cellulosa AB (SCA) (B Shares) | 3,591,900 | | 101,991 |
Svenska Handelsbanken AB (A Shares) | 1,258,200 | | 57,007 |
TOTAL SWEDEN | | 461,634 |
Switzerland - 6.4% |
Credit Suisse Group | 1,039,246 | | 32,329 |
Lonza Group AG | 476,868 | | 42,623 |
Partners Group Holding AG | 230,056 | | 59,609 |
Roche Holding AG (participation certificate) | 821,773 | | 227,506 |
Schindler Holding AG (participation certificate) | 260,065 | | 36,888 |
SGS SA (Reg.) | 7,770 | | 18,206 |
Swatch Group AG (Bearer) | 36,702 | | 23,481 |
Syngenta AG (Switzerland) | 179,374 | | 72,398 |
UBS AG | 8,311,378 | | 160,751 |
Zurich Insurance Group AG | 180,481 | | 49,907 |
TOTAL SWITZERLAND | | 723,698 |
Common Stocks - continued |
| Shares | | Value (000s) |
Taiwan - 0.6% |
ECLAT Textile Co. Ltd. | 2,457,180 | | $ 27,005 |
Taiwan Semiconductor Manufacturing Co. Ltd. | 11,289,000 | | 41,528 |
TOTAL TAIWAN | | 68,533 |
United Kingdom - 15.9% |
Aberdeen Asset Management PLC | 5,975,132 | | 42,432 |
Alabama Noor Hospitals Group PLC (a) | 1,829,400 | | 24,933 |
Associated British Foods PLC | 1,571,500 | | 57,123 |
Barclays PLC | 22,636,113 | | 95,241 |
BG Group PLC | 3,923,700 | | 80,119 |
BHP Billiton PLC | 2,080,582 | | 64,204 |
British American Tobacco PLC (United Kingdom) | 881,200 | | 48,618 |
Croda International PLC | 630,000 | | 24,607 |
Diageo PLC | 4,394,219 | | 140,077 |
Foxtons Group PLC | 2,178,500 | | 11,134 |
Hikma Pharmaceuticals PLC | 3,197,720 | | 61,578 |
HSBC Holdings PLC (United Kingdom) | 12,266,193 | | 134,454 |
Intertek Group PLC | 893,600 | | 47,741 |
ITV PLC | 11,642,037 | | 35,635 |
Jazztel PLC (a) | 4,681,964 | | 51,364 |
Legal & General Group PLC | 26,720,558 | | 92,671 |
Liberty Global PLC Class A (a) | 610,800 | | 47,868 |
London Stock Exchange Group PLC | 1,729,000 | | 45,521 |
Meggitt PLC | 6,842,366 | | 62,809 |
Next PLC | 781,744 | | 68,250 |
Ocado Group PLC (a) | 8,103,297 | | 56,389 |
Persimmon PLC | 2,082,200 | | 42,233 |
Reckitt Benckiser Group PLC | 788,600 | | 61,300 |
Rolls-Royce Group PLC | 4,197,715 | | 77,402 |
Rotork PLC | 717,800 | | 32,951 |
Royal Mail PLC | 788,800 | | 7,083 |
SABMiller PLC | 1,478,600 | | 77,145 |
Taylor Wimpey PLC | 18,277,100 | | 32,295 |
The Restaurant Group PLC | 1,992,100 | | 18,398 |
Ultra Electronics Holdings PLC | 614,667 | | 19,061 |
Vodafone Group PLC | 36,632,743 | | 134,177 |
TOTAL UNITED KINGDOM | | 1,794,813 |
United States of America - 2.7% |
Beam, Inc. | 387,400 | | 26,072 |
Google, Inc. Class A (a) | 60,100 | | 61,938 |
Illumina, Inc. (a) | 12,500 | | 1,169 |
Common Stocks - continued |
| Shares | | Value (000s) |
United States of America - continued |
MasterCard, Inc. Class A | 160,100 | | $ 114,808 |
McGraw-Hill Companies, Inc. | 488,400 | | 34,032 |
Sohu.com, Inc. (a) | 313,700 | | 21,005 |
Visa, Inc. Class A | 260,000 | | 51,134 |
TOTAL UNITED STATES OF AMERICA | | 310,158 |
TOTAL COMMON STOCKS (Cost $8,462,801) |
10,703,033
|
Nonconvertible Preferred Stocks - 1.5% |
| | | |
Germany - 1.5% |
Volkswagen AG | 650,200 | | 165,262 |
United Kingdom - 0.0% |
Rolls-Royce Group PLC Series C | 361,003,490 | | 579 |
TOTAL NONCONVERTIBLE PREFERRED STOCKS (Cost $133,620) |
165,841
|
Government Obligations - 0.1% |
| Principal Amount (000s) | | |
United States of America - 0.1% |
U.S. Treasury Bills, yield at date of purchase 0.02% to 0.04% 1/2/14 (e)
(Cost $6,960) | | $ 6,960 | |
6,960
|
Money Market Funds - 4.0% |
| Shares | | |
Fidelity Cash Central Fund, 0.09% (b) | 431,996,301 | | 431,996 |
Fidelity Securities Lending Cash Central Fund, 0.09% (b)(c) | 22,072,034 | | 22,072 |
TOTAL MONEY MARKET FUNDS (Cost $454,068) |
454,068
|
TOTAL INVESTMENT PORTFOLIO - 100.3% (Cost $9,057,449) | | 11,329,902 |
NET OTHER ASSETS (LIABILITIES) - (0.3)% | | (35,016) |
NET ASSETS - 100% | $ 11,294,886 |
Futures Contracts |
| Expiration Date | | Underlying Face Amount at Value (000s) | | Unrealized Appreciation/
(Depreciation) (000s) |
Purchased |
Equity Index Contracts |
1,572 Nikkei 225 Index Contracts (Japan) | Dec. 2013 | | $ 113,695 | | $ 4,238 |
|
The face value of futures purchased as a percentage of net assets is 1% |
Legend |
(a) Non-income producing |
(b) Affiliated fund that is generally available only to investment companies and other accounts managed by Fidelity Investments. The rate quoted is the annualized seven-day yield of the fund at period end. A complete unaudited listing of the fund's holdings as of its most recent quarter end is available upon request. In addition, each Fidelity Central Fund's financial statements, which are not covered by the Fund's Report of Independent Registered Public Accounting Firm, are available on the SEC's website or upon request. |
(c) Investment made with cash collateral received from securities on loan. |
(d) Security or a portion of the security is on loan at period end. |
(e) Security or a portion of the security was pledged to cover margin requirements for futures contracts. At period end, the value of securities pledged amounted to $6,960,000. |
Affiliated Central Funds |
Information regarding fiscal year to date income earned by the Fund from investments in Fidelity Central Funds is as follows: |
Fund | Income earned
(Amounts in thousands) |
Fidelity Cash Central Fund | $ 420 |
Fidelity Securities Lending Cash Central Fund | 5,441 |
Total | $ 5,861 |
Other Affiliated Issuers |
An affiliated company is a company in which the Fund has ownership of at least 5% of the voting securities. Fiscal year to date transactions with companies which are or were affiliates are as follows: |
Affiliate
(Amounts in thousands) | Value, beginning of period | Purchases | Sales Proceeds | Dividend Income | Value,
end of
period |
Boyner Buyuk Magazacilik A/S | $ 10,764 | $ - | $ 16,020 | $ - | $ - |
Other Information |
Categorizations in the Schedule of Investments are based on country or territory of incorporation. |
The following is a summary of the inputs used, as of October 31, 2013, involving the Fund's assets and liabilities carried at fair value. The inputs or methodology used for valuing securities may not be an indication of the risk associated with investing in those securities. For more information on valuation inputs, and their aggregation into the levels used in the table below, please refer to the Investment Valuation section in the accompanying Notes to Financial Statements. |
Valuation Inputs at Reporting Date: |
Description
(Amounts in thousands) | Total | Level 1 | Level 2 | Level 3 |
Investments in Securities: | | | | |
Equities: | | | | |
Consumer Discretionary | $ 1,843,308 | $ 1,414,445 | $ 418,062 | $ 10,801 |
Consumer Staples | 1,147,236 | 582,788 | 564,448 | - |
Energy | 441,636 | 267,909 | 173,727 | - |
Financials | 2,821,082 | 1,658,069 | 1,163,013 | - |
Health Care | 1,087,724 | 771,553 | 316,171 | - |
Industrials | 1,451,790 | 1,132,697 | 319,093 | - |
Information Technology | 867,159 | 575,926 | 291,233 | - |
Materials | 577,937 | 441,335 | 136,602 | - |
Telecommunication Services | 565,743 | 162,001 | 403,742 | - |
Utilities | 65,259 | 65,259 | - | - |
Government Obligations | 6,960 | - | 6,960 | - |
Money Market Funds | 454,068 | 454,068 | - | - |
Total Investments in Securities: | $ 11,329,902 | $ 7,526,050 | $ 3,793,051 | $ 10,801 |
Derivative Instruments: | | | | |
Assets | | | | |
Futures Contracts | $ 4,238 | $ 4,238 | $ - | $ - |
The following is a summary of transfers between Level 1 and Level 2 for the period ended October 31, 2013. Transfers are assumed to have occurred at the beginning of the period, and are primarily attributable to the valuation techniques used for foreign equity securities, as discussed in the accompanying Notes to Financial Statements: |
Transfers | Total (000s) |
Level 1 to Level 2 | $ 712,449 |
Level 2 to Level 1 | $ 0 |
Value of Derivative Instruments |
The following table is a summary of the Fund's value of derivative instruments by primary risk exposure as of October 31, 2013. For additional information on derivative instruments, please refer to the Derivative Instruments section in the accompanying Notes to Financial Statements. |
Primary Risk Exposure /
Derivative Type | Value |
| Asset | Liability |
Equity Risk | | |
Futures Contracts (a) | $ 4,238 | $ - |
(a) Reflects gross cumulative appreciation (depreciation) on futures contracts as presented in the Schedule of Investments. Only the period end receivable or payable for daily variation margin and net unrealized appreciation (depreciation) are presented in the Statement of Assets and Liabilities. |
See accompanying notes which are an integral part of the financial statements.
Annual Report
Statement of Assets and Liabilities
Amounts in thousands (except per-share amounts) | October 31, 2013 |
| | |
Assets | | |
Investment in securities, at value (including securities loaned of $21,646) - See accompanying schedule: Unaffiliated issuers (cost $8,603,381) | $ 10,875,834 | |
Fidelity Central Funds (cost $454,068) | 454,068 | |
Total Investments (cost $9,057,449) | | $ 11,329,902 |
Foreign currency held at value (cost $934) | | 924 |
Receivable for investments sold | | 8,555 |
Receivable for fund shares sold | | 7,336 |
Dividends receivable | | 20,216 |
Distributions receivable from Fidelity Central Funds | | 122 |
Prepaid expenses | | 35 |
Other receivables | | 4,081 |
Total assets | | 11,371,171 |
| | |
Liabilities | | |
Payable for investments purchased | $ 38,436 | |
Payable for fund shares redeemed | 5,719 | |
Accrued management fee | 6,631 | |
Distribution and service plan fees payable | 128 | |
Payable for daily variation margin for derivative instruments | 983 | |
Other affiliated payables | 1,581 | |
Other payables and accrued expenses | 735 | |
Collateral on securities loaned, at value | 22,072 | |
Total liabilities | | 76,285 |
| | |
Net Assets | | $ 11,294,886 |
Net Assets consist of: | | |
Paid in capital | | $ 9,866,929 |
Undistributed net investment income | | 131,430 |
Accumulated undistributed net realized gain (loss) on investments and foreign currency transactions | | (979,010) |
Net unrealized appreciation (depreciation) on investments and assets and liabilities in foreign currencies | | 2,275,537 |
Net Assets | | $ 11,294,886 |
See accompanying notes which are an integral part of the financial statements.
Annual Report
Statement of Assets and Liabilities - continued
Amounts in thousands (except per-share amounts) | October 31, 2013 |
| | |
Calculation of Maximum Offering Price Class A:
Net Asset Value and redemption price per share ($346,717.68 ÷ 8,780.120 shares) | | $ 39.49 |
| | |
Maximum offering price per share (100/94.25 of $39.49) | | $ 41.90 |
Class T:
Net Asset Value and redemption price per share ($53,183.51 ÷ 1,355.789 shares) | | $ 39.23 |
| | |
Maximum offering price per share (100/96.50 of $39.23) | | $ 40.65 |
Class B:
Net Asset Value and offering price per share ($6,686.96 ÷ 171.088 shares)A | | $ 39.08 |
| | |
Class C:
Net Asset Value and offering price per share ($36,470.54 ÷ 933.457 shares)A | | $ 39.07 |
| | |
International Discovery:
Net Asset Value, offering price and redemption price per share ($7,799,575.78 ÷ 195,853.386 shares) | | $ 39.82 |
| | |
Class K:
Net Asset Value, offering price and redemption price per share ($2,576,018.46 ÷ 64,786.777 shares) | | $ 39.76 |
| | |
Institutional Class:
Net Asset Value, offering price and redemption price per share ($476,126.48 ÷ 11,975.218 shares) | | $ 39.76 |
| | |
Class Z:
Net Asset Value, offering price and redemption price per share ($106.86 ÷ 2.687 shares) | | $ 39.77 |
A Redemption price per share is equal to net asset value less any applicable contingent deferred sales charge.
See accompanying notes which are an integral part of the financial statements.
Annual Report
Financial Statements - continued
Statement of Operations
Amounts in thousands | Year ended October 31, 2013 |
| | |
Investment Income | | |
Dividends | | $ 233,738 |
Interest | | 3 |
Income from Fidelity Central Funds | | 5,861 |
Income before foreign taxes withheld | | 239,602 |
Less foreign taxes withheld | | (17,198) |
Total income | | 222,404 |
| | |
Expenses | | |
Management fee
Basic fee | $ 67,899 | |
Performance adjustment | 6,089 | |
Transfer agent fees | 16,474 | |
Distribution and service plan fees | 1,432 | |
Accounting and security lending fees | 1,778 | |
Custodian fees and expenses | 1,352 | |
Independent trustees' compensation | 54 | |
Registration fees | 215 | |
Audit | 119 | |
Legal | 24 | |
Miscellaneous | 76 | |
Total expenses before reductions | 95,512 | |
Expense reductions | (2,311) | 93,201 |
Net investment income (loss) | | 129,203 |
Realized and Unrealized Gain (Loss) Net realized gain (loss) on: | | |
Investment securities: | | |
Unaffiliated issuers | 671,713 | |
Other affiliated issuers | 4,258 | |
Foreign currency transactions | (1,963) | |
Futures contracts | 51,368 | |
Total net realized gain (loss) | | 725,376 |
Change in net unrealized appreciation (depreciation) on: Investment securities | 1,459,188 | |
Assets and liabilities in foreign currencies | (54) | |
Futures contracts | 4,238 | |
Total change in net unrealized appreciation (depreciation) | | 1,463,372 |
Net gain (loss) | | 2,188,748 |
Net increase (decrease) in net assets resulting from operations | | $ 2,317,951 |
See accompanying notes which are an integral part of the financial statements.
Annual Report
Statement of Changes in Net Assets
Amounts in thousands | Year ended
October 31,
2013 | Year ended
October 31,
2012 |
Increase (Decrease) in Net Assets | | |
Operations | | |
Net investment income (loss) | $ 129,203 | $ 143,212 |
Net realized gain (loss) | 725,376 | (207,579) |
Change in net unrealized appreciation (depreciation) | 1,463,372 | 762,141 |
Net increase (decrease) in net assets resulting
from operations | 2,317,951 | 697,774 |
Distributions to shareholders from net investment income | (146,031) | (118,968) |
Distributions to shareholders from net realized gain | (8,413) | - |
Total distributions | (154,444) | (118,968) |
Share transactions - net increase (decrease) | 714,712 | (915,362) |
Redemption fees | 128 | 128 |
Total increase (decrease) in net assets | 2,878,347 | (336,428) |
| | |
Net Assets | | |
Beginning of period | 8,416,539 | 8,752,967 |
End of period (including undistributed net investment income of $131,430 and undistributed net investment income of $126,507, respectively) | $ 11,294,886 | $ 8,416,539 |
See accompanying notes which are an integral part of the financial statements.
Annual Report
Financial Highlights - Class A
Years ended October 31, | 2013 | 2012 | 2011 | 2010 | 2009 |
Selected Per-Share Data | | | | | |
Net asset value, beginning of period | $ 31.66 | $ 29.43 | $ 32.07 | $ 28.57 | $ 23.68 |
Income from Investment Operations | | | | | |
Net investment income (loss) C | .34 | .41 | .42 | .31 | .31 |
Net realized and unrealized gain (loss) | 7.97 | 2.11 | (2.52) | 3.51 | 4.84 |
Total from investment operations | 8.31 | 2.52 | (2.10) | 3.82 | 5.15 |
Distributions from net investment income | (.45) | (.29) | (.38) | (.28) | (.26) |
Distributions from net realized gain | (.03) | - | (.16) | (.04) | - |
Total distributions | (.48) | (.29) | (.54) | (.32) | (.26) |
Redemption fees added to paid in capital C,G | - | - | - | - | - |
Net asset value, end of period | $ 39.49 | $ 31.66 | $ 29.43 | $ 32.07 | $ 28.57 |
Total Return A,B | 26.59% | 8.70% | (6.71)% | 13.43% | 22.14% |
Ratios to Average Net Assets D,F | | | | |
Expenses before reductions | 1.35% | 1.34% | 1.30% | 1.33% | 1.37% |
Expenses net of fee waivers, if any | 1.35% | 1.34% | 1.29% | 1.33% | 1.37% |
Expenses net of all reductions | 1.33% | 1.31% | 1.25% | 1.28% | 1.32% |
Net investment income (loss) | .97% | 1.41% | 1.31% | 1.06% | 1.28% |
Supplemental Data | | | | | |
Net assets, end of period (in millions) | $ 347 | $ 299 | $ 320 | $ 392 | $ 414 |
Portfolio turnover rate E | 65% | 68% | 75% | 82% | 98% |
A Total returns would have been lower if certain expenses had not been reduced during the applicable periods shown.
B Total returns do not include the effect of the sales charges.
C Calculated based on average shares outstanding during the period.
D Fees and expenses of any underlying Fidelity Central Funds are not included in the Fund's expense ratio. The Fund indirectly bears its proportionate share of the expenses of any underlying Fidelity Central Funds.
E Amount does not include the portfolio activity of any underlying Fidelity Central Funds.
F Expense ratios reflect operating expenses of the class. Expenses before reductions do not reflect amounts reimbursed by the investment adviser or reductions from brokerage service arrangements or reductions from other expense offset arrangements and do not represent the amount paid by the class during periods when reimbursements or reductions occur. Expenses net of fee waivers reflect expenses after reimbursement by the investment adviser but prior to reductions from brokerage service arrangements or other expense offset arrangements. Expenses net of all reductions represent the net expenses paid by the class.
G Amount represents less than $.01 per share.
See accompanying notes which are an integral part of the financial statements.
Annual Report
Financial Highlights - Class T
Years ended October 31, | 2013 | 2012 | 2011 | 2010 | 2009 |
Selected Per-Share Data | | | | | |
Net asset value, beginning of period | $ 31.42 | $ 29.18 | $ 31.81 | $ 28.35 | $ 23.49 |
Income from Investment Operations | | | | | |
Net investment income (loss) C | .26 | .34 | .34 | .23 | .24 |
Net realized and unrealized gain (loss) | 7.92 | 2.09 | (2.51) | 3.48 | 4.81 |
Total from investment operations | 8.18 | 2.43 | (2.17) | 3.71 | 5.05 |
Distributions from net investment income | (.34) | (.19) | (.30) | (.21) | (.19) |
Distributions from net realized gain | (.03) | - | (.16) | (.04) | - |
Total distributions | (.37) | (.19) | (.46) | (.25) | (.19) |
Redemption fees added to paid in capital C,G | - | - | - | - | - |
Net asset value, end of period | $ 39.23 | $ 31.42 | $ 29.18 | $ 31.81 | $ 28.35 |
Total Return A,B | 26.31% | 8.41% | (6.96)% | 13.14% | 21.79% |
Ratios to Average Net Assets D,F | | | | |
Expenses before reductions | 1.59% | 1.59% | 1.56% | 1.60% | 1.65% |
Expenses net of fee waivers, if any | 1.59% | 1.59% | 1.55% | 1.60% | 1.65% |
Expenses net of all reductions | 1.57% | 1.56% | 1.51% | 1.56% | 1.60% |
Net investment income (loss) | .73% | 1.16% | 1.05% | .79% | 1.00% |
Supplemental Data | | | | | |
Net assets, end of period (in millions) | $ 53 | $ 46 | $ 61 | $ 92 | $ 83 |
Portfolio turnover rate E | 65% | 68% | 75% | 82% | 98% |
A Total returns would have been lower if certain expenses had not been reduced during the applicable periods shown.
B Total returns do not include the effect of the sales charges.
C Calculated based on average shares outstanding during the period.
D Fees and expenses of any underlying Fidelity Central Funds are not included in the Fund's expense ratio. The Fund indirectly bears its proportionate share of the expenses of any underlying Fidelity Central Funds.
E Amount does not include the portfolio activity of any underlying Fidelity Central Funds.
F Expense ratios reflect operating expenses of the class. Expenses before reductions do not reflect amounts reimbursed by the investment adviser or reductions from brokerage service arrangements or reductions from other expense offset arrangements and do not represent the amount paid by the class during periods when reimbursements or reductions occur. Expenses net of fee waivers reflect expenses after reimbursement by the investment adviser but prior to reductions from brokerage service arrangements or other expense offset arrangements. Expenses net of all reductions represent the net expenses paid by the class.
G Amount represents less than $.01 per share.
See accompanying notes which are an integral part of the financial statements.
Annual Report
Financial Highlights - Class B
Years ended October 31, | 2013 | 2012 | 2011 | 2010 | 2009 |
Selected Per-Share Data | | | | | |
Net asset value, beginning of period | $ 31.28 | $ 29.02 | $ 31.60 | $ 28.18 | $ 23.25 |
Income from Investment Operations | | | | | |
Net investment income (loss) C | .08 | .19 | .17 | .08 | .12 |
Net realized and unrealized gain (loss) | 7.90 | 2.09 | (2.48) | 3.44 | 4.81 |
Total from investment operations | 7.98 | 2.28 | (2.31) | 3.52 | 4.93 |
Distributions from net investment income | (.15) | (.02) | (.12) | (.06) | - |
Distributions from net realized gain | (.03) | - | (.16) | (.04) | - |
Total distributions | (.18) | (.02) | (.27) H | (.10) | - |
Redemption fees added to paid in capital C,G | - | - | - | - | - |
Net asset value, end of period | $ 39.08 | $ 31.28 | $ 29.02 | $ 31.60 | $ 28.18 |
Total Return A,B | 25.64% | 7.85% | (7.39)% | 12.52% | 21.20% |
Ratios to Average Net Assets D,F | | | | |
Expenses before reductions | 2.10% | 2.09% | 2.06% | 2.12% | 2.16% |
Expenses net of fee waivers, if any | 2.10% | 2.09% | 2.06% | 2.12% | 2.16% |
Expenses net of all reductions | 2.08% | 2.06% | 2.02% | 2.08% | 2.11% |
Net investment income (loss) | .22% | .66% | .54% | .27% | .49% |
Supplemental Data | | | | | |
Net assets, end of period (in millions) | $ 7 | $ 8 | $ 10 | $ 14 | $ 16 |
Portfolio turnover rate E | 65% | 68% | 75% | 82% | 98% |
A Total returns would have been lower if certain expenses had not been reduced during the applicable periods shown.
B Total returns do not include the effect of the contingent deferred sales charge.
C Calculated based on average shares outstanding during the period.
D Fees and expenses of any underlying Fidelity Central Funds are not included in the Fund's expense ratio. The Fund indirectly bears its proportionate share of the expenses of any underlying Fidelity Central Funds.
E Amount does not include the portfolio activity of any underlying Fidelity Central Funds.
F Expense ratios reflect operating expenses of the class. Expenses before reductions do not reflect amounts reimbursed by the investment adviser or reductions from brokerage service arrangements or reductions from other expense offset arrangements and do not represent the amount paid by the class during periods when reimbursements or reductions occur. Expenses net of fee waivers reflect expenses after reimbursement by the investment adviser but prior to reductions from brokerage service arrangements or other expense offset arrangements. Expenses net of all reductions represent the net expenses paid by the class.
G Amount represents less than $.01 per share.
H Total distributions of $.27 per share is comprised of distributions from net investment income of $.115 and distributions from net realized gain of $.155 per share.
See accompanying notes which are an integral part of the financial statements.
Annual Report
Financial Highlights - Class C
Years ended October 31, | 2013 | 2012 | 2011 | 2010 | 2009 |
Selected Per-Share Data | | | | | |
Net asset value, beginning of period | $ 31.32 | $ 29.08 | $ 31.68 | $ 28.23 | $ 23.31 |
Income from Investment Operations | | | | | |
Net investment income (loss) C | .08 | .19 | .18 | .09 | .12 |
Net realized and unrealized gain (loss) | 7.90 | 2.09 | (2.49) | 3.45 | 4.82 |
Total from investment operations | 7.98 | 2.28 | (2.31) | 3.54 | 4.94 |
Distributions from net investment income | (.20) | (.04) | (.14) | (.05) | (.02) |
Distributions from net realized gain | (.03) | - | (.16) | (.04) | - |
Total distributions | (.23) | (.04) | (.29) H | (.09) | (.02) |
Redemption fees added to paid in capital C,G | - | - | - | - | - |
Net asset value, end of period | $ 39.07 | $ 31.32 | $ 29.08 | $ 31.68 | $ 28.23 |
Total Return A,B | 25.65% | 7.86% | (7.37)% | 12.54% | 21.22% |
Ratios to Average Net Assets D,F | | | | |
Expenses before reductions | 2.10% | 2.09% | 2.05% | 2.09% | 2.14% |
Expenses net of fee waivers, if any | 2.09% | 2.09% | 2.04% | 2.09% | 2.14% |
Expenses net of all reductions | 2.07% | 2.06% | 2.00% | 2.05% | 2.09% |
Net investment income (loss) | .23% | .66% | .56% | .30% | .51% |
Supplemental Data | | | | | |
Net assets, end of period (in millions) | $ 36 | $ 30 | $ 33 | $ 44 | $ 43 |
Portfolio turnover rate E | 65% | 68% | 75% | 82% | 98% |
A Total returns would have been lower if certain expenses had not been reduced during the applicable periods shown.
B Total returns do not include the effect of the contingent deferred sales charge.
C Calculated based on average shares outstanding during the period.
D Fees and expenses of any underlying Fidelity Central Funds are not included in the Fund's expense ratio. The Fund indirectly bears its proportionate share of the expenses of any underlying Fidelity Central Funds.
E Amount does not include the portfolio activity of any underlying Fidelity Central Funds.
F Expense ratios reflect operating expenses of the class. Expenses before reductions do not reflect amounts reimbursed by the investment adviser or reductions from brokerage service arrangements or reductions from other expense offset arrangements and do not represent the amount paid by the class during periods when reimbursements or reductions occur. Expenses net of fee waivers reflect expenses after reimbursement by the investment adviser but prior to reductions from brokerage service arrangements or other expense offset arrangements. Expenses net of all reductions represent the net expenses paid by the class.
G Amount represents less than $.01 per share.
H Total distributions of $.29 per share is comprised of distributions from net investment income of $.137 and distributions from net realized gain of $.155 per share.
See accompanying notes which are an integral part of the financial statements.
Annual Report
Financial Highlights - International Discovery
Years ended October 31, | 2013 | 2012 | 2011 | 2010 | 2009 |
Selected Per-Share Data | | | | | |
Net asset value, beginning of period | $ 31.91 | $ 29.69 | $ 32.34 | $ 28.79 | $ 23.88 |
Income from Investment Operations | | | | | |
Net investment income (loss) B | .47 | .51 | .53 | .40 | .37 |
Net realized and unrealized gain (loss) | 8.02 | 2.12 | (2.54) | 3.54 | 4.88 |
Total from investment operations | 8.49 | 2.63 | (2.01) | 3.94 | 5.25 |
Distributions from net investment income | (.55) | (.41) | (.48) | (.35) | (.34) |
Distributions from net realized gain | (.03) | - | (.16) | (.04) | - |
Total distributions | (.58) | (.41) | (.64) | (.39) | (.34) |
Redemption fees added to paid in capital B,F | - | - | - | - | - |
Net asset value, end of period | $ 39.82 | $ 31.91 | $ 29.69 | $ 32.34 | $ 28.79 |
Total Return A | 27.03% | 9.03% | (6.39)% | 13.76% | 22.47% |
Ratios to Average Net Assets C,E | | | | |
Expenses before reductions | 1.00% | 1.01% | .97% | 1.05% | 1.12% |
Expenses net of fee waivers, if any | 1.00% | 1.01% | .96% | 1.05% | 1.12% |
Expenses net of all reductions | .98% | .98% | .92% | 1.00% | 1.07% |
Net investment income (loss) | 1.32% | 1.73% | 1.64% | 1.35% | 1.53% |
Supplemental Data | | | | | |
Net assets, end of period (in millions) | $ 7,800 | $ 5,965 | $ 6,806 | $ 8,133 | $ 8,114 |
Portfolio turnover rate D | 65% | 68% | 75% | 82% | 98% |
A Total returns would have been lower if certain expenses had not been reduced during the applicable periods shown.
B Calculated based on average shares outstanding during the period.
C Fees and expenses of any underlying Fidelity Central Funds are not included in the Fund's expense ratio. The Fund indirectly bears its proportionate share of the expenses of any underlying Fidelity Central Funds.
D Amount does not include the portfolio activity of any underlying Fidelity Central Funds.
E Expense ratios reflect operating expenses of the class. Expenses before reductions do not reflect amounts reimbursed by the investment adviser or reductions from brokerage service arrangements or reductions from other expense offset arrangements and do not represent the amount paid by the class during periods when reimbursements or reductions occur. Expenses net of fee waivers reflect expenses after reimbursement by the investment adviser but prior to reductions from brokerage service arrangements or other expense offset arrangements. Expenses net of all reductions represent the net expenses paid by the class.
F Amount represents less than $.01 per share.
See accompanying notes which are an integral part of the financial statements.
Annual Report
Financial Highlights - Class K
Years ended October 31, | 2013 | 2012 | 2011 | 2010 | 2009 |
Selected Per-Share Data | | | | | |
Net asset value, beginning of period | $ 31.87 | $ 29.66 | $ 32.32 | $ 28.78 | $ 23.90 |
Income from Investment Operations | | | | | |
Net investment income (loss) B | .52 | .57 | .58 | .46 | .44 |
Net realized and unrealized gain (loss) | 8.01 | 2.11 | (2.54) | 3.53 | 4.86 |
Total from investment operations | 8.53 | 2.68 | (1.96) | 3.99 | 5.30 |
Distributions from net investment income | (.61) | (.47) | (.55) | (.41) | (.42) |
Distributions from net realized gain | (.03) | - | (.16) | (.04) | - |
Total distributions | (.64) | (.47) | (.70) G | (.45) | (.42) |
Redemption fees added to paid in capital B,F | - | - | - | - | - |
Net asset value, end of period | $ 39.76 | $ 31.87 | $ 29.66 | $ 32.32 | $ 28.78 |
Total Return A | 27.23% | 9.24% | (6.24)% | 13.96% | 22.80% |
Ratios to Average Net Assets C,E | | | | |
Expenses before reductions | .85% | .83% | .80% | .84% | .88% |
Expenses net of fee waivers, if any | .85% | .83% | .79% | .84% | .88% |
Expenses net of all reductions | .83% | .80% | .75% | .79% | .83% |
Net investment income (loss) | 1.47% | 1.91% | 1.81% | 1.55% | 1.77% |
Supplemental Data | | | | | |
Net assets, end of period (in millions) | $ 2,576 | $ 1,776 | $ 1,245 | $ 1,078 | $ 674 |
Portfolio turnover rate D | 65% | 68% | 75% | 82% | 98% |
A Total returns would have been lower if certain expenses had not been reduced during the applicable periods shown.
B Calculated based on average shares outstanding during the period.
C Fees and expenses of any underlying Fidelity Central Funds are not included in the Fund's expense ratio. The Fund indirectly bears its proportionate share of the expenses of any underlying Fidelity Central Funds.
D Amount does not include the portfolio activity of any underlying Fidelity Central Funds.
E Expense ratios reflect operating expenses of the class. Expenses before reductions do not reflect amounts reimbursed by the investment adviser or reductions from brokerage service arrangements or reductions from other expense offset arrangements and do not represent the amount paid by the class during periods when reimbursements or reductions occur. Expenses net of fee waivers reflect expenses after reimbursement by the investment adviser but prior to reductions from brokerage service arrangements or other expense offset arrangements. Expenses net of all reductions represent the net expenses paid by the class.
F Amount represents less than $.01 per share.
G Total distributions of $.70 per share is comprised of distributions from net investment income of $.548 and distributions from net realized gain of $.155 per share.
See accompanying notes which are an integral part of the financial statements.
Annual Report
Financial Highlights - Institutional Class
Years ended October 31, | 2013 | 2012 | 2011 | 2010 | 2009 |
Selected Per-Share Data | | | | | |
Net asset value, beginning of period | $ 31.87 | $ 29.65 | $ 32.31 | $ 28.77 | $ 23.91 |
Income from Investment Operations | | | | | |
Net investment income (loss) B | .47 | .52 | .54 | .41 | .39 |
Net realized and unrealized gain (loss) | 8.01 | 2.11 | (2.55) | 3.55 | 4.86 |
Total from investment operations | 8.48 | 2.63 | (2.01) | 3.96 | 5.25 |
Distributions from net investment income | (.56) | (.41) | (.50) | (.38) | (.39) |
Distributions from net realized gain | (.03) | - | (.16) | (.04) | - |
Total distributions | (.59) | (.41) | (.65) G | (.42) | (.39) |
Redemption fees added to paid in capital B,F | - | - | - | - | - |
Net asset value, end of period | $ 39.76 | $ 31.87 | $ 29.65 | $ 32.31 | $ 28.77 |
Total Return A | 27.03% | 9.07% | (6.39)% | 13.84% | 22.52% |
Ratios to Average Net Assets C,E | | | | |
Expenses before reductions | 1.00% | 1.00% | .95% | .99% | 1.05% |
Expenses net of fee waivers, if any | 1.00% | 1.00% | .94% | .99% | 1.05% |
Expenses net of all reductions | .97% | .97% | .90% | .95% | 1.00% |
Net investment income (loss) | 1.33% | 1.75% | 1.66% | 1.40% | 1.60% |
Supplemental Data | | | | | |
Net assets, end of period (in millions) | $ 476 | $ 294 | $ 278 | $ 319 | $ 267 |
Portfolio turnover rate D | 65% | 68% | 75% | 82% | 98% |
A Total returns would have been lower if certain expenses had not been reduced during the applicable periods shown.
B Calculated based on average shares outstanding during the period.
C Fees and expenses of any underlying Fidelity Central Funds are not included in the Fund's expense ratio. The Fund indirectly bears its proportionate share of the expenses of any underlying Fidelity Central Funds.
D Amount does not include the portfolio activity of any underlying Fidelity Central Funds.
E Expense ratios reflect operating expenses of the class. Expenses before reductions do not reflect amounts reimbursed by the investment adviser or reductions from brokerage service arrangements or reductions from other expense offset arrangements and do not represent the amount paid by the class during periods when reimbursements or reductions occur. Expenses net of fee waivers reflect expenses after reimbursement by the investment adviser but prior to reductions from brokerage service arrangements or other expense offset arrangements. Expenses net of all reductions represent the net expenses paid by the class.
F Amount represents less than $.01 per share.
G Total distributions of $.65 per share is comprised of distributions from net investment income of $.497 and distributions from net realized gain of $.155 per share.
See accompanying notes which are an integral part of the financial statements.
Annual Report
Financial Highlights - Class Z
Year ended October 31, | 2013 G |
Selected Per-Share Data | |
Net asset value, beginning of period | $ 37.22 |
Income from Investment Operations | |
Net investment income (loss) D | .07 |
Net realized and unrealized gain (loss) | 2.48 |
Total from investment operations | 2.55 |
Redemption fees added to paid in capital D,I | - |
Net asset value, end of period | $ 39.77 |
Total Return B,C | 6.85% |
Ratios to Average Net Assets E,H | |
Expenses before reductions | .85% A |
Expenses net of fee waivers, if any | .85% A |
Expenses net of all reductions | .83% A |
Net investment income (loss) | .76% A |
Supplemental Data | |
Net assets, end of period (000 omitted) | $ 107 |
Portfolio turnover rate F | 65% |
A Annualized
B Total returns for periods of less than one year are not annualized.
C Total returns would have been lower if certain expenses had not been reduced during the applicable periods shown.
D Calculated based on average shares outstanding during the period.
E Fees and expenses of any underlying Fidelity Central Funds are not included in the Fund's expense ratio. The Fund indirectly bears its proportionate share of the expenses of any underlying Fidelity Central Funds.
F Amount does not include the portfolio activity of any underlying Fidelity Central Funds.
G For the period August 13, 2013 (commencement of sale of shares) to October 31, 2013.
H Expense ratios reflect operating expenses of the class. Expenses before reductions do not reflect amounts reimbursed by the investment adviser or reductions from brokerage service arrangements or reductions from other expense offset arrangements and do not represent the amount paid by the class during periods when reimbursements or reductions occur. Expense ratios before reductions for start-up periods may not be representative of longer-term operating periods. Expenses net of fee waivers reflect expenses after reimbursement by the investment adviser but prior to reductions from brokerage service arrangements or other expense offset arrangements. Expenses net of all reductions represent the net expenses paid by the class.
I Amount represents less than $.01 per share.
See accompanying notes which are an integral part of the financial statements.
Annual Report
Notes to Financial Statements
For the period ended October 31, 2013
(Amounts in thousands except percentages)
1. Organization.
Fidelity International Discovery Fund (the Fund) is a fund of Fidelity Investment Trust (the Trust) and is authorized to issue an unlimited number of shares. The Trust is registered under the Investment Company Act of 1940, as amended (the 1940 Act), as an open-end management investment company organized as a Massachusetts business trust. The Fund commenced sale of Class Z shares on August 13, 2013. The Fund offers Class A, Class T, Class C, International Discovery, Class K, Institutional Class and Class Z shares, each of which, along with Class B shares, has equal rights as to assets and voting privileges. Class B shares are closed to new accounts and additional purchases, except for exchanges and reinvestments. Each class has exclusive voting rights with respect to matters that affect that class. Class B shares will automatically convert to Class A shares after a holding period of seven years from the initial date of purchase.
2. Investments in Fidelity Central Funds.
The Fund invests in Fidelity Central Funds, which are open-end investment companies generally available only to other investment companies and accounts managed by Fidelity Management & Research Company (FMR) and its affiliates. The Fund's Schedule of Investments lists each of the Fidelity Central Funds held as of period end, if any, as an investment of the Fund, but does not include the underlying holdings of each Fidelity Central Fund. As an Investing Fund, the Fund indirectly bears its proportionate share of the expenses of the underlying Fidelity Central Funds.
The Money Market Central Funds seek preservation of capital and current income and are managed by Fidelity Investments Money Management, Inc. (FIMM), an affiliate of FMR.
A complete unaudited list of holdings for each Fidelity Central Fund is available upon request or at the Securities and Exchange Commission (the SEC) website at www.sec.gov. In addition, the financial statements of the Fidelity Central Funds, which are not covered by the Fund's Report of Independent Registered Public Accounting Firm, are available on the SEC website or upon request.
3. Significant Accounting Policies.
The financial statements have been prepared in conformity with accounting principles generally accepted in the United States of America (GAAP), which require management to make certain estimates and assumptions at the date of the financial statements. Actual results could differ from those estimates. Subsequent events, if any, through the date that the financial statements were issued have been evaluated in the preparation of
Annual Report
3. Significant Accounting Policies - continued
the financial statements. The following summarizes the significant accounting policies of the Fund:
Investment Valuation. Investments are valued as of 4:00 p.m. Eastern time on the last calendar day of the period. In accordance with valuation policies and procedures approved by the Board of Trustees (the Board), the Fund attempts to obtain prices from one or more third party pricing vendors or brokers to value its investments. When current market prices, quotations or currency exchange rates are not readily available or reliable, investments will be fair valued in good faith by the FMR Fair Value Committee (the Committee), in accordance with procedures adopted by the Board. Factors used in determining fair value vary by investment type and may include market or investment specific events, changes in interest rates and credit quality. The frequency with which these procedures are used cannot be predicted and they may be utilized to a significant extent. The Committee oversees the Fund's valuation policies and procedures and is responsible for approving and reporting to the Board all fair value determinations.
The Fund categorizes the inputs to valuation techniques used to value its investments into a disclosure hierarchy consisting of three levels as shown below:
Level 1 - quoted prices in active markets for identical investments
Level 2 - other significant observable inputs (including quoted prices for similar investments, interest rates, prepayment speeds, etc.)
Level 3 - unobservable inputs (including the Fund's own assumptions based on the best information available)
Valuation techniques used to value the Fund's investments by major category are as follows:
Equity securities, including restricted securities, for which market quotations are readily available, are valued at the last reported sale price or official closing price as reported by a third party pricing vendor on the primary market or exchange on which they are traded and are categorized as Level 1 in the hierarchy. In the event there were no sales during the day or closing prices are not available, securities are valued at the last quoted bid price or may be valued using the last available price and are generally categorized as Level 2 in the hierarchy. For foreign equity securities, when market or security specific events arise, comparisons to the valuation of American Depositary Receipts (ADRs), futures contracts, Exchange-Traded Funds (ETFs) and certain indexes as well as quoted prices for similar securities may be used and would be categorized as Level 2 in the hierarchy. Utilizing these techniques may result in transfers between Level 1 and Level 2. For equity securities, including restricted securities, where observable inputs are
Annual Report
Notes to Financial Statements - continued
(Amounts in thousands except percentages)
3. Significant Accounting Policies - continued
Investment Valuation - continued
limited, assumptions about market activity and risk are used and these securities may be categorized as Level 3 in the hierarchy.
Debt securities, including restricted securities, are valued based on evaluated prices received from third party pricing vendors or from brokers who make markets in such securities. For U.S. government and government agency obligations, pricing vendors utilize matrix pricing which considers yield or price of bonds of comparable quality, coupon, maturity and type as well as broker-supplied prices. When independent prices are unavailable or unreliable, debt securities may be valued utilizing pricing methodologies which consider similar factors that would be used by third party pricing vendors. Debt securities are generally categorized as Level 2 in the hierarchy but may be Level 3 depending on the circumstances.
Futures contracts are valued at the settlement price established each day by the board of trade or exchange on which they are traded and are categorized as Level 1 in the hierarchy. Investments in open-end mutual funds, including the Fidelity Central Funds, are valued at their closing net asset value (NAV) each business day and are categorized as Level 1 in the hierarchy.
Changes in valuation techniques may result in transfers in or out of an assigned level within the disclosure hierarchy. The aggregate value of investments by input level, as of October 31, 2013, including information on transfers between Levels 1 and 2, is included at the end of the Fund's Schedule of Investments.
Foreign Currency. The Fund may use foreign currency contracts to facilitate transactions in foreign-denominated securities. Gains and losses from these transactions may arise from changes in the value of the foreign currency or if the counterparties do not perform under the contracts' terms.
Foreign-denominated assets, including investment securities, and liabilities are translated into U.S. dollars at the exchange rates at period end. Purchases and sales of investment securities, income and dividends received and expenses denominated in foreign currencies are translated into U.S. dollars at the exchange rate in effect on the transaction date.
The effects of exchange rate fluctuations on investments are included with the net realized and unrealized gain (loss) on investment securities. Other foreign currency transactions resulting in realized and unrealized gain (loss) are disclosed separately.
Investment Transactions and Income. For financial reporting purposes, the Fund's investment holdings and NAV include trades executed through the end of the last business day of the period. The NAV per share for processing shareholder transactions is
Annual Report
3. Significant Accounting Policies - continued
Investment Transactions and Income - continued
calculated as of the close of business of the New York Stock Exchange (NYSE), normally 4:00 p.m. Eastern time and includes trades executed through the end of the prior business day. Gains and losses on securities sold are determined on the basis of identified cost. Dividend income is recorded on the ex-dividend date, except for certain dividends from foreign securities where the ex-dividend date may have passed, which are recorded as soon as the Fund is informed of the ex-dividend date. Non-cash dividends included in dividend income, if any, are recorded at the fair market value of the securities received. Distributions received on securities that represent a return of capital or capital gain are recorded as a reduction of cost of investments and/or as a realized gain. Subsequent to ex-dividend date the Fund determines the components of these distributions, based upon receipt of tax filings or other correspondence relating to the underlying investment. Interest income and distributions from the Fidelity Central Funds are accrued as earned. Interest income includes coupon interest and amortization of premium and accretion of discount on debt securities. Investment income is recorded net of foreign taxes withheld where recovery of such taxes is uncertain.
Class Allocations and Expenses. Investment income, realized and unrealized capital gains and losses, common expenses of the Fund, and certain fund-level expense reductions, if any, are allocated daily on a pro-rata basis to each class based on the relative net assets of each class to the total net assets of the Fund. Each class differs with respect to transfer agent and distribution and service plan fees incurred. Certain expense reductions may also differ by class. For the reporting period, the allocated portion of income and expenses to each class as a percent of its average net assets may vary due to the timing of recording these transactions in relation to fluctuating net assets of the classes. Expenses directly attributable to a fund are charged to that fund. Expenses attributable to more than one fund are allocated among the respective funds on the basis of relative net assets or other appropriate methods. Expense estimates are accrued in the period to which they relate and adjustments are made when actual amounts are known.
Deferred Trustee Compensation. Under a Deferred Compensation Plan (the Plan), independent Trustees may elect to defer receipt of a portion of their annual compensation. Deferred amounts are invested in a cross-section of Fidelity funds, are marked-to-market and remain in the Fund until distributed in accordance with the Plan. The investment of deferred amounts and the offsetting payable to the Trustees are included in the accompanying Statement of Assets and Liabilities.
Income Tax Information and Distributions to Shareholders. Each year, the Fund intends to qualify as a regulated investment company under Subchapter M of the Internal Revenue Code, including distributing substantially all of its taxable income and realized gains. As a result, no provision for U.S. Federal income taxes is required. As of
Annual Report
Notes to Financial Statements - continued
(Amounts in thousands except percentages)
3. Significant Accounting Policies - continued
Income Tax Information and Distributions to Shareholders - continued
October 31, 2013, the Fund did not have any unrecognized tax benefits in the financial statements; nor is the Fund aware of any tax positions for which it is reasonably possible that the total amounts of unrecognized tax benefits will significantly change in the next twelve months. The Fund files a U.S. federal tax return, in addition to state and local tax returns as required. The Fund's federal income tax returns are subject to examination by the Internal Revenue Service (IRS) for a period of three fiscal years after they are filed. State and local tax returns may be subject to examination for an additional fiscal year depending on the jurisdiction. Foreign taxes are provided for based on the Fund's understanding of the tax rules and rates that exist in the foreign markets in which it invests.
Distributions are declared and recorded on the ex-dividend date. Income dividends and capital gain distributions are declared separately for each class. Income and capital gain distributions are determined in accordance with income tax regulations, which may differ from GAAP.
Capital accounts within the financial statements are adjusted for permanent book-tax differences. These adjustments have no impact on net assets or the results of operations. Temporary book-tax differences will reverse in a subsequent period.
Book-tax differences are primarily due to futures contracts, foreign currency transactions, passive foreign investment companies (PFIC), market discount, deferred trustees compensation, capital loss carryforwards and losses deferred due to wash sales.
The federal tax cost of investment securities and unrealized appreciation (depreciation) as of period end were as follows:
Gross unrealized appreciation | $ 2,288,825 |
Gross unrealized depreciation | (128,376) |
Net unrealized appreciation (depreciation) on securities and other investments | $ 2,160,449 |
| |
Tax Cost | $ 9,169,453 |
The tax-based components of distributable earnings as of period end were as follows:
Undistributed ordinary income | $ 219,779 |
Capital loss carryforward | $ (950,903) |
Net unrealized appreciation (depreciation) | $ 2,159,295 |
Annual Report
3. Significant Accounting Policies - continued
Income Tax Information and Distributions to Shareholders - continued
Capital loss carryforwards are only available to offset future capital gains of the Fund to the extent provided by regulations and may be limited. Under the Regulated Investment Company Modernization Act of 2010 (the Act), the Fund is permitted to carry forward capital losses incurred in taxable years beginning after December 22, 2010 for an unlimited period and such capital losses are required to be used prior to any losses that expire. The capital loss carryforward information presented below, including any applicable limitation, is estimated as of fiscal period end and is subject to adjustment.
Fiscal year of expiration | |
2017 | $ (950,903) |
The tax character of distributions paid was as follows:
| October 31, 2013 | October 31, 2012 |
Ordinary Income | $ 154,444 | $ 118,968 |
Short-Term Trading (Redemption) Fees. Shares held by investors in the Fund less than 30 days may have been subject to a redemption fee equal to 1.00% of the net asset value of shares redeemed. All redemption fees, which reduce the proceeds of the shareholder redemption, are retained by the Fund and accounted for as an addition to paid in capital.
New Accounting Pronouncement. The Financial Accounting Standards Board issued in December 2011, Accounting Standard Update No. 2011-11, Disclosures about Offsetting Assets and Liabilities, and in January 2013, Accounting Standards Update No. 2013-1 Clarifying the Scope of Disclosures about Offsetting Assets and Liabilities. These updates create new disclosure requirements requiring entities to disclose both gross and net information for derivatives and other financial instruments that are either offset in the Statement of Assets and Liabilities or subject to an enforceable master netting arrangement or similar agreement. The disclosure requirements are effective for annual reporting periods beginning on or after January 1, 2013, and interim periods within those annual periods. Management expects that the impact of the updates' adoption will be limited to additional financial statement disclosures as applicable.
4. Derivative Instruments.
Risk Exposures and the Use of Derivative Instruments. The Fund's investment objective allows the Fund to enter into various types of derivative contracts, including futures contracts. Derivatives are investments whose value is primarily derived from underlying assets, indices or reference rates and may be transacted on an exchange or
Annual Report
Notes to Financial Statements - continued
(Amounts in thousands except percentages)
4. Derivative Instruments - continued
Risk Exposures and the Use of Derivative Instruments - continued
over-the-counter (OTC). Derivatives may involve a future commitment to buy or sell a specified asset based on specified terms, to exchange future cash flows at periodic intervals based on a notional principal amount, or for one party to make one or more payments upon the occurrence of specified events in exchange for periodic payments from the other party.
The Fund used derivatives to increase returns and to manage exposure to certain risks as defined below. The success of any strategy involving derivatives depends on analysis of numerous economic factors, and if the strategies for investment do not work as intended, the Fund may not achieve its objectives.
The Fund's use of derivatives increased or decreased its exposure to the following risk:
Equity Risk | Equity risk relates to the fluctuations in the value of financial instruments as a result of changes in market prices (other than those arising from interest rate risk or foreign exchange risk), whether caused by factors specific to an individual investment, its issuer, or all factors affecting all instruments traded in a market or market segment. |
The Fund is also exposed to additional risks from investing in derivatives, such as liquidity risk and counterparty credit risk. Liquidity risk is the risk that the Fund will be unable to close out the derivative in the open market in a timely manner. Counterparty credit risk is the risk that the counterparty will not be able to fulfill its obligation to the Fund. Counterparty credit risk related to exchange-traded futures contracts may be mitigated by the protection provided by the exchange on which they trade.
Investing in derivatives may involve greater risks than investing in the underlying assets directly and, to varying degrees, may involve risk of loss in excess of any initial investment and collateral received and amounts recognized in the Statement of Assets and Liabilities. In addition, there may be the risk that the change in value of the derivative contract does not correspond to the change in value of the underlying instrument.
Futures Contracts. A futures contract is an agreement between two parties to buy or sell a specified underlying instrument for a fixed price at a specified future date. The Fund used futures contracts to manage its exposure to the stock market.
Upon entering into a futures contract, a fund is required to deposit either cash or securities (initial margin) with a clearing broker in an amount equal to a certain percentage of the face value of the contract. Futures contracts are marked-to-market daily and subsequent daily payments (variation margin) are made or received by a fund depending on the daily fluctuations in the value of the futures contracts and are recorded as unrealized
Annual Report
4. Derivative Instruments - continued
Futures Contracts - continued
appreciation or (depreciation). This receivable and/or payable, if any, is included in daily variation margin for derivative instruments in the Statement of Assets and Liabilities. Realized gain or (loss) is recorded upon the expiration or closing of a futures contract.
Any open futures contracts at period end are presented in the Schedule of Investments under the caption "Futures Contracts." The underlying face amount at value reflects each contract's exposure to the underlying instrument or index at period end and is representative of activity for the period. Securities deposited to meet initial margin requirements are identified in the Schedule of Investments.
During the period the Fund recognized net realized gain (loss) of $51,368 and a change in net unrealized appreciation (depreciation) of $4,238 related to its investment in futures contracts. These amounts are included in the Statement of Operations.
5. Purchases and Sales of Investments.
Purchases and sales of securities, other than short-term securities, aggregated $6,591,378 and $5,993,057, respectively.
6. Fees and Other Transactions with Affiliates.
Management Fee. FMR and its affiliates provide the Fund with investment management related services for which the Fund pays a monthly management fee. The management fee is the sum of an individual fund fee rate that is based on an annual rate of .45% of the Fund's average net assets and an annualized group fee rate that averaged .25% during the period. The group fee rate is based upon the average net assets of all the mutual funds advised by FMR, including any mutual funds previously advised by FMR that are currently advised by Fidelity SelectCo, LLC, an affiliate of FMR. The group fee rate decreases as assets under management increase and increases as assets under management decrease. In addition, the management fee is subject to a performance adjustment (up to a maximum of ± .20% of the Fund's average net assets over a 36 month performance period). The upward or downward adjustment to the management fee is based on the relative investment performance of International Discovery as compared to an appropriate benchmark index over the same 36 month performance period. For the reporting period, the total annual management fee rate, including the performance adjustment, was .77% of the Fund's average net assets. The performance adjustment included in the management fee rate may be higher or lower than the maximum performance adjustment rate due to the difference between the average net assets for the reporting and performance periods.
Annual Report
Notes to Financial Statements - continued
(Amounts in thousands except percentages)
6. Fees and Other Transactions with Affiliates - continued
Distribution and Service Plan Fees. In accordance with Rule 12b-1 of the 1940 Act, the Fund has adopted separate Distribution and Service Plans for each class of shares. Certain classes pay Fidelity Distributors Corporation (FDC), an affiliate of FMR, separate Distribution and Service Fees, each of which is based on an annual percentage of each class' average net assets. In addition, FDC may pay financial intermediaries for selling shares of the Fund and providing shareholder support services. For the period, the Distribution and Service Fee rates, total fees and amounts retained by FDC were as follows:
| Distribution
Fee | Service
Fee | Total Fees | Retained
by FDC |
Class A | -% | .25% | $ 796 | $ 9 |
Class T | .25% | .25% | 243 | 2 |
Class B | .75% | .25% | 69 | 52 |
Class C | .75% | .25% | 324 | 25 |
| | | $ 1,432 | $ 88 |
Sales Load. FDC may receive a front-end sales charge of up to 5.75% for selling Class A shares and 3.50% for selling Class T shares, some of which is paid to financial intermediaries for selling shares of the Fund. Depending on the holding period, FDC may receive contingent deferred sales charges levied on Class A, Class T, Class B, and Class C redemptions. The deferred sales charges range from 5.00% to 1.00% for Class B shares, 1.00% for Class C shares, 1.00% for certain purchases of Class A shares and .25% for certain purchases of Class T shares.
For the period, sales charge amounts retained by FDC were as follows:
| Retained
by FDC |
Class A | $ 56 |
Class T | 5 |
Class B* | 9 |
Class C* | 2 |
| $ 72 |
* When Class B and Class C shares are initially sold, FDC pays commissions from its own resources to financial intermediaries through which the sales are made.
Transfer Agent Fees. Fidelity Investments Institutional Operations Company, Inc., (FIIOC), an affiliate of FMR, is the transfer, dividend disbursing and shareholder servicing agent for each class of the Fund. FIIOC receives account fees and asset-based fees that vary according to the account size and type of account of the shareholders of the respective classes of the Fund, except for Class Z. FIIOC receives an asset-based fee of
Annual Report
6. Fees and Other Transactions with Affiliates - continued
Transfer Agent Fees - continued
Class K's and Class Z's average net assets. FIIOC pays for typesetting, printing and mailing of shareholder reports, except proxy statements.
For the period, transfer agent fees for each applicable class were as follows:
| Amount | % of
Average
Net Assets |
Class A | $ 954 | .30 |
Class T | 141 | .29 |
Class B | 21 | .30 |
Class C | 96 | .29 |
International Discovery | 13,480 | .20 |
Class K | 1,069 | .05 |
Institutional Class | 713 | .19 |
Class Z | -* | .05** |
| $ 16,474 | |
* Amount represents eleven dollars.
** Annualized
Accounting and Security Lending Fees. Fidelity Service Company, Inc. (FSC), an affiliate of FMR, maintains the Fund's accounting records. The accounting fee is based on the level of average net assets for each month. Under a separate contract, FSC administers the security lending program. The security lending fee is based on the number and duration of lending transactions.
Brokerage Commissions. The Fund placed a portion of its portfolio transactions with brokerage firms which are affiliates of the investment adviser. Brokerage commissions are included in net realized gain (loss) and change in net unrealized appreciation (depreciation) in the Statement of Operations. The commissions paid to these affiliated firms were $4 for the period.
7. Committed Line of Credit.
The Fund participates with other funds managed by FMR or an affiliate in a $4.25 billion credit facility (the "line of credit") to be utilized for temporary or emergency purposes to fund shareholder redemptions or for other short-term liquidity purposes. The Fund has agreed to pay commitment fees on its pro-rata portion of the line of credit, which amounted to $20 and is reflected in Miscellaneous expenses on the Statement of Operations. During the period, there were no borrowings on this line of credit.
Annual Report
Notes to Financial Statements - continued
(Amounts in thousands except percentages)
8. Security Lending.
The Fund lends portfolio securities through a lending agent from time to time in order to earn additional income. For equity securities, a lending agent is used and may loan securities to certain qualified borrowers, including Fidelity Capital Markets (FCM), a broker-dealer affiliated with the Fund. On the settlement date of the loan, the Fund receives collateral (in the form of U.S. Treasury obligations, letters of credit and/or cash) against the loaned securities and maintains collateral in an amount not less than 100% of the market value of the loaned securities during the period of the loan. The market value of the loaned securities is determined at the close of business of the Fund and any additional required collateral is delivered to the Fund on the next business day. If the borrower defaults on its obligation to return the securities loaned because of insolvency or other reasons, the Fund may apply collateral received from the borrower against the obligation. The Fund may experience delays and costs in recovering the securities loaned. Any cash collateral received is invested in the Fidelity Securities Lending Cash Central Fund. The value of loaned securities and cash collateral at period end are disclosed on the Fund's Statement of Assets and Liabilities. At period end, there were no security loans outstanding with FCM. Security lending income represents the income earned on investing cash collateral, less rebates paid to borrowers and any lending agent fees associated with the loan, plus any premium payments received for lending certain types of securities. Security lending income is presented in the Statement of Operations as a component of income from Fidelity Central Funds. Total security lending income during the period amounted to $5,441, including $40 from securities loaned to FCM.
9. Expense Reductions.
FMR voluntarily agreed to reimburse a portion of the following class' operating expense.
During the period, this reimbursement reduced expenses as follows:
| Reimbursement |
International Discovery | $ 10 |
Class K | 3 |
Institutional Class | 1 |
| $ 14 |
Commissions paid to certain brokers with whom FMR, or its affiliates, places trades on behalf of the Fund include an amount in addition to trade execution, which may be rebated back to the Fund to offset certain expenses. This amount totaled $2,236 for the period.
In addition, FMR reimbursed a portion of the Fund's operating expenses during the period in the amount of $61.
Annual Report
10. Distributions to Shareholders.
Distributions to shareholders of each class were as follows:
Years ended October 31, | 2013 | 2012 |
From net investment income | | |
Class A | $ 4,138 | $ 3,123 |
Class T | 492 | 388 |
Class B | 34 | 6 |
Class C | 186 | 44 |
International Discovery | 101,466 | 90,633 |
Class K | 34,651 | 20,917 |
Institutional Class | 5,064 | 3,857 |
Total | $ 146,031 | $ 118,968 |
From net realized gain | | |
Class A | $ 297 | $ - |
Class T | 46 | - |
Class B | 7 | - |
Class C | 30 | - |
International Discovery | 5,914 | - |
Class K | 1,827 | - |
Institutional Class | 292 | - |
Total | $ 8,413 | $ - |
11. Share Transactions.
Transactions for each class of shares were as follows:
| Shares | Dollars |
Years ended October 31, | 2013 A | 2012 | 2013 A | 2012 |
Class A | | | | |
Shares sold | 1,772 | 1,927 | $ 62,186 | $ 56,732 |
Reinvestment of distributions | 132 | 101 | 4,249 | 2,828 |
Shares redeemed | (2,553) | (3,468) | (88,988) | (100,935) |
Net increase (decrease) | (649) | (1,440) | $ (22,553) | $ (41,375) |
Class T | | | | |
Shares sold | 227 | 220 | $ 7,911 | $ 6,409 |
Reinvestment of distributions | 16 | 13 | 512 | 369 |
Shares redeemed | (347) | (860) | (11,997) | (25,207) |
Net increase (decrease) | (104) | (627) | $ (3,574) | $ (18,429) |
Class B | | | | |
Shares sold | 4 | 3 | $ 137 | $ 87 |
Reinvestment of distributions | 1 | - | 39 | 5 |
Shares redeemed | (75) | (113) | (2,570) | (3,297) |
Net increase (decrease) | (70) | (110) | $ (2,394) | $ (3,205) |
Annual Report
Notes to Financial Statements - continued
(Amounts in thousands except percentages)
11. Share Transactions - continued
| Shares | Dollars |
Years ended October 31, | 2013 A | 2012 | 2013 A | 2012 |
Class C | | | | |
Shares sold | 184 | 212 | $ 6,532 | $ 6,111 |
Reinvestment of distributions | 6 | 1 | 193 | 39 |
Shares redeemed | (207) | (395) | (7,250) | (11,440) |
Net increase (decrease) | (17) | (182) | $ (525) | $ (5,290) |
International Discovery | | | | |
Shares sold | 37,338 | 20,324 | $ 1,332,523 | $ 608,478 |
Reinvestment of distributions | 3,176 | 3,081 | 102,608 | 86,858 |
Shares redeemed | (31,569) | (65,748) | (1,103,313) | (1,937,202) |
Net increase (decrease) | 8,945 | (42,343) | $ 331,818 | $ (1,241,866) |
Class K | | | | |
Shares sold | 19,989 | 26,836 | $ 699,723 | $ 788,860 |
Reinvestment of distributions | 1,132 | 744 | 36,478 | 20,917 |
Shares redeemed | (12,053) | (13,817) | (423,712) | (410,022) |
Net increase (decrease) | 9,068 | 13,763 | $ 312,489 | $ 399,755 |
Institutional Class | | | | |
Shares sold | 4,893 | 2,049 | $ 175,669 | $ 59,460 |
Reinvestment of distributions | 68 | 53 | 2,182 | 1,502 |
Shares redeemed | (2,219) | (2,256) | (78,500) | (65,914) |
Net increase (decrease) | 2,742 | (154) | $ 99,351 | $ (4,952) |
Class Z | | | | |
Shares sold | 3 | - | $ 100 | $ - |
Net increase (decrease) | 3 | - | $ 100 | $ - |
A Share transactions for Class Z are for the period August 13, 2013 (commencement of sale of shares) to October 31, 2013.
12. Other.
The Fund's organizational documents provide former and current trustees and officers with a limited indemnification against liabilities arising in connection with the performance of their duties to the Fund. In the normal course of business, the Fund may also enter into contracts that provide general indemnifications. The Fund's maximum exposure under these arrangements is unknown as this would be dependent on future claims that may be made against the Fund. The risk of material loss from such claims is considered remote.
At the end of the period, Strategic Advisers International Fund was the owner of record of approximately 11% of the total outstanding shares of the Fund.
Annual Report
To the Trustees of Fidelity Investment Trust and the Shareholders of Fidelity International Discovery Fund:
In our opinion, the accompanying statement of assets and liabilities, including the schedule of investments, and the related statements of operations and of changes in net assets and the financial highlights present fairly, in all material respects, the financial position of Fidelity International Discovery Fund (a fund of Fidelity Investment Trust) at October 31, 2013, the results of its operations for the year then ended, the changes in its net assets for each of the two years in the period then ended and the financial highlights for each of the periods indicated, in conformity with accounting principles generally accepted in the United States of America. These financial statements and financial highlights (hereafter referred to as "financial statements") are the responsibility of the Fidelity International Discovery Fund's management. Our responsibility is to express an opinion on these financial statements based on our audits. We conducted our audits of these financial statements in accordance with the standards of the Public Company Accounting Oversight Board (United States). Those standards require that we plan and perform the audit to obtain reasonable assurance about whether the financial statements are free of material misstatement. An audit includes examining, on a test basis, evidence supporting the amounts and disclosures in the financial statements, assessing the accounting principles used and significant estimates made by management, and evaluating the overall financial statement presentation. We believe that our audits, which included confirmation of securities at October 31, 2013 by correspondence with the custodian and brokers, provide a reasonable basis for our opinion.
PricewaterhouseCoopers LLP
Boston, Massachusetts
December 16, 2013
Annual Report
The Trustees, Member of the Advisory Board, and executive officers of the trust and fund, as applicable, are listed below. The Board of Trustees governs the fund and is responsible for protecting the interests of shareholders. The Trustees are experienced executives who meet periodically throughout the year to oversee the fund's activities, review contractual arrangements with companies that provide services to the fund, oversee management of the risks associated with such activities and contractual arrangements, and review the fund's performance. Except for James C. Curvey, Ned C. Lautenbach, Ronald P. O'Hanley, and William S. Stavropoulos, each of the Trustees oversees 171 funds. Mr. Curvey oversees 394 funds. Mr. Lautenbach, Mr. O'Hanley, and Mr. Stavropoulos each oversees 245 funds.
The Trustees hold office without limit in time except that (a) any Trustee may resign; (b) any Trustee may be removed by written instrument, signed by at least two-thirds of the number of Trustees prior to such removal; (c) any Trustee who requests to be retired or who has become incapacitated by illness or injury may be retired by written instrument signed by a majority of the other Trustees; and (d) any Trustee may be removed at any special meeting of shareholders by a two-thirds vote of the outstanding voting securities of the trust. Each Trustee who is not an interested person of the trust and the fund (as defined in the 1940 Act) (Independent Trustee), shall retire not later than the last day of the calendar year in which his or her 75th birthday occurs. The Independent Trustees may waive this mandatory retirement age policy with respect to individual Trustees. The executive officers and Advisory Board Member hold office without limit in time, except that any officer and Advisory Board Member may resign or may be removed by a vote of a majority of the Trustees at any regular meeting or any special meeting of the Trustees. Except as indicated, each individual has held the office shown or other offices in the same company for the past five years.
Experience, Skills, Attributes, and Qualifications of the Fund's Trustees. The Governance and Nominating Committee has adopted a statement of policy that describes the experience, qualifications, attributes, and skills that are necessary and desirable for potential Independent Trustee candidates (Statement of Policy). The Board believes that each Trustee satisfied at the time he or she was initially elected or appointed a Trustee, and continues to satisfy, the standards contemplated by the Statement of Policy. The Governance and Nominating Committee also engages professional search firms to help identify potential Independent Trustee candidates who have the experience, qualifications, attributes, and skills consistent with the Statement of Policy. From time to time, additional criteria based on the composition and skills of the current Independent Trustees, as well as experience or skills that may be appropriate in light of future changes to board composition, business conditions, and regulatory or other developments, have also been considered by the professional search firms and the Governance and Nominating Committee. In addition, the Board takes into account the Trustees' commitment and participation in Board and committee meetings, as well as their leadership of standing and ad hoc committees throughout their tenure.
Annual Report
In determining that a particular Trustee was and continues to be qualified to serve as a Trustee, the Board has considered a variety of criteria, none of which, in isolation, was controlling. The Board believes that, collectively, the Trustees have balanced and diverse experience, qualifications, attributes, and skills, which allow the Board to operate effectively in governing the fund and protecting the interests of shareholders. Information about the specific experience, skills, attributes, and qualifications of each Trustee, which in each case led to the Board's conclusion that the Trustee should serve (or continue to serve) as a trustee of the fund, is provided below.
Board Structure and Oversight Function. James C. Curvey is an interested person (as defined in the 1940 Act) and currently serves as Chairman. The Trustees have determined that an interested Chairman is appropriate and benefits shareholders because an interested Chairman has a personal and professional stake in the quality and continuity of services provided to the fund. Independent Trustees exercise their informed business judgment to appoint an individual of their choosing to serve as Chairman, regardless of whether the Trustee happens to be independent or a member of management. The Independent Trustees have determined that they can act independently and effectively without having an Independent Trustee serve as Chairman and that a key structural component for assuring that they are in a position to do so is for the Independent Trustees to constitute a substantial majority for the Board. The Independent Trustees also regularly meet in executive session. Ned C. Lautenbach serves as Chairman of the Independent Trustees and as such (i) acts as a liaison between the Independent Trustees and management with respect to matters important to the Independent Trustees and (ii) with management prepares agendas for Board meetings.
Fidelity funds are overseen by different Boards of Trustees. The fund's Board oversees Fidelity's equity and high income funds and another Board oversees Fidelity's investment-grade bond, money market, and asset allocation funds. The asset allocation funds may invest in Fidelity funds overseen by the fund's Board. The use of separate Boards, each with its own committee structure, allows the Trustees of each group of Fidelity funds to focus on the unique issues of the funds they oversee, including common research, investment, and operational issues. On occasion, the separate Boards establish joint committees to address issues of overlapping consequences for the Fidelity funds overseen by each Board.
The Trustees operate using a system of committees to facilitate the timely and efficient consideration of all matters of importance to the Trustees, the fund, and fund shareholders and to facilitate compliance with legal and regulatory requirements and oversight of the fund's activities and associated risks. The Board, acting through its committees, has charged FMR and its affiliates with (i) identifying events or circumstances the occurrence of which could have demonstrably adverse effects on the fund's business and/or reputation; (ii) implementing processes and controls to lessen the possibility that such events or circumstances occur or to mitigate the effects of such events or circumstances if they do occur; and (iii) creating and maintaining a system designed to evaluate continuously business and market conditions in order to facilitate the identification and implementation processes described in (i) and (ii) above. Because the day-to-day operations and activities of the fund are carried out by or through FMR, its affiliates and other service providers, the fund's exposure to risks is mitigated but not eliminated by the processes overseen by the Trustees. While each of the Board's committees has responsibility for overseeing different aspects of the fund's activities, oversight is exercised primarily through the Operations, Audit, and Compliance Committees. In addition, the Independent Trustees have worked with FMR to enhance the Board's oversight of investment and financial risks, legal and regulatory risks, technology risks, and operational risks, including the development of additional risk reporting to the Board. For example, a working group comprised of Independent Trustees and FMR has worked and continues to work to review the Fidelity funds' valuation-related activities, reporting and risk management. Appropriate personnel, including but not limited to the fund's Chief Compliance Officer (CCO), FMR's internal auditor, the independent accountants, the fund's Treasurer and portfolio management personnel, make periodic reports to the Board's committees, as appropriate, including an annual review of FMR's risk management program for the Fidelity funds. The responsibilities of each standing committee, including their oversight responsibilities, are described further under "Standing Committees of the Fund's Trustees."
Annual Report
Trustees and Officers - continued
The fund's Statement of Additional Information (SAI) includes more information about the Trustees. To request a free copy, call Fidelity at 1-800-835-5092.
Interested Trustees*:
Correspondence intended for each Trustee who is an interested person may be sent to Fidelity Investments, 245 Summer Street, Boston, Massachusetts 02210.
Name, Year of Birth; Principal Occupations and Other Relevant Experience+ |
James C. Curvey (1935) |
Year of Election or Appointment: 2007 Trustee Chairman of the Board of Trustees |
| Mr. Curvey also serves as Trustee of other Fidelity funds. Mr. Curvey is a Director of Fidelity Investments Money Management, Inc. (2009-present), Director of Fidelity Research & Analysis Co. (2009-present) and Director of FMR and FMR Co., Inc. (2007-present). Mr. Curvey is also Vice Chairman (2007-present) and Director of FMR LLC. In addition, Mr. Curvey serves as an Overseer for the Boston Symphony Orchestra and a member of the Trustees of Villanova University. Previously, Mr. Curvey was the Vice Chairman (2006-2007) and Director (2000-2007) of FMR Corp. |
Ronald P. O'Hanley (1957) |
Year of Election or Appointment: 2011 Trustee |
| Mr. O'Hanley also serves as Trustee of other Fidelity funds. He is Director of Fidelity SelectCo, LLC (2013-present), FMR Co., Inc. (2010-present), Director of Fidelity Investments Money Management, Inc. (2010-present), Director of Fidelity Research & Analysis Company (2010-present), President of Fidelity Asset Management and Corporate Services and a Member of Fidelity's Executive Committee (2010-present). Previously, Mr. O'Hanley served as President and Chief Executive Officer of BNY Mellon Asset Management (2007-2010). Mr. O'Hanley also served as Vice Chairman of Bank New York Mellon Corp. and a member of that firm's Executive Committee. Prior to the 2007 merger of The Bank of New York and Mellon Financial Corporation, he was Vice Chairman of Mellon Financial Corporation and President and Chief Executive Officer of Mellon Asset Management. He joined Mellon in February 1997. Mr. O'Hanley currently serves as Chairman of the Boston Public Library Foundation Board of Directors and sits on the Board of Directors of Beth Israel Deaconess Medical Center, the Board of Trustees of the Marine Biological Laboratory and the Advisory Board of the Maxwell School of Citizenship and Public Administration at Syracuse University. Mr. O'Hanley also chairs the Council on Asset Management for the Financial Services Roundtable and is a member of the Board of Directors of Institutional Investor's U.S. Institute. |
* Trustees have been determined to be "Interested Trustees" by virtue of, among other things, their affiliation with the trust or various entities under common control with FMR.
+ The information above includes each Trustee's principal occupation during the last five years and other information relating to the experience, attributes, and skills relevant to each Trustee's qualifications to serve as a Trustee, which led to the conclusion that each Trustee should serve as a Trustee for the fund.
Annual Report
Trustees and Officers - continued
Independent Trustees:
Correspondence intended for each Independent Trustee (that is, the Trustees other than the Interested Trustees) may be sent to Fidelity Investments, P.O. Box 55235, Boston, Massachusetts 02205-5235.
Name, Year of Birth; Principal Occupations and Other Relevant Experience+ |
Dennis J. Dirks (1948) |
Year of Election or Appointment: 2005 Trustee |
| Mr. Dirks also serves as Trustee of other Fidelity funds. Prior to his retirement in May 2003, Mr. Dirks was Chief Operating Officer and a member of the Board of The Depository Trust & Clearing Corporation (DTCC). He also served as President, Chief Operating Officer, and Board member of The Depository Trust Company (DTC) and President and Board member of the National Securities Clearing Corporation (NSCC). In addition, Mr. Dirks served as Chief Executive Officer and Board member of the Government Securities Clearing Corporation, Chief Executive Officer and Board member of the Mortgage-Backed Securities Clearing Corporation, as a Trustee and a member of the Finance Committee of Manhattan College (2005-2008), and as a Trustee and a member of the Finance Committee of AHRC of Nassau County (2006-2008). Mr. Dirks is a member of the Independent Directors Council (IDC) Governing Council (2010-present) and Board of Directors for The Brookville Center for Children's Services, Inc. (2009-present). |
Alan J. Lacy (1953) |
Year of Election or Appointment: 2008 Trustee |
| Mr. Lacy also serves as Trustee of other Fidelity funds. Mr. Lacy serves as Senior Adviser (2007-present) of Oak Hill Capital Partners, L.P. (private equity). Mr. Lacy also served as Chief Executive Officer (2000-2005) and Vice Chairman (2005-2006) of Sears Holdings Corporation and Sears, Roebuck and Co. (retail). In addition, Mr. Lacy serves as a member of the Board of Directors of Dave & Buster's Entertainment, Inc. (restaurant and entertainment complexes, 2010-present), Earth Fare, Inc. (retail grocery, 2012-present), The Hillman Companies, Inc. (hardware wholesalers, 2010-present), and Bristol-Myers Squibb Company (global pharmaceuticals, 2008-present). Mr. Lacy is a member of the Board of Trustees of The National Parks Conservation Association (2006-present). Previously, Mr. Lacy served as Chairman of the Board of Trustees of the National Parks Conservation Association (2008-2011) and as a member of the Board of Directors for the Western Union Company (global money transfer, 2006-2011). |
Ned C. Lautenbach (1944) |
Year of Election or Appointment: 2000 Trustee Chairman of the Independent Trustees |
| Mr. Lautenbach also serves as Trustee of other Fidelity funds. Mr. Lautenbach currently serves as the Lead Director of the Eaton Corporation Board of Directors (diversified industrial, 1997-present). Mr. Lautenbach is Chairman of the Board of Directors of the Philharmonic Center for the Arts in Naples, Florida (2012-present) and a member of the Council on Foreign Relations (1994-present). Previously, Mr. Lautenbach was a Partner/Advisory Partner at Clayton, Dubilier & Rice, LLC (private equity investment, 1998-2010), as well as a Director of Sony Corporation (2006-2007). |
Joseph Mauriello (1944) |
Year of Election or Appointment: 2008 Trustee |
| Mr. Mauriello also serves as Trustee of other Fidelity funds. Prior to his retirement in January 2006, Mr. Mauriello served in numerous senior management positions including Deputy Chairman and Chief Operating Officer (2004-2005), and Vice Chairman of Financial Services (2002-2004) of KPMG LLP US (professional services, 1965-2005). Mr. Mauriello currently serves as a member of the Board of Directors of XL Group plc. (global insurance and re-insurance, 2006-present). Previously, Mr. Mauriello served as a Director of the Hamilton Funds of the Bank of New York (2006-2007) and of Arcadia Resources Inc. (health care services and products, 2007-2012). |
Robert W. Selander (1950) |
Year of Election or Appointment: 2011 Trustee |
| Mr. Selander also serves as Trustee of other Fidelity funds. Previously, Mr. Selander served as a Member of the Advisory Board of other Fidelity funds (2011), and Executive Vice Chairman (2010), Chief Executive Officer (2009-2010), and President and Chief Executive Officer (1997-2009) of Mastercard, Inc. |
Cornelia M. Small (1944) |
Year of Election or Appointment: 2005 Trustee |
| Ms. Small also serves as Trustee of other Fidelity funds. Ms. Small is a member of the Board of Directors (2009-present) and Chair of the Investment Committee (2010-present) of the Teagle Foundation. Ms. Small also serves on the Investment Committee of the Berkshire Taconic Community Foundation (2008-present). Previously, Ms. Small served as Chairperson (2002-2008) and a member of the Investment Committee and Chairperson (2008-2012) and a member of the Board of Trustees of Smith College. In addition, Ms. Small served as Chief Investment Officer, Director of Global Equity Investments, and a member of the Board of Directors of Scudder, Stevens & Clark and Scudder Kemper Investments. |
William S. Stavropoulos (1939) |
Year of Election or Appointment: 2001 Trustee Vice Chairman of the Independent Trustees |
| Mr. Stavropoulos also serves as Trustee of other Fidelity funds. Mr. Stavropoulos serves as President and Founder of the Michigan Baseball Foundation, the Great Lakes Loons (2007-present). Mr. Stavropoulos is Chairman Emeritus of the Board of Directors of The Dow Chemical Company, where he previously served in numerous senior management positions, including President, CEO (1995-2000; 2002-2004), Chairman of the Executive Committee (2000-2006), and as a member of the Board of Directors (1990-2006). Currently, Mr. Stavropoulos is Chairman of the Board of Directors of Univar Inc. (global distributor of commodity and specialty chemicals), a Director of Teradata Corporation (data warehousing and technology solutions), and Maersk Inc. (industrial conglomerate), and a member of the Advisory Board for Metalmark Capital LLC (private equity investment, 2005-present). Mr. Stavropoulos is an operating advisor to Clayton, Dubilier & Rice, LLC (private equity investment). In addition, Mr. Stavropoulos is a member of the University of Notre Dame Advisory Council for the College of Science, a Trustee of the Rollin L. Gerstacker Foundation, and a Director of the Naples Philharmonic Center for the Arts. Previously, Mr. Stavropoulos served as a Director of Chemical Financial Corporation (bank holding company, 1993-2012) and Tyco International, Ltd. (multinational manufacturing and services, 2007-2012). |
David M. Thomas (1949) |
Year of Election or Appointment: 2008 Trustee |
| Mr. Thomas also serves as Trustee of other Fidelity funds. Mr. Thomas serves as Non-Executive Chairman of the Board of Directors of Fortune Brands Home and Security (home and security products, 2011-present), and as a member of the Board of Directors of Interpublic Group of Companies, Inc. (marketing communication, 2004-present). Previously, Mr. Thomas served as Executive Chairman (2005-2006) and Chairman and Chief Executive Officer (2000-2005) of IMS Health, Inc. (pharmaceutical and healthcare information solutions), and a Director of Fortune Brands, Inc. (consumer products, 2000-2011). |
+ The information above includes each Trustee's principal occupation during the last five years and other information relating to the experience, attributes, and skills relevant to each Trustee's qualifications to serve as a Trustee, which led to the conclusion that each Trustee should serve as a Trustee for the fund.
Advisory Board Member and Executive Officers:
Correspondence intended for each executive officer and Peter S. Lynch may be sent to Fidelity Investments, 245 Summer Street, Boston, Massachusetts 02210. Executive officers appear below in alphabetical order.
Name, Year of Birth; Principal Occupation |
Peter S. Lynch (1944) |
Year of Election or Appointment: 2003 Member of the Advisory Board |
| Mr. Lynch also serves as Member of the Advisory Board of other Fidelity funds. Mr. Lynch is Vice Chairman and a Director of FMR and FMR Co., Inc. In addition, Mr. Lynch serves as a Trustee of Boston College and as the Chairman of the Inner-City Scholarship Fund. Previously, Mr. Lynch served on the Special Olympics International Board of Directors (1997-2006). |
Elizabeth Paige Baumann (1968) |
Year of Election or Appointment: 2012 Anti-Money Laundering (AML) Officer |
| Ms. Baumann also serves as AML Officer of other funds. She is Chief AML Officer of FMR LLC (2012-present) and is an employee of Fidelity Investments. Previously, Ms. Baumann served as Vice President and Deputy Anti-Money Laundering Officer (2007-2012). |
William C. Coffey (1969) |
Year of Election or Appointment: 2009 Assistant Secretary |
| Mr. Coffey also serves as Assistant Secretary of other funds. He is Senior Vice President and Deputy General Counsel of FMR LLC (2010-present), and is an employee of Fidelity Investments. Previously, Mr. Coffey served as Vice President and Associate General Counsel of FMR LLC (2005-2009). |
Jonathan Davis (1968) |
Year of Election or Appointment: 2010 Assistant Treasurer |
| Mr. Davis also serves as Assistant Treasurer of other funds. Mr. Davis is an employee of Fidelity Investments. Previously, Mr. Davis served as Vice President and Associate General Counsel of FMR LLC (2003-2010). |
Adrien E. Deberghes (1967) |
Year of Election or Appointment: 2008 Deputy Treasurer |
| Mr. Deberghes also serves as an officer of other funds. He is an employee of Fidelity Investments (2008-present). Prior to joining Fidelity Investments, Mr. Deberghes was Senior Vice President of Mutual Fund Administration at State Street Corporation (2007-2008), Senior Director of Mutual Fund Administration at Investors Bank & Trust (2005-2007), and Director of Finance for Dunkin' Brands (2000-2005). |
Stephanie J. Dorsey (1969) |
Year of Election or Appointment: 2010 Assistant Treasurer |
| Ms. Dorsey also serves as an officer of other funds. She is an employee of Fidelity Investments (2008-present) and has served in other fund officer roles. Prior to joining Fidelity Investments, Ms. Dorsey served as Treasurer (2004-2008) of the JPMorgan Mutual Funds and Vice President (2004-2008) of JPMorgan Chase Bank. |
Scott C. Goebel (1968) |
Year of Election or Appointment: 2008 Secretary and Chief Legal Officer (CLO) |
| Mr. Goebel serves as Secretary and CLO of other funds. Mr. Goebel also serves as Secretary of Fidelity Investments Money Management, Inc. (FIMM) (2010-present) and Fidelity Research and Analysis Company (FRAC) (2010-present); General Counsel, Secretary, and Senior Vice President of FMR (2008-present) and FMR Co., Inc. (2008-present); Chief Legal Officer of Fidelity Management & Research (Hong Kong) Limited (2008-present) and Assistant Secretary of Fidelity Management & Research (Japan) Inc. (2008-present), and Fidelity Management & Research (U.K.) Inc. (2008-present). Previously, Mr. Goebel served as Secretary and CLO of other Fidelity funds (2008-2013), Assistant Secretary of FIMM (2008-2010), FRAC (2008-2010), and certain funds (2007-2008); and as Vice President and Secretary of Fidelity Distributors Corporation (FDC) (2005-2007). Mr. Goebel has been employed by FMR LLC or an affiliate since 2001. |
Joseph A. Hanlon (1968) |
Year of Election or Appointment: 2012 Chief Compliance Officer |
| Mr. Hanlon also serves as Chief Compliance Officer of other funds. Mr. Hanlon serves as Compliance Officer of FMR, FMR Co., Inc., Fidelity Investments Money Management, Inc. (FIMM), Fidelity Research and Analysis Company (FRAC), and Fidelity Management & Research (Hong Kong) (2009-present), as Senior Vice President of the Fidelity Asset Management Division (2009-present), and is an employee of Fidelity Investments. Previously, Mr. Hanlon served as Compliance Officer of Fidelity Management & Research (Japan) Inc. (2009-2013), Strategic Advisers, Inc. (2009-2013), and Fidelity Management & Research (U.K.) Inc. (2009-2013). |
Bruce T. Herring (1965) |
Year of Election or Appointment: 2006 Vice President of certain Equity Funds |
| Mr. Herring also serves as Vice President of other funds. He serves as Chief Investment Officer of Fidelity Global Asset Allocation (GAA) (2013-present), Chief Investment Officer and Director of Fidelity Management & Research (U.K.) Inc. (2010-present), Group Chief Investment Officer of FMR, and President of Fidelity Research & Analysis Company (2010-present). Previously, Mr. Herring served as Vice President (2005-2006) and Senior Vice President (2006-2007) of Fidelity Management & Research Company, Vice President of FMR Co., Inc. (2001-2007), and as a portfolio manager for Fidelity U.S. Equity Funds. |
Brian B. Hogan (1964) |
Year of Election or Appointment: 2009 Vice President |
| Mr. Hogan also serves as Vice President of other funds. Mr. Hogan serves as President of FMR's Equity Division (2009-present). Previously, Mr. Hogan served as Senior Vice President, Equity Research of FMR (2006-2009) and as a portfolio manager. |
Chris Maher (1972) |
Year of Election or Appointment: 2013 Assistant Treasurer |
| Mr. Maher serves as Assistant Treasurer of other funds. Mr. Maher is Vice President of Valuation Oversight and is an employee of Fidelity Investments. Previously, Mr. Maher served as Vice President of Asset Management Compliance (2013), Vice President of FMR's Program Management Group (2010-2013), and Vice President of Valuation Oversight (2008-2010). |
Christine Reynolds (1958) |
Year of Election or Appointment: 2008 Chief Financial Officer |
| Ms. Reynolds also serves as Chief Financial Officer of other funds. Ms. Reynolds became President of Fidelity Pricing and Cash Management Services (FPCMS) in August 2008. Ms. Reynolds served as Chief Operating Officer of FPCMS (2007-2008). Previously, Ms. Reynolds served as President, Treasurer, and Anti-Money Laundering officer of the Fidelity funds (2004-2007). |
Kenneth B. Robins (1969) |
Year of Election or Appointment: 2008 President and Treasurer |
| Mr. Robins also serves as an officer of other funds. Mr. Robins serves as Executive Vice President of Fidelity Investments Money Management, Inc. (FIMM) (2013-present) and is an employee of Fidelity Investments (2004-present). Previously, Mr. Robins served in other fund officer roles. |
Gary W. Ryan (1958) |
Year of Election or Appointment: 2005 Assistant Treasurer |
| Mr. Ryan also serves as Assistant Treasurer of other funds. Mr. Ryan is an employee of Fidelity Investments and has served in other fund officer roles. Previously, Mr. Ryan served as Vice President of Fund Reporting in Fidelity Pricing and Cash Management Services (FPCMS) (1999-2005). |
Stephen Sadoski (1971) |
Year of Election or Appointment: 2012 Deputy Treasurer |
| Mr. Sadoski also serves as Deputy Treasurer of other funds. He is an employee of Fidelity Investments (2012-present) and has served in another fund officer role. Prior to joining Fidelity Investments, Mr. Sadoski served as an assistant chief accountant in the Division of Investment Management of the Securities and Exchange Commission (SEC) (2009-2012) and as a senior manager at Deloitte & Touche LLP (1997-2009). |
Stacie M. Smith (1974) |
Year of Election or Appointment: 2013 Deputy Treasurer |
| Ms. Smith also serves as an officer of other funds. She is an employee of Fidelity Investments (2009-present) and has served in other fund officer roles. Prior to joining Fidelity Investments, Ms. Smith served as Senior Audit Manager of Ernst & Young LLP (1996-2009). |
Renee Stagnone (1975) |
Year of Election or Appointment: 2013 Deputy Treasurer |
| Ms. Stagnone also serves as Deputy Treasurer of other funds. Ms. Stagnone is an employee of Fidelity Investments. |
Joseph F. Zambello (1957) |
Year of Election or Appointment: 2011 Deputy Treasurer |
| Mr. Zambello also serves as Deputy Treasurer of other funds. Mr. Zambello is an employee of Fidelity Investments. Previously, Mr. Zambello served as Vice President of FMR's Program Management Group (2009-2011) and Vice President of the Transfer Agent Oversight Group (2005-2009). |
Annual Report
The Board of Trustees of Fidelity Advisor International Discovery Fund voted to pay to shareholders of record at the opening of business on record date, the following distributions per share derived from capital gains realized from sales of portfolio securities, and dividends derived from net investment income:
| Pay Date | Record Date | Dividends | Capital Gains |
Class K | 12/09/13 | 12/06/13 | $0.526 | $0.311 |
Class K designates 1% of the dividends distributed during the fiscal year as qualifying for the dividends-received deduction for corporate shareholders.
Class K designates 100% of the dividends during the fiscal year as amounts which may be taken into account as a dividend for the purposes of the maximum rate under section 1(h)(11) of the Internal Revenue Code.
The amounts per share which represent income derived from sources within, and taxes paid to, foreign countries or possessions of the United States are as follows:
| Pay Date | Income | Taxes |
K Class | 12/10/12 | $0.554 | $0.026 |
The fund will notify shareholders in January 2014 of amounts for use in preparing 2013 income tax returns.
Annual Report
Board Approval of Investment Advisory Contracts and Management Fees
Fidelity International Discovery Fund
Each year, the Board of Trustees, including the Independent Trustees (together, the Board), votes on the renewal of the management contract and sub-advisory agreements (together, the Advisory Contracts) for the fund. The Board, assisted by the advice of fund counsel and Independent Trustees' counsel, requests and considers a broad range of information relevant to the renewal of the Advisory Contracts throughout the year.
The Board meets regularly and, at each of its meetings, covers an extensive agenda of topics and materials and considers factors that are relevant to its annual consideration of the renewal of the fund's Advisory Contracts, including the services and support provided to the fund and its shareholders. The Board has established various standing committees, each composed of and chaired by Independent Trustees with varying backgrounds, to which the Board has assigned specific subject matter responsibilities in order to enhance effective decision-making by the Board. The Board, acting directly and through its Committees, requests and receives information concerning the annual consideration of the renewal of the fund's Advisory Contracts. The Board also meets as needed to consider matters specifically related to the Board's annual consideration of the renewal of Advisory Contracts. Members of the Board may also meet with trustees of other Fidelity funds through ad hoc joint committees to discuss certain matters relevant to the Fidelity funds.
At its July 2013 meeting, the Board, including the Independent Trustees, unanimously determined to renew the fund's Advisory Contracts. In reaching its determination, the Board considered all factors it believed relevant, including (i) the nature, extent, and quality of the services to be provided to the fund and its shareholders (including the investment performance of the fund); (ii) the competitiveness of the fund's management fee and total expense ratio relative to peer funds; (iii) the total costs of the services to be provided by and the profits to be realized by Fidelity from its relationship with the fund; (iv) the extent to which economies of scale exist and would be realized as the fund grows; and (v) whether fee levels reflect these economies of scale, if any, for the benefit of fund shareholders.
In considering whether to renew the Advisory Contracts for the fund, the Board reached a determination, with the assistance of fund counsel and Independent Trustees' counsel and through the exercise of its business judgment, that the renewal of the Advisory Contracts was in the best interests of the fund and its shareholders and that the compensation payable under the Advisory Contracts was fair and reasonable. The Board's decision to renew the Advisory Contracts was not based on any single factor, but rather was based on a comprehensive consideration of all the information provided to the Board at its meetings throughout the year. The Board, in reaching its determination to renew the Advisory Contracts, was aware that shareholders in the fund have a broad range of investment choices available to them, including a wide choice among mutual funds offered by Fidelity's competitors, and that the fund's shareholders, who have the opportunity to review and weigh the disclosure provided by the fund in its prospectus and other public disclosures, have chosen to invest in this fund, which is a part of the Fidelity family of funds.
Annual Report
Board Approval of Investment Advisory Contracts and
Management Fees - continued
Nature, Extent, and Quality of Services Provided. The Board considered the staffing within the investment adviser, Fidelity Management & Research Company (FMR), and the sub-advisers (together, the Investment Advisers) as it relates to the fund, including the backgrounds of the fund's investment personnel, and also considered the fund's investment objective, strategies, and related investment philosophy. The Independent Trustees also had discussions with senior management of Fidelity's investment operations and investment groups. The Board considered the structure of the portfolio manager compensation program and whether this structure provides appropriate incentives to act in the best interests of the fund.
Resources Dedicated to Investment Management and Support Services. The Board and the Fund Oversight and Research Committees reviewed the general qualifications and capabilities of the Investment Advisers' investment staff, including its size, education, experience, and resources, as well as the Investment Advisers' approach to recruiting, training, managing, and compensating investment personnel. The Board noted that FMR has continued to increase the resources devoted to non-U.S. offices, including expansion of Fidelity's global investment organization. The Board also noted that Fidelity's analysts have extensive resources, tools and capabilities that allow them to conduct sophisticated quantitative and fundamental analysis, as well as credit analysis of issuers, counterparties and guarantors. Further, the Board believes that Fidelity's investment professionals have sufficient access to global information and data so as to provide competitive investment results over time, and that those professionals also have access to sophisticated tools that permit them to assess portfolio construction and risk and performance attribution characteristics continuously, as well as to transmit new information and research conclusions rapidly around the world. Additionally, in its deliberations, the Board considered the Investment Advisers' trading and risk management capabilities and resources, which are an integral part of the investment management process.
Shareholder and Administrative Services. The Board considered (i) the nature, extent, quality, and cost of advisory, administrative, and shareholder services performed by the Investment Advisers and their affiliates under the Advisory Contracts and under separate agreements covering transfer agency, pricing and bookkeeping, and securities lending services for the fund; (ii) the nature and extent of the supervision of third party service providers, principally custodians and subcustodians; and (iii) the resources devoted to, and the record of compliance with, the fund's compliance policies and procedures. The Board also reviewed the allocation of fund brokerage, including allocations to brokers affiliated with the Investment Advisers, the use of brokerage commissions to pay fund expenses, and the use of "soft" commission dollars to pay for research services.
Annual Report
The Board noted that the growth of fund assets over time across the complex allows Fidelity to reinvest in the development of services designed to enhance the value or convenience of the Fidelity funds as investment vehicles. These services include 24-hour access to account information and market information through telephone representatives and over the Internet, investor education materials and asset allocation tools, and the expanded availability of Fidelity Investor Centers.
Investment in a Large Fund Family. The Board considered the benefits to shareholders of investing in a Fidelity fund, including the benefits of investing in a fund that is part of a large family of funds offering a variety of investment disciplines and providing a large variety of mutual fund investor services. The Board noted that Fidelity had taken, or had made recommendations that resulted in the Fidelity funds taking, a number of actions over the previous year that benefited particular funds, including (i) continuing to dedicate additional resources to investment research and to the support of the senior management team that oversees asset management; (ii) persisting in efforts to enhance Fidelity's global research capabilities; (iii) launching new funds and making other enhancements to meet client needs for global and income-oriented solutions; (iv) continuing to launch dedicated lower cost underlying funds to meet portfolio construction needs related to expanding underlying fund options for Fidelity funds of funds, specifically for the Freedom Fund product lines; (v) rationalizing product lines and gaining increased efficiencies through the mergers of several funds into other funds; (vi) strengthening Fidelity's index fund offerings by reducing investment minimums and adopting or lowering existing expense caps for certain funds and classes; (vii) enhancing Global Asset Allocation product offerings by launching new funds and strategies, including "open architecture" target date funds that utilize affiliated and unaffiliated sub-advisers; (viii) modifying the eligibility criteria for Institutional Class shares of Advisor funds to increase their marketability to a portion of the defined contribution plan market; (ix) creating a new low-cost retirement share class for certain Advisor funds to appeal to large retirement plans; (x) transitioning the management of certain Fidelity commodity funds to Geode Capital Management LLC, a registered commodity pool operator, while retaining administrative responsibilities for the funds; (xi) reorganizing a number of funds; and (xii) taking steps toward establishing a new Fidelity adviser to manage sector-based funds and products.
Investment Performance. The Board considered whether the fund has operated in accordance with its investment objective, as well as its record of compliance with its investment restrictions and its performance history.
The Board took into account discussions with the Investment Advisers about fund investment performance that occur at Board meetings throughout the year. In this regard the Board noted that as part of regularly scheduled fund reviews and other reports to the Board on fund performance, the Board periodically considers annualized return information for the fund, for different time periods, measured against a securities market index ("benchmark index") and a peer group of mutual funds with similar objectives ("peer group"). In its evaluation of fund investment performance, the Board gave particular attention to information indicating changes in performance of certain Fidelity funds for specific time periods and the Investment Advisers' explanations for any overperformance or underperformance.
Annual Report
Board Approval of Investment Advisory Contracts and
Management Fees - continued
In addition to reviewing absolute and relative fund performance, the Independent Trustees periodically consider the appropriateness of fund performance metrics in evaluating the results achieved. In general, the Independent Trustees believe that fund performance should be evaluated based on net performance (after fees and expenses) of both the highest performing and lowest performing classes, where applicable, compared to appropriate benchmark indices, over appropriate time periods which may include full market cycles, and compared to peer groups, as applicable, over the same periods, taking into account relevant factors including the following: general market conditions; issuer-specific information; tactical opportunities for investment; and fund cash flows and other factors.
The Independent Trustees recognize that shareholders evaluate performance on a net basis over their own holding periods, for which one-, three-, and five-year periods are used as a proxy. For this reason, the performance information reviewed by the Board also included net cumulative calendar year total return information for the fund and an appropriate benchmark index and peer group for the most recent one-, three-, and five-year periods, as shown below. Returns are shown compared to the 25th percentile (top of box) and 75th percentile (bottom of box) of the peer universe. Returns of the benchmark index are "net MA," i.e., adjusted for tax withholding rates applicable to U.S.-based mutual funds organized as Massachusetts business trusts.
Annual Report
Fidelity International Discovery Fund

The Board also considered that the fund's management fee is subject to upward or downward adjustment depending upon whether, and to what extent, the fund's investment performance for the performance period exceeds, or is exceeded by, a securities index, thus leading to a performance adjustment for the same period. The Board noted that the performance adjustment provides FMR with a strong economic incentive to seek to achieve superior performance for the fund's shareholders and helps to more closely align the interests of FMR and the fund's shareholders.
Based on its review, the Board concluded that the nature, extent, and quality of services provided to the fund under the Advisory Contracts should benefit the fund's shareholders.
Competitiveness of Management Fee and Total Expense Ratio. The Board considered the fund's management fee and total expense ratio compared to "mapped groups" of competitive funds and classes. Fidelity creates "mapped groups" by combining similar Lipper investment objective categories that have comparable management fee characteristics. Combining Lipper investment objective categories aids the Board's management fee and total expense ratio comparisons by broadening the competitive group used for comparison and by reducing the number of universes to which various Fidelity funds are compared.
Management Fee. The Board considered two proprietary management fee comparisons for the 12-month periods shown in the chart below. The group of Lipper funds used by the Board for management fee comparisons is referred to below as the "Total Mapped Group." The Total Mapped Group comparison focuses on a fund's standing in terms of gross management fees before expense reimbursements or caps, and without giving effect to the fund's performance adjustment, relative to the total universe of funds with comparable investment mandates, regardless of whether their management fee structures also are comparable. Funds with comparable investment mandates offer exposure to similar types of securities. Funds with comparable management fee structures have similar management fee contractual arrangements (e.g., flat rate charged for advisory services, all-inclusive fee rate, etc.). "TMG %" represents the percentage of funds in the Total Mapped Group that had management fees that were lower than the fund's. For example, a TMG % of 16% means that 84% of the funds in the Total Mapped Group had higher management fees than the fund. The "Asset-Size Peer Group" (ASPG) comparison focuses on a fund's standing relative to a subset of non-Fidelity funds within the Total Mapped Group that are similar in size and management fee structure. The ASPG represents at least 15% of the funds in the Total Mapped Group with comparable asset size and management fee structures, subject to a minimum of 50 funds (or all funds in the Total Mapped Group if fewer than 50). Additional information, such as the ASPG quartile in which the fund's management fee ranked and the impact of the fund's performance adjustment, is also included in the chart and considered by the Board.
Annual Report
Board Approval of Investment Advisory Contracts and
Management Fees - continued
Fidelity International Discovery Fund

The Board noted that the fund's management fee ranked below the median of its Total Mapped Group and below the median of its ASPG for 2012. The Board also noted the effect of the fund's positive performance adjustment on the fund's management fee ranking.
Annual Report
Based on its review, the Board concluded that the fund's management fee is fair and reasonable in light of the services that the fund receives and the other factors considered.
Total Expense Ratio. In its review of each class's total expense ratio, the Board considered the fund's management fee as well as other fund or class expenses, as applicable, such as transfer agent fees, pricing and bookkeeping fees, fund-paid 12b-1 fees, and custodial, legal, and audit fees. The Board also noted the effects of any waivers and reimbursements on fees and expenses, as well as the impact of the fund's performance adjustment. As part of its review, the Board also considered the current and historical total expense ratios of each class of the fund compared to competitive fund median expenses. Each class of the fund is compared to those funds and classes in the Total Mapped Group (used by the Board for management fee comparisons) that have a similar sales load structure.
The Board noted that the total expense ratio of each of Class A, Class B, Class C, Institutional Class, the retail class, and Class K ranked below its competitive median for 2012 and the total expense ratio of Class T ranked above its competitive median for 2012. The Board considered that, in general, various factors can affect total expense ratios. The Board noted that the total expense ratio of Class T was above the competitive median primarily because of higher 12b-1 fees on Class T. Class T has a higher 12b-1 fee, but a lower front-end sales charge, than traditionally priced front-end sales charge classes. The Board considered that Class T is primarily sold load-waived in the retirement plan market where its 0.50% 12b-1 fee is comparable to competing no-load, higher 12b-1 fee classes designed specifically for retirement plans. The Board noted that the fund offers multiple classes, each of which has a different sales load and 12b-1 fee structure, and that the multiple structures are intended to offer a range of pricing options for the intermediary market. The Board also noted that the total expense ratios of the classes vary primarily by the level of their 12b-1 fees, although differences in transfer agent fees may also cause expenses to vary from class to class.
Fees Charged to Other Fidelity Clients. The Board also considered Fidelity fee structures and other information with respect to clients of FMR and its affiliates, such as other mutual funds advised or subadvised by FMR or its affiliates, pension plan clients, and other institutional clients. The Board noted the findings of the 2013 ad hoc joint committee (created with the board of other Fidelity funds), which reviewed and compared Fidelity's institutional investment advisory business with its business of providing services to the Fidelity funds, including the differences in services provided, fees charged, and costs incurred, as well as competition in their respective marketplaces.
Based on its review of total expense ratios and fees charged to other Fidelity clients, the Board concluded that the total expense ratio of each class of the fund was reasonable, although Class T was above the median of the universe presented for comparison, in light of the services that the fund and its shareholders receive and the other factors considered.
Annual Report
Board Approval of Investment Advisory Contracts and
Management Fees - continued
Costs of the Services and Profitability. The Board considered the revenues earned and the expenses incurred by Fidelity in conducting the business of developing, marketing, distributing, managing, administering and servicing the fund and servicing the fund's shareholders. The Board also considered the level of Fidelity's profits in respect of all the Fidelity funds.
On an annual basis, FMR presents to the Board Fidelity's profitability for the fund. Fidelity calculates the profitability for each fund, as well as aggregate profitability for groups of Fidelity funds and all Fidelity funds, using a series of detailed revenue and cost allocation methodologies which originate with the books and records of Fidelity on which Fidelity's audited financial statements are based. The Audit Committee of the Board reviews any significant changes from the prior year's methodologies.
PricewaterhouseCoopers LLP (PwC), independent registered public accounting firm and auditor to Fidelity and certain Fidelity funds, has been engaged annually by the Board as part of the Board's assessment of Fidelity's profitability analysis. PwC's engagement includes the review and assessment of the methodologies used by Fidelity in determining the revenues and expenses attributable to Fidelity's mutual fund business, and completion of agreed-upon procedures surrounding the mathematical accuracy of fund profitability and its conformity to allocation methodologies. After considering PwC's reports issued under the engagement and information provided by Fidelity, the Board concluded that while other allocation methods may also be reasonable, Fidelity's profitability methodologies are reasonable in all material respects.
The Board also reviewed Fidelity's non-fund businesses and fall-out benefits related to the mutual fund business as well as cases where Fidelity's affiliates may benefit from or be related to the fund's business.
The Board considered the costs of the services provided by and the profits realized by Fidelity in connection with the operation of the fund and was satisfied that the profitability was not excessive in the circumstances.
Economies of Scale. The Board considered whether there have been economies of scale in respect of the management of the Fidelity funds, whether the Fidelity funds (including the fund) have appropriately benefited from any such economies of scale, and whether there is potential for realization of any further economies of scale. The Board considered the extent to which the fund will benefit from economies of scale through increased services to the fund, through waivers or reimbursements, or through fee or expense reductions. The Board also noted that in 2009, it and the board of other Fidelity funds created an ad hoc committee (the Economies of Scale Committee) to analyze whether FMR attains economies of scale in respect of the management and servicing of the Fidelity funds, whether the Fidelity funds have appropriately benefited from such economies of scale, and whether there is potential for realization of any further economies of scale.
Annual Report
The Board recognized that the fund's management contract incorporates a "group fee" structure, which provides for lower group fee rates as total fund assets under FMR's management increase, and for higher group fee rates as total fund assets under FMR's management decrease. FMR calculates the group fee rates based on a tiered asset "breakpoint" schedule that varies based on asset class. The Board considered that the group fee is designed to deliver the benefits of economies of scale to fund shareholders when total Fidelity fund assets increase, even if assets of any particular fund are unchanged or have declined, because some portion of Fidelity's costs are attributable to services provided to all Fidelity funds, and all funds benefit if those costs can be allocated among more assets. The Board concluded that, given the group fee structure, fund shareholders will benefit from lower management fees as assets under FMR's management increase at the fund complex level, regardless of whether Fidelity achieves any such economies of scale.
The Board concluded, taking into account the analysis of the Economies of Scale Committee, that economies of scale, if any, are being appropriately shared between fund shareholders and Fidelity.
Amendment to Description of Group Fee Rate. At its July 2013 meeting, the Board voted to approve an amendment to the fund's management contract to modify the description of the "group fee rate" effective August 1, 2013. The Board noted that under the prior description in the contract, the group fee rate was based on the average net assets of all registered investment companies with which FMR has management contracts. Under the contract's tiered asset breakpoint schedule, the group fee rate is lower as total fund assets under FMR's management increase, and higher as total fund assets under FMR's management decrease. The Board considered that the prior description would have excluded the assets of 64 Fidelity sector funds from the group fee rate calculation once Fidelity SelectCo, LLC, an affiliate of FMR, assumed management responsibilities for those funds. The Board noted that modifying the description of the group fee rate to continue to include the assets of those 64 funds for purposes of determining group fee rate breakpoints would avoid an immediate adverse impact on the group fee rate for any fund.
Additional Information Requested by the Board. In order to develop fully the factual basis for consideration of the Fidelity funds' Advisory Contracts, the Board requested and received additional information on certain topics, including: (i) fund performance trends and Fidelity's long-term strategies for certain funds; (ii) the potential to further rationalize the Fidelity fund lineup with the possibility of achieving savings for the funds and Fidelity; (iii) the methodology with respect to competitive fund data and peer group classifications; (iv) the arrangements with, and performance of, certain sub-advisers on behalf of the Fidelity funds, as well as certain proposed participating affiliate arrangements; (v) the realization of fall-out benefits in certain Fidelity business units; (vi) Fidelity's group fee structures, including the rationale for the individual fee rates of certain categories of funds and the definition of group assets; (vii) trends regarding industry use of performance fee structures and the performance adjustment methodologies applicable to the Fidelity funds; (viii) additional competitive analysis regarding the total expenses for certain classes; and (ix) fund profitability methodology, including Fidelity's cost allocation methodology, and the impact of certain factors on fund profitability results.
Annual Report
Board Approval of Investment Advisory Contracts and
Management Fees - continued
Based on its evaluation of all of the conclusions noted above, and after considering all factors it believed relevant, the Board ultimately concluded that the advisory fee structures are fair and reasonable, and that the fund's Advisory Contracts should be renewed.
Annual Report
Investment Adviser
Fidelity Management & Research Company
Boston, MA
Investment Sub-Advisers
FMR Co., Inc.
Fidelity Management & Research
(U.K.) Inc.
FIL Investments (Japan) Limited
FIL Investment Advisors
FIL Investment Advisors
(U.K.) Limited
Fidelity Management & Research
(Hong Kong) Limited
Fidelity Management & Research
(Japan) Inc.
General Distributor
Fidelity Distributors Corporation
Smithfield, RI
Transfer and Service Agents
Fidelity Investments Institutional
Operations Company, Inc.
Boston, MA
Fidelity Service Company, Inc.
Boston, MA
Custodian
The Northern Trust Company
Chicago, IL
(Fidelity Investment logo)(registered trademark)
Corporate Headquarters
245 Summer St., Boston, MA 02210
www.fidelity.com
IGI-K-UANN-1213
1.863305.105
(Fidelity Investment logo)(registered trademark)
Fidelity Advisor®
International Discovery
Fund - Class A, Class T, Class B
and Class C
Annual Report
October 31, 2013
(Fidelity Cover Art)
Class A, Class T, Class B, and Class C are classes of Fidelity® International Discovery Fund
Contents
Performance | (Click Here) | How the fund has done over time. |
Management's Discussion of Fund Performance | (Click Here) | The Portfolio Manager's review of fund performance and strategy. |
Shareholder Expense Example | (Click Here) | An example of shareholder expenses. |
Investment Changes | (Click Here) | A summary of major shifts in the fund's investments over the past six months. |
Investments | (Click Here) | A complete list of the fund's investments with their market values. |
Financial Statements | (Click Here) | Statements of assets and liabilities, operations, and changes in net assets, as well as financial highlights. |
Notes | (Click Here) | Notes to financial statements. |
Report of Independent Registered Public Accounting Firm | (Click Here) | |
Trustees and Officers | (Click Here) | |
Distributions | (Click Here) | |
Board Approval of Investment Advisory Contracts and Management Fees | (Click Here) | |
To view a fund's proxy voting guidelines and proxy voting record for the 12-month period ended June 30, visit http://www.fidelity.com/proxyvotingresults or visit the Securities and Exchange Commission's (SEC) web site at http://www.sec.gov. You may also call 1-877-208-0098 to request a free copy of the proxy voting guidelines.
Standard & Poor's, S&P and S&P 500 are registered service marks of The McGraw-Hill Companies, Inc. and have been licensed for use by Fidelity Distributors Corporation.
Other third-party marks appearing herein are the property of their respective owners.
All other marks appearing herein are registered or unregistered trademarks or service marks of FMR LLC or an affiliated company. © 2013 FMR LLC. All rights reserved.
Annual Report
This report and the financial statements contained herein are submitted for the general information of the shareholders of the fund. This report is not authorized for distribution to prospective investors in the fund unless preceded or accompanied by an effective prospectus.
A fund files its complete schedule of portfolio holdings with the SEC for the first and third quarters of each fiscal year on Form N-Q. Forms N-Q are available on the SEC's web site at http://www.sec.gov. A fund's Forms N-Q may be reviewed and copied at the SEC's Public Reference Room in Washington, DC. Information regarding the operation of the SEC's Public Reference Room may be obtained by calling 1-800-SEC-0330. For a complete list of a fund's portfolio holdings, view the most recent holdings listing, semiannual report, or annual report on Fidelity's web site at http://www.fidelity.com, http://www.advisor.fidelity.com, or http://www.401k.com, as applicable.
NOT FDIC INSURED • MAY LOSE VALUE • NO BANK GUARANTEE
Neither the fund nor Fidelity Distributors Corporation is a bank.
Annual Report
Average annual total return reflects the change in the value of an investment, assuming reinvestment of the class' distributions from dividend income and capital gains (the profits earned upon the sale of securities that have grown in value, if any) and assuming a constant rate of performance each year. The $10,000 table and the fund's returns do not reflect the deduction of taxes that a shareholder would pay on fund distributions or the redemption of fund shares. During periods of reimbursement by Fidelity, a fund's total return will be greater than it would be had the reimbursement not occurred. How a fund did yesterday is no guarantee of how it will do tomorrow. Returns reflect the conversion of Class B shares to Class A shares after a maximum of seven years.
Average Annual Total Returns
Periods ended October 31, 2013 | Past 1
year | Past 5
years | Past 10
years |
Class A (incl. 5.75% sales charge) A, E | 19.31% | 10.88% | 7.79% |
Class T (incl. 3.50% sales charge) B, E | 21.89% | 11.12% | 7.75% |
Class B (incl. contingent deferred sales charge) C, E | 20.64% | 11.08% | 7.80% |
Class C (incl. contingent deferred sales charge) D , E | 24.65% | 11.36% | 7.68% |
A Class A shares bear a 0.25% 12b-1 fee. The initial offering of Class A shares took place on Janu-ary 6, 2005. Returns prior to January 6, 2005, are those of Fidelity® International Discovery Fund, the original class of the fund, which has no 12b-1 fee. Had Class A shares' 12b-1 fee been reflected, returns prior to January 6, 2005, would have been lower.
B Class T shares bear a 0.50% 12b-1 fee. The initial offering of Class T shares took place on Janu-ary 6, 2005. Returns prior to January 6, 2005, are those of Fidelity International Discovery Fund, the original class of the fund, which has no 12b-1 fee. Had Class T shares' 12b-1 fee been reflected, returns prior to January 6, 2005, would have been lower.
C Class B shares bear a 1.00% 12b-1 fee. The initial offering of Class B shares took place on Janu-ary 6, 2005. Returns prior to January 6, 2005, are those of Fidelity International Discovery Fund, the original class of the fund, which has no 12b-1 fee. Had Class B shares' 12b-1 fee been reflected, returns prior to January 6, 2005, would have been lower. Class B shares' contingent deferred sales charges included in the past one year, past five year, and past 10 year total return figures are 5%, 2%, and 0% respectively.
D Class C shares bear a 1.00% 12b-1 fee. The initial offering of Class C shares took place on Janu-ary 6, 2005. Returns prior to January 6, 2005, are those of Fidelity International Discovery Fund, the original class of the fund, which has no 12b-1 fee. Had Class C shares' 12b-1 fee been reflected, returns prior to January 6, 2005, would have been lower. Class C shares' contingent deferred sales charges included in the past one year, past five year, and past 10 year total return figures are 1%, 0%, and 0% respectively.
E Prior to October 1, 2004, the fund operated under certain different investment policies. The fund's historical performance may not represent its current investment policies.
Annual Report
$10,000 Over 10 Years
Let's say hypothetically that $10,000 was invested in Fidelity Advisor® International Discovery Fund - Class A on October 31, 2003 and the current 5.75% sales charge was paid. The chart shows how the value of your investment would have changed, and also shows how the MSCI® EAFE® Index performed over the same period. See footnote A on the previous page for additional information regarding the performance of Class A.
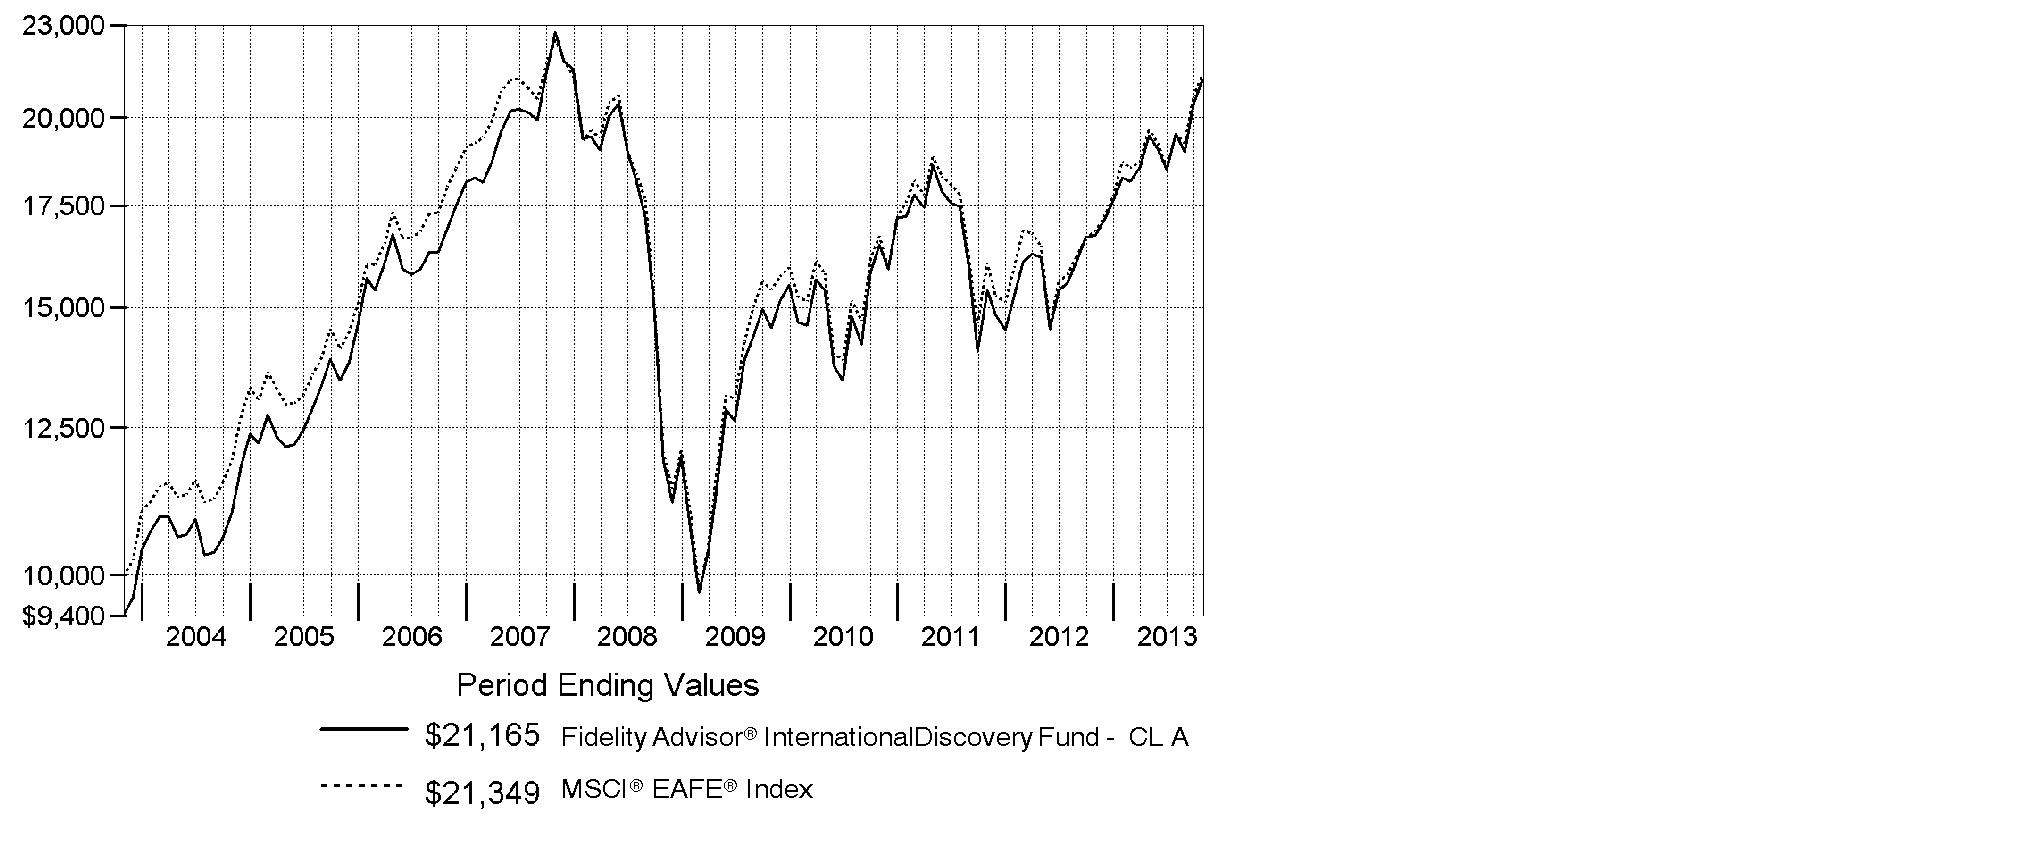
Annual Report
Market Recap: On balance, global equity markets remained upbeat for the 12-month period ending October 31, 2013. The MSCI® ACWI® (All Country World Index) Index gained 23.75% for the period, amid investor preference for higher-risk assets. The period was not without turbulence, however. In the spring and summer, central banks worldwide, especially in the U.S. and China, made clear their intentions to maintain accommodative monetary policies. That stance, combined with modest cyclical improvements around the globe and generally low valuations, underpinned the broad rally in equities. Europe (+32%) shone brightly, with most markets in the region - large and small - registering solid, index-beating gains. Another bright spot was Japan, which, despite a struggling yen and taking a second-half breather, posted a 34% result for the full year. The U.S. - by far the index's biggest constituent - also outperformed the global market with a roughly 28% advance. Meanwhile, Asia-Pacific ex Japan (+14%) lagged, hurt in part by a slowdown in Australia's mining industry as well as currency headwinds. Foreign-exchange and commodity weakness also curbed results in resource-heavy Canada and emerging markets (EM), both of which were up 7%. Country-level EM performance diverged meaningfully for the period, as evidenced by performance in Brazil (-1%), Russia (+12%), India (+1%) and China (+8%).
Comments from William Kennedy, Portfolio Manager of Fidelity Advisor® International Discovery Fund: For the year, the fund's Class A, Class T, Class B and Class C shares returned 26.59%, 26.31%, 25.64% and 25.65%, respectively (excluding sales charges), compared with the 27.02% gain of its benchmark, the MSCI® EAFE® Index. Security selection aided relative performance, with notable outperformance in the U.K. and Japan. Positioning in the Asia Pacific ex Japan region and the materials sector also contributed, as did security selection in information technology. Top individual contributors included U.K.-based online-only supermarket Ocado Group, an out-of-index position that rallied after the company significantly expanded its business capacity. An overweighting in real estate leasing company ORIX stood out, as improved economic activity drove up real estate prices in Japan. By contrast, stock picks in core European countries, emerging markets and the automobiles & components segment of consumer discretionary detracted, along with a small cash position in an up market. Individual disappointments included Housing Development Finance, a large mortgage provider in India, whose stock declined along with the Indian rupee. An average underweighting in Toyota Motor also hurt, as the weakening yen combined with the company's market-share increases to propel the stock higher.
The views expressed above reflect those of the portfolio manager(s) only through the end of the period as stated on the cover of this report and do not necessarily represent the views of Fidelity or any other person in the Fidelity organization. Any such views are subject to change at any time based upon market or other conditions and Fidelity disclaims any responsibility to update such views. These views may not be relied on as investment advice and, because investment decisions for a Fidelity fund are based on numerous factors, may not be relied on as an indication of trading intent on behalf of any Fidelity fund.
Annual Report
Shareholder Expense Example
As a shareholder of the Fund, you incur two types of costs: (1) transaction costs, including sales charges (loads) on purchase payments or redemption proceeds, redemption fees and (2) ongoing costs, including management fees, distribution and/or service (12b-1) fees and other Fund expenses. This Example is intended to help you understand your ongoing costs (in dollars) of investing in the Fund and to compare these costs with the ongoing costs of investing in other mutual funds.
The actual expense Example is based on an investment of $1,000 invested at the beginning of the period and held for the entire period (May 1, 2013 to October 31, 2013) for Class A, Class T, Class B, Class C, International Discovery, Class K and Institutional Class and for the period (August 13, 2013 to October 31, 2013) for Class Z. The hypothetical expense Example is based on an investment of $1,000 invested for the one-half year period (May 1, 2013 to October 31, 2013).
Actual Expenses
The first line of the accompanying table for each class of the Fund provides information about actual account values and actual expenses. You may use the information in this line, together with the amount you invested, to estimate the expenses that you paid over the period. Simply divide your account value by $1,000.00 (for example, an $8,600 account value divided by $1,000.00 = 8.6), then multiply the result by the number in the first line for a class of the Fund under the heading entitled "Expenses Paid During Period" to estimate the expenses you paid on your account during this period. A small balance maintenance fee of $12.00 that is charged once a year may apply for certain accounts with a value of less than $2,000. This fee is not included in the table below. If it was, the estimate of expenses you paid during the period would be higher, and your ending account value lower, by this amount. In addition, the Fund, as a shareholder in the underlying Fidelity Central Funds, will indirectly bear its pro-rata share of the fees and expenses incurred by the underlying Fidelity Central Funds. These fees and expenses are not included in the Fund's annualized expense ratio used to calculate the expense estimate in the table below.
Hypothetical Example for Comparison Purposes
The second line of the accompanying table for each class of the Fund provides information about hypothetical account values and hypothetical expenses based on a Class' actual expense ratio and an assumed rate of return of 5% per year before expenses, which is not the Class' actual return. The hypothetical account values and expenses may not be used to estimate the actual ending account balance or expenses you paid for the period. You may use this information to compare the ongoing costs of investing in the Fund and other funds. To do so, compare this 5% hypothetical example with the 5% hypothetical examples that appear in the shareholder reports of the other funds. A small balance maintenance fee of $12.00 that is charged once a year may apply for certain accounts with a value of less than $2,000. This fee is not included in the table below. If it was, the estimate of expenses you paid during the period would be higher, and your ending account value lower, by this amount. In addition, the Fund, as a shareholder in the underlying Fidelity Central Funds, will indirectly bear its pro-rata share of the fees and expenses incurred by the underlying Fidelity Central Funds. These fees and expenses are not included in the Fund's annualized expense ratio used to calculate the expense estimate in the table below.
Annual Report
Please note that the expenses shown in the table are meant to highlight your ongoing costs only and do not reflect any transaction costs. Therefore, the second line of the table is useful in comparing ongoing costs only, and will not help you determine the relative total costs of owning different funds. In addition, if these transactional costs were included, your costs would have been higher.
| Annualized
Expense Ratio B | Beginning
Account Value | Ending
Account Value
October 31, 2013 | Expenses Paid
During Period |
Class A | 1.34% | | | |
Actual | | $ 1,000.00 | $ 1,089.10 | $ 7.06 C |
HypotheticalA | | $ 1,000.00 | $ 1,018.45 | $ 6.82 D |
Class T | 1.58% | | | |
Actual | | $ 1,000.00 | $ 1,087.90 | $ 8.31 C |
HypotheticalA | | $ 1,000.00 | $ 1,017.24 | $ 8.03 D |
Class B | 2.09% | | | |
Actual | | $ 1,000.00 | $ 1,085.00 | $ 10.98 C |
HypotheticalA | | $ 1,000.00 | $ 1,014.67 | $ 10.61 D |
Class C | 2.09% | | | |
Actual | | $ 1,000.00 | $ 1,085.30 | $ 10.99 C |
HypotheticalA | | $ 1,000.00 | $ 1,014.67 | $ 10.61 D |
International Discovery | .99% | | | |
Actual | | $ 1,000.00 | $ 1,091.00 | $ 5.22 C |
HypotheticalA | | $ 1,000.00 | $ 1,020.21 | $ 5.04 D |
Class K | .85% | | | |
Actual | | $ 1,000.00 | $ 1,092.00 | $ 4.48 C |
HypotheticalA | | $ 1,000.00 | $ 1,020.92 | $ 4.33 D |
Institutional Class | .99% | | | |
Actual | | $ 1,000.00 | $ 1,091.10 | $ 5.22 C |
HypotheticalA | | $ 1,000.00 | $ 1,020.21 | $ 5.04 D |
Class Z | .85% | | | |
Actual | | $ 1,000.00 | $ 1,068.50 | $ 1.93 C |
HypotheticalA | | $ 1,000.00 | $ 1,020.92 | $ 4.33 D |
A 5% return per year before expenses
B Annualized expense ratio reflects expenses net of applicable fee waivers.
Annual Report
Shareholder Expense Example - continued
C Actual expenses are equal to each Class' annualized expense ratio; multiplied by the average account value over the period, multiplied by 184/365 (to reflect the one-half year period) for Class A, Class T, Class B, Class C, International Discovery, Class K and Institutional Class and multiplied by 80/365 (to reflect the period August 13, 2013 to October 31, 2013) for Class Z.
D Hypothetical expenses are equal to each Class' annualized expense ratio, multiplied by the average account value over the period, multiplied by 184/365 (to reflect the one-half year period).
Annual Report
Investment Changes (Unaudited)
Geographic Diversification (% of fund's net assets) |
As of October 31, 2013 |
 | Japan 18.2% | |
 | United Kingdom 15.9% | |
 | France 10.9% | |
 | Germany 8.7% | |
 | Switzerland 6.4% | |
 | United States of America* 5.5% | |
 | Sweden 4.1% | |
 | Spain 3.6% | |
 | Netherlands 3.3% | |
 | Other 23.4% | |

Percentages are based on country or territory of incorporation and are adjusted for the effect of futures contracts, if applicable. |
* Includes Short-Term Investments and Net Other Assets (Liabilities) |
As of April 30, 2013 |
| Japan 20.5% | |
| United Kingdom 16.1% | |
| France 9.7% | |
| Germany 7.5% | |
| Switzerland 6.3% | |
| United States of America* 5.2% | |
| Australia 3.9% | |
| Sweden 2.7% | |
| Netherlands 2.5% | |
| Other 25.6% | |

Percentages are based on country or territory of incorporation and are adjusted for the effect of futures contracts, if applicable. |
* Includes Short-Term Investments and Net Other Assets (Liabilities) |
Asset Allocation as of October 31, 2013 |
| % of fund's
net assets | % of fund's net assets
6 months ago |
Stocks and Equity Futures | 97.2 | 96.6 |
Short-Term Investments and Net Other Assets (Liabilities) | 2.8 | 3.4 |
Top Ten Stocks as of October 31, 2013 |
| % of fund's
net assets | % of fund's net assets
6 months ago |
Roche Holding AG (participation certificate) (Switzerland, Pharmaceuticals) | 2.0 | 1.0 |
Australia & New Zealand Banking Group Ltd. (Australia, Commercial Banks) | 1.8 | 1.6 |
Bayer AG (Germany, Pharmaceuticals) | 1.6 | 0.8 |
Toyota Motor Corp. (Japan, Automobiles) | 1.6 | 0.7 |
Total SA (France, Oil, Gas & Consumable Fuels) | 1.5 | 0.0 |
Volkswagen AG (Germany, Automobiles) | 1.5 | 0.7 |
UBS AG (Switzerland, Capital Markets) | 1.4 | 1.1 |
ORIX Corp. (Japan, Diversified Financial Services) | 1.4 | 1.1 |
SoftBank Corp. (Japan, Wireless Telecommunication Services) | 1.4 | 0.6 |
Banco Bilbao Vizcaya Argentaria SA (Spain, Commercial Banks) | 1.3 | 0.7 |
| 15.5 | |
Market Sectors as of October 31, 2013 |
| % of fund's
net assets | % of fund's net assets
6 months ago |
Financials | 24.8 | 24.3 |
Consumer Discretionary | 16.4 | 16.5 |
Industrials | 13.0 | 12.1 |
Consumer Staples | 10.1 | 11.3 |
Health Care | 9.5 | 8.9 |
Information Technology | 7.7 | 7.5 |
Materials | 5.2 | 5.7 |
Telecommunication Services | 5.1 | 4.1 |
Energy | 3.8 | 3.0 |
Utilities | 0.6 | 1.1 |
Annual Report
Investments October 31, 2013
Showing Percentage of Net Assets
Common Stocks - 94.7% |
| Shares | | Value (000s) |
Australia - 3.2% |
Ansell Ltd. | 2,268,950 | | $ 41,796 |
Australia & New Zealand Banking Group Ltd. | 6,493,040 | | 207,673 |
Ramsay Health Care Ltd. | 1,619,364 | | 59,385 |
Woodside Petroleum Ltd. | 1,461,485 | | 53,623 |
TOTAL AUSTRALIA | | 362,477 |
Austria - 0.2% |
Andritz AG | 455,300 | | 28,047 |
Bailiwick of Jersey - 2.6% |
Experian PLC | 6,115,400 | | 124,529 |
Wolseley PLC | 1,508,304 | | 81,283 |
WPP PLC | 3,996,700 | | 84,910 |
TOTAL BAILIWICK OF JERSEY | | 290,722 |
Belgium - 2.1% |
Anheuser-Busch InBev SA NV | 1,183,927 | | 122,730 |
KBC Groupe SA | 2,102,810 | | 114,632 |
TOTAL BELGIUM | | 237,362 |
Bermuda - 0.3% |
Cheung Kong Infrastructure Holdings Ltd. | 5,048,000 | | 35,127 |
Brazil - 0.1% |
Arezzo Industria e Comercio SA | 1,051,500 | | 15,724 |
British Virgin Islands - 0.4% |
Mail.Ru Group Ltd. GDR (Reg. S) | 1,193,800 | | 44,027 |
Canada - 1.0% |
Constellation Software, Inc. | 159,200 | | 29,002 |
InterOil Corp. (a)(d) | 204,400 | | 14,196 |
Suncor Energy, Inc. | 2,012,600 | | 73,138 |
TOTAL CANADA | | 116,336 |
Cayman Islands - 1.2% |
Baidu.com, Inc. sponsored ADR (a) | 123,100 | | 19,807 |
Cimc Enric Holdings Ltd. | 16,316,000 | | 22,981 |
ENN Energy Holdings Ltd. | 5,084,000 | | 30,132 |
Eurasia Drilling Co. Ltd. GDR (Reg. S) | 630,200 | | 26,689 |
Greatview Aseptic Pack Co. Ltd. | 26,392,000 | | 16,612 |
Sands China Ltd. | 1,460,800 | | 10,382 |
Youku Tudou, Inc. ADR (a)(d) | 300,200 | | 8,177 |
TOTAL CAYMAN ISLANDS | | 134,780 |
Common Stocks - continued |
| Shares | | Value (000s) |
Cyprus - 0.0% |
SPDI Secure Property Development & Investment PLC (a) | 529,830 | | $ 597 |
Denmark - 0.6% |
Novo Nordisk A/S Series B | 396,489 | | 66,036 |
Finland - 0.7% |
Sampo Oyj (A Shares) | 1,739,800 | | 82,418 |
France - 10.9% |
Arkema SA | 487,670 | | 55,368 |
Atos Origin SA | 388,851 | | 33,198 |
AXA SA | 5,364,600 | | 134,022 |
BNP Paribas SA | 1,544,345 | | 114,361 |
Bureau Veritas SA | 1,413,000 | | 42,667 |
Danone SA | 905,500 | | 67,152 |
Edenred SA | 1,177,900 | | 40,022 |
Havas SA | 5,201,268 | | 43,333 |
Iliad SA | 213,972 | | 48,924 |
Kering SA | 373,000 | | 84,753 |
Lafarge SA (Bearer) (d) | 605,900 | | 41,939 |
LVMH Moet Hennessy - Louis Vuitton SA | 612,502 | | 117,924 |
Sanofi SA | 890,979 | | 94,999 |
Schneider Electric SA | 1,383,800 | | 116,583 |
Technip SA | 192,300 | | 20,144 |
Total SA | 2,831,600 | | 173,727 |
TOTAL FRANCE | | 1,229,116 |
Germany - 7.2% |
Aareal Bank AG (a) | 1,044,895 | | 40,185 |
adidas AG | 541,900 | | 61,863 |
BASF AG | 1,265,455 | | 131,663 |
Bayer AG | 1,471,500 | | 182,890 |
Brenntag AG | 444,700 | | 75,353 |
GEA Group AG | 1,254,770 | | 54,602 |
GSW Immobilien AG | 430,481 | | 20,019 |
HeidelbergCement Finance AG | 860,300 | | 67,818 |
KION Group AG (a) | 577,867 | | 23,538 |
LEG Immobilien AG | 184,948 | | 10,547 |
Siemens AG | 1,110,885 | | 141,963 |
TOTAL GERMANY | | 810,441 |
Common Stocks - continued |
| Shares | | Value (000s) |
Hong Kong - 1.8% |
AIA Group Ltd. | 20,789,200 | | $ 105,515 |
Techtronic Industries Co. Ltd. | 39,683,000 | | 99,809 |
TOTAL HONG KONG | | 205,324 |
India - 0.6% |
Housing Development Finance Corp. Ltd. | 3,139,461 | | 43,561 |
United Spirits Ltd. | 444,545 | | 18,569 |
TOTAL INDIA | | 62,130 |
Indonesia - 0.1% |
PT Tower Bersama Infrastructure Tbk | 17,734,500 | | 8,967 |
Ireland - 2.0% |
Actavis PLC (a) | 308,100 | | 47,626 |
Bank of Ireland (a) | 146,718,100 | | 53,399 |
James Hardie Industries PLC CDI | 6,070,470 | | 62,711 |
Kerry Group PLC Class A | 945,600 | | 60,555 |
TOTAL IRELAND | | 224,291 |
Italy - 1.0% |
De Longhi SpA | 2,248,100 | | 34,797 |
Moleskine SpA | 4,183,000 | | 10,223 |
Tod's SpA | 117,793 | | 19,624 |
UniCredit SpA | 3,689,800 | | 27,754 |
World Duty Free SpA (a) | 2,253,904 | | 24,972 |
TOTAL ITALY | | 117,370 |
Japan - 17.2% |
ABC-MART, Inc. | 826,300 | | 41,324 |
Aozora Bank Ltd. | 16,056,000 | | 46,675 |
ARNEST ONE Corp. (d) | 306,200 | | 8,395 |
Astellas Pharma, Inc. | 768,700 | | 42,852 |
Cosmos Pharmaceutical Corp. | 245,800 | | 29,946 |
Daikin Industries Ltd. | 1,089,400 | | 62,677 |
Don Quijote Co. Ltd. | 1,818,400 | | 121,044 |
Hajime Construction Co. Ltd. | 34,900 | | 2,406 |
Hitachi Ltd. | 5,121,000 | | 35,822 |
Japan Exchange Group, Inc. | 2,589,500 | | 60,201 |
Japan Tobacco, Inc. | 3,948,700 | | 142,879 |
Kakaku.com, Inc. | 1,903,000 | | 36,807 |
KDDI Corp. | 2,082,700 | | 112,792 |
Keyence Corp. | 304,060 | | 130,317 |
Leopalace21 Corp. (a) | 6,899,700 | | 47,901 |
Common Stocks - continued |
| Shares | | Value (000s) |
Japan - continued |
Miraca Holdings, Inc. | 196,700 | | $ 8,863 |
Mitsubishi UFJ Financial Group, Inc. | 18,169,200 | | 115,706 |
Nomura Real Estate Holdings, Inc. | 563,300 | | 14,252 |
Omron Corp. | 1,225,300 | | 46,759 |
ORIX Corp. | 9,072,900 | | 157,152 |
Park24 Co. Ltd. | 1,342,800 | | 26,218 |
Rakuten, Inc. | 5,237,700 | | 68,245 |
Santen Pharmaceutical Co. Ltd. | 1,166,900 | | 59,239 |
Seven & i Holdings Co., Ltd. | 2,167,000 | | 80,198 |
Shinsei Bank Ltd. | 24,904,000 | | 58,308 |
Ship Healthcare Holdings, Inc. | 1,076,700 | | 44,182 |
SoftBank Corp. | 2,099,300 | | 156,773 |
Toyota Motor Corp. | 2,789,300 | | 180,853 |
USS Co. Ltd. | 450,400 | | 6,596 |
TOTAL JAPAN | | 1,945,382 |
Korea (South) - 0.9% |
Hyundai Motor Co. | 206,848 | | 49,311 |
NHN Corp. | 69,296 | | 38,981 |
Orion Corp. | 14,973 | | 14,602 |
TOTAL KOREA (SOUTH) | | 102,894 |
Luxembourg - 0.3% |
Brait SA | 6,048,833 | | 29,465 |
Mexico - 0.2% |
Alsea S.A.B. de CV | 7,662,195 | | 23,831 |
Netherlands - 3.3% |
AEGON NV | 5,028,800 | | 40,014 |
ASML Holding NV | 772,233 | | 73,084 |
European Aeronautic Defence and Space Co. (EADS) NV | 176,700 | | 12,142 |
Koninklijke Ahold NV | 2,412,842 | | 45,930 |
Koninklijke Philips Electronics NV | 2,496,700 | | 88,235 |
Randstad Holding NV | 717,740 | | 44,296 |
Royal DSM NV | 536,200 | | 40,617 |
Yandex NV (a) | 861,400 | | 31,751 |
TOTAL NETHERLANDS | | 376,069 |
New Zealand - 0.4% |
Ryman Healthcare Group Ltd. | 7,311,565 | | 45,597 |
Norway - 1.0% |
DNB ASA | 6,068,755 | | 107,551 |
Common Stocks - continued |
| Shares | | Value (000s) |
Philippines - 0.1% |
Alliance Global Group, Inc. | 26,741,800 | | $ 16,306 |
Russia - 0.5% |
Mobile TeleSystems OJSC sponsored ADR | 2,313,400 | | 52,746 |
Singapore - 0.4% |
Global Logistic Properties Ltd. | 16,214,205 | | 40,333 |
South Africa - 1.1% |
Naspers Ltd. Class N | 1,302,700 | | 121,851 |
Spain - 3.6% |
Amadeus IT Holding SA Class A | 1,319,900 | | 49,014 |
Antena 3 de Television SA | 1,515,400 | | 25,411 |
Banco Bilbao Vizcaya Argentaria SA | 12,546,524 | | 146,630 |
Criteria CaixaCorp SA | 4,210,900 | | 21,892 |
Distribuidora Internacional de Alimentacion SA | 5,726,396 | | 52,349 |
Grifols SA ADR | 1,208,550 | | 36,450 |
Inditex SA (d) | 481,679 | | 79,134 |
TOTAL SPAIN | | 410,880 |
Sweden - 4.1% |
ASSA ABLOY AB (B Shares) | 1,783,400 | | 88,536 |
Intrum Justitia AB | 1,835,800 | | 48,869 |
Investment AB Kinnevik (B Shares) | 2,363,300 | | 87,091 |
Nordea Bank AB | 6,100,600 | | 78,140 |
Svenska Cellulosa AB (SCA) (B Shares) | 3,591,900 | | 101,991 |
Svenska Handelsbanken AB (A Shares) | 1,258,200 | | 57,007 |
TOTAL SWEDEN | | 461,634 |
Switzerland - 6.4% |
Credit Suisse Group | 1,039,246 | | 32,329 |
Lonza Group AG | 476,868 | | 42,623 |
Partners Group Holding AG | 230,056 | | 59,609 |
Roche Holding AG (participation certificate) | 821,773 | | 227,506 |
Schindler Holding AG (participation certificate) | 260,065 | | 36,888 |
SGS SA (Reg.) | 7,770 | | 18,206 |
Swatch Group AG (Bearer) | 36,702 | | 23,481 |
Syngenta AG (Switzerland) | 179,374 | | 72,398 |
UBS AG | 8,311,378 | | 160,751 |
Zurich Insurance Group AG | 180,481 | | 49,907 |
TOTAL SWITZERLAND | | 723,698 |
Common Stocks - continued |
| Shares | | Value (000s) |
Taiwan - 0.6% |
ECLAT Textile Co. Ltd. | 2,457,180 | | $ 27,005 |
Taiwan Semiconductor Manufacturing Co. Ltd. | 11,289,000 | | 41,528 |
TOTAL TAIWAN | | 68,533 |
United Kingdom - 15.9% |
Aberdeen Asset Management PLC | 5,975,132 | | 42,432 |
Alabama Noor Hospitals Group PLC (a) | 1,829,400 | | 24,933 |
Associated British Foods PLC | 1,571,500 | | 57,123 |
Barclays PLC | 22,636,113 | | 95,241 |
BG Group PLC | 3,923,700 | | 80,119 |
BHP Billiton PLC | 2,080,582 | | 64,204 |
British American Tobacco PLC (United Kingdom) | 881,200 | | 48,618 |
Croda International PLC | 630,000 | | 24,607 |
Diageo PLC | 4,394,219 | | 140,077 |
Foxtons Group PLC | 2,178,500 | | 11,134 |
Hikma Pharmaceuticals PLC | 3,197,720 | | 61,578 |
HSBC Holdings PLC (United Kingdom) | 12,266,193 | | 134,454 |
Intertek Group PLC | 893,600 | | 47,741 |
ITV PLC | 11,642,037 | | 35,635 |
Jazztel PLC (a) | 4,681,964 | | 51,364 |
Legal & General Group PLC | 26,720,558 | | 92,671 |
Liberty Global PLC Class A (a) | 610,800 | | 47,868 |
London Stock Exchange Group PLC | 1,729,000 | | 45,521 |
Meggitt PLC | 6,842,366 | | 62,809 |
Next PLC | 781,744 | | 68,250 |
Ocado Group PLC (a) | 8,103,297 | | 56,389 |
Persimmon PLC | 2,082,200 | | 42,233 |
Reckitt Benckiser Group PLC | 788,600 | | 61,300 |
Rolls-Royce Group PLC | 4,197,715 | | 77,402 |
Rotork PLC | 717,800 | | 32,951 |
Royal Mail PLC | 788,800 | | 7,083 |
SABMiller PLC | 1,478,600 | | 77,145 |
Taylor Wimpey PLC | 18,277,100 | | 32,295 |
The Restaurant Group PLC | 1,992,100 | | 18,398 |
Ultra Electronics Holdings PLC | 614,667 | | 19,061 |
Vodafone Group PLC | 36,632,743 | | 134,177 |
TOTAL UNITED KINGDOM | | 1,794,813 |
United States of America - 2.7% |
Beam, Inc. | 387,400 | | 26,072 |
Google, Inc. Class A (a) | 60,100 | | 61,938 |
Illumina, Inc. (a) | 12,500 | | 1,169 |
Common Stocks - continued |
| Shares | | Value (000s) |
United States of America - continued |
MasterCard, Inc. Class A | 160,100 | | $ 114,808 |
McGraw-Hill Companies, Inc. | 488,400 | | 34,032 |
Sohu.com, Inc. (a) | 313,700 | | 21,005 |
Visa, Inc. Class A | 260,000 | | 51,134 |
TOTAL UNITED STATES OF AMERICA | | 310,158 |
TOTAL COMMON STOCKS (Cost $8,462,801) |
10,703,033
|
Nonconvertible Preferred Stocks - 1.5% |
| | | |
Germany - 1.5% |
Volkswagen AG | 650,200 | | 165,262 |
United Kingdom - 0.0% |
Rolls-Royce Group PLC Series C | 361,003,490 | | 579 |
TOTAL NONCONVERTIBLE PREFERRED STOCKS (Cost $133,620) |
165,841
|
Government Obligations - 0.1% |
| Principal Amount (000s) | | |
United States of America - 0.1% |
U.S. Treasury Bills, yield at date of purchase 0.02% to 0.04% 1/2/14 (e)
(Cost $6,960) | | $ 6,960 | |
6,960
|
Money Market Funds - 4.0% |
| Shares | | |
Fidelity Cash Central Fund, 0.09% (b) | 431,996,301 | | 431,996 |
Fidelity Securities Lending Cash Central Fund, 0.09% (b)(c) | 22,072,034 | | 22,072 |
TOTAL MONEY MARKET FUNDS (Cost $454,068) |
454,068
|
TOTAL INVESTMENT PORTFOLIO - 100.3% (Cost $9,057,449) | | 11,329,902 |
NET OTHER ASSETS (LIABILITIES) - (0.3)% | | (35,016) |
NET ASSETS - 100% | $ 11,294,886 |
Futures Contracts |
| Expiration Date | | Underlying Face Amount at Value (000s) | | Unrealized Appreciation/
(Depreciation) (000s) |
Purchased |
Equity Index Contracts |
1,572 Nikkei 225 Index Contracts (Japan) | Dec. 2013 | | $ 113,695 | | $ 4,238 |
|
The face value of futures purchased as a percentage of net assets is 1% |
Legend |
(a) Non-income producing |
(b) Affiliated fund that is generally available only to investment companies and other accounts managed by Fidelity Investments. The rate quoted is the annualized seven-day yield of the fund at period end. A complete unaudited listing of the fund's holdings as of its most recent quarter end is available upon request. In addition, each Fidelity Central Fund's financial statements, which are not covered by the Fund's Report of Independent Registered Public Accounting Firm, are available on the SEC's website or upon request. |
(c) Investment made with cash collateral received from securities on loan. |
(d) Security or a portion of the security is on loan at period end. |
(e) Security or a portion of the security was pledged to cover margin requirements for futures contracts. At period end, the value of securities pledged amounted to $6,960,000. |
Affiliated Central Funds |
Information regarding fiscal year to date income earned by the Fund from investments in Fidelity Central Funds is as follows: |
Fund | Income earned
(Amounts in thousands) |
Fidelity Cash Central Fund | $ 420 |
Fidelity Securities Lending Cash Central Fund | 5,441 |
Total | $ 5,861 |
Other Affiliated Issuers |
An affiliated company is a company in which the Fund has ownership of at least 5% of the voting securities. Fiscal year to date transactions with companies which are or were affiliates are as follows: |
Affiliate
(Amounts in thousands) | Value, beginning of period | Purchases | Sales Proceeds | Dividend Income | Value,
end of
period |
Boyner Buyuk Magazacilik A/S | $ 10,764 | $ - | $ 16,020 | $ - | $ - |
Other Information |
Categorizations in the Schedule of Investments are based on country or territory of incorporation. |
The following is a summary of the inputs used, as of October 31, 2013, involving the Fund's assets and liabilities carried at fair value. The inputs or methodology used for valuing securities may not be an indication of the risk associated with investing in those securities. For more information on valuation inputs, and their aggregation into the levels used in the table below, please refer to the Investment Valuation section in the accompanying Notes to Financial Statements. |
Valuation Inputs at Reporting Date: |
Description
(Amounts in thousands) | Total | Level 1 | Level 2 | Level 3 |
Investments in Securities: | | | | |
Equities: | | | | |
Consumer Discretionary | $ 1,843,308 | $ 1,414,445 | $ 418,062 | $ 10,801 |
Consumer Staples | 1,147,236 | 582,788 | 564,448 | - |
Energy | 441,636 | 267,909 | 173,727 | - |
Financials | 2,821,082 | 1,658,069 | 1,163,013 | - |
Health Care | 1,087,724 | 771,553 | 316,171 | - |
Industrials | 1,451,790 | 1,132,697 | 319,093 | - |
Information Technology | 867,159 | 575,926 | 291,233 | - |
Materials | 577,937 | 441,335 | 136,602 | - |
Telecommunication Services | 565,743 | 162,001 | 403,742 | - |
Utilities | 65,259 | 65,259 | - | - |
Government Obligations | 6,960 | - | 6,960 | - |
Money Market Funds | 454,068 | 454,068 | - | - |
Total Investments in Securities: | $ 11,329,902 | $ 7,526,050 | $ 3,793,051 | $ 10,801 |
Derivative Instruments: | | | | |
Assets | | | | |
Futures Contracts | $ 4,238 | $ 4,238 | $ - | $ - |
The following is a summary of transfers between Level 1 and Level 2 for the period ended October 31, 2013. Transfers are assumed to have occurred at the beginning of the period, and are primarily attributable to the valuation techniques used for foreign equity securities, as discussed in the accompanying Notes to Financial Statements: |
Transfers | Total (000s) |
Level 1 to Level 2 | $ 712,449 |
Level 2 to Level 1 | $ 0 |
Value of Derivative Instruments |
The following table is a summary of the Fund's value of derivative instruments by primary risk exposure as of October 31, 2013. For additional information on derivative instruments, please refer to the Derivative Instruments section in the accompanying Notes to Financial Statements. |
Primary Risk Exposure /
Derivative Type | Value |
| Asset | Liability |
Equity Risk | | |
Futures Contracts (a) | $ 4,238 | $ - |
(a) Reflects gross cumulative appreciation (depreciation) on futures contracts as presented in the Schedule of Investments. Only the period end receivable or payable for daily variation margin and net unrealized appreciation (depreciation) are presented in the Statement of Assets and Liabilities. |
See accompanying notes which are an integral part of the financial statements.
Annual Report
Statement of Assets and Liabilities
Amounts in thousands (except per-share amounts) | October 31, 2013 |
| | |
Assets | | |
Investment in securities, at value (including securities loaned of $21,646) - See accompanying schedule: Unaffiliated issuers (cost $8,603,381) | $ 10,875,834 | |
Fidelity Central Funds (cost $454,068) | 454,068 | |
Total Investments (cost $9,057,449) | | $ 11,329,902 |
Foreign currency held at value (cost $934) | | 924 |
Receivable for investments sold | | 8,555 |
Receivable for fund shares sold | | 7,336 |
Dividends receivable | | 20,216 |
Distributions receivable from Fidelity Central Funds | | 122 |
Prepaid expenses | | 35 |
Other receivables | | 4,081 |
Total assets | | 11,371,171 |
| | |
Liabilities | | |
Payable for investments purchased | $ 38,436 | |
Payable for fund shares redeemed | 5,719 | |
Accrued management fee | 6,631 | |
Distribution and service plan fees payable | 128 | |
Payable for daily variation margin for derivative instruments | 983 | |
Other affiliated payables | 1,581 | |
Other payables and accrued expenses | 735 | |
Collateral on securities loaned, at value | 22,072 | |
Total liabilities | | 76,285 |
| | |
Net Assets | | $ 11,294,886 |
Net Assets consist of: | | |
Paid in capital | | $ 9,866,929 |
Undistributed net investment income | | 131,430 |
Accumulated undistributed net realized gain (loss) on investments and foreign currency transactions | | (979,010) |
Net unrealized appreciation (depreciation) on investments and assets and liabilities in foreign currencies | | 2,275,537 |
Net Assets | | $ 11,294,886 |
See accompanying notes which are an integral part of the financial statements.
Annual Report
Statement of Assets and Liabilities - continued
Amounts in thousands (except per-share amounts) | October 31, 2013 |
| | |
Calculation of Maximum Offering Price Class A:
Net Asset Value and redemption price per share ($346,717.68 ÷ 8,780.120 shares) | | $ 39.49 |
| | |
Maximum offering price per share (100/94.25 of $39.49) | | $ 41.90 |
Class T:
Net Asset Value and redemption price per share ($53,183.51 ÷ 1,355.789 shares) | | $ 39.23 |
| | |
Maximum offering price per share (100/96.50 of $39.23) | | $ 40.65 |
Class B:
Net Asset Value and offering price per share ($6,686.96 ÷ 171.088 shares)A | | $ 39.08 |
| | |
Class C:
Net Asset Value and offering price per share ($36,470.54 ÷ 933.457 shares)A | | $ 39.07 |
| | |
International Discovery:
Net Asset Value, offering price and redemption price per share ($7,799,575.78 ÷ 195,853.386 shares) | | $ 39.82 |
| | |
Class K:
Net Asset Value, offering price and redemption price per share ($2,576,018.46 ÷ 64,786.777 shares) | | $ 39.76 |
| | |
Institutional Class:
Net Asset Value, offering price and redemption price per share ($476,126.48 ÷ 11,975.218 shares) | | $ 39.76 |
| | |
Class Z:
Net Asset Value, offering price and redemption price per share ($106.86 ÷ 2.687 shares) | | $ 39.77 |
A Redemption price per share is equal to net asset value less any applicable contingent deferred sales charge.
See accompanying notes which are an integral part of the financial statements.
Annual Report
Financial Statements - continued
Statement of Operations
Amounts in thousands | Year ended October 31, 2013 |
| | |
Investment Income | | |
Dividends | | $ 233,738 |
Interest | | 3 |
Income from Fidelity Central Funds | | 5,861 |
Income before foreign taxes withheld | | 239,602 |
Less foreign taxes withheld | | (17,198) |
Total income | | 222,404 |
| | |
Expenses | | |
Management fee
Basic fee | $ 67,899 | |
Performance adjustment | 6,089 | |
Transfer agent fees | 16,474 | |
Distribution and service plan fees | 1,432 | |
Accounting and security lending fees | 1,778 | |
Custodian fees and expenses | 1,352 | |
Independent trustees' compensation | 54 | |
Registration fees | 215 | |
Audit | 119 | |
Legal | 24 | |
Miscellaneous | 76 | |
Total expenses before reductions | 95,512 | |
Expense reductions | (2,311) | 93,201 |
Net investment income (loss) | | 129,203 |
Realized and Unrealized Gain (Loss) Net realized gain (loss) on: | | |
Investment securities: | | |
Unaffiliated issuers | 671,713 | |
Other affiliated issuers | 4,258 | |
Foreign currency transactions | (1,963) | |
Futures contracts | 51,368 | |
Total net realized gain (loss) | | 725,376 |
Change in net unrealized appreciation (depreciation) on: Investment securities | 1,459,188 | |
Assets and liabilities in foreign currencies | (54) | |
Futures contracts | 4,238 | |
Total change in net unrealized appreciation (depreciation) | | 1,463,372 |
Net gain (loss) | | 2,188,748 |
Net increase (decrease) in net assets resulting from operations | | $ 2,317,951 |
See accompanying notes which are an integral part of the financial statements.
Annual Report
Statement of Changes in Net Assets
Amounts in thousands | Year ended
October 31,
2013 | Year ended
October 31,
2012 |
Increase (Decrease) in Net Assets | | |
Operations | | |
Net investment income (loss) | $ 129,203 | $ 143,212 |
Net realized gain (loss) | 725,376 | (207,579) |
Change in net unrealized appreciation (depreciation) | 1,463,372 | 762,141 |
Net increase (decrease) in net assets resulting
from operations | 2,317,951 | 697,774 |
Distributions to shareholders from net investment income | (146,031) | (118,968) |
Distributions to shareholders from net realized gain | (8,413) | - |
Total distributions | (154,444) | (118,968) |
Share transactions - net increase (decrease) | 714,712 | (915,362) |
Redemption fees | 128 | 128 |
Total increase (decrease) in net assets | 2,878,347 | (336,428) |
| | |
Net Assets | | |
Beginning of period | 8,416,539 | 8,752,967 |
End of period (including undistributed net investment income of $131,430 and undistributed net investment income of $126,507, respectively) | $ 11,294,886 | $ 8,416,539 |
See accompanying notes which are an integral part of the financial statements.
Annual Report
Financial Highlights - Class A
Years ended October 31, | 2013 | 2012 | 2011 | 2010 | 2009 |
Selected Per-Share Data | | | | | |
Net asset value, beginning of period | $ 31.66 | $ 29.43 | $ 32.07 | $ 28.57 | $ 23.68 |
Income from Investment Operations | | | | | |
Net investment income (loss) C | .34 | .41 | .42 | .31 | .31 |
Net realized and unrealized gain (loss) | 7.97 | 2.11 | (2.52) | 3.51 | 4.84 |
Total from investment operations | 8.31 | 2.52 | (2.10) | 3.82 | 5.15 |
Distributions from net investment income | (.45) | (.29) | (.38) | (.28) | (.26) |
Distributions from net realized gain | (.03) | - | (.16) | (.04) | - |
Total distributions | (.48) | (.29) | (.54) | (.32) | (.26) |
Redemption fees added to paid in capital C,G | - | - | - | - | - |
Net asset value, end of period | $ 39.49 | $ 31.66 | $ 29.43 | $ 32.07 | $ 28.57 |
Total Return A,B | 26.59% | 8.70% | (6.71)% | 13.43% | 22.14% |
Ratios to Average Net Assets D,F | | | | |
Expenses before reductions | 1.35% | 1.34% | 1.30% | 1.33% | 1.37% |
Expenses net of fee waivers, if any | 1.35% | 1.34% | 1.29% | 1.33% | 1.37% |
Expenses net of all reductions | 1.33% | 1.31% | 1.25% | 1.28% | 1.32% |
Net investment income (loss) | .97% | 1.41% | 1.31% | 1.06% | 1.28% |
Supplemental Data | | | | | |
Net assets, end of period (in millions) | $ 347 | $ 299 | $ 320 | $ 392 | $ 414 |
Portfolio turnover rate E | 65% | 68% | 75% | 82% | 98% |
A Total returns would have been lower if certain expenses had not been reduced during the applicable periods shown.
B Total returns do not include the effect of the sales charges.
C Calculated based on average shares outstanding during the period.
D Fees and expenses of any underlying Fidelity Central Funds are not included in the Fund's expense ratio. The Fund indirectly bears its proportionate share of the expenses of any underlying Fidelity Central Funds.
E Amount does not include the portfolio activity of any underlying Fidelity Central Funds.
F Expense ratios reflect operating expenses of the class. Expenses before reductions do not reflect amounts reimbursed by the investment adviser or reductions from brokerage service arrangements or reductions from other expense offset arrangements and do not represent the amount paid by the class during periods when reimbursements or reductions occur. Expenses net of fee waivers reflect expenses after reimbursement by the investment adviser but prior to reductions from brokerage service arrangements or other expense offset arrangements. Expenses net of all reductions represent the net expenses paid by the class.
G Amount represents less than $.01 per share.
See accompanying notes which are an integral part of the financial statements.
Annual Report
Financial Highlights - Class T
Years ended October 31, | 2013 | 2012 | 2011 | 2010 | 2009 |
Selected Per-Share Data | | | | | |
Net asset value, beginning of period | $ 31.42 | $ 29.18 | $ 31.81 | $ 28.35 | $ 23.49 |
Income from Investment Operations | | | | | |
Net investment income (loss) C | .26 | .34 | .34 | .23 | .24 |
Net realized and unrealized gain (loss) | 7.92 | 2.09 | (2.51) | 3.48 | 4.81 |
Total from investment operations | 8.18 | 2.43 | (2.17) | 3.71 | 5.05 |
Distributions from net investment income | (.34) | (.19) | (.30) | (.21) | (.19) |
Distributions from net realized gain | (.03) | - | (.16) | (.04) | - |
Total distributions | (.37) | (.19) | (.46) | (.25) | (.19) |
Redemption fees added to paid in capital C,G | - | - | - | - | - |
Net asset value, end of period | $ 39.23 | $ 31.42 | $ 29.18 | $ 31.81 | $ 28.35 |
Total Return A,B | 26.31% | 8.41% | (6.96)% | 13.14% | 21.79% |
Ratios to Average Net Assets D,F | | | | |
Expenses before reductions | 1.59% | 1.59% | 1.56% | 1.60% | 1.65% |
Expenses net of fee waivers, if any | 1.59% | 1.59% | 1.55% | 1.60% | 1.65% |
Expenses net of all reductions | 1.57% | 1.56% | 1.51% | 1.56% | 1.60% |
Net investment income (loss) | .73% | 1.16% | 1.05% | .79% | 1.00% |
Supplemental Data | | | | | |
Net assets, end of period (in millions) | $ 53 | $ 46 | $ 61 | $ 92 | $ 83 |
Portfolio turnover rate E | 65% | 68% | 75% | 82% | 98% |
A Total returns would have been lower if certain expenses had not been reduced during the applicable periods shown.
B Total returns do not include the effect of the sales charges.
C Calculated based on average shares outstanding during the period.
D Fees and expenses of any underlying Fidelity Central Funds are not included in the Fund's expense ratio. The Fund indirectly bears its proportionate share of the expenses of any underlying Fidelity Central Funds.
E Amount does not include the portfolio activity of any underlying Fidelity Central Funds.
F Expense ratios reflect operating expenses of the class. Expenses before reductions do not reflect amounts reimbursed by the investment adviser or reductions from brokerage service arrangements or reductions from other expense offset arrangements and do not represent the amount paid by the class during periods when reimbursements or reductions occur. Expenses net of fee waivers reflect expenses after reimbursement by the investment adviser but prior to reductions from brokerage service arrangements or other expense offset arrangements. Expenses net of all reductions represent the net expenses paid by the class.
G Amount represents less than $.01 per share.
See accompanying notes which are an integral part of the financial statements.
Annual Report
Financial Highlights - Class B
Years ended October 31, | 2013 | 2012 | 2011 | 2010 | 2009 |
Selected Per-Share Data | | | | | |
Net asset value, beginning of period | $ 31.28 | $ 29.02 | $ 31.60 | $ 28.18 | $ 23.25 |
Income from Investment Operations | | | | | |
Net investment income (loss) C | .08 | .19 | .17 | .08 | .12 |
Net realized and unrealized gain (loss) | 7.90 | 2.09 | (2.48) | 3.44 | 4.81 |
Total from investment operations | 7.98 | 2.28 | (2.31) | 3.52 | 4.93 |
Distributions from net investment income | (.15) | (.02) | (.12) | (.06) | - |
Distributions from net realized gain | (.03) | - | (.16) | (.04) | - |
Total distributions | (.18) | (.02) | (.27) H | (.10) | - |
Redemption fees added to paid in capital C,G | - | - | - | - | - |
Net asset value, end of period | $ 39.08 | $ 31.28 | $ 29.02 | $ 31.60 | $ 28.18 |
Total Return A,B | 25.64% | 7.85% | (7.39)% | 12.52% | 21.20% |
Ratios to Average Net Assets D,F | | | | |
Expenses before reductions | 2.10% | 2.09% | 2.06% | 2.12% | 2.16% |
Expenses net of fee waivers, if any | 2.10% | 2.09% | 2.06% | 2.12% | 2.16% |
Expenses net of all reductions | 2.08% | 2.06% | 2.02% | 2.08% | 2.11% |
Net investment income (loss) | .22% | .66% | .54% | .27% | .49% |
Supplemental Data | | | | | |
Net assets, end of period (in millions) | $ 7 | $ 8 | $ 10 | $ 14 | $ 16 |
Portfolio turnover rate E | 65% | 68% | 75% | 82% | 98% |
A Total returns would have been lower if certain expenses had not been reduced during the applicable periods shown.
B Total returns do not include the effect of the contingent deferred sales charge.
C Calculated based on average shares outstanding during the period.
D Fees and expenses of any underlying Fidelity Central Funds are not included in the Fund's expense ratio. The Fund indirectly bears its proportionate share of the expenses of any underlying Fidelity Central Funds.
E Amount does not include the portfolio activity of any underlying Fidelity Central Funds.
F Expense ratios reflect operating expenses of the class. Expenses before reductions do not reflect amounts reimbursed by the investment adviser or reductions from brokerage service arrangements or reductions from other expense offset arrangements and do not represent the amount paid by the class during periods when reimbursements or reductions occur. Expenses net of fee waivers reflect expenses after reimbursement by the investment adviser but prior to reductions from brokerage service arrangements or other expense offset arrangements. Expenses net of all reductions represent the net expenses paid by the class.
G Amount represents less than $.01 per share.
H Total distributions of $.27 per share is comprised of distributions from net investment income of $.115 and distributions from net realized gain of $.155 per share.
See accompanying notes which are an integral part of the financial statements.
Annual Report
Financial Highlights - Class C
Years ended October 31, | 2013 | 2012 | 2011 | 2010 | 2009 |
Selected Per-Share Data | | | | | |
Net asset value, beginning of period | $ 31.32 | $ 29.08 | $ 31.68 | $ 28.23 | $ 23.31 |
Income from Investment Operations | | | | | |
Net investment income (loss) C | .08 | .19 | .18 | .09 | .12 |
Net realized and unrealized gain (loss) | 7.90 | 2.09 | (2.49) | 3.45 | 4.82 |
Total from investment operations | 7.98 | 2.28 | (2.31) | 3.54 | 4.94 |
Distributions from net investment income | (.20) | (.04) | (.14) | (.05) | (.02) |
Distributions from net realized gain | (.03) | - | (.16) | (.04) | - |
Total distributions | (.23) | (.04) | (.29) H | (.09) | (.02) |
Redemption fees added to paid in capital C,G | - | - | - | - | - |
Net asset value, end of period | $ 39.07 | $ 31.32 | $ 29.08 | $ 31.68 | $ 28.23 |
Total Return A,B | 25.65% | 7.86% | (7.37)% | 12.54% | 21.22% |
Ratios to Average Net Assets D,F | | | | |
Expenses before reductions | 2.10% | 2.09% | 2.05% | 2.09% | 2.14% |
Expenses net of fee waivers, if any | 2.09% | 2.09% | 2.04% | 2.09% | 2.14% |
Expenses net of all reductions | 2.07% | 2.06% | 2.00% | 2.05% | 2.09% |
Net investment income (loss) | .23% | .66% | .56% | .30% | .51% |
Supplemental Data | | | | | |
Net assets, end of period (in millions) | $ 36 | $ 30 | $ 33 | $ 44 | $ 43 |
Portfolio turnover rate E | 65% | 68% | 75% | 82% | 98% |
A Total returns would have been lower if certain expenses had not been reduced during the applicable periods shown.
B Total returns do not include the effect of the contingent deferred sales charge.
C Calculated based on average shares outstanding during the period.
D Fees and expenses of any underlying Fidelity Central Funds are not included in the Fund's expense ratio. The Fund indirectly bears its proportionate share of the expenses of any underlying Fidelity Central Funds.
E Amount does not include the portfolio activity of any underlying Fidelity Central Funds.
F Expense ratios reflect operating expenses of the class. Expenses before reductions do not reflect amounts reimbursed by the investment adviser or reductions from brokerage service arrangements or reductions from other expense offset arrangements and do not represent the amount paid by the class during periods when reimbursements or reductions occur. Expenses net of fee waivers reflect expenses after reimbursement by the investment adviser but prior to reductions from brokerage service arrangements or other expense offset arrangements. Expenses net of all reductions represent the net expenses paid by the class.
G Amount represents less than $.01 per share.
H Total distributions of $.29 per share is comprised of distributions from net investment income of $.137 and distributions from net realized gain of $.155 per share.
See accompanying notes which are an integral part of the financial statements.
Annual Report
Financial Highlights - International Discovery
Years ended October 31, | 2013 | 2012 | 2011 | 2010 | 2009 |
Selected Per-Share Data | | | | | |
Net asset value, beginning of period | $ 31.91 | $ 29.69 | $ 32.34 | $ 28.79 | $ 23.88 |
Income from Investment Operations | | | | | |
Net investment income (loss) B | .47 | .51 | .53 | .40 | .37 |
Net realized and unrealized gain (loss) | 8.02 | 2.12 | (2.54) | 3.54 | 4.88 |
Total from investment operations | 8.49 | 2.63 | (2.01) | 3.94 | 5.25 |
Distributions from net investment income | (.55) | (.41) | (.48) | (.35) | (.34) |
Distributions from net realized gain | (.03) | - | (.16) | (.04) | - |
Total distributions | (.58) | (.41) | (.64) | (.39) | (.34) |
Redemption fees added to paid in capital B,F | - | - | - | - | - |
Net asset value, end of period | $ 39.82 | $ 31.91 | $ 29.69 | $ 32.34 | $ 28.79 |
Total Return A | 27.03% | 9.03% | (6.39)% | 13.76% | 22.47% |
Ratios to Average Net Assets C,E | | | | |
Expenses before reductions | 1.00% | 1.01% | .97% | 1.05% | 1.12% |
Expenses net of fee waivers, if any | 1.00% | 1.01% | .96% | 1.05% | 1.12% |
Expenses net of all reductions | .98% | .98% | .92% | 1.00% | 1.07% |
Net investment income (loss) | 1.32% | 1.73% | 1.64% | 1.35% | 1.53% |
Supplemental Data | | | | | |
Net assets, end of period (in millions) | $ 7,800 | $ 5,965 | $ 6,806 | $ 8,133 | $ 8,114 |
Portfolio turnover rate D | 65% | 68% | 75% | 82% | 98% |
A Total returns would have been lower if certain expenses had not been reduced during the applicable periods shown.
B Calculated based on average shares outstanding during the period.
C Fees and expenses of any underlying Fidelity Central Funds are not included in the Fund's expense ratio. The Fund indirectly bears its proportionate share of the expenses of any underlying Fidelity Central Funds.
D Amount does not include the portfolio activity of any underlying Fidelity Central Funds.
E Expense ratios reflect operating expenses of the class. Expenses before reductions do not reflect amounts reimbursed by the investment adviser or reductions from brokerage service arrangements or reductions from other expense offset arrangements and do not represent the amount paid by the class during periods when reimbursements or reductions occur. Expenses net of fee waivers reflect expenses after reimbursement by the investment adviser but prior to reductions from brokerage service arrangements or other expense offset arrangements. Expenses net of all reductions represent the net expenses paid by the class.
F Amount represents less than $.01 per share.
See accompanying notes which are an integral part of the financial statements.
Annual Report
Financial Highlights - Class K
Years ended October 31, | 2013 | 2012 | 2011 | 2010 | 2009 |
Selected Per-Share Data | | | | | |
Net asset value, beginning of period | $ 31.87 | $ 29.66 | $ 32.32 | $ 28.78 | $ 23.90 |
Income from Investment Operations | | | | | |
Net investment income (loss) B | .52 | .57 | .58 | .46 | .44 |
Net realized and unrealized gain (loss) | 8.01 | 2.11 | (2.54) | 3.53 | 4.86 |
Total from investment operations | 8.53 | 2.68 | (1.96) | 3.99 | 5.30 |
Distributions from net investment income | (.61) | (.47) | (.55) | (.41) | (.42) |
Distributions from net realized gain | (.03) | - | (.16) | (.04) | - |
Total distributions | (.64) | (.47) | (.70) G | (.45) | (.42) |
Redemption fees added to paid in capital B,F | - | - | - | - | - |
Net asset value, end of period | $ 39.76 | $ 31.87 | $ 29.66 | $ 32.32 | $ 28.78 |
Total Return A | 27.23% | 9.24% | (6.24)% | 13.96% | 22.80% |
Ratios to Average Net Assets C,E | | | | |
Expenses before reductions | .85% | .83% | .80% | .84% | .88% |
Expenses net of fee waivers, if any | .85% | .83% | .79% | .84% | .88% |
Expenses net of all reductions | .83% | .80% | .75% | .79% | .83% |
Net investment income (loss) | 1.47% | 1.91% | 1.81% | 1.55% | 1.77% |
Supplemental Data | | | | | |
Net assets, end of period (in millions) | $ 2,576 | $ 1,776 | $ 1,245 | $ 1,078 | $ 674 |
Portfolio turnover rate D | 65% | 68% | 75% | 82% | 98% |
A Total returns would have been lower if certain expenses had not been reduced during the applicable periods shown.
B Calculated based on average shares outstanding during the period.
C Fees and expenses of any underlying Fidelity Central Funds are not included in the Fund's expense ratio. The Fund indirectly bears its proportionate share of the expenses of any underlying Fidelity Central Funds.
D Amount does not include the portfolio activity of any underlying Fidelity Central Funds.
E Expense ratios reflect operating expenses of the class. Expenses before reductions do not reflect amounts reimbursed by the investment adviser or reductions from brokerage service arrangements or reductions from other expense offset arrangements and do not represent the amount paid by the class during periods when reimbursements or reductions occur. Expenses net of fee waivers reflect expenses after reimbursement by the investment adviser but prior to reductions from brokerage service arrangements or other expense offset arrangements. Expenses net of all reductions represent the net expenses paid by the class.
F Amount represents less than $.01 per share.
G Total distributions of $.70 per share is comprised of distributions from net investment income of $.548 and distributions from net realized gain of $.155 per share.
See accompanying notes which are an integral part of the financial statements.
Annual Report
Financial Highlights - Institutional Class
Years ended October 31, | 2013 | 2012 | 2011 | 2010 | 2009 |
Selected Per-Share Data | | | | | |
Net asset value, beginning of period | $ 31.87 | $ 29.65 | $ 32.31 | $ 28.77 | $ 23.91 |
Income from Investment Operations | | | | | |
Net investment income (loss) B | .47 | .52 | .54 | .41 | .39 |
Net realized and unrealized gain (loss) | 8.01 | 2.11 | (2.55) | 3.55 | 4.86 |
Total from investment operations | 8.48 | 2.63 | (2.01) | 3.96 | 5.25 |
Distributions from net investment income | (.56) | (.41) | (.50) | (.38) | (.39) |
Distributions from net realized gain | (.03) | - | (.16) | (.04) | - |
Total distributions | (.59) | (.41) | (.65) G | (.42) | (.39) |
Redemption fees added to paid in capital B,F | - | - | - | - | - |
Net asset value, end of period | $ 39.76 | $ 31.87 | $ 29.65 | $ 32.31 | $ 28.77 |
Total Return A | 27.03% | 9.07% | (6.39)% | 13.84% | 22.52% |
Ratios to Average Net Assets C,E | | | | |
Expenses before reductions | 1.00% | 1.00% | .95% | .99% | 1.05% |
Expenses net of fee waivers, if any | 1.00% | 1.00% | .94% | .99% | 1.05% |
Expenses net of all reductions | .97% | .97% | .90% | .95% | 1.00% |
Net investment income (loss) | 1.33% | 1.75% | 1.66% | 1.40% | 1.60% |
Supplemental Data | | | | | |
Net assets, end of period (in millions) | $ 476 | $ 294 | $ 278 | $ 319 | $ 267 |
Portfolio turnover rate D | 65% | 68% | 75% | 82% | 98% |
A Total returns would have been lower if certain expenses had not been reduced during the applicable periods shown.
B Calculated based on average shares outstanding during the period.
C Fees and expenses of any underlying Fidelity Central Funds are not included in the Fund's expense ratio. The Fund indirectly bears its proportionate share of the expenses of any underlying Fidelity Central Funds.
D Amount does not include the portfolio activity of any underlying Fidelity Central Funds.
E Expense ratios reflect operating expenses of the class. Expenses before reductions do not reflect amounts reimbursed by the investment adviser or reductions from brokerage service arrangements or reductions from other expense offset arrangements and do not represent the amount paid by the class during periods when reimbursements or reductions occur. Expenses net of fee waivers reflect expenses after reimbursement by the investment adviser but prior to reductions from brokerage service arrangements or other expense offset arrangements. Expenses net of all reductions represent the net expenses paid by the class.
F Amount represents less than $.01 per share.
G Total distributions of $.65 per share is comprised of distributions from net investment income of $.497 and distributions from net realized gain of $.155 per share.
See accompanying notes which are an integral part of the financial statements.
Annual Report
Financial Highlights - Class Z
Year ended October 31, | 2013 G |
Selected Per-Share Data | |
Net asset value, beginning of period | $ 37.22 |
Income from Investment Operations | |
Net investment income (loss) D | .07 |
Net realized and unrealized gain (loss) | 2.48 |
Total from investment operations | 2.55 |
Redemption fees added to paid in capital D,I | - |
Net asset value, end of period | $ 39.77 |
Total Return B,C | 6.85% |
Ratios to Average Net Assets E,H | |
Expenses before reductions | .85% A |
Expenses net of fee waivers, if any | .85% A |
Expenses net of all reductions | .83% A |
Net investment income (loss) | .76% A |
Supplemental Data | |
Net assets, end of period (000 omitted) | $ 107 |
Portfolio turnover rate F | 65% |
A Annualized
B Total returns for periods of less than one year are not annualized.
C Total returns would have been lower if certain expenses had not been reduced during the applicable periods shown.
D Calculated based on average shares outstanding during the period.
E Fees and expenses of any underlying Fidelity Central Funds are not included in the Fund's expense ratio. The Fund indirectly bears its proportionate share of the expenses of any underlying Fidelity Central Funds.
F Amount does not include the portfolio activity of any underlying Fidelity Central Funds.
G For the period August 13, 2013 (commencement of sale of shares) to October 31, 2013.
H Expense ratios reflect operating expenses of the class. Expenses before reductions do not reflect amounts reimbursed by the investment adviser or reductions from brokerage service arrangements or reductions from other expense offset arrangements and do not represent the amount paid by the class during periods when reimbursements or reductions occur. Expense ratios before reductions for start-up periods may not be representative of longer-term operating periods. Expenses net of fee waivers reflect expenses after reimbursement by the investment adviser but prior to reductions from brokerage service arrangements or other expense offset arrangements. Expenses net of all reductions represent the net expenses paid by the class.
I Amount represents less than $.01 per share.
See accompanying notes which are an integral part of the financial statements.
Annual Report
Notes to Financial Statements
For the period ended October 31, 2013
(Amounts in thousands except percentages)
1. Organization.
Fidelity International Discovery Fund (the Fund) is a fund of Fidelity Investment Trust (the Trust) and is authorized to issue an unlimited number of shares. The Trust is registered under the Investment Company Act of 1940, as amended (the 1940 Act), as an open-end management investment company organized as a Massachusetts business trust. The Fund commenced sale of Class Z shares on August 13, 2013. The Fund offers Class A, Class T, Class C, International Discovery, Class K, Institutional Class and Class Z shares, each of which, along with Class B shares, has equal rights as to assets and voting privileges. Class B shares are closed to new accounts and additional purchases, except for exchanges and reinvestments. Each class has exclusive voting rights with respect to matters that affect that class. Class B shares will automatically convert to Class A shares after a holding period of seven years from the initial date of purchase.
2. Investments in Fidelity Central Funds.
The Fund invests in Fidelity Central Funds, which are open-end investment companies generally available only to other investment companies and accounts managed by Fidelity Management & Research Company (FMR) and its affiliates. The Fund's Schedule of Investments lists each of the Fidelity Central Funds held as of period end, if any, as an investment of the Fund, but does not include the underlying holdings of each Fidelity Central Fund. As an Investing Fund, the Fund indirectly bears its proportionate share of the expenses of the underlying Fidelity Central Funds.
The Money Market Central Funds seek preservation of capital and current income and are managed by Fidelity Investments Money Management, Inc. (FIMM), an affiliate of FMR.
A complete unaudited list of holdings for each Fidelity Central Fund is available upon request or at the Securities and Exchange Commission (the SEC) website at www.sec.gov. In addition, the financial statements of the Fidelity Central Funds, which are not covered by the Fund's Report of Independent Registered Public Accounting Firm, are available on the SEC website or upon request.
3. Significant Accounting Policies.
The financial statements have been prepared in conformity with accounting principles generally accepted in the United States of America (GAAP), which require management to make certain estimates and assumptions at the date of the financial statements. Actual results could differ from those estimates. Subsequent events, if any, through the date that the financial statements were issued have been evaluated in the preparation of
Annual Report
3. Significant Accounting Policies - continued
the financial statements. The following summarizes the significant accounting policies of the Fund:
Investment Valuation. Investments are valued as of 4:00 p.m. Eastern time on the last calendar day of the period. In accordance with valuation policies and procedures approved by the Board of Trustees (the Board), the Fund attempts to obtain prices from one or more third party pricing vendors or brokers to value its investments. When current market prices, quotations or currency exchange rates are not readily available or reliable, investments will be fair valued in good faith by the FMR Fair Value Committee (the Committee), in accordance with procedures adopted by the Board. Factors used in determining fair value vary by investment type and may include market or investment specific events, changes in interest rates and credit quality. The frequency with which these procedures are used cannot be predicted and they may be utilized to a significant extent. The Committee oversees the Fund's valuation policies and procedures and is responsible for approving and reporting to the Board all fair value determinations.
The Fund categorizes the inputs to valuation techniques used to value its investments into a disclosure hierarchy consisting of three levels as shown below:
Level 1 - quoted prices in active markets for identical investments
Level 2 - other significant observable inputs (including quoted prices for similar investments, interest rates, prepayment speeds, etc.)
Level 3 - unobservable inputs (including the Fund's own assumptions based on the best information available)
Valuation techniques used to value the Fund's investments by major category are as follows:
Equity securities, including restricted securities, for which market quotations are readily available, are valued at the last reported sale price or official closing price as reported by a third party pricing vendor on the primary market or exchange on which they are traded and are categorized as Level 1 in the hierarchy. In the event there were no sales during the day or closing prices are not available, securities are valued at the last quoted bid price or may be valued using the last available price and are generally categorized as Level 2 in the hierarchy. For foreign equity securities, when market or security specific events arise, comparisons to the valuation of American Depositary Receipts (ADRs), futures contracts, Exchange-Traded Funds (ETFs) and certain indexes as well as quoted prices for similar securities may be used and would be categorized as Level 2 in the hierarchy. Utilizing these techniques may result in transfers between Level 1 and Level 2. For equity securities, including restricted securities, where observable inputs are
Annual Report
Notes to Financial Statements - continued
(Amounts in thousands except percentages)
3. Significant Accounting Policies - continued
Investment Valuation - continued
limited, assumptions about market activity and risk are used and these securities may be categorized as Level 3 in the hierarchy.
Debt securities, including restricted securities, are valued based on evaluated prices received from third party pricing vendors or from brokers who make markets in such securities. For U.S. government and government agency obligations, pricing vendors utilize matrix pricing which considers yield or price of bonds of comparable quality, coupon, maturity and type as well as broker-supplied prices. When independent prices are unavailable or unreliable, debt securities may be valued utilizing pricing methodologies which consider similar factors that would be used by third party pricing vendors. Debt securities are generally categorized as Level 2 in the hierarchy but may be Level 3 depending on the circumstances.
Futures contracts are valued at the settlement price established each day by the board of trade or exchange on which they are traded and are categorized as Level 1 in the hierarchy. Investments in open-end mutual funds, including the Fidelity Central Funds, are valued at their closing net asset value (NAV) each business day and are categorized as Level 1 in the hierarchy.
Changes in valuation techniques may result in transfers in or out of an assigned level within the disclosure hierarchy. The aggregate value of investments by input level, as of October 31, 2013, including information on transfers between Levels 1 and 2, is included at the end of the Fund's Schedule of Investments.
Foreign Currency. The Fund may use foreign currency contracts to facilitate transactions in foreign-denominated securities. Gains and losses from these transactions may arise from changes in the value of the foreign currency or if the counterparties do not perform under the contracts' terms.
Foreign-denominated assets, including investment securities, and liabilities are translated into U.S. dollars at the exchange rates at period end. Purchases and sales of investment securities, income and dividends received and expenses denominated in foreign currencies are translated into U.S. dollars at the exchange rate in effect on the transaction date.
The effects of exchange rate fluctuations on investments are included with the net realized and unrealized gain (loss) on investment securities. Other foreign currency transactions resulting in realized and unrealized gain (loss) are disclosed separately.
Investment Transactions and Income. For financial reporting purposes, the Fund's investment holdings and NAV include trades executed through the end of the last business day of the period. The NAV per share for processing shareholder transactions is
Annual Report
3. Significant Accounting Policies - continued
Investment Transactions and Income - continued
calculated as of the close of business of the New York Stock Exchange (NYSE), normally 4:00 p.m. Eastern time and includes trades executed through the end of the prior business day. Gains and losses on securities sold are determined on the basis of identified cost. Dividend income is recorded on the ex-dividend date, except for certain dividends from foreign securities where the ex-dividend date may have passed, which are recorded as soon as the Fund is informed of the ex-dividend date. Non-cash dividends included in dividend income, if any, are recorded at the fair market value of the securities received. Distributions received on securities that represent a return of capital or capital gain are recorded as a reduction of cost of investments and/or as a realized gain. Subsequent to ex-dividend date the Fund determines the components of these distributions, based upon receipt of tax filings or other correspondence relating to the underlying investment. Interest income and distributions from the Fidelity Central Funds are accrued as earned. Interest income includes coupon interest and amortization of premium and accretion of discount on debt securities. Investment income is recorded net of foreign taxes withheld where recovery of such taxes is uncertain.
Class Allocations and Expenses. Investment income, realized and unrealized capital gains and losses, common expenses of the Fund, and certain fund-level expense reductions, if any, are allocated daily on a pro-rata basis to each class based on the relative net assets of each class to the total net assets of the Fund. Each class differs with respect to transfer agent and distribution and service plan fees incurred. Certain expense reductions may also differ by class. For the reporting period, the allocated portion of income and expenses to each class as a percent of its average net assets may vary due to the timing of recording these transactions in relation to fluctuating net assets of the classes. Expenses directly attributable to a fund are charged to that fund. Expenses attributable to more than one fund are allocated among the respective funds on the basis of relative net assets or other appropriate methods. Expense estimates are accrued in the period to which they relate and adjustments are made when actual amounts are known.
Deferred Trustee Compensation. Under a Deferred Compensation Plan (the Plan), independent Trustees may elect to defer receipt of a portion of their annual compensation. Deferred amounts are invested in a cross-section of Fidelity funds, are marked-to-market and remain in the Fund until distributed in accordance with the Plan. The investment of deferred amounts and the offsetting payable to the Trustees are included in the accompanying Statement of Assets and Liabilities.
Income Tax Information and Distributions to Shareholders. Each year, the Fund intends to qualify as a regulated investment company under Subchapter M of the Internal Revenue Code, including distributing substantially all of its taxable income and realized gains. As a result, no provision for U.S. Federal income taxes is required. As of
Annual Report
Notes to Financial Statements - continued
(Amounts in thousands except percentages)
3. Significant Accounting Policies - continued
Income Tax Information and Distributions to Shareholders - continued
October 31, 2013, the Fund did not have any unrecognized tax benefits in the financial statements; nor is the Fund aware of any tax positions for which it is reasonably possible that the total amounts of unrecognized tax benefits will significantly change in the next twelve months. The Fund files a U.S. federal tax return, in addition to state and local tax returns as required. The Fund's federal income tax returns are subject to examination by the Internal Revenue Service (IRS) for a period of three fiscal years after they are filed. State and local tax returns may be subject to examination for an additional fiscal year depending on the jurisdiction. Foreign taxes are provided for based on the Fund's understanding of the tax rules and rates that exist in the foreign markets in which it invests.
Distributions are declared and recorded on the ex-dividend date. Income dividends and capital gain distributions are declared separately for each class. Income and capital gain distributions are determined in accordance with income tax regulations, which may differ from GAAP.
Capital accounts within the financial statements are adjusted for permanent book-tax differences. These adjustments have no impact on net assets or the results of operations. Temporary book-tax differences will reverse in a subsequent period.
Book-tax differences are primarily due to futures contracts, foreign currency transactions, passive foreign investment companies (PFIC), market discount, deferred trustees compensation, capital loss carryforwards and losses deferred due to wash sales.
The federal tax cost of investment securities and unrealized appreciation (depreciation) as of period end were as follows:
Gross unrealized appreciation | $ 2,288,825 |
Gross unrealized depreciation | (128,376) |
Net unrealized appreciation (depreciation) on securities and other investments | $ 2,160,449 |
| |
Tax Cost | $ 9,169,453 |
The tax-based components of distributable earnings as of period end were as follows:
Undistributed ordinary income | $ 219,779 |
Capital loss carryforward | $ (950,903) |
Net unrealized appreciation (depreciation) | $ 2,159,295 |
Annual Report
3. Significant Accounting Policies - continued
Income Tax Information and Distributions to Shareholders - continued
Capital loss carryforwards are only available to offset future capital gains of the Fund to the extent provided by regulations and may be limited. Under the Regulated Investment Company Modernization Act of 2010 (the Act), the Fund is permitted to carry forward capital losses incurred in taxable years beginning after December 22, 2010 for an unlimited period and such capital losses are required to be used prior to any losses that expire. The capital loss carryforward information presented below, including any applicable limitation, is estimated as of fiscal period end and is subject to adjustment.
Fiscal year of expiration | |
2017 | $ (950,903) |
The tax character of distributions paid was as follows:
| October 31, 2013 | October 31, 2012 |
Ordinary Income | $ 154,444 | $ 118,968 |
Short-Term Trading (Redemption) Fees. Shares held by investors in the Fund less than 30 days may have been subject to a redemption fee equal to 1.00% of the net asset value of shares redeemed. All redemption fees, which reduce the proceeds of the shareholder redemption, are retained by the Fund and accounted for as an addition to paid in capital.
New Accounting Pronouncement. The Financial Accounting Standards Board issued in December 2011, Accounting Standard Update No. 2011-11, Disclosures about Offsetting Assets and Liabilities, and in January 2013, Accounting Standards Update No. 2013-1 Clarifying the Scope of Disclosures about Offsetting Assets and Liabilities. These updates create new disclosure requirements requiring entities to disclose both gross and net information for derivatives and other financial instruments that are either offset in the Statement of Assets and Liabilities or subject to an enforceable master netting arrangement or similar agreement. The disclosure requirements are effective for annual reporting periods beginning on or after January 1, 2013, and interim periods within those annual periods. Management expects that the impact of the updates' adoption will be limited to additional financial statement disclosures as applicable.
4. Derivative Instruments.
Risk Exposures and the Use of Derivative Instruments. The Fund's investment objective allows the Fund to enter into various types of derivative contracts, including futures contracts. Derivatives are investments whose value is primarily derived from underlying assets, indices or reference rates and may be transacted on an exchange or
Annual Report
Notes to Financial Statements - continued
(Amounts in thousands except percentages)
4. Derivative Instruments - continued
Risk Exposures and the Use of Derivative Instruments - continued
over-the-counter (OTC). Derivatives may involve a future commitment to buy or sell a specified asset based on specified terms, to exchange future cash flows at periodic intervals based on a notional principal amount, or for one party to make one or more payments upon the occurrence of specified events in exchange for periodic payments from the other party.
The Fund used derivatives to increase returns and to manage exposure to certain risks as defined below. The success of any strategy involving derivatives depends on analysis of numerous economic factors, and if the strategies for investment do not work as intended, the Fund may not achieve its objectives.
The Fund's use of derivatives increased or decreased its exposure to the following risk:
Equity Risk | Equity risk relates to the fluctuations in the value of financial instruments as a result of changes in market prices (other than those arising from interest rate risk or foreign exchange risk), whether caused by factors specific to an individual investment, its issuer, or all factors affecting all instruments traded in a market or market segment. |
The Fund is also exposed to additional risks from investing in derivatives, such as liquidity risk and counterparty credit risk. Liquidity risk is the risk that the Fund will be unable to close out the derivative in the open market in a timely manner. Counterparty credit risk is the risk that the counterparty will not be able to fulfill its obligation to the Fund. Counterparty credit risk related to exchange-traded futures contracts may be mitigated by the protection provided by the exchange on which they trade.
Investing in derivatives may involve greater risks than investing in the underlying assets directly and, to varying degrees, may involve risk of loss in excess of any initial investment and collateral received and amounts recognized in the Statement of Assets and Liabilities. In addition, there may be the risk that the change in value of the derivative contract does not correspond to the change in value of the underlying instrument.
Futures Contracts. A futures contract is an agreement between two parties to buy or sell a specified underlying instrument for a fixed price at a specified future date. The Fund used futures contracts to manage its exposure to the stock market.
Upon entering into a futures contract, a fund is required to deposit either cash or securities (initial margin) with a clearing broker in an amount equal to a certain percentage of the face value of the contract. Futures contracts are marked-to-market daily and subsequent daily payments (variation margin) are made or received by a fund depending on the daily fluctuations in the value of the futures contracts and are recorded as unrealized
Annual Report
4. Derivative Instruments - continued
Futures Contracts - continued
appreciation or (depreciation). This receivable and/or payable, if any, is included in daily variation margin for derivative instruments in the Statement of Assets and Liabilities. Realized gain or (loss) is recorded upon the expiration or closing of a futures contract.
Any open futures contracts at period end are presented in the Schedule of Investments under the caption "Futures Contracts." The underlying face amount at value reflects each contract's exposure to the underlying instrument or index at period end and is representative of activity for the period. Securities deposited to meet initial margin requirements are identified in the Schedule of Investments.
During the period the Fund recognized net realized gain (loss) of $51,368 and a change in net unrealized appreciation (depreciation) of $4,238 related to its investment in futures contracts. These amounts are included in the Statement of Operations.
5. Purchases and Sales of Investments.
Purchases and sales of securities, other than short-term securities, aggregated $6,591,378 and $5,993,057, respectively.
6. Fees and Other Transactions with Affiliates.
Management Fee. FMR and its affiliates provide the Fund with investment management related services for which the Fund pays a monthly management fee. The management fee is the sum of an individual fund fee rate that is based on an annual rate of .45% of the Fund's average net assets and an annualized group fee rate that averaged .25% during the period. The group fee rate is based upon the average net assets of all the mutual funds advised by FMR, including any mutual funds previously advised by FMR that are currently advised by Fidelity SelectCo, LLC, an affiliate of FMR. The group fee rate decreases as assets under management increase and increases as assets under management decrease. In addition, the management fee is subject to a performance adjustment (up to a maximum of ± .20% of the Fund's average net assets over a 36 month performance period). The upward or downward adjustment to the management fee is based on the relative investment performance of International Discovery as compared to an appropriate benchmark index over the same 36 month performance period. For the reporting period, the total annual management fee rate, including the performance adjustment, was .77% of the Fund's average net assets. The performance adjustment included in the management fee rate may be higher or lower than the maximum performance adjustment rate due to the difference between the average net assets for the reporting and performance periods.
Annual Report
Notes to Financial Statements - continued
(Amounts in thousands except percentages)
6. Fees and Other Transactions with Affiliates - continued
Distribution and Service Plan Fees. In accordance with Rule 12b-1 of the 1940 Act, the Fund has adopted separate Distribution and Service Plans for each class of shares. Certain classes pay Fidelity Distributors Corporation (FDC), an affiliate of FMR, separate Distribution and Service Fees, each of which is based on an annual percentage of each class' average net assets. In addition, FDC may pay financial intermediaries for selling shares of the Fund and providing shareholder support services. For the period, the Distribution and Service Fee rates, total fees and amounts retained by FDC were as follows:
| Distribution
Fee | Service
Fee | Total Fees | Retained
by FDC |
Class A | -% | .25% | $ 796 | $ 9 |
Class T | .25% | .25% | 243 | 2 |
Class B | .75% | .25% | 69 | 52 |
Class C | .75% | .25% | 324 | 25 |
| | | $ 1,432 | $ 88 |
Sales Load. FDC may receive a front-end sales charge of up to 5.75% for selling Class A shares and 3.50% for selling Class T shares, some of which is paid to financial intermediaries for selling shares of the Fund. Depending on the holding period, FDC may receive contingent deferred sales charges levied on Class A, Class T, Class B, and Class C redemptions. The deferred sales charges range from 5.00% to 1.00% for Class B shares, 1.00% for Class C shares, 1.00% for certain purchases of Class A shares and .25% for certain purchases of Class T shares.
For the period, sales charge amounts retained by FDC were as follows:
| Retained
by FDC |
Class A | $ 56 |
Class T | 5 |
Class B* | 9 |
Class C* | 2 |
| $ 72 |
* When Class B and Class C shares are initially sold, FDC pays commissions from its own resources to financial intermediaries through which the sales are made.
Transfer Agent Fees. Fidelity Investments Institutional Operations Company, Inc., (FIIOC), an affiliate of FMR, is the transfer, dividend disbursing and shareholder servicing agent for each class of the Fund. FIIOC receives account fees and asset-based fees that vary according to the account size and type of account of the shareholders of the respective classes of the Fund, except for Class Z. FIIOC receives an asset-based fee of
Annual Report
6. Fees and Other Transactions with Affiliates - continued
Transfer Agent Fees - continued
Class K's and Class Z's average net assets. FIIOC pays for typesetting, printing and mailing of shareholder reports, except proxy statements.
For the period, transfer agent fees for each applicable class were as follows:
| Amount | % of
Average
Net Assets |
Class A | $ 954 | .30 |
Class T | 141 | .29 |
Class B | 21 | .30 |
Class C | 96 | .29 |
International Discovery | 13,480 | .20 |
Class K | 1,069 | .05 |
Institutional Class | 713 | .19 |
Class Z | -* | .05** |
| $ 16,474 | |
* Amount represents eleven dollars.
** Annualized
Accounting and Security Lending Fees. Fidelity Service Company, Inc. (FSC), an affiliate of FMR, maintains the Fund's accounting records. The accounting fee is based on the level of average net assets for each month. Under a separate contract, FSC administers the security lending program. The security lending fee is based on the number and duration of lending transactions.
Brokerage Commissions. The Fund placed a portion of its portfolio transactions with brokerage firms which are affiliates of the investment adviser. Brokerage commissions are included in net realized gain (loss) and change in net unrealized appreciation (depreciation) in the Statement of Operations. The commissions paid to these affiliated firms were $4 for the period.
7. Committed Line of Credit.
The Fund participates with other funds managed by FMR or an affiliate in a $4.25 billion credit facility (the "line of credit") to be utilized for temporary or emergency purposes to fund shareholder redemptions or for other short-term liquidity purposes. The Fund has agreed to pay commitment fees on its pro-rata portion of the line of credit, which amounted to $20 and is reflected in Miscellaneous expenses on the Statement of Operations. During the period, there were no borrowings on this line of credit.
Annual Report
Notes to Financial Statements - continued
(Amounts in thousands except percentages)
8. Security Lending.
The Fund lends portfolio securities through a lending agent from time to time in order to earn additional income. For equity securities, a lending agent is used and may loan securities to certain qualified borrowers, including Fidelity Capital Markets (FCM), a broker-dealer affiliated with the Fund. On the settlement date of the loan, the Fund receives collateral (in the form of U.S. Treasury obligations, letters of credit and/or cash) against the loaned securities and maintains collateral in an amount not less than 100% of the market value of the loaned securities during the period of the loan. The market value of the loaned securities is determined at the close of business of the Fund and any additional required collateral is delivered to the Fund on the next business day. If the borrower defaults on its obligation to return the securities loaned because of insolvency or other reasons, the Fund may apply collateral received from the borrower against the obligation. The Fund may experience delays and costs in recovering the securities loaned. Any cash collateral received is invested in the Fidelity Securities Lending Cash Central Fund. The value of loaned securities and cash collateral at period end are disclosed on the Fund's Statement of Assets and Liabilities. At period end, there were no security loans outstanding with FCM. Security lending income represents the income earned on investing cash collateral, less rebates paid to borrowers and any lending agent fees associated with the loan, plus any premium payments received for lending certain types of securities. Security lending income is presented in the Statement of Operations as a component of income from Fidelity Central Funds. Total security lending income during the period amounted to $5,441, including $40 from securities loaned to FCM.
9. Expense Reductions.
FMR voluntarily agreed to reimburse a portion of the following class' operating expense.
During the period, this reimbursement reduced expenses as follows:
| Reimbursement |
International Discovery | $ 10 |
Class K | 3 |
Institutional Class | 1 |
| $ 14 |
Commissions paid to certain brokers with whom FMR, or its affiliates, places trades on behalf of the Fund include an amount in addition to trade execution, which may be rebated back to the Fund to offset certain expenses. This amount totaled $2,236 for the period.
In addition, FMR reimbursed a portion of the Fund's operating expenses during the period in the amount of $61.
Annual Report
10. Distributions to Shareholders.
Distributions to shareholders of each class were as follows:
Years ended October 31, | 2013 | 2012 |
From net investment income | | |
Class A | $ 4,138 | $ 3,123 |
Class T | 492 | 388 |
Class B | 34 | 6 |
Class C | 186 | 44 |
International Discovery | 101,466 | 90,633 |
Class K | 34,651 | 20,917 |
Institutional Class | 5,064 | 3,857 |
Total | $ 146,031 | $ 118,968 |
From net realized gain | | |
Class A | $ 297 | $ - |
Class T | 46 | - |
Class B | 7 | - |
Class C | 30 | - |
International Discovery | 5,914 | - |
Class K | 1,827 | - |
Institutional Class | 292 | - |
Total | $ 8,413 | $ - |
11. Share Transactions.
Transactions for each class of shares were as follows:
| Shares | Dollars |
Years ended October 31, | 2013 A | 2012 | 2013 A | 2012 |
Class A | | | | |
Shares sold | 1,772 | 1,927 | $ 62,186 | $ 56,732 |
Reinvestment of distributions | 132 | 101 | 4,249 | 2,828 |
Shares redeemed | (2,553) | (3,468) | (88,988) | (100,935) |
Net increase (decrease) | (649) | (1,440) | $ (22,553) | $ (41,375) |
Class T | | | | |
Shares sold | 227 | 220 | $ 7,911 | $ 6,409 |
Reinvestment of distributions | 16 | 13 | 512 | 369 |
Shares redeemed | (347) | (860) | (11,997) | (25,207) |
Net increase (decrease) | (104) | (627) | $ (3,574) | $ (18,429) |
Class B | | | | |
Shares sold | 4 | 3 | $ 137 | $ 87 |
Reinvestment of distributions | 1 | - | 39 | 5 |
Shares redeemed | (75) | (113) | (2,570) | (3,297) |
Net increase (decrease) | (70) | (110) | $ (2,394) | $ (3,205) |
Annual Report
Notes to Financial Statements - continued
(Amounts in thousands except percentages)
11. Share Transactions - continued
| Shares | Dollars |
Years ended October 31, | 2013 A | 2012 | 2013 A | 2012 |
Class C | | | | |
Shares sold | 184 | 212 | $ 6,532 | $ 6,111 |
Reinvestment of distributions | 6 | 1 | 193 | 39 |
Shares redeemed | (207) | (395) | (7,250) | (11,440) |
Net increase (decrease) | (17) | (182) | $ (525) | $ (5,290) |
International Discovery | | | | |
Shares sold | 37,338 | 20,324 | $ 1,332,523 | $ 608,478 |
Reinvestment of distributions | 3,176 | 3,081 | 102,608 | 86,858 |
Shares redeemed | (31,569) | (65,748) | (1,103,313) | (1,937,202) |
Net increase (decrease) | 8,945 | (42,343) | $ 331,818 | $ (1,241,866) |
Class K | | | | |
Shares sold | 19,989 | 26,836 | $ 699,723 | $ 788,860 |
Reinvestment of distributions | 1,132 | 744 | 36,478 | 20,917 |
Shares redeemed | (12,053) | (13,817) | (423,712) | (410,022) |
Net increase (decrease) | 9,068 | 13,763 | $ 312,489 | $ 399,755 |
Institutional Class | | | | |
Shares sold | 4,893 | 2,049 | $ 175,669 | $ 59,460 |
Reinvestment of distributions | 68 | 53 | 2,182 | 1,502 |
Shares redeemed | (2,219) | (2,256) | (78,500) | (65,914) |
Net increase (decrease) | 2,742 | (154) | $ 99,351 | $ (4,952) |
Class Z | | | | |
Shares sold | 3 | - | $ 100 | $ - |
Net increase (decrease) | 3 | - | $ 100 | $ - |
A Share transactions for Class Z are for the period August 13, 2013 (commencement of sale of shares) to October 31, 2013.
12. Other.
The Fund's organizational documents provide former and current trustees and officers with a limited indemnification against liabilities arising in connection with the performance of their duties to the Fund. In the normal course of business, the Fund may also enter into contracts that provide general indemnifications. The Fund's maximum exposure under these arrangements is unknown as this would be dependent on future claims that may be made against the Fund. The risk of material loss from such claims is considered remote.
At the end of the period, Strategic Advisers International Fund was the owner of record of approximately 11% of the total outstanding shares of the Fund.
Annual Report
To the Trustees of Fidelity Investment Trust and the Shareholders of Fidelity International Discovery Fund:
In our opinion, the accompanying statement of assets and liabilities, including the schedule of investments, and the related statements of operations and of changes in net assets and the financial highlights present fairly, in all material respects, the financial position of Fidelity International Discovery Fund (a fund of Fidelity Investment Trust) at October 31, 2013, the results of its operations for the year then ended, the changes in its net assets for each of the two years in the period then ended and the financial highlights for each of the periods indicated, in conformity with accounting principles generally accepted in the United States of America. These financial statements and financial highlights (hereafter referred to as "financial statements") are the responsibility of the Fidelity International Discovery Fund's management. Our responsibility is to express an opinion on these financial statements based on our audits. We conducted our audits of these financial statements in accordance with the standards of the Public Company Accounting Oversight Board (United States). Those standards require that we plan and perform the audit to obtain reasonable assurance about whether the financial statements are free of material misstatement. An audit includes examining, on a test basis, evidence supporting the amounts and disclosures in the financial statements, assessing the accounting principles used and significant estimates made by management, and evaluating the overall financial statement presentation. We believe that our audits, which included confirmation of securities at October 31, 2013 by correspondence with the custodian and brokers, provide a reasonable basis for our opinion.
PricewaterhouseCoopers LLP
Boston, Massachusetts
December 16, 2013
Annual Report
The Trustees, Member of the Advisory Board, and executive officers of the trust and fund, as applicable, are listed below. The Board of Trustees governs the fund and is responsible for protecting the interests of shareholders. The Trustees are experienced executives who meet periodically throughout the year to oversee the fund's activities, review contractual arrangements with companies that provide services to the fund, oversee management of the risks associated with such activities and contractual arrangements, and review the fund's performance. Except for James C. Curvey, Ned C. Lautenbach, Ronald P. O'Hanley, and William S. Stavropoulos, each of the Trustees oversees 171 funds. Mr. Curvey oversees 394 funds. Mr. Lautenbach, Mr. O'Hanley, and Mr. Stavropoulos each oversees 245 funds.
The Trustees hold office without limit in time except that (a) any Trustee may resign; (b) any Trustee may be removed by written instrument, signed by at least two-thirds of the number of Trustees prior to such removal; (c) any Trustee who requests to be retired or who has become incapacitated by illness or injury may be retired by written instrument signed by a majority of the other Trustees; and (d) any Trustee may be removed at any special meeting of shareholders by a two-thirds vote of the outstanding voting securities of the trust. Each Trustee who is not an interested person of the trust and the fund (as defined in the 1940 Act) (Independent Trustee), shall retire not later than the last day of the calendar year in which his or her 75th birthday occurs. The Independent Trustees may waive this mandatory retirement age policy with respect to individual Trustees. The executive officers and Advisory Board Member hold office without limit in time, except that any officer and Advisory Board Member may resign or may be removed by a vote of a majority of the Trustees at any regular meeting or any special meeting of the Trustees. Except as indicated, each individual has held the office shown or other offices in the same company for the past five years.
Experience, Skills, Attributes, and Qualifications of the Fund's Trustees. The Governance and Nominating Committee has adopted a statement of policy that describes the experience, qualifications, attributes, and skills that are necessary and desirable for potential Independent Trustee candidates (Statement of Policy). The Board believes that each Trustee satisfied at the time he or she was initially elected or appointed a Trustee, and continues to satisfy, the standards contemplated by the Statement of Policy. The Governance and Nominating Committee also engages professional search firms to help identify potential Independent Trustee candidates who have the experience, qualifications, attributes, and skills consistent with the Statement of Policy. From time to time, additional criteria based on the composition and skills of the current Independent Trustees, as well as experience or skills that may be appropriate in light of future changes to board composition, business conditions, and regulatory or other developments, have also been considered by the professional search firms and the Governance and Nominating Committee. In addition, the Board takes into account the Trustees' commitment and participation in Board and committee meetings, as well as their leadership of standing and ad hoc committees throughout their tenure.
Annual Report
In determining that a particular Trustee was and continues to be qualified to serve as a Trustee, the Board has considered a variety of criteria, none of which, in isolation, was controlling. The Board believes that, collectively, the Trustees have balanced and diverse experience, qualifications, attributes, and skills, which allow the Board to operate effectively in governing the fund and protecting the interests of shareholders. Information about the specific experience, skills, attributes, and qualifications of each Trustee, which in each case led to the Board's conclusion that the Trustee should serve (or continue to serve) as a trustee of the fund, is provided below.
Board Structure and Oversight Function. James C. Curvey is an interested person (as defined in the 1940 Act) and currently serves as Chairman. The Trustees have determined that an interested Chairman is appropriate and benefits shareholders because an interested Chairman has a personal and professional stake in the quality and continuity of services provided to the fund. Independent Trustees exercise their informed business judgment to appoint an individual of their choosing to serve as Chairman, regardless of whether the Trustee happens to be independent or a member of management. The Independent Trustees have determined that they can act independently and effectively without having an Independent Trustee serve as Chairman and that a key structural component for assuring that they are in a position to do so is for the Independent Trustees to constitute a substantial majority for the Board. The Independent Trustees also regularly meet in executive session. Ned C. Lautenbach serves as Chairman of the Independent Trustees and as such (i) acts as a liaison between the Independent Trustees and management with respect to matters important to the Independent Trustees and (ii) with management prepares agendas for Board meetings.
Fidelity funds are overseen by different Boards of Trustees. The fund's Board oversees Fidelity's equity and high income funds and another Board oversees Fidelity's investment-grade bond, money market, and asset allocation funds. The asset allocation funds may invest in Fidelity funds overseen by the fund's Board. The use of separate Boards, each with its own committee structure, allows the Trustees of each group of Fidelity funds to focus on the unique issues of the funds they oversee, including common research, investment, and operational issues. On occasion, the separate Boards establish joint committees to address issues of overlapping consequences for the Fidelity funds overseen by each Board.
The Trustees operate using a system of committees to facilitate the timely and efficient consideration of all matters of importance to the Trustees, the fund, and fund shareholders and to facilitate compliance with legal and regulatory requirements and oversight of the fund's activities and associated risks. The Board, acting through its committees, has charged FMR and its affiliates with (i) identifying events or circumstances the occurrence of which could have demonstrably adverse effects on the fund's business and/or reputation; (ii) implementing processes and controls to lessen the possibility that such events or circumstances occur or to mitigate the effects of such events or circumstances if they do occur; and (iii) creating and maintaining a system designed to evaluate continuously business and market conditions in order to facilitate the identification and implementation processes described in (i) and (ii) above. Because the day-to-day operations and activities of the fund are carried out by or through FMR, its affiliates and other service providers, the fund's exposure to risks is mitigated but not eliminated by the processes overseen by the Trustees. While each of the Board's committees has responsibility for overseeing different aspects of the fund's activities, oversight is exercised primarily through the Operations, Audit, and Compliance Committees. In addition, the Independent Trustees have worked with FMR to enhance the Board's oversight of investment and financial risks, legal and regulatory risks, technology risks, and operational risks, including the development of additional risk reporting to the Board. For example, a working group comprised of Independent Trustees and FMR has worked and continues to work to review the Fidelity funds' valuation-related activities, reporting and risk management. Appropriate personnel, including but not limited to the fund's Chief Compliance Officer (CCO), FMR's internal auditor, the independent accountants, the fund's Treasurer and portfolio management personnel, make periodic reports to the Board's committees, as appropriate, including an annual review of FMR's risk management program for the Fidelity funds. The responsibilities of each standing committee, including their oversight responsibilities, are described further under "Standing Committees of the Fund's Trustees."
Annual Report
Trustees and Officers - continued
The fund's Statement of Additional Information (SAI) includes more information about the Trustees. To request a free copy, call Fidelity at 1-877-208-0098.
Interested Trustees*:
Correspondence intended for each Trustee who is an interested person may be sent to Fidelity Investments, 245 Summer Street, Boston, Massachusetts 02210.
Name, Year of Birth; Principal Occupations and Other Relevant Experience+ |
James C. Curvey (1935) |
Year of Election or Appointment: 2007 Trustee Chairman of the Board of Trustees |
| Mr. Curvey also serves as Trustee of other Fidelity funds. Mr. Curvey is a Director of Fidelity Investments Money Management, Inc. (2009-present), Director of Fidelity Research & Analysis Co. (2009-present) and Director of FMR and FMR Co., Inc. (2007-present). Mr. Curvey is also Vice Chairman (2007-present) and Director of FMR LLC. In addition, Mr. Curvey serves as an Overseer for the Boston Symphony Orchestra and a member of the Trustees of Villanova University. Previously, Mr. Curvey was the Vice Chairman (2006-2007) and Director (2000-2007) of FMR Corp. |
Ronald P. O'Hanley (1957) |
Year of Election or Appointment: 2011 Trustee |
| Mr. O'Hanley also serves as Trustee of other Fidelity funds. He is Director of Fidelity SelectCo, LLC (2013-present), FMR Co., Inc. (2010-present), Director of Fidelity Investments Money Management, Inc. (2010-present), Director of Fidelity Research & Analysis Company (2010-present), President of Fidelity Asset Management and Corporate Services and a Member of Fidelity's Executive Committee (2010-present). Previously, Mr. O'Hanley served as President and Chief Executive Officer of BNY Mellon Asset Management (2007-2010). Mr. O'Hanley also served as Vice Chairman of Bank New York Mellon Corp. and a member of that firm's Executive Committee. Prior to the 2007 merger of The Bank of New York and Mellon Financial Corporation, he was Vice Chairman of Mellon Financial Corporation and President and Chief Executive Officer of Mellon Asset Management. He joined Mellon in February 1997. Mr. O'Hanley currently serves as Chairman of the Boston Public Library Foundation Board of Directors and sits on the Board of Directors of Beth Israel Deaconess Medical Center, the Board of Trustees of the Marine Biological Laboratory and the Advisory Board of the Maxwell School of Citizenship and Public Administration at Syracuse University. Mr. O'Hanley also chairs the Council on Asset Management for the Financial Services Roundtable and is a member of the Board of Directors of Institutional Investor's U.S. Institute. |
* Trustees have been determined to be "Interested Trustees" by virtue of, among other things, their affiliation with the trust or various entities under common control with FMR.
+ The information above includes each Trustee's principal occupation during the last five years and other information relating to the experience, attributes, and skills relevant to each Trustee's qualifications to serve as a Trustee, which led to the conclusion that each Trustee should serve as a Trustee for the fund.
Annual Report
Trustees and Officers - continued
Independent Trustees:
Correspondence intended for each Independent Trustee (that is, the Trustees other than the Interested Trustees) may be sent to Fidelity Investments, P.O. Box 55235, Boston, Massachusetts 02205-5235.
Name, Year of Birth; Principal Occupations and Other Relevant Experience+ |
Dennis J. Dirks (1948) |
Year of Election or Appointment: 2005 Trustee |
| Mr. Dirks also serves as Trustee of other Fidelity funds. Prior to his retirement in May 2003, Mr. Dirks was Chief Operating Officer and a member of the Board of The Depository Trust & Clearing Corporation (DTCC). He also served as President, Chief Operating Officer, and Board member of The Depository Trust Company (DTC) and President and Board member of the National Securities Clearing Corporation (NSCC). In addition, Mr. Dirks served as Chief Executive Officer and Board member of the Government Securities Clearing Corporation, Chief Executive Officer and Board member of the Mortgage-Backed Securities Clearing Corporation, as a Trustee and a member of the Finance Committee of Manhattan College (2005-2008), and as a Trustee and a member of the Finance Committee of AHRC of Nassau County (2006-2008). Mr. Dirks is a member of the Independent Directors Council (IDC) Governing Council (2010-present) and Board of Directors for The Brookville Center for Children's Services, Inc. (2009-present). |
Alan J. Lacy (1953) |
Year of Election or Appointment: 2008 Trustee |
| Mr. Lacy also serves as Trustee of other Fidelity funds. Mr. Lacy serves as Senior Adviser (2007-present) of Oak Hill Capital Partners, L.P. (private equity). Mr. Lacy also served as Chief Executive Officer (2000-2005) and Vice Chairman (2005-2006) of Sears Holdings Corporation and Sears, Roebuck and Co. (retail). In addition, Mr. Lacy serves as a member of the Board of Directors of Dave & Buster's Entertainment, Inc. (restaurant and entertainment complexes, 2010-present), Earth Fare, Inc. (retail grocery, 2012-present), The Hillman Companies, Inc. (hardware wholesalers, 2010-present), and Bristol-Myers Squibb Company (global pharmaceuticals, 2008-present). Mr. Lacy is a member of the Board of Trustees of The National Parks Conservation Association (2006-present). Previously, Mr. Lacy served as Chairman of the Board of Trustees of the National Parks Conservation Association (2008-2011) and as a member of the Board of Directors for the Western Union Company (global money transfer, 2006-2011). |
Ned C. Lautenbach (1944) |
Year of Election or Appointment: 2000 Trustee Chairman of the Independent Trustees |
| Mr. Lautenbach also serves as Trustee of other Fidelity funds. Mr. Lautenbach currently serves as the Lead Director of the Eaton Corporation Board of Directors (diversified industrial, 1997-present). Mr. Lautenbach is Chairman of the Board of Directors of the Philharmonic Center for the Arts in Naples, Florida (2012-present) and a member of the Council on Foreign Relations (1994-present). Previously, Mr. Lautenbach was a Partner/Advisory Partner at Clayton, Dubilier & Rice, LLC (private equity investment, 1998-2010), as well as a Director of Sony Corporation (2006-2007). |
Joseph Mauriello (1944) |
Year of Election or Appointment: 2008 Trustee |
| Mr. Mauriello also serves as Trustee of other Fidelity funds. Prior to his retirement in January 2006, Mr. Mauriello served in numerous senior management positions including Deputy Chairman and Chief Operating Officer (2004-2005), and Vice Chairman of Financial Services (2002-2004) of KPMG LLP US (professional services, 1965-2005). Mr. Mauriello currently serves as a member of the Board of Directors of XL Group plc. (global insurance and re-insurance, 2006-present). Previously, Mr. Mauriello served as a Director of the Hamilton Funds of the Bank of New York (2006-2007) and of Arcadia Resources Inc. (health care services and products, 2007-2012). |
Robert W. Selander (1950) |
Year of Election or Appointment: 2011 Trustee |
| Mr. Selander also serves as Trustee of other Fidelity funds. Previously, Mr. Selander served as a Member of the Advisory Board of other Fidelity funds (2011), and Executive Vice Chairman (2010), Chief Executive Officer (2009-2010), and President and Chief Executive Officer (1997-2009) of Mastercard, Inc. |
Cornelia M. Small (1944) |
Year of Election or Appointment: 2005 Trustee |
| Ms. Small also serves as Trustee of other Fidelity funds. Ms. Small is a member of the Board of Directors (2009-present) and Chair of the Investment Committee (2010-present) of the Teagle Foundation. Ms. Small also serves on the Investment Committee of the Berkshire Taconic Community Foundation (2008-present). Previously, Ms. Small served as Chairperson (2002-2008) and a member of the Investment Committee and Chairperson (2008-2012) and a member of the Board of Trustees of Smith College. In addition, Ms. Small served as Chief Investment Officer, Director of Global Equity Investments, and a member of the Board of Directors of Scudder, Stevens & Clark and Scudder Kemper Investments. |
William S. Stavropoulos (1939) |
Year of Election or Appointment: 2001 Trustee Vice Chairman of the Independent Trustees |
| Mr. Stavropoulos also serves as Trustee of other Fidelity funds. Mr. Stavropoulos serves as President and Founder of the Michigan Baseball Foundation, the Great Lakes Loons (2007-present). Mr. Stavropoulos is Chairman Emeritus of the Board of Directors of The Dow Chemical Company, where he previously served in numerous senior management positions, including President, CEO (1995-2000; 2002-2004), Chairman of the Executive Committee (2000-2006), and as a member of the Board of Directors (1990-2006). Currently, Mr. Stavropoulos is Chairman of the Board of Directors of Univar Inc. (global distributor of commodity and specialty chemicals), a Director of Teradata Corporation (data warehousing and technology solutions), and Maersk Inc. (industrial conglomerate), and a member of the Advisory Board for Metalmark Capital LLC (private equity investment, 2005-present). Mr. Stavropoulos is an operating advisor to Clayton, Dubilier & Rice, LLC (private equity investment). In addition, Mr. Stavropoulos is a member of the University of Notre Dame Advisory Council for the College of Science, a Trustee of the Rollin L. Gerstacker Foundation, and a Director of the Naples Philharmonic Center for the Arts. Previously, Mr. Stavropoulos served as a Director of Chemical Financial Corporation (bank holding company, 1993-2012) and Tyco International, Ltd. (multinational manufacturing and services, 2007-2012). |
David M. Thomas (1949) |
Year of Election or Appointment: 2008 Trustee |
| Mr. Thomas also serves as Trustee of other Fidelity funds. Mr. Thomas serves as Non-Executive Chairman of the Board of Directors of Fortune Brands Home and Security (home and security products, 2011-present), and as a member of the Board of Directors of Interpublic Group of Companies, Inc. (marketing communication, 2004-present). Previously, Mr. Thomas served as Executive Chairman (2005-2006) and Chairman and Chief Executive Officer (2000-2005) of IMS Health, Inc. (pharmaceutical and healthcare information solutions), and a Director of Fortune Brands, Inc. (consumer products, 2000-2011). |
+ The information above includes each Trustee's principal occupation during the last five years and other information relating to the experience, attributes, and skills relevant to each Trustee's qualifications to serve as a Trustee, which led to the conclusion that each Trustee should serve as a Trustee for the fund.
Advisory Board Member and Executive Officers:
Correspondence intended for each executive officer and Peter S. Lynch may be sent to Fidelity Investments, 245 Summer Street, Boston, Massachusetts 02210. Executive officers appear below in alphabetical order.
Name, Year of Birth; Principal Occupation |
Peter S. Lynch (1944) |
Year of Election or Appointment: 2003 Member of the Advisory Board |
| Mr. Lynch also serves as Member of the Advisory Board of other Fidelity funds. Mr. Lynch is Vice Chairman and a Director of FMR and FMR Co., Inc. In addition, Mr. Lynch serves as a Trustee of Boston College and as the Chairman of the Inner-City Scholarship Fund. Previously, Mr. Lynch served on the Special Olympics International Board of Directors (1997-2006). |
Elizabeth Paige Baumann (1968) |
Year of Election or Appointment: 2012 Anti-Money Laundering (AML) Officer |
| Ms. Baumann also serves as AML Officer of other funds. She is Chief AML Officer of FMR LLC (2012-present) and is an employee of Fidelity Investments. Previously, Ms. Baumann served as Vice President and Deputy Anti-Money Laundering Officer (2007-2012). |
William C. Coffey (1969) |
Year of Election or Appointment: 2009 Assistant Secretary |
| Mr. Coffey also serves as Assistant Secretary of other funds. He is Senior Vice President and Deputy General Counsel of FMR LLC (2010-present), and is an employee of Fidelity Investments. Previously, Mr. Coffey served as Vice President and Associate General Counsel of FMR LLC (2005-2009). |
Jonathan Davis (1968) |
Year of Election or Appointment: 2010 Assistant Treasurer |
| Mr. Davis also serves as Assistant Treasurer of other funds. Mr. Davis is an employee of Fidelity Investments. Previously, Mr. Davis served as Vice President and Associate General Counsel of FMR LLC (2003-2010). |
Adrien E. Deberghes (1967) |
Year of Election or Appointment: 2008 Deputy Treasurer |
| Mr. Deberghes also serves as an officer of other funds. He is an employee of Fidelity Investments (2008-present). Prior to joining Fidelity Investments, Mr. Deberghes was Senior Vice President of Mutual Fund Administration at State Street Corporation (2007-2008), Senior Director of Mutual Fund Administration at Investors Bank & Trust (2005-2007), and Director of Finance for Dunkin' Brands (2000-2005). |
Stephanie J. Dorsey (1969) |
Year of Election or Appointment: 2010 Assistant Treasurer |
| Ms. Dorsey also serves as an officer of other funds. She is an employee of Fidelity Investments (2008-present) and has served in other fund officer roles. Prior to joining Fidelity Investments, Ms. Dorsey served as Treasurer (2004-2008) of the JPMorgan Mutual Funds and Vice President (2004-2008) of JPMorgan Chase Bank. |
Scott C. Goebel (1968) |
Year of Election or Appointment: 2008 Secretary and Chief Legal Officer (CLO) |
| Mr. Goebel serves as Secretary and CLO of other funds. Mr. Goebel also serves as Secretary of Fidelity Investments Money Management, Inc. (FIMM) (2010-present) and Fidelity Research and Analysis Company (FRAC) (2010-present); General Counsel, Secretary, and Senior Vice President of FMR (2008-present) and FMR Co., Inc. (2008-present); Chief Legal Officer of Fidelity Management & Research (Hong Kong) Limited (2008-present) and Assistant Secretary of Fidelity Management & Research (Japan) Inc. (2008-present), and Fidelity Management & Research (U.K.) Inc. (2008-present). Previously, Mr. Goebel served as Secretary and CLO of other Fidelity funds (2008-2013), Assistant Secretary of FIMM (2008-2010), FRAC (2008-2010), and certain funds (2007-2008); and as Vice President and Secretary of Fidelity Distributors Corporation (FDC) (2005-2007). Mr. Goebel has been employed by FMR LLC or an affiliate since 2001. |
Joseph A. Hanlon (1968) |
Year of Election or Appointment: 2012 Chief Compliance Officer |
| Mr. Hanlon also serves as Chief Compliance Officer of other funds. Mr. Hanlon serves as Compliance Officer of FMR, FMR Co., Inc., Fidelity Investments Money Management, Inc. (FIMM), Fidelity Research and Analysis Company (FRAC), and Fidelity Management & Research (Hong Kong) (2009-present), as Senior Vice President of the Fidelity Asset Management Division (2009-present), and is an employee of Fidelity Investments. Previously, Mr. Hanlon served as Compliance Officer of Fidelity Management & Research (Japan) Inc. (2009-2013), Strategic Advisers, Inc. (2009-2013), and Fidelity Management & Research (U.K.) Inc. (2009-2013). |
Bruce T. Herring (1965) |
Year of Election or Appointment: 2006 Vice President of certain Equity Funds |
| Mr. Herring also serves as Vice President of other funds. He serves as Chief Investment Officer of Fidelity Global Asset Allocation (GAA) (2013-present), Chief Investment Officer and Director of Fidelity Management & Research (U.K.) Inc. (2010-present), Group Chief Investment Officer of FMR, and President of Fidelity Research & Analysis Company (2010-present). Previously, Mr. Herring served as Vice President (2005-2006) and Senior Vice President (2006-2007) of Fidelity Management & Research Company, Vice President of FMR Co., Inc. (2001-2007), and as a portfolio manager for Fidelity U.S. Equity Funds. |
Brian B. Hogan (1964) |
Year of Election or Appointment: 2009 Vice President |
| Mr. Hogan also serves as Vice President of other funds. Mr. Hogan serves as President of FMR's Equity Division (2009-present). Previously, Mr. Hogan served as Senior Vice President, Equity Research of FMR (2006-2009) and as a portfolio manager. |
Chris Maher (1972) |
Year of Election or Appointment: 2013 Assistant Treasurer |
| Mr. Maher serves as Assistant Treasurer of other funds. Mr. Maher is Vice President of Valuation Oversight and is an employee of Fidelity Investments. Previously, Mr. Maher served as Vice President of Asset Management Compliance (2013), Vice President of FMR's Program Management Group (2010-2013), and Vice President of Valuation Oversight (2008-2010). |
Christine Reynolds (1958) |
Year of Election or Appointment: 2008 Chief Financial Officer |
| Ms. Reynolds also serves as Chief Financial Officer of other funds. Ms. Reynolds became President of Fidelity Pricing and Cash Management Services (FPCMS) in August 2008. Ms. Reynolds served as Chief Operating Officer of FPCMS (2007-2008). Previously, Ms. Reynolds served as President, Treasurer, and Anti-Money Laundering officer of the Fidelity funds (2004-2007). |
Kenneth B. Robins (1969) |
Year of Election or Appointment: 2008 President and Treasurer |
| Mr. Robins also serves as an officer of other funds. Mr. Robins serves as Executive Vice President of Fidelity Investments Money Management, Inc. (FIMM) (2013-present) and is an employee of Fidelity Investments (2004-present). Previously, Mr. Robins served in other fund officer roles. |
Gary W. Ryan (1958) |
Year of Election or Appointment: 2005 Assistant Treasurer |
| Mr. Ryan also serves as Assistant Treasurer of other funds. Mr. Ryan is an employee of Fidelity Investments and has served in other fund officer roles. Previously, Mr. Ryan served as Vice President of Fund Reporting in Fidelity Pricing and Cash Management Services (FPCMS) (1999-2005). |
Stephen Sadoski (1971) |
Year of Election or Appointment: 2012 Deputy Treasurer |
| Mr. Sadoski also serves as Deputy Treasurer of other funds. He is an employee of Fidelity Investments (2012-present) and has served in another fund officer role. Prior to joining Fidelity Investments, Mr. Sadoski served as an assistant chief accountant in the Division of Investment Management of the Securities and Exchange Commission (SEC) (2009-2012) and as a senior manager at Deloitte & Touche LLP (1997-2009). |
Stacie M. Smith (1974) |
Year of Election or Appointment: 2013 Deputy Treasurer |
| Ms. Smith also serves as an officer of other funds. She is an employee of Fidelity Investments (2009-present) and has served in other fund officer roles. Prior to joining Fidelity Investments, Ms. Smith served as Senior Audit Manager of Ernst & Young LLP (1996-2009). |
Renee Stagnone (1975) |
Year of Election or Appointment: 2013 Deputy Treasurer |
| Ms. Stagnone also serves as Deputy Treasurer of other funds. Ms. Stagnone is an employee of Fidelity Investments. |
Joseph F. Zambello (1957) |
Year of Election or Appointment: 2011 Deputy Treasurer |
| Mr. Zambello also serves as Deputy Treasurer of other funds. Mr. Zambello is an employee of Fidelity Investments. Previously, Mr. Zambello served as Vice President of FMR's Program Management Group (2009-2011) and Vice President of the Transfer Agent Oversight Group (2005-2009). |
Annual Report
The Board of Trustees of Fidelity Advisor International Discovery Fund voted to pay to shareholders of record at the opening of business on record date, the following distributions per share derived from capital gains realized from sales of portfolio securities, and dividends derived from net investment income:
| Pay Date | Record Date | Dividends | Capital Gains |
Class A | 12/09/13 | 12/06/13 | $0.334 | $0.311 |
Class T | 12/09/13 | 12/06/13 | $0.253 | $0.311 |
Class B | 12/09/13 | 12/06/13 | $0.013 | $0.311 |
Class C | 12/09/13 | 12/06/13 | $0.083 | $0.311 |
Class A designates 1%; Class T designates 1%; Class B designates 3%; and Class C designates 2%; of the dividends distributed respectively during fiscal year as qualifying for the dividends-received deduction for corporate shareholders.
Class A, Class T, Class B and Class C designate 100% of dividends distributed respectively during the fiscal year as amounts which may be taken into account as a dividend for purposes of the maximum rate under section 1(h)(11) of the Internal Revenue Code.
The amounts per share which represent income derived from sources within, and taxes paid to, foreign countries or possessions of the United States are as follows:
| Pay Date | Income | Taxes |
Class A | 12/10/12 | $0.420 | $0.026 |
Class T | 12/10/12 | $0.332 | $0.026 |
Class B | 12/10/12 | $0.172 | $0.026 |
Class C | 12/10/12 | $0.215 | $0.026 |
The fund will notify shareholders in January 2014 of amounts for use in preparing 2013 income tax returns.
Annual Report
Board Approval of Investment Advisory Contracts and Management Fees
Fidelity International Discovery Fund
Each year, the Board of Trustees, including the Independent Trustees (together, the Board), votes on the renewal of the management contract and sub-advisory agreements (together, the Advisory Contracts) for the fund. The Board, assisted by the advice of fund counsel and Independent Trustees' counsel, requests and considers a broad range of information relevant to the renewal of the Advisory Contracts throughout the year.
The Board meets regularly and, at each of its meetings, covers an extensive agenda of topics and materials and considers factors that are relevant to its annual consideration of the renewal of the fund's Advisory Contracts, including the services and support provided to the fund and its shareholders. The Board has established various standing committees, each composed of and chaired by Independent Trustees with varying backgrounds, to which the Board has assigned specific subject matter responsibilities in order to enhance effective decision-making by the Board. The Board, acting directly and through its Committees, requests and receives information concerning the annual consideration of the renewal of the fund's Advisory Contracts. The Board also meets as needed to consider matters specifically related to the Board's annual consideration of the renewal of Advisory Contracts. Members of the Board may also meet with trustees of other Fidelity funds through ad hoc joint committees to discuss certain matters relevant to the Fidelity funds.
At its July 2013 meeting, the Board, including the Independent Trustees, unanimously determined to renew the fund's Advisory Contracts. In reaching its determination, the Board considered all factors it believed relevant, including (i) the nature, extent, and quality of the services to be provided to the fund and its shareholders (including the investment performance of the fund); (ii) the competitiveness of the fund's management fee and total expense ratio relative to peer funds; (iii) the total costs of the services to be provided by and the profits to be realized by Fidelity from its relationship with the fund; (iv) the extent to which economies of scale exist and would be realized as the fund grows; and (v) whether fee levels reflect these economies of scale, if any, for the benefit of fund shareholders.
In considering whether to renew the Advisory Contracts for the fund, the Board reached a determination, with the assistance of fund counsel and Independent Trustees' counsel and through the exercise of its business judgment, that the renewal of the Advisory Contracts was in the best interests of the fund and its shareholders and that the compensation payable under the Advisory Contracts was fair and reasonable. The Board's decision to renew the Advisory Contracts was not based on any single factor, but rather was based on a comprehensive consideration of all the information provided to the Board at its meetings throughout the year. The Board, in reaching its determination to renew the Advisory Contracts, was aware that shareholders in the fund have a broad range of investment choices available to them, including a wide choice among mutual funds offered by Fidelity's competitors, and that the fund's shareholders, who have the opportunity to review and weigh the disclosure provided by the fund in its prospectus and other public disclosures, have chosen to invest in this fund, which is a part of the Fidelity family of funds.
Annual Report
Board Approval of Investment Advisory Contracts and
Management Fees - continued
Nature, Extent, and Quality of Services Provided. The Board considered the staffing within the investment adviser, Fidelity Management & Research Company (FMR), and the sub-advisers (together, the Investment Advisers) as it relates to the fund, including the backgrounds of the fund's investment personnel, and also considered the fund's investment objective, strategies, and related investment philosophy. The Independent Trustees also had discussions with senior management of Fidelity's investment operations and investment groups. The Board considered the structure of the portfolio manager compensation program and whether this structure provides appropriate incentives to act in the best interests of the fund.
Resources Dedicated to Investment Management and Support Services. The Board and the Fund Oversight and Research Committees reviewed the general qualifications and capabilities of the Investment Advisers' investment staff, including its size, education, experience, and resources, as well as the Investment Advisers' approach to recruiting, training, managing, and compensating investment personnel. The Board noted that FMR has continued to increase the resources devoted to non-U.S. offices, including expansion of Fidelity's global investment organization. The Board also noted that Fidelity's analysts have extensive resources, tools and capabilities that allow them to conduct sophisticated quantitative and fundamental analysis, as well as credit analysis of issuers, counterparties and guarantors. Further, the Board believes that Fidelity's investment professionals have sufficient access to global information and data so as to provide competitive investment results over time, and that those professionals also have access to sophisticated tools that permit them to assess portfolio construction and risk and performance attribution characteristics continuously, as well as to transmit new information and research conclusions rapidly around the world. Additionally, in its deliberations, the Board considered the Investment Advisers' trading and risk management capabilities and resources, which are an integral part of the investment management process.
Shareholder and Administrative Services. The Board considered (i) the nature, extent, quality, and cost of advisory, administrative, and shareholder services performed by the Investment Advisers and their affiliates under the Advisory Contracts and under separate agreements covering transfer agency, pricing and bookkeeping, and securities lending services for the fund; (ii) the nature and extent of the supervision of third party service providers, principally custodians and subcustodians; and (iii) the resources devoted to, and the record of compliance with, the fund's compliance policies and procedures. The Board also reviewed the allocation of fund brokerage, including allocations to brokers affiliated with the Investment Advisers, the use of brokerage commissions to pay fund expenses, and the use of "soft" commission dollars to pay for research services.
Annual Report
The Board noted that the growth of fund assets over time across the complex allows Fidelity to reinvest in the development of services designed to enhance the value or convenience of the Fidelity funds as investment vehicles. These services include 24-hour access to account information and market information through telephone representatives and over the Internet, investor education materials and asset allocation tools, and the expanded availability of Fidelity Investor Centers.
Investment in a Large Fund Family. The Board considered the benefits to shareholders of investing in a Fidelity fund, including the benefits of investing in a fund that is part of a large family of funds offering a variety of investment disciplines and providing a large variety of mutual fund investor services. The Board noted that Fidelity had taken, or had made recommendations that resulted in the Fidelity funds taking, a number of actions over the previous year that benefited particular funds, including (i) continuing to dedicate additional resources to investment research and to the support of the senior management team that oversees asset management; (ii) persisting in efforts to enhance Fidelity's global research capabilities; (iii) launching new funds and making other enhancements to meet client needs for global and income-oriented solutions; (iv) continuing to launch dedicated lower cost underlying funds to meet portfolio construction needs related to expanding underlying fund options for Fidelity funds of funds, specifically for the Freedom Fund product lines; (v) rationalizing product lines and gaining increased efficiencies through the mergers of several funds into other funds; (vi) strengthening Fidelity's index fund offerings by reducing investment minimums and adopting or lowering existing expense caps for certain funds and classes; (vii) enhancing Global Asset Allocation product offerings by launching new funds and strategies, including "open architecture" target date funds that utilize affiliated and unaffiliated sub-advisers; (viii) modifying the eligibility criteria for Institutional Class shares of Advisor funds to increase their marketability to a portion of the defined contribution plan market; (ix) creating a new low-cost retirement share class for certain Advisor funds to appeal to large retirement plans; (x) transitioning the management of certain Fidelity commodity funds to Geode Capital Management LLC, a registered commodity pool operator, while retaining administrative responsibilities for the funds; (xi) reorganizing a number of funds; and (xii) taking steps toward establishing a new Fidelity adviser to manage sector-based funds and products.
Investment Performance. The Board considered whether the fund has operated in accordance with its investment objective, as well as its record of compliance with its investment restrictions and its performance history.
The Board took into account discussions with the Investment Advisers about fund investment performance that occur at Board meetings throughout the year. In this regard the Board noted that as part of regularly scheduled fund reviews and other reports to the Board on fund performance, the Board periodically considers annualized return information for the fund, for different time periods, measured against a securities market index ("benchmark index") and a peer group of mutual funds with similar objectives ("peer group"). In its evaluation of fund investment performance, the Board gave particular attention to information indicating changes in performance of certain Fidelity funds for specific time periods and the Investment Advisers' explanations for any overperformance or underperformance.
Annual Report
Board Approval of Investment Advisory Contracts and
Management Fees - continued
In addition to reviewing absolute and relative fund performance, the Independent Trustees periodically consider the appropriateness of fund performance metrics in evaluating the results achieved. In general, the Independent Trustees believe that fund performance should be evaluated based on net performance (after fees and expenses) of both the highest performing and lowest performing classes, where applicable, compared to appropriate benchmark indices, over appropriate time periods which may include full market cycles, and compared to peer groups, as applicable, over the same periods, taking into account relevant factors including the following: general market conditions; issuer-specific information; tactical opportunities for investment; and fund cash flows and other factors.
The Independent Trustees recognize that shareholders evaluate performance on a net basis over their own holding periods, for which one-, three-, and five-year periods are used as a proxy. For this reason, the performance information reviewed by the Board also included net cumulative calendar year total return information for the fund and an appropriate benchmark index and peer group for the most recent one-, three-, and five-year periods, as shown below. Returns are shown compared to the 25th percentile (top of box) and 75th percentile (bottom of box) of the peer universe. Returns of the benchmark index are "net MA," i.e., adjusted for tax withholding rates applicable to U.S.-based mutual funds organized as Massachusetts business trusts.
Annual Report
Fidelity International Discovery Fund

The Board also considered that the fund's management fee is subject to upward or downward adjustment depending upon whether, and to what extent, the fund's investment performance for the performance period exceeds, or is exceeded by, a securities index, thus leading to a performance adjustment for the same period. The Board noted that the performance adjustment provides FMR with a strong economic incentive to seek to achieve superior performance for the fund's shareholders and helps to more closely align the interests of FMR and the fund's shareholders.
Based on its review, the Board concluded that the nature, extent, and quality of services provided to the fund under the Advisory Contracts should benefit the fund's shareholders.
Competitiveness of Management Fee and Total Expense Ratio. The Board considered the fund's management fee and total expense ratio compared to "mapped groups" of competitive funds and classes. Fidelity creates "mapped groups" by combining similar Lipper investment objective categories that have comparable management fee characteristics. Combining Lipper investment objective categories aids the Board's management fee and total expense ratio comparisons by broadening the competitive group used for comparison and by reducing the number of universes to which various Fidelity funds are compared.
Management Fee. The Board considered two proprietary management fee comparisons for the 12-month periods shown in the chart below. The group of Lipper funds used by the Board for management fee comparisons is referred to below as the "Total Mapped Group." The Total Mapped Group comparison focuses on a fund's standing in terms of gross management fees before expense reimbursements or caps, and without giving effect to the fund's performance adjustment, relative to the total universe of funds with comparable investment mandates, regardless of whether their management fee structures also are comparable. Funds with comparable investment mandates offer exposure to similar types of securities. Funds with comparable management fee structures have similar management fee contractual arrangements (e.g., flat rate charged for advisory services, all-inclusive fee rate, etc.). "TMG %" represents the percentage of funds in the Total Mapped Group that had management fees that were lower than the fund's. For example, a TMG % of 16% means that 84% of the funds in the Total Mapped Group had higher management fees than the fund. The "Asset-Size Peer Group" (ASPG) comparison focuses on a fund's standing relative to a subset of non-Fidelity funds within the Total Mapped Group that are similar in size and management fee structure. The ASPG represents at least 15% of the funds in the Total Mapped Group with comparable asset size and management fee structures, subject to a minimum of 50 funds (or all funds in the Total Mapped Group if fewer than 50). Additional information, such as the ASPG quartile in which the fund's management fee ranked and the impact of the fund's performance adjustment, is also included in the chart and considered by the Board.
Annual Report
Board Approval of Investment Advisory Contracts and
Management Fees - continued
Fidelity International Discovery Fund

The Board noted that the fund's management fee ranked below the median of its Total Mapped Group and below the median of its ASPG for 2012. The Board also noted the effect of the fund's positive performance adjustment on the fund's management fee ranking.
Annual Report
Based on its review, the Board concluded that the fund's management fee is fair and reasonable in light of the services that the fund receives and the other factors considered.
Total Expense Ratio. In its review of each class's total expense ratio, the Board considered the fund's management fee as well as other fund or class expenses, as applicable, such as transfer agent fees, pricing and bookkeeping fees, fund-paid 12b-1 fees, and custodial, legal, and audit fees. The Board also noted the effects of any waivers and reimbursements on fees and expenses, as well as the impact of the fund's performance adjustment. As part of its review, the Board also considered the current and historical total expense ratios of each class of the fund compared to competitive fund median expenses. Each class of the fund is compared to those funds and classes in the Total Mapped Group (used by the Board for management fee comparisons) that have a similar sales load structure.
The Board noted that the total expense ratio of each of Class A, Class B, Class C, Institutional Class, the retail class, and Class K ranked below its competitive median for 2012 and the total expense ratio of Class T ranked above its competitive median for 2012. The Board considered that, in general, various factors can affect total expense ratios. The Board noted that the total expense ratio of Class T was above the competitive median primarily because of higher 12b-1 fees on Class T. Class T has a higher 12b-1 fee, but a lower front-end sales charge, than traditionally priced front-end sales charge classes. The Board considered that Class T is primarily sold load-waived in the retirement plan market where its 0.50% 12b-1 fee is comparable to competing no-load, higher 12b-1 fee classes designed specifically for retirement plans. The Board noted that the fund offers multiple classes, each of which has a different sales load and 12b-1 fee structure, and that the multiple structures are intended to offer a range of pricing options for the intermediary market. The Board also noted that the total expense ratios of the classes vary primarily by the level of their 12b-1 fees, although differences in transfer agent fees may also cause expenses to vary from class to class.
Fees Charged to Other Fidelity Clients. The Board also considered Fidelity fee structures and other information with respect to clients of FMR and its affiliates, such as other mutual funds advised or subadvised by FMR or its affiliates, pension plan clients, and other institutional clients. The Board noted the findings of the 2013 ad hoc joint committee (created with the board of other Fidelity funds), which reviewed and compared Fidelity's institutional investment advisory business with its business of providing services to the Fidelity funds, including the differences in services provided, fees charged, and costs incurred, as well as competition in their respective marketplaces.
Based on its review of total expense ratios and fees charged to other Fidelity clients, the Board concluded that the total expense ratio of each class of the fund was reasonable, although Class T was above the median of the universe presented for comparison, in light of the services that the fund and its shareholders receive and the other factors considered.
Annual Report
Board Approval of Investment Advisory Contracts and
Management Fees - continued
Costs of the Services and Profitability. The Board considered the revenues earned and the expenses incurred by Fidelity in conducting the business of developing, marketing, distributing, managing, administering and servicing the fund and servicing the fund's shareholders. The Board also considered the level of Fidelity's profits in respect of all the Fidelity funds.
On an annual basis, FMR presents to the Board Fidelity's profitability for the fund. Fidelity calculates the profitability for each fund, as well as aggregate profitability for groups of Fidelity funds and all Fidelity funds, using a series of detailed revenue and cost allocation methodologies which originate with the books and records of Fidelity on which Fidelity's audited financial statements are based. The Audit Committee of the Board reviews any significant changes from the prior year's methodologies.
PricewaterhouseCoopers LLP (PwC), independent registered public accounting firm and auditor to Fidelity and certain Fidelity funds, has been engaged annually by the Board as part of the Board's assessment of Fidelity's profitability analysis. PwC's engagement includes the review and assessment of the methodologies used by Fidelity in determining the revenues and expenses attributable to Fidelity's mutual fund business, and completion of agreed-upon procedures surrounding the mathematical accuracy of fund profitability and its conformity to allocation methodologies. After considering PwC's reports issued under the engagement and information provided by Fidelity, the Board concluded that while other allocation methods may also be reasonable, Fidelity's profitability methodologies are reasonable in all material respects.
The Board also reviewed Fidelity's non-fund businesses and fall-out benefits related to the mutual fund business as well as cases where Fidelity's affiliates may benefit from or be related to the fund's business.
The Board considered the costs of the services provided by and the profits realized by Fidelity in connection with the operation of the fund and was satisfied that the profitability was not excessive in the circumstances.
Economies of Scale. The Board considered whether there have been economies of scale in respect of the management of the Fidelity funds, whether the Fidelity funds (including the fund) have appropriately benefited from any such economies of scale, and whether there is potential for realization of any further economies of scale. The Board considered the extent to which the fund will benefit from economies of scale through increased services to the fund, through waivers or reimbursements, or through fee or expense reductions. The Board also noted that in 2009, it and the board of other Fidelity funds created an ad hoc committee (the Economies of Scale Committee) to analyze whether FMR attains economies of scale in respect of the management and servicing of the Fidelity funds, whether the Fidelity funds have appropriately benefited from such economies of scale, and whether there is potential for realization of any further economies of scale.
Annual Report
The Board recognized that the fund's management contract incorporates a "group fee" structure, which provides for lower group fee rates as total fund assets under FMR's management increase, and for higher group fee rates as total fund assets under FMR's management decrease. FMR calculates the group fee rates based on a tiered asset "breakpoint" schedule that varies based on asset class. The Board considered that the group fee is designed to deliver the benefits of economies of scale to fund shareholders when total Fidelity fund assets increase, even if assets of any particular fund are unchanged or have declined, because some portion of Fidelity's costs are attributable to services provided to all Fidelity funds, and all funds benefit if those costs can be allocated among more assets. The Board concluded that, given the group fee structure, fund shareholders will benefit from lower management fees as assets under FMR's management increase at the fund complex level, regardless of whether Fidelity achieves any such economies of scale.
The Board concluded, taking into account the analysis of the Economies of Scale Committee, that economies of scale, if any, are being appropriately shared between fund shareholders and Fidelity.
Amendment to Description of Group Fee Rate. At its July 2013 meeting, the Board voted to approve an amendment to the fund's management contract to modify the description of the "group fee rate" effective August 1, 2013. The Board noted that under the prior description in the contract, the group fee rate was based on the average net assets of all registered investment companies with which FMR has management contracts. Under the contract's tiered asset breakpoint schedule, the group fee rate is lower as total fund assets under FMR's management increase, and higher as total fund assets under FMR's management decrease. The Board considered that the prior description would have excluded the assets of 64 Fidelity sector funds from the group fee rate calculation once Fidelity SelectCo, LLC, an affiliate of FMR, assumed management responsibilities for those funds. The Board noted that modifying the description of the group fee rate to continue to include the assets of those 64 funds for purposes of determining group fee rate breakpoints would avoid an immediate adverse impact on the group fee rate for any fund.
Additional Information Requested by the Board. In order to develop fully the factual basis for consideration of the Fidelity funds' Advisory Contracts, the Board requested and received additional information on certain topics, including: (i) fund performance trends and Fidelity's long-term strategies for certain funds; (ii) the potential to further rationalize the Fidelity fund lineup with the possibility of achieving savings for the funds and Fidelity; (iii) the methodology with respect to competitive fund data and peer group classifications; (iv) the arrangements with, and performance of, certain sub-advisers on behalf of the Fidelity funds, as well as certain proposed participating affiliate arrangements; (v) the realization of fall-out benefits in certain Fidelity business units; (vi) Fidelity's group fee structures, including the rationale for the individual fee rates of certain categories of funds and the definition of group assets; (vii) trends regarding industry use of performance fee structures and the performance adjustment methodologies applicable to the Fidelity funds; (viii) additional competitive analysis regarding the total expenses for certain classes; and (ix) fund profitability methodology, including Fidelity's cost allocation methodology, and the impact of certain factors on fund profitability results.
Annual Report
Board Approval of Investment Advisory Contracts and
Management Fees - continued
Based on its evaluation of all of the conclusions noted above, and after considering all factors it believed relevant, the Board ultimately concluded that the advisory fee structures are fair and reasonable, and that the fund's Advisory Contracts should be renewed.
Annual Report
Investment Adviser
Fidelity Management & Research Company
Boston, MA
Investment Sub-Advisers
FMR Co., Inc.
Fidelity Management & Research
(U.K.) Inc.
FIL Investment Advisors
FIL Investments (Japan) Limited
FIL Investment Advisors (U.K.) Limited
Fidelity Management & Research
(Hong Kong) Limited
Fidelity Management & Research
(Japan) Inc.
General Distributor
Fidelity Distributors Corporation
Smithfield, RI
Transfer and Service Agents
Fidelity Investments Institutional Operations Company, Inc.
Boston, MA
Fidelity Service Company, Inc.
Boston, MA
Custodian
The Northern Trust Company
Chicago, IL
(Fidelity Investment logo)(registered trademark)
AID-UANN-1213
1.806656.108
(Fidelity Investment logo)(registered trademark)
Fidelity Advisor®
International Discovery
Fund - Institutional Class
Annual Report
October 31, 2013
(Fidelity Cover Art)
Institutional Class is
a class of Fidelity®
International Discovery Fund
Contents
Performance | (Click Here) | How the fund has done over time. |
Management's Discussion of Fund Performance | (Click Here) | The Portfolio Manager's review of fund performance and strategy. |
Shareholder Expense Example | (Click Here) | An example of shareholder expenses. |
Investment Changes | (Click Here) | A summary of major shifts in the fund's investments over the past six months. |
Investments | (Click Here) | A complete list of the fund's investments with their market values. |
Financial Statements | (Click Here) | Statements of assets and liabilities, operations, and changes in net assets, as well as financial highlights. |
Notes | (Click Here) | Notes to financial statements. |
Report of Independent Registered Public Accounting Firm | (Click Here) | |
Trustees and Officers | (Click Here) | |
Distributions | (Click Here) | |
Board Approval of Investment Advisory Contracts and Management Fees | (Click Here) | |
To view a fund's proxy voting guidelines and proxy voting record for the 12-month period ended June 30, visit http://www.fidelity.com/proxyvotingresults or visit the Securities and Exchange Commission's (SEC) web site at http://www.sec.gov. You may also call 1-877-208-0098 to request a free copy of the proxy voting guidelines.
Standard & Poor's, S&P and S&P 500 are registered service marks of The McGraw-Hill Companies, Inc. and have been licensed for use by Fidelity Distributors Corporation.
Other third-party marks appearing herein are the property of their respective owners.
All other marks appearing herein are registered or unregistered trademarks or service marks of FMR LLC or an affiliated company. © 2013 FMR LLC. All rights reserved.
Annual Report
This report and the financial statements contained herein are submitted for the general information of the shareholders of the fund. This report is not authorized for distribution to prospective investors in the fund unless preceded or accompanied by an effective prospectus.
A fund files its complete schedule of portfolio holdings with the SEC for the first and third quarters of each fiscal year on Form N-Q. Forms N-Q are available on the SEC's web site at http://www.sec.gov. A fund's Forms N-Q may be reviewed and copied at the SEC's Public Reference Room in Washington, DC. Information regarding the operation of the SEC's Public Reference Room may be obtained by calling 1-800-SEC-0330. For a complete list of a fund's portfolio holdings, view the fund's most recent holdings listing, semiannual report, or annual report on Fidelity's web site at http://www.fidelity.com, http://www.advisor.fidelity.com, or http://www.401k.com, as applicable.
NOT FDIC INSURED • MAY LOSE VALUE • NO BANK GUARANTEE
Neither the fund nor Fidelity Distributors Corporation is a bank.
Annual Report
Average annual total return reflects the change in the value of an investment, assuming reinvestment of the class' distributions from dividend income and capital gains (the profits earned upon the sale of securities that have grown in value, if any) and assuming a constant rate of performance each year. The $10,000 table and the fund's returns do not reflect the deduction of taxes that a shareholder would pay on fund distributions or the redemption of fund shares. During periods of reimbursement by Fidelity, a fund's total return will be greater than it would be had the reimbursement not occurred. How a fund did yesterday is no guarantee of how it will do tomorrow.
Average Annual Total Returns
Periods ended October 31, 2013 | Past 1
year | Past 5
years | Past 10
years |
Institutional Class A, B | 27.03% | 12.59% | 8.75% |
A The initial offering of Institutional Class shares took place on January 6, 2005. Returns prior to January 6, 2005, are those of Fidelity® International Discovery Fund, the original class of the fund.
B Prior to October 1, 2004, the fund operated under certain different investment policies. The fund's historical performance may not represent its current investment policies.
$10,000 Over 10 Years
Let's say hypothetically that $10,000 was invested in Fidelity Advisor® International Discovery Fund - Institutional Class on October 31, 2003. The chart shows how the value of your investment would have changed, and also shows how the MSCI® EAFE® Index performed over the same period. See footnote A above for additional information regarding the performance of Institutional Class.
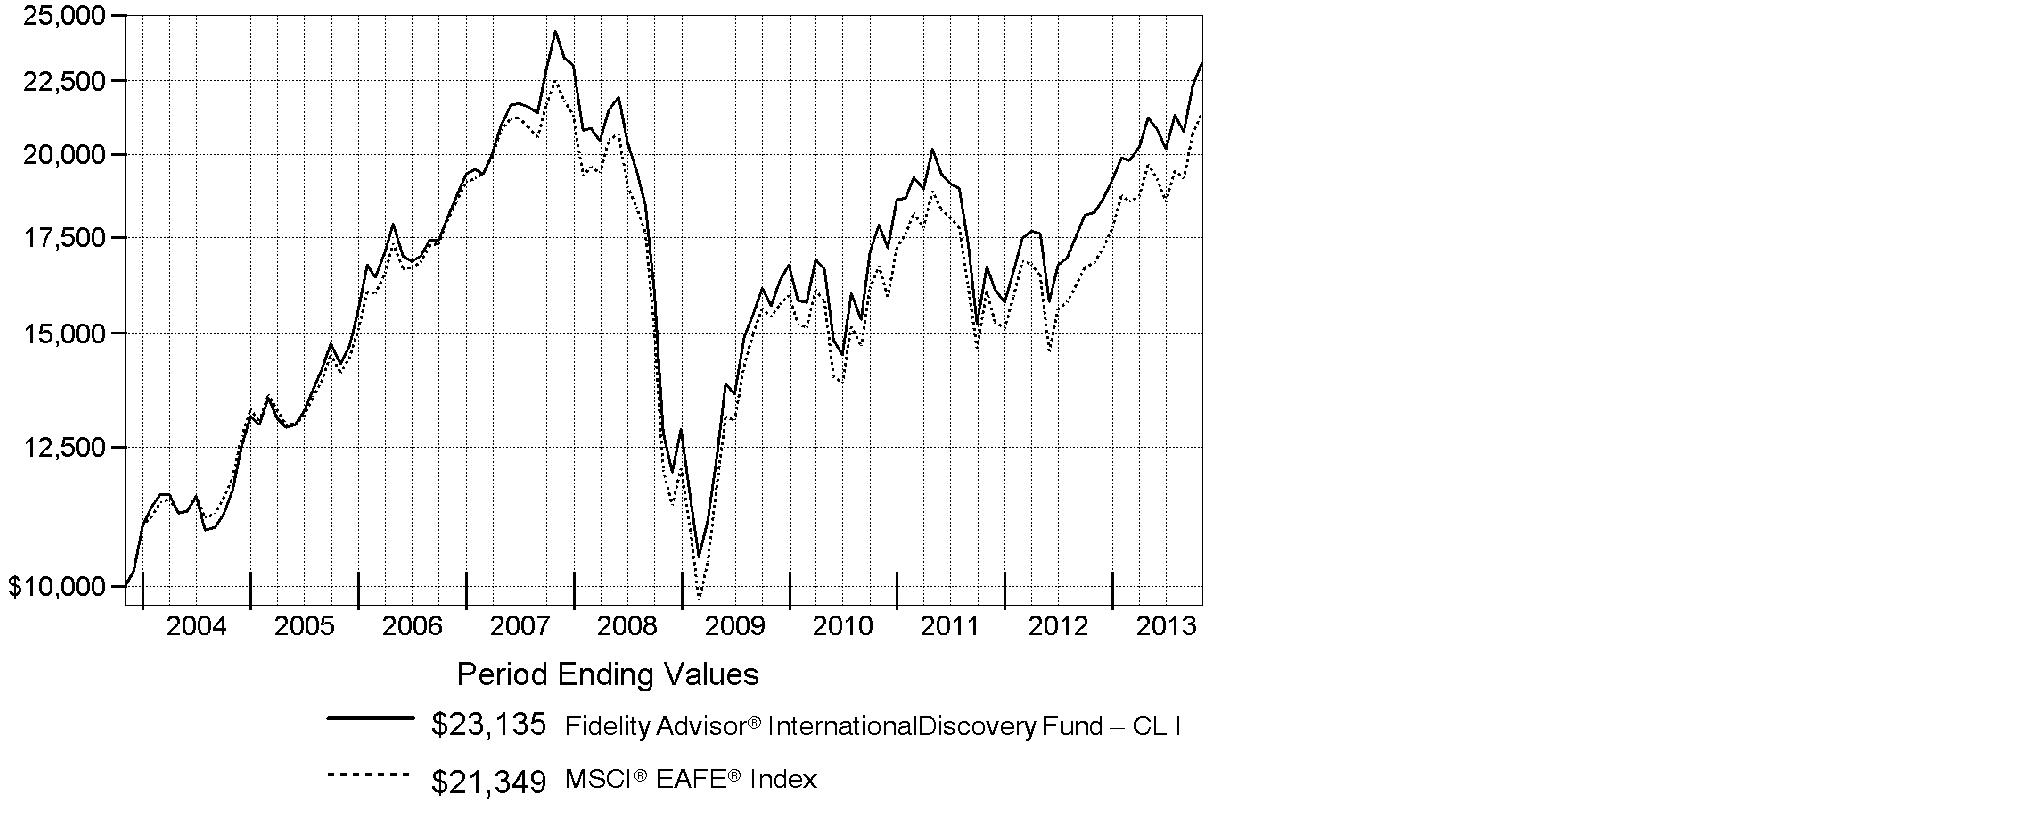
Annual Report
Market Recap: On balance, global equity markets remained upbeat for the 12-month period ending October 31, 2013. The MSCI® ACWI® (All Country World Index) Index gained 23.75% for the period, amid investor preference for higher-risk assets. The period was not without turbulence, however. In the spring and summer, central banks worldwide, especially in the U.S. and China, made clear their intentions to maintain accommodative monetary policies. That stance, combined with modest cyclical improvements around the globe and generally low valuations, underpinned the broad rally in equities. Europe (+32%) shone brightly, with most markets in the region - large and small - registering solid, index-beating gains. Another bright spot was Japan, which, despite a struggling yen and taking a second-half breather, posted a 34% result for the full year. The U.S. - by far the index's biggest constituent - also outperformed the global market with a roughly 28% advance. Meanwhile, Asia-Pacific ex Japan (+14%) lagged, hurt in part by a slowdown in Australia's mining industry as well as currency headwinds. Foreign-exchange and commodity weakness also curbed results in resource-heavy Canada and emerging markets (EM), both of which were up 7%. Country-level EM performance diverged meaningfully for the period, as evidenced by performance in Brazil (-1%), Russia (+12%), India (+1%) and China (+8%).
Comments from William Kennedy, Portfolio Manager of Fidelity Advisor® International Discovery Fund: For the year, the fund's Institutional Class shares returned 27.03%, compared with the 27.02% gain of its benchmark, the MSCI® EAFE® Index. Security selection aided relative performance, with notable outperformance in the U.K. and Japan. Positioning in the Asia Pacific ex Japan region and the materials sector also contributed, as did security selection in information technology. Top individual contributors included U.K.-based online-only supermarket Ocado Group, an out-of-index position that rallied after the company significantly expanded its business capacity. An overweighting in real estate leasing company ORIX stood out, as improved economic activity drove up real estate prices in Japan. By contrast, stock picks in core European countries, emerging markets and the automobiles and components segment of consumer discretionary detracted, along with a small cash position in an up market. Individual disappointments included Housing Development Finance, a large mortgage provider in India, whose stock declined along with the Indian rupee. An average underweighting in Toyota Motor also hurt, as the weakening yen combined with the company's market-share increases to propel the stock higher.
The views expressed above reflect those of the portfolio manager(s) only through the end of the period as stated on the cover of this report and do not necessarily represent the views of Fidelity or any other person in the Fidelity organization. Any such views are subject to change at any time based upon market or other conditions and Fidelity disclaims any responsibility to update such views. These views may not be relied on as investment advice and, because investment decisions for a Fidelity fund are based on numerous factors, may not be relied on as an indication of trading intent on behalf of any Fidelity fund.
Annual Report
Shareholder Expense Example
As a shareholder of the Fund, you incur two types of costs: (1) transaction costs, including sales charges (loads) on purchase payments or redemption proceeds, redemption fees and (2) ongoing costs, including management fees, distribution and/or service (12b-1) fees and other Fund expenses. This Example is intended to help you understand your ongoing costs (in dollars) of investing in the Fund and to compare these costs with the ongoing costs of investing in other mutual funds.
The actual expense Example is based on an investment of $1,000 invested at the beginning of the period and held for the entire period (May 1, 2013 to October 31, 2013) for Class A, Class T, Class B, Class C, International Discovery, Class K and Institutional Class and for the period (August 13, 2013 to October 31, 2013) for Class Z. The hypothetical expense Example is based on an investment of $1,000 invested for the one-half year period (May 1, 2013 to October 31, 2013).
Actual Expenses
The first line of the accompanying table for each class of the Fund provides information about actual account values and actual expenses. You may use the information in this line, together with the amount you invested, to estimate the expenses that you paid over the period. Simply divide your account value by $1,000.00 (for example, an $8,600 account value divided by $1,000.00 = 8.6), then multiply the result by the number in the first line for a class of the Fund under the heading entitled "Expenses Paid During Period" to estimate the expenses you paid on your account during this period. A small balance maintenance fee of $12.00 that is charged once a year may apply for certain accounts with a value of less than $2,000. This fee is not included in the table below. If it was, the estimate of expenses you paid during the period would be higher, and your ending account value lower, by this amount. In addition, the Fund, as a shareholder in the underlying Fidelity Central Funds, will indirectly bear its pro-rata share of the fees and expenses incurred by the underlying Fidelity Central Funds. These fees and expenses are not included in the Fund's annualized expense ratio used to calculate the expense estimate in the table below.
Hypothetical Example for Comparison Purposes
The second line of the accompanying table for each class of the Fund provides information about hypothetical account values and hypothetical expenses based on a Class' actual expense ratio and an assumed rate of return of 5% per year before expenses, which is not the Class' actual return. The hypothetical account values and expenses may not be used to estimate the actual ending account balance or expenses you paid for the period. You may use this information to compare the ongoing costs of investing in the Fund and other funds. To do so, compare this 5% hypothetical example with the 5% hypothetical examples that appear in the shareholder reports of the other funds. A small balance maintenance fee of $12.00 that is charged once a year may apply for certain accounts with a value of less than $2,000. This fee is not included in the table below. If it was, the estimate of expenses you paid during the period would be higher, and your ending account value lower, by this amount. In addition, the Fund, as a shareholder in the underlying Fidelity Central Funds, will indirectly bear its pro-rata share of the fees and expenses incurred by the underlying Fidelity Central Funds. These fees and expenses are not included in the Fund's annualized expense ratio used to calculate the expense estimate in the table below.
Annual Report
Please note that the expenses shown in the table are meant to highlight your ongoing costs only and do not reflect any transaction costs. Therefore, the second line of the table is useful in comparing ongoing costs only, and will not help you determine the relative total costs of owning different funds. In addition, if these transactional costs were included, your costs would have been higher.
| Annualized
Expense Ratio B | Beginning
Account Value | Ending
Account Value
October 31, 2013 | Expenses Paid
During Period |
Class A | 1.34% | | | |
Actual | | $ 1,000.00 | $ 1,089.10 | $ 7.06 C |
HypotheticalA | | $ 1,000.00 | $ 1,018.45 | $ 6.82 D |
Class T | 1.58% | | | |
Actual | | $ 1,000.00 | $ 1,087.90 | $ 8.31 C |
HypotheticalA | | $ 1,000.00 | $ 1,017.24 | $ 8.03 D |
Class B | 2.09% | | | |
Actual | | $ 1,000.00 | $ 1,085.00 | $ 10.98 C |
HypotheticalA | | $ 1,000.00 | $ 1,014.67 | $ 10.61 D |
Class C | 2.09% | | | |
Actual | | $ 1,000.00 | $ 1,085.30 | $ 10.99 C |
HypotheticalA | | $ 1,000.00 | $ 1,014.67 | $ 10.61 D |
International Discovery | .99% | | | |
Actual | | $ 1,000.00 | $ 1,091.00 | $ 5.22 C |
HypotheticalA | | $ 1,000.00 | $ 1,020.21 | $ 5.04 D |
Class K | .85% | | | |
Actual | | $ 1,000.00 | $ 1,092.00 | $ 4.48 C |
HypotheticalA | | $ 1,000.00 | $ 1,020.92 | $ 4.33 D |
Institutional Class | .99% | | | |
Actual | | $ 1,000.00 | $ 1,091.10 | $ 5.22 C |
HypotheticalA | | $ 1,000.00 | $ 1,020.21 | $ 5.04 D |
Class Z | .85% | | | |
Actual | | $ 1,000.00 | $ 1,068.50 | $ 1.93 C |
HypotheticalA | | $ 1,000.00 | $ 1,020.92 | $ 4.33 D |
A 5% return per year before expenses
B Annualized expense ratio reflects expenses net of applicable fee waivers.
Annual Report
Shareholder Expense Example - continued
C Actual expenses are equal to each Class' annualized expense ratio; multiplied by the average account value over the period, multiplied by 184/365 (to reflect the one-half year period) for Class A, Class T, Class B, Class C, International Discovery, Class K and Institutional Class and multiplied by 80/365 (to reflect the period August 13, 2013 to October 31, 2013) for Class Z.
D Hypothetical expenses are equal to each Class' annualized expense ratio, multiplied by the average account value over the period, multiplied by 184/365 (to reflect the one-half year period).
Annual Report
Investment Changes (Unaudited)
Geographic Diversification (% of fund's net assets) |
As of October 31, 2013 |
 | Japan 18.2% | |
 | United Kingdom 15.9% | |
 | France 10.9% | |
 | Germany 8.7% | |
 | Switzerland 6.4% | |
 | United States of America* 5.5% | |
 | Sweden 4.1% | |
 | Spain 3.6% | |
 | Netherlands 3.3% | |
 | Other 23.4% | |

Percentages are based on country or territory of incorporation and are adjusted for the effect of futures contracts, if applicable. |
* Includes Short-Term Investments and Net Other Assets (Liabilities) |
As of April 30, 2013 |
| Japan 20.5% | |
| United Kingdom 16.1% | |
| France 9.7% | |
 | Germany 7.5% | |
| Switzerland 6.3% | |
| United States of America* 5.2% | |
| Australia 3.9% | |
| Sweden 2.7% | |
| Netherlands 2.5% | |
| Other 25.6% | |

Percentages are based on country or territory of incorporation and are adjusted for the effect of futures contracts, if applicable. |
* Includes Short-Term Investments and Net Other Assets (Liabilities) |
Asset Allocation as of October 31, 2013 |
| % of fund's
net assets | % of fund's net assets
6 months ago |
Stocks and Equity Futures | 97.2 | 96.6 |
Short-Term Investments and Net Other Assets (Liabilities) | 2.8 | 3.4 |
Top Ten Stocks as of October 31, 2013 |
| % of fund's
net assets | % of fund's net assets
6 months ago |
Roche Holding AG (participation certificate) (Switzerland, Pharmaceuticals) | 2.0 | 1.0 |
Australia & New Zealand Banking Group Ltd. (Australia, Commercial Banks) | 1.8 | 1.6 |
Bayer AG (Germany, Pharmaceuticals) | 1.6 | 0.8 |
Toyota Motor Corp. (Japan, Automobiles) | 1.6 | 0.7 |
Total SA (France, Oil, Gas & Consumable Fuels) | 1.5 | 0.0 |
Volkswagen AG (Germany, Automobiles) | 1.5 | 0.7 |
UBS AG (Switzerland, Capital Markets) | 1.4 | 1.1 |
ORIX Corp. (Japan, Diversified Financial Services) | 1.4 | 1.1 |
SoftBank Corp. (Japan, Wireless Telecommunication Services) | 1.4 | 0.6 |
Banco Bilbao Vizcaya Argentaria SA (Spain, Commercial Banks) | 1.3 | 0.7 |
| 15.5 | |
Market Sectors as of October 31, 2013 |
| % of fund's
net assets | % of fund's net assets
6 months ago |
Financials | 24.8 | 24.3 |
Consumer Discretionary | 16.4 | 16.5 |
Industrials | 13.0 | 12.1 |
Consumer Staples | 10.1 | 11.3 |
Health Care | 9.5 | 8.9 |
Information Technology | 7.7 | 7.5 |
Materials | 5.2 | 5.7 |
Telecommunication Services | 5.1 | 4.1 |
Energy | 3.8 | 3.0 |
Utilities | 0.6 | 1.1 |
Annual Report
Investments October 31, 2013
Showing Percentage of Net Assets
Common Stocks - 94.7% |
| Shares | | Value (000s) |
Australia - 3.2% |
Ansell Ltd. | 2,268,950 | | $ 41,796 |
Australia & New Zealand Banking Group Ltd. | 6,493,040 | | 207,673 |
Ramsay Health Care Ltd. | 1,619,364 | | 59,385 |
Woodside Petroleum Ltd. | 1,461,485 | | 53,623 |
TOTAL AUSTRALIA | | 362,477 |
Austria - 0.2% |
Andritz AG | 455,300 | | 28,047 |
Bailiwick of Jersey - 2.6% |
Experian PLC | 6,115,400 | | 124,529 |
Wolseley PLC | 1,508,304 | | 81,283 |
WPP PLC | 3,996,700 | | 84,910 |
TOTAL BAILIWICK OF JERSEY | | 290,722 |
Belgium - 2.1% |
Anheuser-Busch InBev SA NV | 1,183,927 | | 122,730 |
KBC Groupe SA | 2,102,810 | | 114,632 |
TOTAL BELGIUM | | 237,362 |
Bermuda - 0.3% |
Cheung Kong Infrastructure Holdings Ltd. | 5,048,000 | | 35,127 |
Brazil - 0.1% |
Arezzo Industria e Comercio SA | 1,051,500 | | 15,724 |
British Virgin Islands - 0.4% |
Mail.Ru Group Ltd. GDR (Reg. S) | 1,193,800 | | 44,027 |
Canada - 1.0% |
Constellation Software, Inc. | 159,200 | | 29,002 |
InterOil Corp. (a)(d) | 204,400 | | 14,196 |
Suncor Energy, Inc. | 2,012,600 | | 73,138 |
TOTAL CANADA | | 116,336 |
Cayman Islands - 1.2% |
Baidu.com, Inc. sponsored ADR (a) | 123,100 | | 19,807 |
Cimc Enric Holdings Ltd. | 16,316,000 | | 22,981 |
ENN Energy Holdings Ltd. | 5,084,000 | | 30,132 |
Eurasia Drilling Co. Ltd. GDR (Reg. S) | 630,200 | | 26,689 |
Greatview Aseptic Pack Co. Ltd. | 26,392,000 | | 16,612 |
Sands China Ltd. | 1,460,800 | | 10,382 |
Youku Tudou, Inc. ADR (a)(d) | 300,200 | | 8,177 |
TOTAL CAYMAN ISLANDS | | 134,780 |
Common Stocks - continued |
| Shares | | Value (000s) |
Cyprus - 0.0% |
SPDI Secure Property Development & Investment PLC (a) | 529,830 | | $ 597 |
Denmark - 0.6% |
Novo Nordisk A/S Series B | 396,489 | | 66,036 |
Finland - 0.7% |
Sampo Oyj (A Shares) | 1,739,800 | | 82,418 |
France - 10.9% |
Arkema SA | 487,670 | | 55,368 |
Atos Origin SA | 388,851 | | 33,198 |
AXA SA | 5,364,600 | | 134,022 |
BNP Paribas SA | 1,544,345 | | 114,361 |
Bureau Veritas SA | 1,413,000 | | 42,667 |
Danone SA | 905,500 | | 67,152 |
Edenred SA | 1,177,900 | | 40,022 |
Havas SA | 5,201,268 | | 43,333 |
Iliad SA | 213,972 | | 48,924 |
Kering SA | 373,000 | | 84,753 |
Lafarge SA (Bearer) (d) | 605,900 | | 41,939 |
LVMH Moet Hennessy - Louis Vuitton SA | 612,502 | | 117,924 |
Sanofi SA | 890,979 | | 94,999 |
Schneider Electric SA | 1,383,800 | | 116,583 |
Technip SA | 192,300 | | 20,144 |
Total SA | 2,831,600 | | 173,727 |
TOTAL FRANCE | | 1,229,116 |
Germany - 7.2% |
Aareal Bank AG (a) | 1,044,895 | | 40,185 |
adidas AG | 541,900 | | 61,863 |
BASF AG | 1,265,455 | | 131,663 |
Bayer AG | 1,471,500 | | 182,890 |
Brenntag AG | 444,700 | | 75,353 |
GEA Group AG | 1,254,770 | | 54,602 |
GSW Immobilien AG | 430,481 | | 20,019 |
HeidelbergCement Finance AG | 860,300 | | 67,818 |
KION Group AG (a) | 577,867 | | 23,538 |
LEG Immobilien AG | 184,948 | | 10,547 |
Siemens AG | 1,110,885 | | 141,963 |
TOTAL GERMANY | | 810,441 |
Common Stocks - continued |
| Shares | | Value (000s) |
Hong Kong - 1.8% |
AIA Group Ltd. | 20,789,200 | | $ 105,515 |
Techtronic Industries Co. Ltd. | 39,683,000 | | 99,809 |
TOTAL HONG KONG | | 205,324 |
India - 0.6% |
Housing Development Finance Corp. Ltd. | 3,139,461 | | 43,561 |
United Spirits Ltd. | 444,545 | | 18,569 |
TOTAL INDIA | | 62,130 |
Indonesia - 0.1% |
PT Tower Bersama Infrastructure Tbk | 17,734,500 | | 8,967 |
Ireland - 2.0% |
Actavis PLC (a) | 308,100 | | 47,626 |
Bank of Ireland (a) | 146,718,100 | | 53,399 |
James Hardie Industries PLC CDI | 6,070,470 | | 62,711 |
Kerry Group PLC Class A | 945,600 | | 60,555 |
TOTAL IRELAND | | 224,291 |
Italy - 1.0% |
De Longhi SpA | 2,248,100 | | 34,797 |
Moleskine SpA | 4,183,000 | | 10,223 |
Tod's SpA | 117,793 | | 19,624 |
UniCredit SpA | 3,689,800 | | 27,754 |
World Duty Free SpA (a) | 2,253,904 | | 24,972 |
TOTAL ITALY | | 117,370 |
Japan - 17.2% |
ABC-MART, Inc. | 826,300 | | 41,324 |
Aozora Bank Ltd. | 16,056,000 | | 46,675 |
ARNEST ONE Corp. (d) | 306,200 | | 8,395 |
Astellas Pharma, Inc. | 768,700 | | 42,852 |
Cosmos Pharmaceutical Corp. | 245,800 | | 29,946 |
Daikin Industries Ltd. | 1,089,400 | | 62,677 |
Don Quijote Co. Ltd. | 1,818,400 | | 121,044 |
Hajime Construction Co. Ltd. | 34,900 | | 2,406 |
Hitachi Ltd. | 5,121,000 | | 35,822 |
Japan Exchange Group, Inc. | 2,589,500 | | 60,201 |
Japan Tobacco, Inc. | 3,948,700 | | 142,879 |
Kakaku.com, Inc. | 1,903,000 | | 36,807 |
KDDI Corp. | 2,082,700 | | 112,792 |
Keyence Corp. | 304,060 | | 130,317 |
Leopalace21 Corp. (a) | 6,899,700 | | 47,901 |
Common Stocks - continued |
| Shares | | Value (000s) |
Japan - continued |
Miraca Holdings, Inc. | 196,700 | | $ 8,863 |
Mitsubishi UFJ Financial Group, Inc. | 18,169,200 | | 115,706 |
Nomura Real Estate Holdings, Inc. | 563,300 | | 14,252 |
Omron Corp. | 1,225,300 | | 46,759 |
ORIX Corp. | 9,072,900 | | 157,152 |
Park24 Co. Ltd. | 1,342,800 | | 26,218 |
Rakuten, Inc. | 5,237,700 | | 68,245 |
Santen Pharmaceutical Co. Ltd. | 1,166,900 | | 59,239 |
Seven & i Holdings Co., Ltd. | 2,167,000 | | 80,198 |
Shinsei Bank Ltd. | 24,904,000 | | 58,308 |
Ship Healthcare Holdings, Inc. | 1,076,700 | | 44,182 |
SoftBank Corp. | 2,099,300 | | 156,773 |
Toyota Motor Corp. | 2,789,300 | | 180,853 |
USS Co. Ltd. | 450,400 | | 6,596 |
TOTAL JAPAN | | 1,945,382 |
Korea (South) - 0.9% |
Hyundai Motor Co. | 206,848 | | 49,311 |
NHN Corp. | 69,296 | | 38,981 |
Orion Corp. | 14,973 | | 14,602 |
TOTAL KOREA (SOUTH) | | 102,894 |
Luxembourg - 0.3% |
Brait SA | 6,048,833 | | 29,465 |
Mexico - 0.2% |
Alsea S.A.B. de CV | 7,662,195 | | 23,831 |
Netherlands - 3.3% |
AEGON NV | 5,028,800 | | 40,014 |
ASML Holding NV | 772,233 | | 73,084 |
European Aeronautic Defence and Space Co. (EADS) NV | 176,700 | | 12,142 |
Koninklijke Ahold NV | 2,412,842 | | 45,930 |
Koninklijke Philips Electronics NV | 2,496,700 | | 88,235 |
Randstad Holding NV | 717,740 | | 44,296 |
Royal DSM NV | 536,200 | | 40,617 |
Yandex NV (a) | 861,400 | | 31,751 |
TOTAL NETHERLANDS | | 376,069 |
New Zealand - 0.4% |
Ryman Healthcare Group Ltd. | 7,311,565 | | 45,597 |
Norway - 1.0% |
DNB ASA | 6,068,755 | | 107,551 |
Common Stocks - continued |
| Shares | | Value (000s) |
Philippines - 0.1% |
Alliance Global Group, Inc. | 26,741,800 | | $ 16,306 |
Russia - 0.5% |
Mobile TeleSystems OJSC sponsored ADR | 2,313,400 | | 52,746 |
Singapore - 0.4% |
Global Logistic Properties Ltd. | 16,214,205 | | 40,333 |
South Africa - 1.1% |
Naspers Ltd. Class N | 1,302,700 | | 121,851 |
Spain - 3.6% |
Amadeus IT Holding SA Class A | 1,319,900 | | 49,014 |
Antena 3 de Television SA | 1,515,400 | | 25,411 |
Banco Bilbao Vizcaya Argentaria SA | 12,546,524 | | 146,630 |
Criteria CaixaCorp SA | 4,210,900 | | 21,892 |
Distribuidora Internacional de Alimentacion SA | 5,726,396 | | 52,349 |
Grifols SA ADR | 1,208,550 | | 36,450 |
Inditex SA (d) | 481,679 | | 79,134 |
TOTAL SPAIN | | 410,880 |
Sweden - 4.1% |
ASSA ABLOY AB (B Shares) | 1,783,400 | | 88,536 |
Intrum Justitia AB | 1,835,800 | | 48,869 |
Investment AB Kinnevik (B Shares) | 2,363,300 | | 87,091 |
Nordea Bank AB | 6,100,600 | | 78,140 |
Svenska Cellulosa AB (SCA) (B Shares) | 3,591,900 | | 101,991 |
Svenska Handelsbanken AB (A Shares) | 1,258,200 | | 57,007 |
TOTAL SWEDEN | | 461,634 |
Switzerland - 6.4% |
Credit Suisse Group | 1,039,246 | | 32,329 |
Lonza Group AG | 476,868 | | 42,623 |
Partners Group Holding AG | 230,056 | | 59,609 |
Roche Holding AG (participation certificate) | 821,773 | | 227,506 |
Schindler Holding AG (participation certificate) | 260,065 | | 36,888 |
SGS SA (Reg.) | 7,770 | | 18,206 |
Swatch Group AG (Bearer) | 36,702 | | 23,481 |
Syngenta AG (Switzerland) | 179,374 | | 72,398 |
UBS AG | 8,311,378 | | 160,751 |
Zurich Insurance Group AG | 180,481 | | 49,907 |
TOTAL SWITZERLAND | | 723,698 |
Common Stocks - continued |
| Shares | | Value (000s) |
Taiwan - 0.6% |
ECLAT Textile Co. Ltd. | 2,457,180 | | $ 27,005 |
Taiwan Semiconductor Manufacturing Co. Ltd. | 11,289,000 | | 41,528 |
TOTAL TAIWAN | | 68,533 |
United Kingdom - 15.9% |
Aberdeen Asset Management PLC | 5,975,132 | | 42,432 |
Alabama Noor Hospitals Group PLC (a) | 1,829,400 | | 24,933 |
Associated British Foods PLC | 1,571,500 | | 57,123 |
Barclays PLC | 22,636,113 | | 95,241 |
BG Group PLC | 3,923,700 | | 80,119 |
BHP Billiton PLC | 2,080,582 | | 64,204 |
British American Tobacco PLC (United Kingdom) | 881,200 | | 48,618 |
Croda International PLC | 630,000 | | 24,607 |
Diageo PLC | 4,394,219 | | 140,077 |
Foxtons Group PLC | 2,178,500 | | 11,134 |
Hikma Pharmaceuticals PLC | 3,197,720 | | 61,578 |
HSBC Holdings PLC (United Kingdom) | 12,266,193 | | 134,454 |
Intertek Group PLC | 893,600 | | 47,741 |
ITV PLC | 11,642,037 | | 35,635 |
Jazztel PLC (a) | 4,681,964 | | 51,364 |
Legal & General Group PLC | 26,720,558 | | 92,671 |
Liberty Global PLC Class A (a) | 610,800 | | 47,868 |
London Stock Exchange Group PLC | 1,729,000 | | 45,521 |
Meggitt PLC | 6,842,366 | | 62,809 |
Next PLC | 781,744 | | 68,250 |
Ocado Group PLC (a) | 8,103,297 | | 56,389 |
Persimmon PLC | 2,082,200 | | 42,233 |
Reckitt Benckiser Group PLC | 788,600 | | 61,300 |
Rolls-Royce Group PLC | 4,197,715 | | 77,402 |
Rotork PLC | 717,800 | | 32,951 |
Royal Mail PLC | 788,800 | | 7,083 |
SABMiller PLC | 1,478,600 | | 77,145 |
Taylor Wimpey PLC | 18,277,100 | | 32,295 |
The Restaurant Group PLC | 1,992,100 | | 18,398 |
Ultra Electronics Holdings PLC | 614,667 | | 19,061 |
Vodafone Group PLC | 36,632,743 | | 134,177 |
TOTAL UNITED KINGDOM | | 1,794,813 |
United States of America - 2.7% |
Beam, Inc. | 387,400 | | 26,072 |
Google, Inc. Class A (a) | 60,100 | | 61,938 |
Illumina, Inc. (a) | 12,500 | | 1,169 |
Common Stocks - continued |
| Shares | | Value (000s) |
United States of America - continued |
MasterCard, Inc. Class A | 160,100 | | $ 114,808 |
McGraw-Hill Companies, Inc. | 488,400 | | 34,032 |
Sohu.com, Inc. (a) | 313,700 | | 21,005 |
Visa, Inc. Class A | 260,000 | | 51,134 |
TOTAL UNITED STATES OF AMERICA | | 310,158 |
TOTAL COMMON STOCKS (Cost $8,462,801) |
10,703,033
|
Nonconvertible Preferred Stocks - 1.5% |
| | | |
Germany - 1.5% |
Volkswagen AG | 650,200 | | 165,262 |
United Kingdom - 0.0% |
Rolls-Royce Group PLC Series C | 361,003,490 | | 579 |
TOTAL NONCONVERTIBLE PREFERRED STOCKS (Cost $133,620) |
165,841
|
Government Obligations - 0.1% |
| Principal Amount (000s) | | |
United States of America - 0.1% |
U.S. Treasury Bills, yield at date of purchase 0.02% to 0.04% 1/2/14 (e)
(Cost $6,960) | | $ 6,960 | |
6,960
|
Money Market Funds - 4.0% |
| Shares | | |
Fidelity Cash Central Fund, 0.09% (b) | 431,996,301 | | 431,996 |
Fidelity Securities Lending Cash Central Fund, 0.09% (b)(c) | 22,072,034 | | 22,072 |
TOTAL MONEY MARKET FUNDS (Cost $454,068) |
454,068
|
TOTAL INVESTMENT PORTFOLIO - 100.3% (Cost $9,057,449) | | 11,329,902 |
NET OTHER ASSETS (LIABILITIES) - (0.3)% | | (35,016) |
NET ASSETS - 100% | $ 11,294,886 |
Futures Contracts |
| Expiration Date | | Underlying Face Amount at Value (000s) | | Unrealized Appreciation/
(Depreciation) (000s) |
Purchased |
Equity Index Contracts |
1,572 Nikkei 225 Index Contracts (Japan) | Dec. 2013 | | $ 113,695 | | $ 4,238 |
|
The face value of futures purchased as a percentage of net assets is 1% |
Legend |
(a) Non-income producing |
(b) Affiliated fund that is generally available only to investment companies and other accounts managed by Fidelity Investments. The rate quoted is the annualized seven-day yield of the fund at period end. A complete unaudited listing of the fund's holdings as of its most recent quarter end is available upon request. In addition, each Fidelity Central Fund's financial statements, which are not covered by the Fund's Report of Independent Registered Public Accounting Firm, are available on the SEC's website or upon request. |
(c) Investment made with cash collateral received from securities on loan. |
(d) Security or a portion of the security is on loan at period end. |
(e) Security or a portion of the security was pledged to cover margin requirements for futures contracts. At period end, the value of securities pledged amounted to $6,960,000. |
Affiliated Central Funds |
Information regarding fiscal year to date income earned by the Fund from investments in Fidelity Central Funds is as follows: |
Fund | Income earned
(Amounts in thousands) |
Fidelity Cash Central Fund | $ 420 |
Fidelity Securities Lending Cash Central Fund | 5,441 |
Total | $ 5,861 |
Other Affiliated Issuers |
An affiliated company is a company in which the Fund has ownership of at least 5% of the voting securities. Fiscal year to date transactions with companies which are or were affiliates are as follows: |
Affiliate
(Amounts in thousands) | Value, beginning of period | Purchases | Sales Proceeds | Dividend Income | Value,
end of
period |
Boyner Buyuk Magazacilik A/S | $ 10,764 | $ - | $ 16,020 | $ - | $ - |
Other Information |
Categorizations in the Schedule of Investments are based on country or territory of incorporation. |
The following is a summary of the inputs used, as of October 31, 2013, involving the Fund's assets and liabilities carried at fair value. The inputs or methodology used for valuing securities may not be an indication of the risk associated with investing in those securities. For more information on valuation inputs, and their aggregation into the levels used in the table below, please refer to the Investment Valuation section in the accompanying Notes to Financial Statements. |
Valuation Inputs at Reporting Date: |
Description
(Amounts in thousands) | Total | Level 1 | Level 2 | Level 3 |
Investments in Securities: | | | | |
Equities: | | | | |
Consumer Discretionary | $ 1,843,308 | $ 1,414,445 | $ 418,062 | $ 10,801 |
Consumer Staples | 1,147,236 | 582,788 | 564,448 | - |
Energy | 441,636 | 267,909 | 173,727 | - |
Financials | 2,821,082 | 1,658,069 | 1,163,013 | - |
Health Care | 1,087,724 | 771,553 | 316,171 | - |
Industrials | 1,451,790 | 1,132,697 | 319,093 | - |
Information Technology | 867,159 | 575,926 | 291,233 | - |
Materials | 577,937 | 441,335 | 136,602 | - |
Telecommunication Services | 565,743 | 162,001 | 403,742 | - |
Utilities | 65,259 | 65,259 | - | - |
Government Obligations | 6,960 | - | 6,960 | - |
Money Market Funds | 454,068 | 454,068 | - | - |
Total Investments in Securities: | $ 11,329,902 | $ 7,526,050 | $ 3,793,051 | $ 10,801 |
Derivative Instruments: | | | | |
Assets | | | | |
Futures Contracts | $ 4,238 | $ 4,238 | $ - | $ - |
The following is a summary of transfers between Level 1 and Level 2 for the period ended October 31, 2013. Transfers are assumed to have occurred at the beginning of the period, and are primarily attributable to the valuation techniques used for foreign equity securities, as discussed in the accompanying Notes to Financial Statements: |
Transfers | Total (000s) |
Level 1 to Level 2 | $ 712,449 |
Level 2 to Level 1 | $ 0 |
Value of Derivative Instruments |
The following table is a summary of the Fund's value of derivative instruments by primary risk exposure as of October 31, 2013. For additional information on derivative instruments, please refer to the Derivative Instruments section in the accompanying Notes to Financial Statements. |
Primary Risk Exposure /
Derivative Type | Value |
| Asset | Liability |
Equity Risk | | |
Futures Contracts (a) | $ 4,238 | $ - |
(a) Reflects gross cumulative appreciation (depreciation) on futures contracts as presented in the Schedule of Investments. Only the period end receivable or payable for daily variation margin and net unrealized appreciation (depreciation) are presented in the Statement of Assets and Liabilities. |
See accompanying notes which are an integral part of the financial statements.
Annual Report
Statement of Assets and Liabilities
Amounts in thousands (except per-share amounts) | October 31, 2013 |
| | |
Assets | | |
Investment in securities, at value (including securities loaned of $21,646) - See accompanying schedule: Unaffiliated issuers (cost $8,603,381) | $ 10,875,834 | |
Fidelity Central Funds (cost $454,068) | 454,068 | |
Total Investments (cost $9,057,449) | | $ 11,329,902 |
Foreign currency held at value (cost $934) | | 924 |
Receivable for investments sold | | 8,555 |
Receivable for fund shares sold | | 7,336 |
Dividends receivable | | 20,216 |
Distributions receivable from Fidelity Central Funds | | 122 |
Prepaid expenses | | 35 |
Other receivables | | 4,081 |
Total assets | | 11,371,171 |
| | |
Liabilities | | |
Payable for investments purchased | $ 38,436 | |
Payable for fund shares redeemed | 5,719 | |
Accrued management fee | 6,631 | |
Distribution and service plan fees payable | 128 | |
Payable for daily variation margin for derivative instruments | 983 | |
Other affiliated payables | 1,581 | |
Other payables and accrued expenses | 735 | |
Collateral on securities loaned, at value | 22,072 | |
Total liabilities | | 76,285 |
| | |
Net Assets | | $ 11,294,886 |
Net Assets consist of: | | |
Paid in capital | | $ 9,866,929 |
Undistributed net investment income | | 131,430 |
Accumulated undistributed net realized gain (loss) on investments and foreign currency transactions | | (979,010) |
Net unrealized appreciation (depreciation) on investments and assets and liabilities in foreign currencies | | 2,275,537 |
Net Assets | | $ 11,294,886 |
See accompanying notes which are an integral part of the financial statements.
Annual Report
Statement of Assets and Liabilities - continued
Amounts in thousands (except per-share amounts) | October 31, 2013 |
| | |
Calculation of Maximum Offering Price Class A:
Net Asset Value and redemption price per share ($346,717.68 ÷ 8,780.120 shares) | | $ 39.49 |
| | |
Maximum offering price per share (100/94.25 of $39.49) | | $ 41.90 |
Class T:
Net Asset Value and redemption price per share ($53,183.51 ÷ 1,355.789 shares) | | $ 39.23 |
| | |
Maximum offering price per share (100/96.50 of $39.23) | | $ 40.65 |
Class B:
Net Asset Value and offering price per share ($6,686.96 ÷ 171.088 shares)A | | $ 39.08 |
| | |
Class C:
Net Asset Value and offering price per share ($36,470.54 ÷ 933.457 shares)A | | $ 39.07 |
| | |
International Discovery:
Net Asset Value, offering price and redemption price per share ($7,799,575.78 ÷ 195,853.386 shares) | | $ 39.82 |
| | |
Class K:
Net Asset Value, offering price and redemption price per share ($2,576,018.46 ÷ 64,786.777 shares) | | $ 39.76 |
| | |
Institutional Class:
Net Asset Value, offering price and redemption price per share ($476,126.48 ÷ 11,975.218 shares) | | $ 39.76 |
| | |
Class Z:
Net Asset Value, offering price and redemption price per share ($106.86 ÷ 2.687 shares) | | $ 39.77 |
A Redemption price per share is equal to net asset value less any applicable contingent deferred sales charge.
See accompanying notes which are an integral part of the financial statements.
Annual Report
Financial Statements - continued
Statement of Operations
Amounts in thousands | Year ended October 31, 2013 |
| | |
Investment Income | | |
Dividends | | $ 233,738 |
Interest | | 3 |
Income from Fidelity Central Funds | | 5,861 |
Income before foreign taxes withheld | | 239,602 |
Less foreign taxes withheld | | (17,198) |
Total income | | 222,404 |
| | |
Expenses | | |
Management fee
Basic fee | $ 67,899 | |
Performance adjustment | 6,089 | |
Transfer agent fees | 16,474 | |
Distribution and service plan fees | 1,432 | |
Accounting and security lending fees | 1,778 | |
Custodian fees and expenses | 1,352 | |
Independent trustees' compensation | 54 | |
Registration fees | 215 | |
Audit | 119 | |
Legal | 24 | |
Miscellaneous | 76 | |
Total expenses before reductions | 95,512 | |
Expense reductions | (2,311) | 93,201 |
Net investment income (loss) | | 129,203 |
Realized and Unrealized Gain (Loss) Net realized gain (loss) on: | | |
Investment securities: | | |
Unaffiliated issuers | 671,713 | |
Other affiliated issuers | 4,258 | |
Foreign currency transactions | (1,963) | |
Futures contracts | 51,368 | |
Total net realized gain (loss) | | 725,376 |
Change in net unrealized appreciation (depreciation) on: Investment securities | 1,459,188 | |
Assets and liabilities in foreign currencies | (54) | |
Futures contracts | 4,238 | |
Total change in net unrealized appreciation (depreciation) | | 1,463,372 |
Net gain (loss) | | 2,188,748 |
Net increase (decrease) in net assets resulting from operations | | $ 2,317,951 |
See accompanying notes which are an integral part of the financial statements.
Annual Report
Statement of Changes in Net Assets
Amounts in thousands | Year ended
October 31,
2013 | Year ended
October 31,
2012 |
Increase (Decrease) in Net Assets | | |
Operations | | |
Net investment income (loss) | $ 129,203 | $ 143,212 |
Net realized gain (loss) | 725,376 | (207,579) |
Change in net unrealized appreciation (depreciation) | 1,463,372 | 762,141 |
Net increase (decrease) in net assets resulting
from operations | 2,317,951 | 697,774 |
Distributions to shareholders from net investment income | (146,031) | (118,968) |
Distributions to shareholders from net realized gain | (8,413) | - |
Total distributions | (154,444) | (118,968) |
Share transactions - net increase (decrease) | 714,712 | (915,362) |
Redemption fees | 128 | 128 |
Total increase (decrease) in net assets | 2,878,347 | (336,428) |
| | |
Net Assets | | |
Beginning of period | 8,416,539 | 8,752,967 |
End of period (including undistributed net investment income of $131,430 and undistributed net investment income of $126,507, respectively) | $ 11,294,886 | $ 8,416,539 |
See accompanying notes which are an integral part of the financial statements.
Annual Report
Financial Highlights - Class A
Years ended October 31, | 2013 | 2012 | 2011 | 2010 | 2009 |
Selected Per-Share Data | | | | | |
Net asset value, beginning of period | $ 31.66 | $ 29.43 | $ 32.07 | $ 28.57 | $ 23.68 |
Income from Investment Operations | | | | | |
Net investment income (loss) C | .34 | .41 | .42 | .31 | .31 |
Net realized and unrealized gain (loss) | 7.97 | 2.11 | (2.52) | 3.51 | 4.84 |
Total from investment operations | 8.31 | 2.52 | (2.10) | 3.82 | 5.15 |
Distributions from net investment income | (.45) | (.29) | (.38) | (.28) | (.26) |
Distributions from net realized gain | (.03) | - | (.16) | (.04) | - |
Total distributions | (.48) | (.29) | (.54) | (.32) | (.26) |
Redemption fees added to paid in capital C,G | - | - | - | - | - |
Net asset value, end of period | $ 39.49 | $ 31.66 | $ 29.43 | $ 32.07 | $ 28.57 |
Total Return A,B | 26.59% | 8.70% | (6.71)% | 13.43% | 22.14% |
Ratios to Average Net Assets D,F | | | | |
Expenses before reductions | 1.35% | 1.34% | 1.30% | 1.33% | 1.37% |
Expenses net of fee waivers, if any | 1.35% | 1.34% | 1.29% | 1.33% | 1.37% |
Expenses net of all reductions | 1.33% | 1.31% | 1.25% | 1.28% | 1.32% |
Net investment income (loss) | .97% | 1.41% | 1.31% | 1.06% | 1.28% |
Supplemental Data | | | | | |
Net assets, end of period (in millions) | $ 347 | $ 299 | $ 320 | $ 392 | $ 414 |
Portfolio turnover rate E | 65% | 68% | 75% | 82% | 98% |
A Total returns would have been lower if certain expenses had not been reduced during the applicable periods shown.
B Total returns do not include the effect of the sales charges.
C Calculated based on average shares outstanding during the period.
D Fees and expenses of any underlying Fidelity Central Funds are not included in the Fund's expense ratio. The Fund indirectly bears its proportionate share of the expenses of any underlying Fidelity Central Funds.
E Amount does not include the portfolio activity of any underlying Fidelity Central Funds.
F Expense ratios reflect operating expenses of the class. Expenses before reductions do not reflect amounts reimbursed by the investment adviser or reductions from brokerage service arrangements or reductions from other expense offset arrangements and do not represent the amount paid by the class during periods when reimbursements or reductions occur. Expenses net of fee waivers reflect expenses after reimbursement by the investment adviser but prior to reductions from brokerage service arrangements or other expense offset arrangements. Expenses net of all reductions represent the net expenses paid by the class.
G Amount represents less than $.01 per share.
See accompanying notes which are an integral part of the financial statements.
Annual Report
Financial Highlights - Class T
Years ended October 31, | 2013 | 2012 | 2011 | 2010 | 2009 |
Selected Per-Share Data | | | | | |
Net asset value, beginning of period | $ 31.42 | $ 29.18 | $ 31.81 | $ 28.35 | $ 23.49 |
Income from Investment Operations | | | | | |
Net investment income (loss) C | .26 | .34 | .34 | .23 | .24 |
Net realized and unrealized gain (loss) | 7.92 | 2.09 | (2.51) | 3.48 | 4.81 |
Total from investment operations | 8.18 | 2.43 | (2.17) | 3.71 | 5.05 |
Distributions from net investment income | (.34) | (.19) | (.30) | (.21) | (.19) |
Distributions from net realized gain | (.03) | - | (.16) | (.04) | - |
Total distributions | (.37) | (.19) | (.46) | (.25) | (.19) |
Redemption fees added to paid in capital C,G | - | - | - | - | - |
Net asset value, end of period | $ 39.23 | $ 31.42 | $ 29.18 | $ 31.81 | $ 28.35 |
Total Return A,B | 26.31% | 8.41% | (6.96)% | 13.14% | 21.79% |
Ratios to Average Net Assets D,F | | | | |
Expenses before reductions | 1.59% | 1.59% | 1.56% | 1.60% | 1.65% |
Expenses net of fee waivers, if any | 1.59% | 1.59% | 1.55% | 1.60% | 1.65% |
Expenses net of all reductions | 1.57% | 1.56% | 1.51% | 1.56% | 1.60% |
Net investment income (loss) | .73% | 1.16% | 1.05% | .79% | 1.00% |
Supplemental Data | | | | | |
Net assets, end of period (in millions) | $ 53 | $ 46 | $ 61 | $ 92 | $ 83 |
Portfolio turnover rate E | 65% | 68% | 75% | 82% | 98% |
A Total returns would have been lower if certain expenses had not been reduced during the applicable periods shown.
B Total returns do not include the effect of the sales charges.
C Calculated based on average shares outstanding during the period.
D Fees and expenses of any underlying Fidelity Central Funds are not included in the Fund's expense ratio. The Fund indirectly bears its proportionate share of the expenses of any underlying Fidelity Central Funds.
E Amount does not include the portfolio activity of any underlying Fidelity Central Funds.
F Expense ratios reflect operating expenses of the class. Expenses before reductions do not reflect amounts reimbursed by the investment adviser or reductions from brokerage service arrangements or reductions from other expense offset arrangements and do not represent the amount paid by the class during periods when reimbursements or reductions occur. Expenses net of fee waivers reflect expenses after reimbursement by the investment adviser but prior to reductions from brokerage service arrangements or other expense offset arrangements. Expenses net of all reductions represent the net expenses paid by the class.
G Amount represents less than $.01 per share.
See accompanying notes which are an integral part of the financial statements.
Annual Report
Financial Highlights - Class B
Years ended October 31, | 2013 | 2012 | 2011 | 2010 | 2009 |
Selected Per-Share Data | | | | | |
Net asset value, beginning of period | $ 31.28 | $ 29.02 | $ 31.60 | $ 28.18 | $ 23.25 |
Income from Investment Operations | | | | | |
Net investment income (loss) C | .08 | .19 | .17 | .08 | .12 |
Net realized and unrealized gain (loss) | 7.90 | 2.09 | (2.48) | 3.44 | 4.81 |
Total from investment operations | 7.98 | 2.28 | (2.31) | 3.52 | 4.93 |
Distributions from net investment income | (.15) | (.02) | (.12) | (.06) | - |
Distributions from net realized gain | (.03) | - | (.16) | (.04) | - |
Total distributions | (.18) | (.02) | (.27) H | (.10) | - |
Redemption fees added to paid in capital C,G | - | - | - | - | - |
Net asset value, end of period | $ 39.08 | $ 31.28 | $ 29.02 | $ 31.60 | $ 28.18 |
Total Return A,B | 25.64% | 7.85% | (7.39)% | 12.52% | 21.20% |
Ratios to Average Net Assets D,F | | | | |
Expenses before reductions | 2.10% | 2.09% | 2.06% | 2.12% | 2.16% |
Expenses net of fee waivers, if any | 2.10% | 2.09% | 2.06% | 2.12% | 2.16% |
Expenses net of all reductions | 2.08% | 2.06% | 2.02% | 2.08% | 2.11% |
Net investment income (loss) | .22% | .66% | .54% | .27% | .49% |
Supplemental Data | | | | | |
Net assets, end of period (in millions) | $ 7 | $ 8 | $ 10 | $ 14 | $ 16 |
Portfolio turnover rate E | 65% | 68% | 75% | 82% | 98% |
A Total returns would have been lower if certain expenses had not been reduced during the applicable periods shown.
B Total returns do not include the effect of the contingent deferred sales charge.
C Calculated based on average shares outstanding during the period.
D Fees and expenses of any underlying Fidelity Central Funds are not included in the Fund's expense ratio. The Fund indirectly bears its proportionate share of the expenses of any underlying Fidelity Central Funds.
E Amount does not include the portfolio activity of any underlying Fidelity Central Funds.
F Expense ratios reflect operating expenses of the class. Expenses before reductions do not reflect amounts reimbursed by the investment adviser or reductions from brokerage service arrangements or reductions from other expense offset arrangements and do not represent the amount paid by the class during periods when reimbursements or reductions occur. Expenses net of fee waivers reflect expenses after reimbursement by the investment adviser but prior to reductions from brokerage service arrangements or other expense offset arrangements. Expenses net of all reductions represent the net expenses paid by the class.
G Amount represents less than $.01 per share.
H Total distributions of $.27 per share is comprised of distributions from net investment income of $.115 and distributions from net realized gain of $.155 per share.
See accompanying notes which are an integral part of the financial statements.
Annual Report
Financial Highlights - Class C
Years ended October 31, | 2013 | 2012 | 2011 | 2010 | 2009 |
Selected Per-Share Data | | | | | |
Net asset value, beginning of period | $ 31.32 | $ 29.08 | $ 31.68 | $ 28.23 | $ 23.31 |
Income from Investment Operations | | | | | |
Net investment income (loss) C | .08 | .19 | .18 | .09 | .12 |
Net realized and unrealized gain (loss) | 7.90 | 2.09 | (2.49) | 3.45 | 4.82 |
Total from investment operations | 7.98 | 2.28 | (2.31) | 3.54 | 4.94 |
Distributions from net investment income | (.20) | (.04) | (.14) | (.05) | (.02) |
Distributions from net realized gain | (.03) | - | (.16) | (.04) | - |
Total distributions | (.23) | (.04) | (.29) H | (.09) | (.02) |
Redemption fees added to paid in capital C,G | - | - | - | - | - |
Net asset value, end of period | $ 39.07 | $ 31.32 | $ 29.08 | $ 31.68 | $ 28.23 |
Total Return A,B | 25.65% | 7.86% | (7.37)% | 12.54% | 21.22% |
Ratios to Average Net Assets D,F | | | | |
Expenses before reductions | 2.10% | 2.09% | 2.05% | 2.09% | 2.14% |
Expenses net of fee waivers, if any | 2.09% | 2.09% | 2.04% | 2.09% | 2.14% |
Expenses net of all reductions | 2.07% | 2.06% | 2.00% | 2.05% | 2.09% |
Net investment income (loss) | .23% | .66% | .56% | .30% | .51% |
Supplemental Data | | | | | |
Net assets, end of period (in millions) | $ 36 | $ 30 | $ 33 | $ 44 | $ 43 |
Portfolio turnover rate E | 65% | 68% | 75% | 82% | 98% |
A Total returns would have been lower if certain expenses had not been reduced during the applicable periods shown.
B Total returns do not include the effect of the contingent deferred sales charge.
C Calculated based on average shares outstanding during the period.
D Fees and expenses of any underlying Fidelity Central Funds are not included in the Fund's expense ratio. The Fund indirectly bears its proportionate share of the expenses of any underlying Fidelity Central Funds.
E Amount does not include the portfolio activity of any underlying Fidelity Central Funds.
F Expense ratios reflect operating expenses of the class. Expenses before reductions do not reflect amounts reimbursed by the investment adviser or reductions from brokerage service arrangements or reductions from other expense offset arrangements and do not represent the amount paid by the class during periods when reimbursements or reductions occur. Expenses net of fee waivers reflect expenses after reimbursement by the investment adviser but prior to reductions from brokerage service arrangements or other expense offset arrangements. Expenses net of all reductions represent the net expenses paid by the class.
G Amount represents less than $.01 per share.
H Total distributions of $.29 per share is comprised of distributions from net investment income of $.137 and distributions from net realized gain of $.155 per share.
See accompanying notes which are an integral part of the financial statements.
Annual Report
Financial Highlights - International Discovery
Years ended October 31, | 2013 | 2012 | 2011 | 2010 | 2009 |
Selected Per-Share Data | | | | | |
Net asset value, beginning of period | $ 31.91 | $ 29.69 | $ 32.34 | $ 28.79 | $ 23.88 |
Income from Investment Operations | | | | | |
Net investment income (loss) B | .47 | .51 | .53 | .40 | .37 |
Net realized and unrealized gain (loss) | 8.02 | 2.12 | (2.54) | 3.54 | 4.88 |
Total from investment operations | 8.49 | 2.63 | (2.01) | 3.94 | 5.25 |
Distributions from net investment income | (.55) | (.41) | (.48) | (.35) | (.34) |
Distributions from net realized gain | (.03) | - | (.16) | (.04) | - |
Total distributions | (.58) | (.41) | (.64) | (.39) | (.34) |
Redemption fees added to paid in capital B,F | - | - | - | - | - |
Net asset value, end of period | $ 39.82 | $ 31.91 | $ 29.69 | $ 32.34 | $ 28.79 |
Total Return A | 27.03% | 9.03% | (6.39)% | 13.76% | 22.47% |
Ratios to Average Net Assets C,E | | | | |
Expenses before reductions | 1.00% | 1.01% | .97% | 1.05% | 1.12% |
Expenses net of fee waivers, if any | 1.00% | 1.01% | .96% | 1.05% | 1.12% |
Expenses net of all reductions | .98% | .98% | .92% | 1.00% | 1.07% |
Net investment income (loss) | 1.32% | 1.73% | 1.64% | 1.35% | 1.53% |
Supplemental Data | | | | | |
Net assets, end of period (in millions) | $ 7,800 | $ 5,965 | $ 6,806 | $ 8,133 | $ 8,114 |
Portfolio turnover rate D | 65% | 68% | 75% | 82% | 98% |
A Total returns would have been lower if certain expenses had not been reduced during the applicable periods shown.
B Calculated based on average shares outstanding during the period.
C Fees and expenses of any underlying Fidelity Central Funds are not included in the Fund's expense ratio. The Fund indirectly bears its proportionate share of the expenses of any underlying Fidelity Central Funds.
D Amount does not include the portfolio activity of any underlying Fidelity Central Funds.
E Expense ratios reflect operating expenses of the class. Expenses before reductions do not reflect amounts reimbursed by the investment adviser or reductions from brokerage service arrangements or reductions from other expense offset arrangements and do not represent the amount paid by the class during periods when reimbursements or reductions occur. Expenses net of fee waivers reflect expenses after reimbursement by the investment adviser but prior to reductions from brokerage service arrangements or other expense offset arrangements. Expenses net of all reductions represent the net expenses paid by the class.
F Amount represents less than $.01 per share.
See accompanying notes which are an integral part of the financial statements.
Annual Report
Financial Highlights - Class K
Years ended October 31, | 2013 | 2012 | 2011 | 2010 | 2009 |
Selected Per-Share Data | | | | | |
Net asset value, beginning of period | $ 31.87 | $ 29.66 | $ 32.32 | $ 28.78 | $ 23.90 |
Income from Investment Operations | | | | | |
Net investment income (loss) B | .52 | .57 | .58 | .46 | .44 |
Net realized and unrealized gain (loss) | 8.01 | 2.11 | (2.54) | 3.53 | 4.86 |
Total from investment operations | 8.53 | 2.68 | (1.96) | 3.99 | 5.30 |
Distributions from net investment income | (.61) | (.47) | (.55) | (.41) | (.42) |
Distributions from net realized gain | (.03) | - | (.16) | (.04) | - |
Total distributions | (.64) | (.47) | (.70) G | (.45) | (.42) |
Redemption fees added to paid in capital B,F | - | - | - | - | - |
Net asset value, end of period | $ 39.76 | $ 31.87 | $ 29.66 | $ 32.32 | $ 28.78 |
Total Return A | 27.23% | 9.24% | (6.24)% | 13.96% | 22.80% |
Ratios to Average Net Assets C,E | | | | |
Expenses before reductions | .85% | .83% | .80% | .84% | .88% |
Expenses net of fee waivers, if any | .85% | .83% | .79% | .84% | .88% |
Expenses net of all reductions | .83% | .80% | .75% | .79% | .83% |
Net investment income (loss) | 1.47% | 1.91% | 1.81% | 1.55% | 1.77% |
Supplemental Data | | | | | |
Net assets, end of period (in millions) | $ 2,576 | $ 1,776 | $ 1,245 | $ 1,078 | $ 674 |
Portfolio turnover rate D | 65% | 68% | 75% | 82% | 98% |
A Total returns would have been lower if certain expenses had not been reduced during the applicable periods shown.
B Calculated based on average shares outstanding during the period.
C Fees and expenses of any underlying Fidelity Central Funds are not included in the Fund's expense ratio. The Fund indirectly bears its proportionate share of the expenses of any underlying Fidelity Central Funds.
D Amount does not include the portfolio activity of any underlying Fidelity Central Funds.
E Expense ratios reflect operating expenses of the class. Expenses before reductions do not reflect amounts reimbursed by the investment adviser or reductions from brokerage service arrangements or reductions from other expense offset arrangements and do not represent the amount paid by the class during periods when reimbursements or reductions occur. Expenses net of fee waivers reflect expenses after reimbursement by the investment adviser but prior to reductions from brokerage service arrangements or other expense offset arrangements. Expenses net of all reductions represent the net expenses paid by the class.
F Amount represents less than $.01 per share.
G Total distributions of $.70 per share is comprised of distributions from net investment income of $.548 and distributions from net realized gain of $.155 per share.
See accompanying notes which are an integral part of the financial statements.
Annual Report
Financial Highlights - Institutional Class
Years ended October 31, | 2013 | 2012 | 2011 | 2010 | 2009 |
Selected Per-Share Data | | | | | |
Net asset value, beginning of period | $ 31.87 | $ 29.65 | $ 32.31 | $ 28.77 | $ 23.91 |
Income from Investment Operations | | | | | |
Net investment income (loss) B | .47 | .52 | .54 | .41 | .39 |
Net realized and unrealized gain (loss) | 8.01 | 2.11 | (2.55) | 3.55 | 4.86 |
Total from investment operations | 8.48 | 2.63 | (2.01) | 3.96 | 5.25 |
Distributions from net investment income | (.56) | (.41) | (.50) | (.38) | (.39) |
Distributions from net realized gain | (.03) | - | (.16) | (.04) | - |
Total distributions | (.59) | (.41) | (.65) G | (.42) | (.39) |
Redemption fees added to paid in capital B,F | - | - | - | - | - |
Net asset value, end of period | $ 39.76 | $ 31.87 | $ 29.65 | $ 32.31 | $ 28.77 |
Total Return A | 27.03% | 9.07% | (6.39)% | 13.84% | 22.52% |
Ratios to Average Net Assets C,E | | | | |
Expenses before reductions | 1.00% | 1.00% | .95% | .99% | 1.05% |
Expenses net of fee waivers, if any | 1.00% | 1.00% | .94% | .99% | 1.05% |
Expenses net of all reductions | .97% | .97% | .90% | .95% | 1.00% |
Net investment income (loss) | 1.33% | 1.75% | 1.66% | 1.40% | 1.60% |
Supplemental Data | | | | | |
Net assets, end of period (in millions) | $ 476 | $ 294 | $ 278 | $ 319 | $ 267 |
Portfolio turnover rate D | 65% | 68% | 75% | 82% | 98% |
A Total returns would have been lower if certain expenses had not been reduced during the applicable periods shown.
B Calculated based on average shares outstanding during the period.
C Fees and expenses of any underlying Fidelity Central Funds are not included in the Fund's expense ratio. The Fund indirectly bears its proportionate share of the expenses of any underlying Fidelity Central Funds.
D Amount does not include the portfolio activity of any underlying Fidelity Central Funds.
E Expense ratios reflect operating expenses of the class. Expenses before reductions do not reflect amounts reimbursed by the investment adviser or reductions from brokerage service arrangements or reductions from other expense offset arrangements and do not represent the amount paid by the class during periods when reimbursements or reductions occur. Expenses net of fee waivers reflect expenses after reimbursement by the investment adviser but prior to reductions from brokerage service arrangements or other expense offset arrangements. Expenses net of all reductions represent the net expenses paid by the class.
F Amount represents less than $.01 per share.
G Total distributions of $.65 per share is comprised of distributions from net investment income of $.497 and distributions from net realized gain of $.155 per share.
See accompanying notes which are an integral part of the financial statements.
Annual Report
Financial Highlights - Class Z
Year ended October 31, | 2013 G |
Selected Per-Share Data | |
Net asset value, beginning of period | $ 37.22 |
Income from Investment Operations | |
Net investment income (loss) D | .07 |
Net realized and unrealized gain (loss) | 2.48 |
Total from investment operations | 2.55 |
Redemption fees added to paid in capital D,I | - |
Net asset value, end of period | $ 39.77 |
Total Return B,C | 6.85% |
Ratios to Average Net Assets E,H | |
Expenses before reductions | .85% A |
Expenses net of fee waivers, if any | .85% A |
Expenses net of all reductions | .83% A |
Net investment income (loss) | .76% A |
Supplemental Data | |
Net assets, end of period (000 omitted) | $ 107 |
Portfolio turnover rate F | 65% |
A Annualized
B Total returns for periods of less than one year are not annualized.
C Total returns would have been lower if certain expenses had not been reduced during the applicable periods shown.
D Calculated based on average shares outstanding during the period.
E Fees and expenses of any underlying Fidelity Central Funds are not included in the Fund's expense ratio. The Fund indirectly bears its proportionate share of the expenses of any underlying Fidelity Central Funds.
F Amount does not include the portfolio activity of any underlying Fidelity Central Funds.
G For the period August 13, 2013 (commencement of sale of shares) to October 31, 2013.
H Expense ratios reflect operating expenses of the class. Expenses before reductions do not reflect amounts reimbursed by the investment adviser or reductions from brokerage service arrangements or reductions from other expense offset arrangements and do not represent the amount paid by the class during periods when reimbursements or reductions occur. Expense ratios before reductions for start-up periods may not be representative of longer-term operating periods. Expenses net of fee waivers reflect expenses after reimbursement by the investment adviser but prior to reductions from brokerage service arrangements or other expense offset arrangements. Expenses net of all reductions represent the net expenses paid by the class.
I Amount represents less than $.01 per share.
See accompanying notes which are an integral part of the financial statements.
Annual Report
Notes to Financial Statements
For the period ended October 31, 2013
(Amounts in thousands except percentages)
1. Organization.
Fidelity International Discovery Fund (the Fund) is a fund of Fidelity Investment Trust (the Trust) and is authorized to issue an unlimited number of shares. The Trust is registered under the Investment Company Act of 1940, as amended (the 1940 Act), as an open-end management investment company organized as a Massachusetts business trust. The Fund commenced sale of Class Z shares on August 13, 2013. The Fund offers Class A, Class T, Class C, International Discovery, Class K, Institutional Class and Class Z shares, each of which, along with Class B shares, has equal rights as to assets and voting privileges. Class B shares are closed to new accounts and additional purchases, except for exchanges and reinvestments. Each class has exclusive voting rights with respect to matters that affect that class. Class B shares will automatically convert to Class A shares after a holding period of seven years from the initial date of purchase.
2. Investments in Fidelity Central Funds.
The Fund invests in Fidelity Central Funds, which are open-end investment companies generally available only to other investment companies and accounts managed by Fidelity Management & Research Company (FMR) and its affiliates. The Fund's Schedule of Investments lists each of the Fidelity Central Funds held as of period end, if any, as an investment of the Fund, but does not include the underlying holdings of each Fidelity Central Fund. As an Investing Fund, the Fund indirectly bears its proportionate share of the expenses of the underlying Fidelity Central Funds.
The Money Market Central Funds seek preservation of capital and current income and are managed by Fidelity Investments Money Management, Inc. (FIMM), an affiliate of FMR.
A complete unaudited list of holdings for each Fidelity Central Fund is available upon request or at the Securities and Exchange Commission (the SEC) website at www.sec.gov. In addition, the financial statements of the Fidelity Central Funds, which are not covered by the Fund's Report of Independent Registered Public Accounting Firm, are available on the SEC website or upon request.
3. Significant Accounting Policies.
The financial statements have been prepared in conformity with accounting principles generally accepted in the United States of America (GAAP), which require management to make certain estimates and assumptions at the date of the financial statements. Actual results could differ from those estimates. Subsequent events, if any, through the date that the financial statements were issued have been evaluated in the preparation of
Annual Report
3. Significant Accounting Policies - continued
the financial statements. The following summarizes the significant accounting policies of the Fund:
Investment Valuation. Investments are valued as of 4:00 p.m. Eastern time on the last calendar day of the period. In accordance with valuation policies and procedures approved by the Board of Trustees (the Board), the Fund attempts to obtain prices from one or more third party pricing vendors or brokers to value its investments. When current market prices, quotations or currency exchange rates are not readily available or reliable, investments will be fair valued in good faith by the FMR Fair Value Committee (the Committee), in accordance with procedures adopted by the Board. Factors used in determining fair value vary by investment type and may include market or investment specific events, changes in interest rates and credit quality. The frequency with which these procedures are used cannot be predicted and they may be utilized to a significant extent. The Committee oversees the Fund's valuation policies and procedures and is responsible for approving and reporting to the Board all fair value determinations.
The Fund categorizes the inputs to valuation techniques used to value its investments into a disclosure hierarchy consisting of three levels as shown below:
Level 1 - quoted prices in active markets for identical investments
Level 2 - other significant observable inputs (including quoted prices for similar investments, interest rates, prepayment speeds, etc.)
Level 3 - unobservable inputs (including the Fund's own assumptions based on the best information available)
Valuation techniques used to value the Fund's investments by major category are as follows:
Equity securities, including restricted securities, for which market quotations are readily available, are valued at the last reported sale price or official closing price as reported by a third party pricing vendor on the primary market or exchange on which they are traded and are categorized as Level 1 in the hierarchy. In the event there were no sales during the day or closing prices are not available, securities are valued at the last quoted bid price or may be valued using the last available price and are generally categorized as Level 2 in the hierarchy. For foreign equity securities, when market or security specific events arise, comparisons to the valuation of American Depositary Receipts (ADRs), futures contracts, Exchange-Traded Funds (ETFs) and certain indexes as well as quoted prices for similar securities may be used and would be categorized as Level 2 in the hierarchy. Utilizing these techniques may result in transfers between Level 1 and Level 2. For equity securities, including restricted securities, where observable inputs are
Annual Report
Notes to Financial Statements - continued
(Amounts in thousands except percentages)
3. Significant Accounting Policies - continued
Investment Valuation - continued
limited, assumptions about market activity and risk are used and these securities may be categorized as Level 3 in the hierarchy.
Debt securities, including restricted securities, are valued based on evaluated prices received from third party pricing vendors or from brokers who make markets in such securities. For U.S. government and government agency obligations, pricing vendors utilize matrix pricing which considers yield or price of bonds of comparable quality, coupon, maturity and type as well as broker-supplied prices. When independent prices are unavailable or unreliable, debt securities may be valued utilizing pricing methodologies which consider similar factors that would be used by third party pricing vendors. Debt securities are generally categorized as Level 2 in the hierarchy but may be Level 3 depending on the circumstances.
Futures contracts are valued at the settlement price established each day by the board of trade or exchange on which they are traded and are categorized as Level 1 in the hierarchy. Investments in open-end mutual funds, including the Fidelity Central Funds, are valued at their closing net asset value (NAV) each business day and are categorized as Level 1 in the hierarchy.
Changes in valuation techniques may result in transfers in or out of an assigned level within the disclosure hierarchy. The aggregate value of investments by input level, as of October 31, 2013, including information on transfers between Levels 1 and 2, is included at the end of the Fund's Schedule of Investments.
Foreign Currency. The Fund may use foreign currency contracts to facilitate transactions in foreign-denominated securities. Gains and losses from these transactions may arise from changes in the value of the foreign currency or if the counterparties do not perform under the contracts' terms.
Foreign-denominated assets, including investment securities, and liabilities are translated into U.S. dollars at the exchange rates at period end. Purchases and sales of investment securities, income and dividends received and expenses denominated in foreign currencies are translated into U.S. dollars at the exchange rate in effect on the transaction date.
The effects of exchange rate fluctuations on investments are included with the net realized and unrealized gain (loss) on investment securities. Other foreign currency transactions resulting in realized and unrealized gain (loss) are disclosed separately.
Investment Transactions and Income. For financial reporting purposes, the Fund's investment holdings and NAV include trades executed through the end of the last business day of the period. The NAV per share for processing shareholder transactions is
Annual Report
3. Significant Accounting Policies - continued
Investment Transactions and Income - continued
calculated as of the close of business of the New York Stock Exchange (NYSE), normally 4:00 p.m. Eastern time and includes trades executed through the end of the prior business day. Gains and losses on securities sold are determined on the basis of identified cost. Dividend income is recorded on the ex-dividend date, except for certain dividends from foreign securities where the ex-dividend date may have passed, which are recorded as soon as the Fund is informed of the ex-dividend date. Non-cash dividends included in dividend income, if any, are recorded at the fair market value of the securities received. Distributions received on securities that represent a return of capital or capital gain are recorded as a reduction of cost of investments and/or as a realized gain. Subsequent to ex-dividend date the Fund determines the components of these distributions, based upon receipt of tax filings or other correspondence relating to the underlying investment. Interest income and distributions from the Fidelity Central Funds are accrued as earned. Interest income includes coupon interest and amortization of premium and accretion of discount on debt securities. Investment income is recorded net of foreign taxes withheld where recovery of such taxes is uncertain.
Class Allocations and Expenses. Investment income, realized and unrealized capital gains and losses, common expenses of the Fund, and certain fund-level expense reductions, if any, are allocated daily on a pro-rata basis to each class based on the relative net assets of each class to the total net assets of the Fund. Each class differs with respect to transfer agent and distribution and service plan fees incurred. Certain expense reductions may also differ by class. For the reporting period, the allocated portion of income and expenses to each class as a percent of its average net assets may vary due to the timing of recording these transactions in relation to fluctuating net assets of the classes. Expenses directly attributable to a fund are charged to that fund. Expenses attributable to more than one fund are allocated among the respective funds on the basis of relative net assets or other appropriate methods. Expense estimates are accrued in the period to which they relate and adjustments are made when actual amounts are known.
Deferred Trustee Compensation. Under a Deferred Compensation Plan (the Plan), independent Trustees may elect to defer receipt of a portion of their annual compensation. Deferred amounts are invested in a cross-section of Fidelity funds, are marked-to-market and remain in the Fund until distributed in accordance with the Plan. The investment of deferred amounts and the offsetting payable to the Trustees are included in the accompanying Statement of Assets and Liabilities.
Income Tax Information and Distributions to Shareholders. Each year, the Fund intends to qualify as a regulated investment company under Subchapter M of the Internal Revenue Code, including distributing substantially all of its taxable income and realized gains. As a result, no provision for U.S. Federal income taxes is required. As of
Annual Report
Notes to Financial Statements - continued
(Amounts in thousands except percentages)
3. Significant Accounting Policies - continued
Income Tax Information and Distributions to Shareholders - continued
October 31, 2013, the Fund did not have any unrecognized tax benefits in the financial statements; nor is the Fund aware of any tax positions for which it is reasonably possible that the total amounts of unrecognized tax benefits will significantly change in the next twelve months. The Fund files a U.S. federal tax return, in addition to state and local tax returns as required. The Fund's federal income tax returns are subject to examination by the Internal Revenue Service (IRS) for a period of three fiscal years after they are filed. State and local tax returns may be subject to examination for an additional fiscal year depending on the jurisdiction. Foreign taxes are provided for based on the Fund's understanding of the tax rules and rates that exist in the foreign markets in which it invests.
Distributions are declared and recorded on the ex-dividend date. Income dividends and capital gain distributions are declared separately for each class. Income and capital gain distributions are determined in accordance with income tax regulations, which may differ from GAAP.
Capital accounts within the financial statements are adjusted for permanent book-tax differences. These adjustments have no impact on net assets or the results of operations. Temporary book-tax differences will reverse in a subsequent period.
Book-tax differences are primarily due to futures contracts, foreign currency transactions, passive foreign investment companies (PFIC), market discount, deferred trustees compensation, capital loss carryforwards and losses deferred due to wash sales.
The federal tax cost of investment securities and unrealized appreciation (depreciation) as of period end were as follows:
Gross unrealized appreciation | $ 2,288,825 |
Gross unrealized depreciation | (128,376) |
Net unrealized appreciation (depreciation) on securities and other investments | $ 2,160,449 |
| |
Tax Cost | $ 9,169,453 |
The tax-based components of distributable earnings as of period end were as follows:
Undistributed ordinary income | $ 219,779 |
Capital loss carryforward | $ (950,903) |
Net unrealized appreciation (depreciation) | $ 2,159,295 |
Annual Report
3. Significant Accounting Policies - continued
Income Tax Information and Distributions to Shareholders - continued
Capital loss carryforwards are only available to offset future capital gains of the Fund to the extent provided by regulations and may be limited. Under the Regulated Investment Company Modernization Act of 2010 (the Act), the Fund is permitted to carry forward capital losses incurred in taxable years beginning after December 22, 2010 for an unlimited period and such capital losses are required to be used prior to any losses that expire. The capital loss carryforward information presented below, including any applicable limitation, is estimated as of fiscal period end and is subject to adjustment.
Fiscal year of expiration | |
2017 | $ (950,903) |
The tax character of distributions paid was as follows:
| October 31, 2013 | October 31, 2012 |
Ordinary Income | $ 154,444 | $ 118,968 |
Short-Term Trading (Redemption) Fees. Shares held by investors in the Fund less than 30 days may have been subject to a redemption fee equal to 1.00% of the net asset value of shares redeemed. All redemption fees, which reduce the proceeds of the shareholder redemption, are retained by the Fund and accounted for as an addition to paid in capital.
New Accounting Pronouncement. The Financial Accounting Standards Board issued in December 2011, Accounting Standard Update No. 2011-11, Disclosures about Offsetting Assets and Liabilities, and in January 2013, Accounting Standards Update No. 2013-1 Clarifying the Scope of Disclosures about Offsetting Assets and Liabilities. These updates create new disclosure requirements requiring entities to disclose both gross and net information for derivatives and other financial instruments that are either offset in the Statement of Assets and Liabilities or subject to an enforceable master netting arrangement or similar agreement. The disclosure requirements are effective for annual reporting periods beginning on or after January 1, 2013, and interim periods within those annual periods. Management expects that the impact of the updates' adoption will be limited to additional financial statement disclosures as applicable.
4. Derivative Instruments.
Risk Exposures and the Use of Derivative Instruments. The Fund's investment objective allows the Fund to enter into various types of derivative contracts, including futures contracts. Derivatives are investments whose value is primarily derived from underlying assets, indices or reference rates and may be transacted on an exchange or
Annual Report
Notes to Financial Statements - continued
(Amounts in thousands except percentages)
4. Derivative Instruments - continued
Risk Exposures and the Use of Derivative Instruments - continued
over-the-counter (OTC). Derivatives may involve a future commitment to buy or sell a specified asset based on specified terms, to exchange future cash flows at periodic intervals based on a notional principal amount, or for one party to make one or more payments upon the occurrence of specified events in exchange for periodic payments from the other party.
The Fund used derivatives to increase returns and to manage exposure to certain risks as defined below. The success of any strategy involving derivatives depends on analysis of numerous economic factors, and if the strategies for investment do not work as intended, the Fund may not achieve its objectives.
The Fund's use of derivatives increased or decreased its exposure to the following risk:
Equity Risk | Equity risk relates to the fluctuations in the value of financial instruments as a result of changes in market prices (other than those arising from interest rate risk or foreign exchange risk), whether caused by factors specific to an individual investment, its issuer, or all factors affecting all instruments traded in a market or market segment. |
The Fund is also exposed to additional risks from investing in derivatives, such as liquidity risk and counterparty credit risk. Liquidity risk is the risk that the Fund will be unable to close out the derivative in the open market in a timely manner. Counterparty credit risk is the risk that the counterparty will not be able to fulfill its obligation to the Fund. Counterparty credit risk related to exchange-traded futures contracts may be mitigated by the protection provided by the exchange on which they trade.
Investing in derivatives may involve greater risks than investing in the underlying assets directly and, to varying degrees, may involve risk of loss in excess of any initial investment and collateral received and amounts recognized in the Statement of Assets and Liabilities. In addition, there may be the risk that the change in value of the derivative contract does not correspond to the change in value of the underlying instrument.
Futures Contracts. A futures contract is an agreement between two parties to buy or sell a specified underlying instrument for a fixed price at a specified future date. The Fund used futures contracts to manage its exposure to the stock market.
Upon entering into a futures contract, a fund is required to deposit either cash or securities (initial margin) with a clearing broker in an amount equal to a certain percentage of the face value of the contract. Futures contracts are marked-to-market daily and subsequent daily payments (variation margin) are made or received by a fund depending on the daily fluctuations in the value of the futures contracts and are recorded as unrealized
Annual Report
4. Derivative Instruments - continued
Futures Contracts - continued
appreciation or (depreciation). This receivable and/or payable, if any, is included in daily variation margin for derivative instruments in the Statement of Assets and Liabilities. Realized gain or (loss) is recorded upon the expiration or closing of a futures contract.
Any open futures contracts at period end are presented in the Schedule of Investments under the caption "Futures Contracts." The underlying face amount at value reflects each contract's exposure to the underlying instrument or index at period end and is representative of activity for the period. Securities deposited to meet initial margin requirements are identified in the Schedule of Investments.
During the period the Fund recognized net realized gain (loss) of $51,368 and a change in net unrealized appreciation (depreciation) of $4,238 related to its investment in futures contracts. These amounts are included in the Statement of Operations.
5. Purchases and Sales of Investments.
Purchases and sales of securities, other than short-term securities, aggregated $6,591,378 and $5,993,057, respectively.
6. Fees and Other Transactions with Affiliates.
Management Fee. FMR and its affiliates provide the Fund with investment management related services for which the Fund pays a monthly management fee. The management fee is the sum of an individual fund fee rate that is based on an annual rate of .45% of the Fund's average net assets and an annualized group fee rate that averaged .25% during the period. The group fee rate is based upon the average net assets of all the mutual funds advised by FMR, including any mutual funds previously advised by FMR that are currently advised by Fidelity SelectCo, LLC, an affiliate of FMR. The group fee rate decreases as assets under management increase and increases as assets under management decrease. In addition, the management fee is subject to a performance adjustment (up to a maximum of ± .20% of the Fund's average net assets over a 36 month performance period). The upward or downward adjustment to the management fee is based on the relative investment performance of International Discovery as compared to an appropriate benchmark index over the same 36 month performance period. For the reporting period, the total annual management fee rate, including the performance adjustment, was .77% of the Fund's average net assets. The performance adjustment included in the management fee rate may be higher or lower than the maximum performance adjustment rate due to the difference between the average net assets for the reporting and performance periods.
Annual Report
Notes to Financial Statements - continued
(Amounts in thousands except percentages)
6. Fees and Other Transactions with Affiliates - continued
Distribution and Service Plan Fees. In accordance with Rule 12b-1 of the 1940 Act, the Fund has adopted separate Distribution and Service Plans for each class of shares. Certain classes pay Fidelity Distributors Corporation (FDC), an affiliate of FMR, separate Distribution and Service Fees, each of which is based on an annual percentage of each class' average net assets. In addition, FDC may pay financial intermediaries for selling shares of the Fund and providing shareholder support services. For the period, the Distribution and Service Fee rates, total fees and amounts retained by FDC were as follows:
| Distribution
Fee | Service
Fee | Total Fees | Retained
by FDC |
Class A | -% | .25% | $ 796 | $ 9 |
Class T | .25% | .25% | 243 | 2 |
Class B | .75% | .25% | 69 | 52 |
Class C | .75% | .25% | 324 | 25 |
| | | $ 1,432 | $ 88 |
Sales Load. FDC may receive a front-end sales charge of up to 5.75% for selling Class A shares and 3.50% for selling Class T shares, some of which is paid to financial intermediaries for selling shares of the Fund. Depending on the holding period, FDC may receive contingent deferred sales charges levied on Class A, Class T, Class B, and Class C redemptions. The deferred sales charges range from 5.00% to 1.00% for Class B shares, 1.00% for Class C shares, 1.00% for certain purchases of Class A shares and .25% for certain purchases of Class T shares.
For the period, sales charge amounts retained by FDC were as follows:
| Retained
by FDC |
Class A | $ 56 |
Class T | 5 |
Class B* | 9 |
Class C* | 2 |
| $ 72 |
* When Class B and Class C shares are initially sold, FDC pays commissions from its own resources to financial intermediaries through which the sales are made.
Transfer Agent Fees. Fidelity Investments Institutional Operations Company, Inc., (FIIOC), an affiliate of FMR, is the transfer, dividend disbursing and shareholder servicing agent for each class of the Fund. FIIOC receives account fees and asset-based fees that vary according to the account size and type of account of the shareholders of the respective classes of the Fund, except for Class Z. FIIOC receives an asset-based fee of
Annual Report
6. Fees and Other Transactions with Affiliates - continued
Transfer Agent Fees - continued
Class K's and Class Z's average net assets. FIIOC pays for typesetting, printing and mailing of shareholder reports, except proxy statements.
For the period, transfer agent fees for each applicable class were as follows:
| Amount | % of
Average
Net Assets |
Class A | $ 954 | .30 |
Class T | 141 | .29 |
Class B | 21 | .30 |
Class C | 96 | .29 |
International Discovery | 13,480 | .20 |
Class K | 1,069 | .05 |
Institutional Class | 713 | .19 |
Class Z | -* | .05** |
| $ 16,474 | |
* Amount represents eleven dollars.
** Annualized
Accounting and Security Lending Fees. Fidelity Service Company, Inc. (FSC), an affiliate of FMR, maintains the Fund's accounting records. The accounting fee is based on the level of average net assets for each month. Under a separate contract, FSC administers the security lending program. The security lending fee is based on the number and duration of lending transactions.
Brokerage Commissions. The Fund placed a portion of its portfolio transactions with brokerage firms which are affiliates of the investment adviser. Brokerage commissions are included in net realized gain (loss) and change in net unrealized appreciation (depreciation) in the Statement of Operations. The commissions paid to these affiliated firms were $4 for the period.
7. Committed Line of Credit.
The Fund participates with other funds managed by FMR or an affiliate in a $4.25 billion credit facility (the "line of credit") to be utilized for temporary or emergency purposes to fund shareholder redemptions or for other short-term liquidity purposes. The Fund has agreed to pay commitment fees on its pro-rata portion of the line of credit, which amounted to $20 and is reflected in Miscellaneous expenses on the Statement of Operations. During the period, there were no borrowings on this line of credit.
Annual Report
Notes to Financial Statements - continued
(Amounts in thousands except percentages)
8. Security Lending.
The Fund lends portfolio securities through a lending agent from time to time in order to earn additional income. For equity securities, a lending agent is used and may loan securities to certain qualified borrowers, including Fidelity Capital Markets (FCM), a broker-dealer affiliated with the Fund. On the settlement date of the loan, the Fund receives collateral (in the form of U.S. Treasury obligations, letters of credit and/or cash) against the loaned securities and maintains collateral in an amount not less than 100% of the market value of the loaned securities during the period of the loan. The market value of the loaned securities is determined at the close of business of the Fund and any additional required collateral is delivered to the Fund on the next business day. If the borrower defaults on its obligation to return the securities loaned because of insolvency or other reasons, the Fund may apply collateral received from the borrower against the obligation. The Fund may experience delays and costs in recovering the securities loaned. Any cash collateral received is invested in the Fidelity Securities Lending Cash Central Fund. The value of loaned securities and cash collateral at period end are disclosed on the Fund's Statement of Assets and Liabilities. At period end, there were no security loans outstanding with FCM. Security lending income represents the income earned on investing cash collateral, less rebates paid to borrowers and any lending agent fees associated with the loan, plus any premium payments received for lending certain types of securities. Security lending income is presented in the Statement of Operations as a component of income from Fidelity Central Funds. Total security lending income during the period amounted to $5,441, including $40 from securities loaned to FCM.
9. Expense Reductions.
FMR voluntarily agreed to reimburse a portion of the following class' operating expense.
During the period, this reimbursement reduced expenses as follows:
| Reimbursement |
International Discovery | $ 10 |
Class K | 3 |
Institutional Class | 1 |
| $ 14 |
Commissions paid to certain brokers with whom FMR, or its affiliates, places trades on behalf of the Fund include an amount in addition to trade execution, which may be rebated back to the Fund to offset certain expenses. This amount totaled $2,236 for the period.
In addition, FMR reimbursed a portion of the Fund's operating expenses during the period in the amount of $61.
Annual Report
10. Distributions to Shareholders.
Distributions to shareholders of each class were as follows:
Years ended October 31, | 2013 | 2012 |
From net investment income | | |
Class A | $ 4,138 | $ 3,123 |
Class T | 492 | 388 |
Class B | 34 | 6 |
Class C | 186 | 44 |
International Discovery | 101,466 | 90,633 |
Class K | 34,651 | 20,917 |
Institutional Class | 5,064 | 3,857 |
Total | $ 146,031 | $ 118,968 |
From net realized gain | | |
Class A | $ 297 | $ - |
Class T | 46 | - |
Class B | 7 | - |
Class C | 30 | - |
International Discovery | 5,914 | - |
Class K | 1,827 | - |
Institutional Class | 292 | - |
Total | $ 8,413 | $ - |
11. Share Transactions.
Transactions for each class of shares were as follows:
| Shares | Dollars |
Years ended October 31, | 2013 A | 2012 | 2013 A | 2012 |
Class A | | | | |
Shares sold | 1,772 | 1,927 | $ 62,186 | $ 56,732 |
Reinvestment of distributions | 132 | 101 | 4,249 | 2,828 |
Shares redeemed | (2,553) | (3,468) | (88,988) | (100,935) |
Net increase (decrease) | (649) | (1,440) | $ (22,553) | $ (41,375) |
Class T | | | | |
Shares sold | 227 | 220 | $ 7,911 | $ 6,409 |
Reinvestment of distributions | 16 | 13 | 512 | 369 |
Shares redeemed | (347) | (860) | (11,997) | (25,207) |
Net increase (decrease) | (104) | (627) | $ (3,574) | $ (18,429) |
Class B | | | | |
Shares sold | 4 | 3 | $ 137 | $ 87 |
Reinvestment of distributions | 1 | - | 39 | 5 |
Shares redeemed | (75) | (113) | (2,570) | (3,297) |
Net increase (decrease) | (70) | (110) | $ (2,394) | $ (3,205) |
Annual Report
Notes to Financial Statements - continued
(Amounts in thousands except percentages)
11. Share Transactions - continued
| Shares | Dollars |
Years ended October 31, | 2013 A | 2012 | 2013 A | 2012 |
Class C | | | | |
Shares sold | 184 | 212 | $ 6,532 | $ 6,111 |
Reinvestment of distributions | 6 | 1 | 193 | 39 |
Shares redeemed | (207) | (395) | (7,250) | (11,440) |
Net increase (decrease) | (17) | (182) | $ (525) | $ (5,290) |
International Discovery | | | | |
Shares sold | 37,338 | 20,324 | $ 1,332,523 | $ 608,478 |
Reinvestment of distributions | 3,176 | 3,081 | 102,608 | 86,858 |
Shares redeemed | (31,569) | (65,748) | (1,103,313) | (1,937,202) |
Net increase (decrease) | 8,945 | (42,343) | $ 331,818 | $ (1,241,866) |
Class K | | | | |
Shares sold | 19,989 | 26,836 | $ 699,723 | $ 788,860 |
Reinvestment of distributions | 1,132 | 744 | 36,478 | 20,917 |
Shares redeemed | (12,053) | (13,817) | (423,712) | (410,022) |
Net increase (decrease) | 9,068 | 13,763 | $ 312,489 | $ 399,755 |
Institutional Class | | | | |
Shares sold | 4,893 | 2,049 | $ 175,669 | $ 59,460 |
Reinvestment of distributions | 68 | 53 | 2,182 | 1,502 |
Shares redeemed | (2,219) | (2,256) | (78,500) | (65,914) |
Net increase (decrease) | 2,742 | (154) | $ 99,351 | $ (4,952) |
Class Z | | | | |
Shares sold | 3 | - | $ 100 | $ - |
Net increase (decrease) | 3 | - | $ 100 | $ - |
A Share transactions for Class Z are for the period August 13, 2013 (commencement of sale of shares) to October 31, 2013.
12. Other.
The Fund's organizational documents provide former and current trustees and officers with a limited indemnification against liabilities arising in connection with the performance of their duties to the Fund. In the normal course of business, the Fund may also enter into contracts that provide general indemnifications. The Fund's maximum exposure under these arrangements is unknown as this would be dependent on future claims that may be made against the Fund. The risk of material loss from such claims is considered remote.
At the end of the period, Strategic Advisers International Fund was the owner of record of approximately 11% of the total outstanding shares of the Fund.
Annual Report
To the Trustees of Fidelity Investment Trust and the Shareholders of Fidelity International Discovery Fund:
In our opinion, the accompanying statement of assets and liabilities, including the schedule of investments, and the related statements of operations and of changes in net assets and the financial highlights present fairly, in all material respects, the financial position of Fidelity International Discovery Fund (a fund of Fidelity Investment Trust) at October 31, 2013, the results of its operations for the year then ended, the changes in its net assets for each of the two years in the period then ended and the financial highlights for each of the periods indicated, in conformity with accounting principles generally accepted in the United States of America. These financial statements and financial highlights (hereafter referred to as "financial statements") are the responsibility of the Fidelity International Discovery Fund's management. Our responsibility is to express an opinion on these financial statements based on our audits. We conducted our audits of these financial statements in accordance with the standards of the Public Company Accounting Oversight Board (United States). Those standards require that we plan and perform the audit to obtain reasonable assurance about whether the financial statements are free of material misstatement. An audit includes examining, on a test basis, evidence supporting the amounts and disclosures in the financial statements, assessing the accounting principles used and significant estimates made by management, and evaluating the overall financial statement presentation. We believe that our audits, which included confirmation of securities at October 31, 2013 by correspondence with the custodian and brokers, provide a reasonable basis for our opinion.
PricewaterhouseCoopers LLP
Boston, Massachusetts
December 16, 2013
Annual Report
The Trustees, Member of the Advisory Board, and executive officers of the trust and fund, as applicable, are listed below. The Board of Trustees governs the fund and is responsible for protecting the interests of shareholders. The Trustees are experienced executives who meet periodically throughout the year to oversee the fund's activities, review contractual arrangements with companies that provide services to the fund, oversee management of the risks associated with such activities and contractual arrangements, and review the fund's performance. Except for James C. Curvey, Ned C. Lautenbach, Ronald P. O'Hanley, and William S. Stavropoulos, each of the Trustees oversees 171 funds. Mr. Curvey oversees 394 funds. Mr. Lautenbach, Mr. O'Hanley, and Mr. Stavropoulos each oversees 245 funds.
The Trustees hold office without limit in time except that (a) any Trustee may resign; (b) any Trustee may be removed by written instrument, signed by at least two-thirds of the number of Trustees prior to such removal; (c) any Trustee who requests to be retired or who has become incapacitated by illness or injury may be retired by written instrument signed by a majority of the other Trustees; and (d) any Trustee may be removed at any special meeting of shareholders by a two-thirds vote of the outstanding voting securities of the trust. Each Trustee who is not an interested person of the trust and the fund (as defined in the 1940 Act) (Independent Trustee), shall retire not later than the last day of the calendar year in which his or her 75th birthday occurs. The Independent Trustees may waive this mandatory retirement age policy with respect to individual Trustees. The executive officers and Advisory Board Member hold office without limit in time, except that any officer and Advisory Board Member may resign or may be removed by a vote of a majority of the Trustees at any regular meeting or any special meeting of the Trustees. Except as indicated, each individual has held the office shown or other offices in the same company for the past five years.
Experience, Skills, Attributes, and Qualifications of the Fund's Trustees. The Governance and Nominating Committee has adopted a statement of policy that describes the experience, qualifications, attributes, and skills that are necessary and desirable for potential Independent Trustee candidates (Statement of Policy). The Board believes that each Trustee satisfied at the time he or she was initially elected or appointed a Trustee, and continues to satisfy, the standards contemplated by the Statement of Policy. The Governance and Nominating Committee also engages professional search firms to help identify potential Independent Trustee candidates who have the experience, qualifications, attributes, and skills consistent with the Statement of Policy. From time to time, additional criteria based on the composition and skills of the current Independent Trustees, as well as experience or skills that may be appropriate in light of future changes to board composition, business conditions, and regulatory or other developments, have also been considered by the professional search firms and the Governance and Nominating Committee. In addition, the Board takes into account the Trustees' commitment and participation in Board and committee meetings, as well as their leadership of standing and ad hoc committees throughout their tenure.
Annual Report
In determining that a particular Trustee was and continues to be qualified to serve as a Trustee, the Board has considered a variety of criteria, none of which, in isolation, was controlling. The Board believes that, collectively, the Trustees have balanced and diverse experience, qualifications, attributes, and skills, which allow the Board to operate effectively in governing the fund and protecting the interests of shareholders. Information about the specific experience, skills, attributes, and qualifications of each Trustee, which in each case led to the Board's conclusion that the Trustee should serve (or continue to serve) as a trustee of the fund, is provided below.
Board Structure and Oversight Function. James C. Curvey is an interested person (as defined in the 1940 Act) and currently serves as Chairman. The Trustees have determined that an interested Chairman is appropriate and benefits shareholders because an interested Chairman has a personal and professional stake in the quality and continuity of services provided to the fund. Independent Trustees exercise their informed business judgment to appoint an individual of their choosing to serve as Chairman, regardless of whether the Trustee happens to be independent or a member of management. The Independent Trustees have determined that they can act independently and effectively without having an Independent Trustee serve as Chairman and that a key structural component for assuring that they are in a position to do so is for the Independent Trustees to constitute a substantial majority for the Board. The Independent Trustees also regularly meet in executive session. Ned C. Lautenbach serves as Chairman of the Independent Trustees and as such (i) acts as a liaison between the Independent Trustees and management with respect to matters important to the Independent Trustees and (ii) with management prepares agendas for Board meetings.
Fidelity funds are overseen by different Boards of Trustees. The fund's Board oversees Fidelity's equity and high income funds and another Board oversees Fidelity's investment-grade bond, money market, and asset allocation funds. The asset allocation funds may invest in Fidelity funds overseen by the fund's Board. The use of separate Boards, each with its own committee structure, allows the Trustees of each group of Fidelity funds to focus on the unique issues of the funds they oversee, including common research, investment, and operational issues. On occasion, the separate Boards establish joint committees to address issues of overlapping consequences for the Fidelity funds overseen by each Board.
The Trustees operate using a system of committees to facilitate the timely and efficient consideration of all matters of importance to the Trustees, the fund, and fund shareholders and to facilitate compliance with legal and regulatory requirements and oversight of the fund's activities and associated risks. The Board, acting through its committees, has charged FMR and its affiliates with (i) identifying events or circumstances the occurrence of which could have demonstrably adverse effects on the fund's business and/or reputation; (ii) implementing processes and controls to lessen the possibility that such events or circumstances occur or to mitigate the effects of such events or circumstances if they do occur; and (iii) creating and maintaining a system designed to evaluate continuously business and market conditions in order to facilitate the identification and implementation processes described in (i) and (ii) above. Because the day-to-day operations and activities of the fund are carried out by or through FMR, its affiliates and other service providers, the fund's exposure to risks is mitigated but not eliminated by the processes overseen by the Trustees. While each of the Board's committees has responsibility for overseeing different aspects of the fund's activities, oversight is exercised primarily through the Operations, Audit, and Compliance Committees. In addition, the Independent Trustees have worked with FMR to enhance the Board's oversight of investment and financial risks, legal and regulatory risks, technology risks, and operational risks, including the development of additional risk reporting to the Board. For example, a working group comprised of Independent Trustees and FMR has worked and continues to work to review the Fidelity funds' valuation-related activities, reporting and risk management. Appropriate personnel, including but not limited to the fund's Chief Compliance Officer (CCO), FMR's internal auditor, the independent accountants, the fund's Treasurer and portfolio management personnel, make periodic reports to the Board's committees, as appropriate, including an annual review of FMR's risk management program for the Fidelity funds. The responsibilities of each standing committee, including their oversight responsibilities, are described further under "Standing Committees of the Fund's Trustees."
Annual Report
Trustees and Officers - continued
The fund's Statement of Additional Information (SAI) includes more information about the Trustees. To request a free copy, call Fidelity at 1-877-208-0098.
Interested Trustees*:
Correspondence intended for each Trustee who is an interested person may be sent to Fidelity Investments, 245 Summer Street, Boston, Massachusetts 02210.
Name, Year of Birth; Principal Occupations and Other Relevant Experience+ |
James C. Curvey (1935) |
Year of Election or Appointment: 2007 Trustee Chairman of the Board of Trustees |
| Mr. Curvey also serves as Trustee of other Fidelity funds. Mr. Curvey is a Director of Fidelity Investments Money Management, Inc. (2009-present), Director of Fidelity Research & Analysis Co. (2009-present) and Director of FMR and FMR Co., Inc. (2007-present). Mr. Curvey is also Vice Chairman (2007-present) and Director of FMR LLC. In addition, Mr. Curvey serves as an Overseer for the Boston Symphony Orchestra and a member of the Trustees of Villanova University. Previously, Mr. Curvey was the Vice Chairman (2006-2007) and Director (2000-2007) of FMR Corp. |
Ronald P. O'Hanley (1957) |
Year of Election or Appointment: 2011 Trustee |
| Mr. O'Hanley also serves as Trustee of other Fidelity funds. He is Director of Fidelity SelectCo, LLC (2013-present), FMR Co., Inc. (2010-present), Director of Fidelity Investments Money Management, Inc. (2010-present), Director of Fidelity Research & Analysis Company (2010-present), President of Fidelity Asset Management and Corporate Services and a Member of Fidelity's Executive Committee (2010-present). Previously, Mr. O'Hanley served as President and Chief Executive Officer of BNY Mellon Asset Management (2007-2010). Mr. O'Hanley also served as Vice Chairman of Bank New York Mellon Corp. and a member of that firm's Executive Committee. Prior to the 2007 merger of The Bank of New York and Mellon Financial Corporation, he was Vice Chairman of Mellon Financial Corporation and President and Chief Executive Officer of Mellon Asset Management. He joined Mellon in February 1997. Mr. O'Hanley currently serves as Chairman of the Boston Public Library Foundation Board of Directors and sits on the Board of Directors of Beth Israel Deaconess Medical Center, the Board of Trustees of the Marine Biological Laboratory and the Advisory Board of the Maxwell School of Citizenship and Public Administration at Syracuse University. Mr. O'Hanley also chairs the Council on Asset Management for the Financial Services Roundtable and is a member of the Board of Directors of Institutional Investor's U.S. Institute. |
* Trustees have been determined to be "Interested Trustees" by virtue of, among other things, their affiliation with the trust or various entities under common control with FMR.
+ The information above includes each Trustee's principal occupation during the last five years and other information relating to the experience, attributes, and skills relevant to each Trustee's qualifications to serve as a Trustee, which led to the conclusion that each Trustee should serve as a Trustee for the fund.
Annual Report
Trustees and Officers - continued
Independent Trustees:
Correspondence intended for each Independent Trustee (that is, the Trustees other than the Interested Trustees) may be sent to Fidelity Investments, P.O. Box 55235, Boston, Massachusetts 02205-5235.
Name, Year of Birth; Principal Occupations and Other Relevant Experience+ |
Dennis J. Dirks (1948) |
Year of Election or Appointment: 2005 Trustee |
| Mr. Dirks also serves as Trustee of other Fidelity funds. Prior to his retirement in May 2003, Mr. Dirks was Chief Operating Officer and a member of the Board of The Depository Trust & Clearing Corporation (DTCC). He also served as President, Chief Operating Officer, and Board member of The Depository Trust Company (DTC) and President and Board member of the National Securities Clearing Corporation (NSCC). In addition, Mr. Dirks served as Chief Executive Officer and Board member of the Government Securities Clearing Corporation, Chief Executive Officer and Board member of the Mortgage-Backed Securities Clearing Corporation, as a Trustee and a member of the Finance Committee of Manhattan College (2005-2008), and as a Trustee and a member of the Finance Committee of AHRC of Nassau County (2006-2008). Mr. Dirks is a member of the Independent Directors Council (IDC) Governing Council (2010-present) and Board of Directors for The Brookville Center for Children's Services, Inc. (2009-present). |
Alan J. Lacy (1953) |
Year of Election or Appointment: 2008 Trustee |
| Mr. Lacy also serves as Trustee of other Fidelity funds. Mr. Lacy serves as Senior Adviser (2007-present) of Oak Hill Capital Partners, L.P. (private equity). Mr. Lacy also served as Chief Executive Officer (2000-2005) and Vice Chairman (2005-2006) of Sears Holdings Corporation and Sears, Roebuck and Co. (retail). In addition, Mr. Lacy serves as a member of the Board of Directors of Dave & Buster's Entertainment, Inc. (restaurant and entertainment complexes, 2010-present), Earth Fare, Inc. (retail grocery, 2012-present), The Hillman Companies, Inc. (hardware wholesalers, 2010-present), and Bristol-Myers Squibb Company (global pharmaceuticals, 2008-present). Mr. Lacy is a member of the Board of Trustees of The National Parks Conservation Association (2006-present). Previously, Mr. Lacy served as Chairman of the Board of Trustees of the National Parks Conservation Association (2008-2011) and as a member of the Board of Directors for the Western Union Company (global money transfer, 2006-2011). |
Ned C. Lautenbach (1944) |
Year of Election or Appointment: 2000 Trustee Chairman of the Independent Trustees |
| Mr. Lautenbach also serves as Trustee of other Fidelity funds. Mr. Lautenbach currently serves as the Lead Director of the Eaton Corporation Board of Directors (diversified industrial, 1997-present). Mr. Lautenbach is Chairman of the Board of Directors of the Philharmonic Center for the Arts in Naples, Florida (2012-present) and a member of the Council on Foreign Relations (1994-present). Previously, Mr. Lautenbach was a Partner/Advisory Partner at Clayton, Dubilier & Rice, LLC (private equity investment, 1998-2010), as well as a Director of Sony Corporation (2006-2007). |
Joseph Mauriello (1944) |
Year of Election or Appointment: 2008 Trustee |
| Mr. Mauriello also serves as Trustee of other Fidelity funds. Prior to his retirement in January 2006, Mr. Mauriello served in numerous senior management positions including Deputy Chairman and Chief Operating Officer (2004-2005), and Vice Chairman of Financial Services (2002-2004) of KPMG LLP US (professional services, 1965-2005). Mr. Mauriello currently serves as a member of the Board of Directors of XL Group plc. (global insurance and re-insurance, 2006-present). Previously, Mr. Mauriello served as a Director of the Hamilton Funds of the Bank of New York (2006-2007) and of Arcadia Resources Inc. (health care services and products, 2007-2012). |
Robert W. Selander (1950) |
Year of Election or Appointment: 2011 Trustee |
| Mr. Selander also serves as Trustee of other Fidelity funds. Previously, Mr. Selander served as a Member of the Advisory Board of other Fidelity funds (2011), and Executive Vice Chairman (2010), Chief Executive Officer (2009-2010), and President and Chief Executive Officer (1997-2009) of Mastercard, Inc. |
Cornelia M. Small (1944) |
Year of Election or Appointment: 2005 Trustee |
| Ms. Small also serves as Trustee of other Fidelity funds. Ms. Small is a member of the Board of Directors (2009-present) and Chair of the Investment Committee (2010-present) of the Teagle Foundation. Ms. Small also serves on the Investment Committee of the Berkshire Taconic Community Foundation (2008-present). Previously, Ms. Small served as Chairperson (2002-2008) and a member of the Investment Committee and Chairperson (2008-2012) and a member of the Board of Trustees of Smith College. In addition, Ms. Small served as Chief Investment Officer, Director of Global Equity Investments, and a member of the Board of Directors of Scudder, Stevens & Clark and Scudder Kemper Investments. |
William S. Stavropoulos (1939) |
Year of Election or Appointment: 2001 Trustee Vice Chairman of the Independent Trustees |
| Mr. Stavropoulos also serves as Trustee of other Fidelity funds. Mr. Stavropoulos serves as President and Founder of the Michigan Baseball Foundation, the Great Lakes Loons (2007-present). Mr. Stavropoulos is Chairman Emeritus of the Board of Directors of The Dow Chemical Company, where he previously served in numerous senior management positions, including President, CEO (1995-2000; 2002-2004), Chairman of the Executive Committee (2000-2006), and as a member of the Board of Directors (1990-2006). Currently, Mr. Stavropoulos is Chairman of the Board of Directors of Univar Inc. (global distributor of commodity and specialty chemicals), a Director of Teradata Corporation (data warehousing and technology solutions), and Maersk Inc. (industrial conglomerate), and a member of the Advisory Board for Metalmark Capital LLC (private equity investment, 2005-present). Mr. Stavropoulos is an operating advisor to Clayton, Dubilier & Rice, LLC (private equity investment). In addition, Mr. Stavropoulos is a member of the University of Notre Dame Advisory Council for the College of Science, a Trustee of the Rollin L. Gerstacker Foundation, and a Director of the Naples Philharmonic Center for the Arts. Previously, Mr. Stavropoulos served as a Director of Chemical Financial Corporation (bank holding company, 1993-2012) and Tyco International, Ltd. (multinational manufacturing and services, 2007-2012). |
David M. Thomas (1949) |
Year of Election or Appointment: 2008 Trustee |
| Mr. Thomas also serves as Trustee of other Fidelity funds. Mr. Thomas serves as Non-Executive Chairman of the Board of Directors of Fortune Brands Home and Security (home and security products, 2011-present), and as a member of the Board of Directors of Interpublic Group of Companies, Inc. (marketing communication, 2004-present). Previously, Mr. Thomas served as Executive Chairman (2005-2006) and Chairman and Chief Executive Officer (2000-2005) of IMS Health, Inc. (pharmaceutical and healthcare information solutions), and a Director of Fortune Brands, Inc. (consumer products, 2000-2011). |
+ The information above includes each Trustee's principal occupation during the last five years and other information relating to the experience, attributes, and skills relevant to each Trustee's qualifications to serve as a Trustee, which led to the conclusion that each Trustee should serve as a Trustee for the fund.
Advisory Board Member and Executive Officers:
Correspondence intended for each executive officer and Peter S. Lynch may be sent to Fidelity Investments, 245 Summer Street, Boston, Massachusetts 02210. Executive officers appear below in alphabetical order.
Name, Year of Birth; Principal Occupation |
Peter S. Lynch (1944) |
Year of Election or Appointment: 2003 Member of the Advisory Board |
| Mr. Lynch also serves as Member of the Advisory Board of other Fidelity funds. Mr. Lynch is Vice Chairman and a Director of FMR and FMR Co., Inc. In addition, Mr. Lynch serves as a Trustee of Boston College and as the Chairman of the Inner-City Scholarship Fund. Previously, Mr. Lynch served on the Special Olympics International Board of Directors (1997-2006). |
Elizabeth Paige Baumann (1968) |
Year of Election or Appointment: 2012 Anti-Money Laundering (AML) Officer |
| Ms. Baumann also serves as AML Officer of other funds. She is Chief AML Officer of FMR LLC (2012-present) and is an employee of Fidelity Investments. Previously, Ms. Baumann served as Vice President and Deputy Anti-Money Laundering Officer (2007-2012). |
William C. Coffey (1969) |
Year of Election or Appointment: 2009 Assistant Secretary |
| Mr. Coffey also serves as Assistant Secretary of other funds. He is Senior Vice President and Deputy General Counsel of FMR LLC (2010-present), and is an employee of Fidelity Investments. Previously, Mr. Coffey served as Vice President and Associate General Counsel of FMR LLC (2005-2009). |
Jonathan Davis (1968) |
Year of Election or Appointment: 2010 Assistant Treasurer |
| Mr. Davis also serves as Assistant Treasurer of other funds. Mr. Davis is an employee of Fidelity Investments. Previously, Mr. Davis served as Vice President and Associate General Counsel of FMR LLC (2003-2010). |
Adrien E. Deberghes (1967) |
Year of Election or Appointment: 2008 Deputy Treasurer |
| Mr. Deberghes also serves as an officer of other funds. He is an employee of Fidelity Investments (2008-present). Prior to joining Fidelity Investments, Mr. Deberghes was Senior Vice President of Mutual Fund Administration at State Street Corporation (2007-2008), Senior Director of Mutual Fund Administration at Investors Bank & Trust (2005-2007), and Director of Finance for Dunkin' Brands (2000-2005). |
Stephanie J. Dorsey (1969) |
Year of Election or Appointment: 2010 Assistant Treasurer |
| Ms. Dorsey also serves as an officer of other funds. She is an employee of Fidelity Investments (2008-present) and has served in other fund officer roles. Prior to joining Fidelity Investments, Ms. Dorsey served as Treasurer (2004-2008) of the JPMorgan Mutual Funds and Vice President (2004-2008) of JPMorgan Chase Bank. |
Scott C. Goebel (1968) |
Year of Election or Appointment: 2008 Secretary and Chief Legal Officer (CLO) |
| Mr. Goebel serves as Secretary and CLO of other funds. Mr. Goebel also serves as Secretary of Fidelity Investments Money Management, Inc. (FIMM) (2010-present) and Fidelity Research and Analysis Company (FRAC) (2010-present); General Counsel, Secretary, and Senior Vice President of FMR (2008-present) and FMR Co., Inc. (2008-present); Chief Legal Officer of Fidelity Management & Research (Hong Kong) Limited (2008-present) and Assistant Secretary of Fidelity Management & Research (Japan) Inc. (2008-present), and Fidelity Management & Research (U.K.) Inc. (2008-present). Previously, Mr. Goebel served as Secretary and CLO of other Fidelity funds (2008-2013), Assistant Secretary of FIMM (2008-2010), FRAC (2008-2010), and certain funds (2007-2008); and as Vice President and Secretary of Fidelity Distributors Corporation (FDC) (2005-2007). Mr. Goebel has been employed by FMR LLC or an affiliate since 2001. |
Joseph A. Hanlon (1968) |
Year of Election or Appointment: 2012 Chief Compliance Officer |
| Mr. Hanlon also serves as Chief Compliance Officer of other funds. Mr. Hanlon serves as Compliance Officer of FMR, FMR Co., Inc., Fidelity Investments Money Management, Inc. (FIMM), Fidelity Research and Analysis Company (FRAC), and Fidelity Management & Research (Hong Kong) (2009-present), as Senior Vice President of the Fidelity Asset Management Division (2009-present), and is an employee of Fidelity Investments. Previously, Mr. Hanlon served as Compliance Officer of Fidelity Management & Research (Japan) Inc. (2009-2013), Strategic Advisers, Inc. (2009-2013), and Fidelity Management & Research (U.K.) Inc. (2009-2013). |
Bruce T. Herring (1965) |
Year of Election or Appointment: 2006 Vice President of certain Equity Funds |
| Mr. Herring also serves as Vice President of other funds. He serves as Chief Investment Officer of Fidelity Global Asset Allocation (GAA) (2013-present), Chief Investment Officer and Director of Fidelity Management & Research (U.K.) Inc. (2010-present), Group Chief Investment Officer of FMR, and President of Fidelity Research & Analysis Company (2010-present). Previously, Mr. Herring served as Vice President (2005-2006) and Senior Vice President (2006-2007) of Fidelity Management & Research Company, Vice President of FMR Co., Inc. (2001-2007), and as a portfolio manager for Fidelity U.S. Equity Funds. |
Brian B. Hogan (1964) |
Year of Election or Appointment: 2009 Vice President |
| Mr. Hogan also serves as Vice President of other funds. Mr. Hogan serves as President of FMR's Equity Division (2009-present). Previously, Mr. Hogan served as Senior Vice President, Equity Research of FMR (2006-2009) and as a portfolio manager. |
Chris Maher (1972) |
Year of Election or Appointment: 2013 Assistant Treasurer |
| Mr. Maher serves as Assistant Treasurer of other funds. Mr. Maher is Vice President of Valuation Oversight and is an employee of Fidelity Investments. Previously, Mr. Maher served as Vice President of Asset Management Compliance (2013), Vice President of FMR's Program Management Group (2010-2013), and Vice President of Valuation Oversight (2008-2010). |
Christine Reynolds (1958) |
Year of Election or Appointment: 2008 Chief Financial Officer |
| Ms. Reynolds also serves as Chief Financial Officer of other funds. Ms. Reynolds became President of Fidelity Pricing and Cash Management Services (FPCMS) in August 2008. Ms. Reynolds served as Chief Operating Officer of FPCMS (2007-2008). Previously, Ms. Reynolds served as President, Treasurer, and Anti-Money Laundering officer of the Fidelity funds (2004-2007). |
Kenneth B. Robins (1969) |
Year of Election or Appointment: 2008 President and Treasurer |
| Mr. Robins also serves as an officer of other funds. Mr. Robins serves as Executive Vice President of Fidelity Investments Money Management, Inc. (FIMM) (2013-present) and is an employee of Fidelity Investments (2004-present). Previously, Mr. Robins served in other fund officer roles. |
Gary W. Ryan (1958) |
Year of Election or Appointment: 2005 Assistant Treasurer |
| Mr. Ryan also serves as Assistant Treasurer of other funds. Mr. Ryan is an employee of Fidelity Investments and has served in other fund officer roles. Previously, Mr. Ryan served as Vice President of Fund Reporting in Fidelity Pricing and Cash Management Services (FPCMS) (1999-2005). |
Stephen Sadoski (1971) |
Year of Election or Appointment: 2012 Deputy Treasurer |
| Mr. Sadoski also serves as Deputy Treasurer of other funds. He is an employee of Fidelity Investments (2012-present) and has served in another fund officer role. Prior to joining Fidelity Investments, Mr. Sadoski served as an assistant chief accountant in the Division of Investment Management of the Securities and Exchange Commission (SEC) (2009-2012) and as a senior manager at Deloitte & Touche LLP (1997-2009). |
Stacie M. Smith (1974) |
Year of Election or Appointment: 2013 Deputy Treasurer |
| Ms. Smith also serves as an officer of other funds. She is an employee of Fidelity Investments (2009-present) and has served in other fund officer roles. Prior to joining Fidelity Investments, Ms. Smith served as Senior Audit Manager of Ernst & Young LLP (1996-2009). |
Renee Stagnone (1975) |
Year of Election or Appointment: 2013 Deputy Treasurer |
| Ms. Stagnone also serves as Deputy Treasurer of other funds. Ms. Stagnone is an employee of Fidelity Investments. |
Joseph F. Zambello (1957) |
Year of Election or Appointment: 2011 Deputy Treasurer |
| Mr. Zambello also serves as Deputy Treasurer of other funds. Mr. Zambello is an employee of Fidelity Investments. Previously, Mr. Zambello served as Vice President of FMR's Program Management Group (2009-2011) and Vice President of the Transfer Agent Oversight Group (2005-2009). |
Annual Report
The Board of Trustees of Fidelity Advisor International Discovery Fund voted to pay to shareholders of record at the opening of business on record date, the following distributions per share derived from capital gains realized from sales of portfolio securities, and dividends derived from net investment income:
| Pay Date | Record Date | Dividends | Capital Gains |
Institutional Class | 12/09/13 | 12/06/13 | $0.481 | $0.311 |
Institutional Class designates 1% of the dividends distributed during the fiscal year as qualifying for the dividends-received deduction for corporate shareholders.
Institutional Class designates 100% of the dividends during the fiscal year as amounts which may be taken into account as a dividend for the purposes of the maximum rate under section 1(h)(11) of the Internal Revenue Code.
The amounts per share which represent income derived from sources within, and taxes paid to, foreign countries or possessions of the United States are as follows:
| Pay Date | Income | Taxes |
Institutional Class | 12/10/12 | $0.511 | $0.026 |
The fund will notify shareholders in January 2014 of amounts for use in preparing 2013 income tax returns.
Annual Report
Board Approval of Investment Advisory Contracts and Management Fees
Fidelity International Discovery Fund
Each year, the Board of Trustees, including the Independent Trustees (together, the Board), votes on the renewal of the management contract and sub-advisory agreements (together, the Advisory Contracts) for the fund. The Board, assisted by the advice of fund counsel and Independent Trustees' counsel, requests and considers a broad range of information relevant to the renewal of the Advisory Contracts throughout the year.
The Board meets regularly and, at each of its meetings, covers an extensive agenda of topics and materials and considers factors that are relevant to its annual consideration of the renewal of the fund's Advisory Contracts, including the services and support provided to the fund and its shareholders. The Board has established various standing committees, each composed of and chaired by Independent Trustees with varying backgrounds, to which the Board has assigned specific subject matter responsibilities in order to enhance effective decision-making by the Board. The Board, acting directly and through its Committees, requests and receives information concerning the annual consideration of the renewal of the fund's Advisory Contracts. The Board also meets as needed to consider matters specifically related to the Board's annual consideration of the renewal of Advisory Contracts. Members of the Board may also meet with trustees of other Fidelity funds through ad hoc joint committees to discuss certain matters relevant to the Fidelity funds.
At its July 2013 meeting, the Board, including the Independent Trustees, unanimously determined to renew the fund's Advisory Contracts. In reaching its determination, the Board considered all factors it believed relevant, including (i) the nature, extent, and quality of the services to be provided to the fund and its shareholders (including the investment performance of the fund); (ii) the competitiveness of the fund's management fee and total expense ratio relative to peer funds; (iii) the total costs of the services to be provided by and the profits to be realized by Fidelity from its relationship with the fund; (iv) the extent to which economies of scale exist and would be realized as the fund grows; and (v) whether fee levels reflect these economies of scale, if any, for the benefit of fund shareholders.
In considering whether to renew the Advisory Contracts for the fund, the Board reached a determination, with the assistance of fund counsel and Independent Trustees' counsel and through the exercise of its business judgment, that the renewal of the Advisory Contracts was in the best interests of the fund and its shareholders and that the compensation payable under the Advisory Contracts was fair and reasonable. The Board's decision to renew the Advisory Contracts was not based on any single factor, but rather was based on a comprehensive consideration of all the information provided to the Board at its meetings throughout the year. The Board, in reaching its determination to renew the Advisory Contracts, was aware that shareholders in the fund have a broad range of investment choices available to them, including a wide choice among mutual funds offered by Fidelity's competitors, and that the fund's shareholders, who have the opportunity to review and weigh the disclosure provided by the fund in its prospectus and other public disclosures, have chosen to invest in this fund, which is a part of the Fidelity family of funds.
Annual Report
Board Approval of Investment Advisory Contracts and
Management Fees - continued
Nature, Extent, and Quality of Services Provided. The Board considered the staffing within the investment adviser, Fidelity Management & Research Company (FMR), and the sub-advisers (together, the Investment Advisers) as it relates to the fund, including the backgrounds of the fund's investment personnel, and also considered the fund's investment objective, strategies, and related investment philosophy. The Independent Trustees also had discussions with senior management of Fidelity's investment operations and investment groups. The Board considered the structure of the portfolio manager compensation program and whether this structure provides appropriate incentives to act in the best interests of the fund.
Resources Dedicated to Investment Management and Support Services. The Board and the Fund Oversight and Research Committees reviewed the general qualifications and capabilities of the Investment Advisers' investment staff, including its size, education, experience, and resources, as well as the Investment Advisers' approach to recruiting, training, managing, and compensating investment personnel. The Board noted that FMR has continued to increase the resources devoted to non-U.S. offices, including expansion of Fidelity's global investment organization. The Board also noted that Fidelity's analysts have extensive resources, tools and capabilities that allow them to conduct sophisticated quantitative and fundamental analysis, as well as credit analysis of issuers, counterparties and guarantors. Further, the Board believes that Fidelity's investment professionals have sufficient access to global information and data so as to provide competitive investment results over time, and that those professionals also have access to sophisticated tools that permit them to assess portfolio construction and risk and performance attribution characteristics continuously, as well as to transmit new information and research conclusions rapidly around the world. Additionally, in its deliberations, the Board considered the Investment Advisers' trading and risk management capabilities and resources, which are an integral part of the investment management process.
Shareholder and Administrative Services. The Board considered (i) the nature, extent, quality, and cost of advisory, administrative, and shareholder services performed by the Investment Advisers and their affiliates under the Advisory Contracts and under separate agreements covering transfer agency, pricing and bookkeeping, and securities lending services for the fund; (ii) the nature and extent of the supervision of third party service providers, principally custodians and subcustodians; and (iii) the resources devoted to, and the record of compliance with, the fund's compliance policies and procedures. The Board also reviewed the allocation of fund brokerage, including allocations to brokers affiliated with the Investment Advisers, the use of brokerage commissions to pay fund expenses, and the use of "soft" commission dollars to pay for research services.
Annual Report
The Board noted that the growth of fund assets over time across the complex allows Fidelity to reinvest in the development of services designed to enhance the value or convenience of the Fidelity funds as investment vehicles. These services include 24-hour access to account information and market information through telephone representatives and over the Internet, investor education materials and asset allocation tools, and the expanded availability of Fidelity Investor Centers.
Investment in a Large Fund Family. The Board considered the benefits to shareholders of investing in a Fidelity fund, including the benefits of investing in a fund that is part of a large family of funds offering a variety of investment disciplines and providing a large variety of mutual fund investor services. The Board noted that Fidelity had taken, or had made recommendations that resulted in the Fidelity funds taking, a number of actions over the previous year that benefited particular funds, including (i) continuing to dedicate additional resources to investment research and to the support of the senior management team that oversees asset management; (ii) persisting in efforts to enhance Fidelity's global research capabilities; (iii) launching new funds and making other enhancements to meet client needs for global and income-oriented solutions; (iv) continuing to launch dedicated lower cost underlying funds to meet portfolio construction needs related to expanding underlying fund options for Fidelity funds of funds, specifically for the Freedom Fund product lines; (v) rationalizing product lines and gaining increased efficiencies through the mergers of several funds into other funds; (vi) strengthening Fidelity's index fund offerings by reducing investment minimums and adopting or lowering existing expense caps for certain funds and classes; (vii) enhancing Global Asset Allocation product offerings by launching new funds and strategies, including "open architecture" target date funds that utilize affiliated and unaffiliated sub-advisers; (viii) modifying the eligibility criteria for Institutional Class shares of Advisor funds to increase their marketability to a portion of the defined contribution plan market; (ix) creating a new low-cost retirement share class for certain Advisor funds to appeal to large retirement plans; (x) transitioning the management of certain Fidelity commodity funds to Geode Capital Management LLC, a registered commodity pool operator, while retaining administrative responsibilities for the funds; (xi) reorganizing a number of funds; and (xii) taking steps toward establishing a new Fidelity adviser to manage sector-based funds and products.
Investment Performance. The Board considered whether the fund has operated in accordance with its investment objective, as well as its record of compliance with its investment restrictions and its performance history.
The Board took into account discussions with the Investment Advisers about fund investment performance that occur at Board meetings throughout the year. In this regard the Board noted that as part of regularly scheduled fund reviews and other reports to the Board on fund performance, the Board periodically considers annualized return information for the fund, for different time periods, measured against a securities market index ("benchmark index") and a peer group of mutual funds with similar objectives ("peer group"). In its evaluation of fund investment performance, the Board gave particular attention to information indicating changes in performance of certain Fidelity funds for specific time periods and the Investment Advisers' explanations for any overperformance or underperformance.
Annual Report
Board Approval of Investment Advisory Contracts and
Management Fees - continued
In addition to reviewing absolute and relative fund performance, the Independent Trustees periodically consider the appropriateness of fund performance metrics in evaluating the results achieved. In general, the Independent Trustees believe that fund performance should be evaluated based on net performance (after fees and expenses) of both the highest performing and lowest performing classes, where applicable, compared to appropriate benchmark indices, over appropriate time periods which may include full market cycles, and compared to peer groups, as applicable, over the same periods, taking into account relevant factors including the following: general market conditions; issuer-specific information; tactical opportunities for investment; and fund cash flows and other factors.
The Independent Trustees recognize that shareholders evaluate performance on a net basis over their own holding periods, for which one-, three-, and five-year periods are used as a proxy. For this reason, the performance information reviewed by the Board also included net cumulative calendar year total return information for the fund and an appropriate benchmark index and peer group for the most recent one-, three-, and five-year periods, as shown below. Returns are shown compared to the 25th percentile (top of box) and 75th percentile (bottom of box) of the peer universe. Returns of the benchmark index are "net MA," i.e., adjusted for tax withholding rates applicable to U.S.-based mutual funds organized as Massachusetts business trusts.
Annual Report
Fidelity International Discovery Fund

The Board also considered that the fund's management fee is subject to upward or downward adjustment depending upon whether, and to what extent, the fund's investment performance for the performance period exceeds, or is exceeded by, a securities index, thus leading to a performance adjustment for the same period. The Board noted that the performance adjustment provides FMR with a strong economic incentive to seek to achieve superior performance for the fund's shareholders and helps to more closely align the interests of FMR and the fund's shareholders.
Based on its review, the Board concluded that the nature, extent, and quality of services provided to the fund under the Advisory Contracts should benefit the fund's shareholders.
Competitiveness of Management Fee and Total Expense Ratio. The Board considered the fund's management fee and total expense ratio compared to "mapped groups" of competitive funds and classes. Fidelity creates "mapped groups" by combining similar Lipper investment objective categories that have comparable management fee characteristics. Combining Lipper investment objective categories aids the Board's management fee and total expense ratio comparisons by broadening the competitive group used for comparison and by reducing the number of universes to which various Fidelity funds are compared.
Management Fee. The Board considered two proprietary management fee comparisons for the 12-month periods shown in the chart below. The group of Lipper funds used by the Board for management fee comparisons is referred to below as the "Total Mapped Group." The Total Mapped Group comparison focuses on a fund's standing in terms of gross management fees before expense reimbursements or caps, and without giving effect to the fund's performance adjustment, relative to the total universe of funds with comparable investment mandates, regardless of whether their management fee structures also are comparable. Funds with comparable investment mandates offer exposure to similar types of securities. Funds with comparable management fee structures have similar management fee contractual arrangements (e.g., flat rate charged for advisory services, all-inclusive fee rate, etc.). "TMG %" represents the percentage of funds in the Total Mapped Group that had management fees that were lower than the fund's. For example, a TMG % of 16% means that 84% of the funds in the Total Mapped Group had higher management fees than the fund. The "Asset-Size Peer Group" (ASPG) comparison focuses on a fund's standing relative to a subset of non-Fidelity funds within the Total Mapped Group that are similar in size and management fee structure. The ASPG represents at least 15% of the funds in the Total Mapped Group with comparable asset size and management fee structures, subject to a minimum of 50 funds (or all funds in the Total Mapped Group if fewer than 50). Additional information, such as the ASPG quartile in which the fund's management fee ranked and the impact of the fund's performance adjustment, is also included in the chart and considered by the Board.
Annual Report
Board Approval of Investment Advisory Contracts and
Management Fees - continued
Fidelity International Discovery Fund
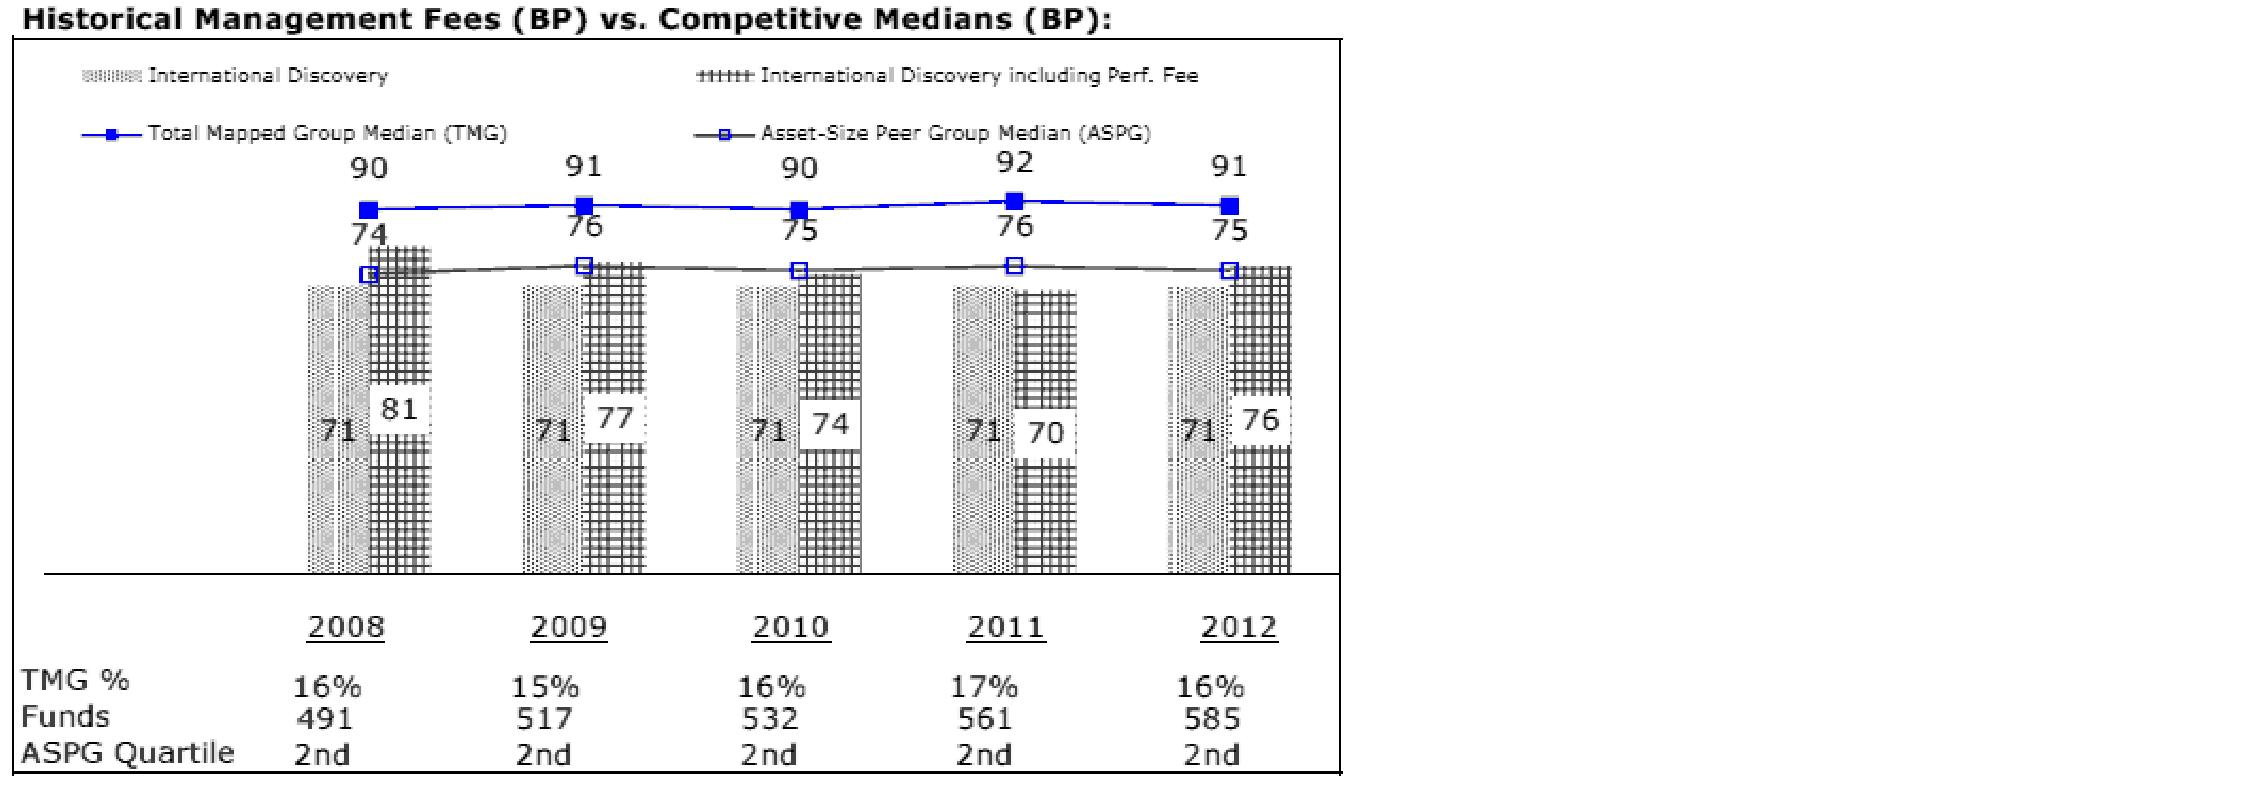
The Board noted that the fund's management fee ranked below the median of its Total Mapped Group and below the median of its ASPG for 2012. The Board also noted the effect of the fund's positive performance adjustment on the fund's management fee ranking.
Annual Report
Based on its review, the Board concluded that the fund's management fee is fair and reasonable in light of the services that the fund receives and the other factors considered.
Total Expense Ratio. In its review of each class's total expense ratio, the Board considered the fund's management fee as well as other fund or class expenses, as applicable, such as transfer agent fees, pricing and bookkeeping fees, fund-paid 12b-1 fees, and custodial, legal, and audit fees. The Board also noted the effects of any waivers and reimbursements on fees and expenses, as well as the impact of the fund's performance adjustment. As part of its review, the Board also considered the current and historical total expense ratios of each class of the fund compared to competitive fund median expenses. Each class of the fund is compared to those funds and classes in the Total Mapped Group (used by the Board for management fee comparisons) that have a similar sales load structure.
The Board noted that the total expense ratio of each of Class A, Class B, Class C, Institutional Class, the retail class, and Class K ranked below its competitive median for 2012 and the total expense ratio of Class T ranked above its competitive median for 2012. The Board considered that, in general, various factors can affect total expense ratios. The Board noted that the total expense ratio of Class T was above the competitive median primarily because of higher 12b-1 fees on Class T. Class T has a higher 12b-1 fee, but a lower front-end sales charge, than traditionally priced front-end sales charge classes. The Board considered that Class T is primarily sold load-waived in the retirement plan market where its 0.50% 12b-1 fee is comparable to competing no-load, higher 12b-1 fee classes designed specifically for retirement plans. The Board noted that the fund offers multiple classes, each of which has a different sales load and 12b-1 fee structure, and that the multiple structures are intended to offer a range of pricing options for the intermediary market. The Board also noted that the total expense ratios of the classes vary primarily by the level of their 12b-1 fees, although differences in transfer agent fees may also cause expenses to vary from class to class.
Fees Charged to Other Fidelity Clients. The Board also considered Fidelity fee structures and other information with respect to clients of FMR and its affiliates, such as other mutual funds advised or subadvised by FMR or its affiliates, pension plan clients, and other institutional clients. The Board noted the findings of the 2013 ad hoc joint committee (created with the board of other Fidelity funds), which reviewed and compared Fidelity's institutional investment advisory business with its business of providing services to the Fidelity funds, including the differences in services provided, fees charged, and costs incurred, as well as competition in their respective marketplaces.
Based on its review of total expense ratios and fees charged to other Fidelity clients, the Board concluded that the total expense ratio of each class of the fund was reasonable, although Class T was above the median of the universe presented for comparison, in light of the services that the fund and its shareholders receive and the other factors considered.
Annual Report
Board Approval of Investment Advisory Contracts and
Management Fees - continued
Costs of the Services and Profitability. The Board considered the revenues earned and the expenses incurred by Fidelity in conducting the business of developing, marketing, distributing, managing, administering and servicing the fund and servicing the fund's shareholders. The Board also considered the level of Fidelity's profits in respect of all the Fidelity funds.
On an annual basis, FMR presents to the Board Fidelity's profitability for the fund. Fidelity calculates the profitability for each fund, as well as aggregate profitability for groups of Fidelity funds and all Fidelity funds, using a series of detailed revenue and cost allocation methodologies which originate with the books and records of Fidelity on which Fidelity's audited financial statements are based. The Audit Committee of the Board reviews any significant changes from the prior year's methodologies.
PricewaterhouseCoopers LLP (PwC), independent registered public accounting firm and auditor to Fidelity and certain Fidelity funds, has been engaged annually by the Board as part of the Board's assessment of Fidelity's profitability analysis. PwC's engagement includes the review and assessment of the methodologies used by Fidelity in determining the revenues and expenses attributable to Fidelity's mutual fund business, and completion of agreed-upon procedures surrounding the mathematical accuracy of fund profitability and its conformity to allocation methodologies. After considering PwC's reports issued under the engagement and information provided by Fidelity, the Board concluded that while other allocation methods may also be reasonable, Fidelity's profitability methodologies are reasonable in all material respects.
The Board also reviewed Fidelity's non-fund businesses and fall-out benefits related to the mutual fund business as well as cases where Fidelity's affiliates may benefit from or be related to the fund's business.
The Board considered the costs of the services provided by and the profits realized by Fidelity in connection with the operation of the fund and was satisfied that the profitability was not excessive in the circumstances.
Economies of Scale. The Board considered whether there have been economies of scale in respect of the management of the Fidelity funds, whether the Fidelity funds (including the fund) have appropriately benefited from any such economies of scale, and whether there is potential for realization of any further economies of scale. The Board considered the extent to which the fund will benefit from economies of scale through increased services to the fund, through waivers or reimbursements, or through fee or expense reductions. The Board also noted that in 2009, it and the board of other Fidelity funds created an ad hoc committee (the Economies of Scale Committee) to analyze whether FMR attains economies of scale in respect of the management and servicing of the Fidelity funds, whether the Fidelity funds have appropriately benefited from such economies of scale, and whether there is potential for realization of any further economies of scale.
Annual Report
The Board recognized that the fund's management contract incorporates a "group fee" structure, which provides for lower group fee rates as total fund assets under FMR's management increase, and for higher group fee rates as total fund assets under FMR's management decrease. FMR calculates the group fee rates based on a tiered asset "breakpoint" schedule that varies based on asset class. The Board considered that the group fee is designed to deliver the benefits of economies of scale to fund shareholders when total Fidelity fund assets increase, even if assets of any particular fund are unchanged or have declined, because some portion of Fidelity's costs are attributable to services provided to all Fidelity funds, and all funds benefit if those costs can be allocated among more assets. The Board concluded that, given the group fee structure, fund shareholders will benefit from lower management fees as assets under FMR's management increase at the fund complex level, regardless of whether Fidelity achieves any such economies of scale.
The Board concluded, taking into account the analysis of the Economies of Scale Committee, that economies of scale, if any, are being appropriately shared between fund shareholders and Fidelity.
Amendment to Description of Group Fee Rate. At its July 2013 meeting, the Board voted to approve an amendment to the fund's management contract to modify the description of the "group fee rate" effective August 1, 2013. The Board noted that under the prior description in the contract, the group fee rate was based on the average net assets of all registered investment companies with which FMR has management contracts. Under the contract's tiered asset breakpoint schedule, the group fee rate is lower as total fund assets under FMR's management increase, and higher as total fund assets under FMR's management decrease. The Board considered that the prior description would have excluded the assets of 64 Fidelity sector funds from the group fee rate calculation once Fidelity SelectCo, LLC, an affiliate of FMR, assumed management responsibilities for those funds. The Board noted that modifying the description of the group fee rate to continue to include the assets of those 64 funds for purposes of determining group fee rate breakpoints would avoid an immediate adverse impact on the group fee rate for any fund.
Additional Information Requested by the Board. In order to develop fully the factual basis for consideration of the Fidelity funds' Advisory Contracts, the Board requested and received additional information on certain topics, including: (i) fund performance trends and Fidelity's long-term strategies for certain funds; (ii) the potential to further rationalize the Fidelity fund lineup with the possibility of achieving savings for the funds and Fidelity; (iii) the methodology with respect to competitive fund data and peer group classifications; (iv) the arrangements with, and performance of, certain sub-advisers on behalf of the Fidelity funds, as well as certain proposed participating affiliate arrangements; (v) the realization of fall-out benefits in certain Fidelity business units; (vi) Fidelity's group fee structures, including the rationale for the individual fee rates of certain categories of funds and the definition of group assets; (vii) trends regarding industry use of performance fee structures and the performance adjustment methodologies applicable to the Fidelity funds; (viii) additional competitive analysis regarding the total expenses for certain classes; and (ix) fund profitability methodology, including Fidelity's cost allocation methodology, and the impact of certain factors on fund profitability results.
Annual Report
Board Approval of Investment Advisory Contracts and
Management Fees - continued
Based on its evaluation of all of the conclusions noted above, and after considering all factors it believed relevant, the Board ultimately concluded that the advisory fee structures are fair and reasonable, and that the fund's Advisory Contracts should be renewed.
Annual Report
Investment Adviser
Fidelity Management & Research Company
Boston, MA
Investment Sub-Advisers
FMR Co., Inc.
Fidelity Management & Research
(U.K.) Inc.
FIL Investment Advisors
FIL Investments (Japan) Limited
FIL Investment Advisors (U.K.) Limited
Fidelity Management & Research
(Hong Kong) Limited
Fidelity Management & Research
(Japan) Inc.
General Distributor
Fidelity Distributors Corporation
Smithfield, RI
Transfer and Service Agents
Fidelity Investments Institutional Operations Company, Inc.
Boston, MA
Fidelity Service Company, Inc.
Boston, MA
Custodian
The Northern Trust Company
Chicago, IL
(Fidelity Investment logo)(registered trademark)
AIDI-UANN-1213
1.806657.108
(Fidelity Investment logo)(registered trademark)
Fidelity Advisor®
International Discovery
Fund - Class Z
Annual Report
October 31, 2013
(Fidelity Cover Art)
Class Z is
a class of Fidelity®
International Discovery Fund
Contents
Performance | (Click Here) | How the fund has done over time. |
Management's Discussion of Fund Performance | (Click Here) | The Portfolio Manager's review of fund performance and strategy. |
Shareholder Expense Example | (Click Here) | An example of shareholder expenses. |
Investment Changes | (Click Here) | A summary of major shifts in the fund's investments over the past six months. |
Investments | (Click Here) | A complete list of the fund's investments with their market values. |
Financial Statements | (Click Here) | Statements of assets and liabilities, operations, and changes in net assets, as well as financial highlights. |
Notes | (Click Here) | Notes to financial statements. |
Report of Independent Registered Public Accounting Firm | (Click Here) | |
Trustees and Officers | (Click Here) | |
Distributions | (Click Here) | |
Board Approval of Investment Advisory Contracts and Management Fees | (Click Here) | |
To view a fund's proxy voting guidelines and proxy voting record for the 12-month period ended June 30, visit http://www.fidelity.com/proxyvotingresults or visit the Securities and Exchange Commission's (SEC) web site at http://www.sec.gov. You may also call 1-877-208-0098 to request a free copy of the proxy voting guidelines.
Standard & Poor's, S&P and S&P 500 are registered service marks of The McGraw-Hill Companies, Inc. and have been licensed for use by Fidelity Distributors Corporation.
Other third-party marks appearing herein are the property of their respective owners.
All other marks appearing herein are registered or unregistered trademarks or service marks of FMR LLC or an affiliated company. © 2013 FMR LLC. All rights reserved.
Annual Report
This report and the financial statements contained herein are submitted for the general information of the shareholders of the fund. This report is not authorized for distribution to prospective investors in the fund unless preceded or accompanied by an effective prospectus.
A fund files its complete schedule of portfolio holdings with the SEC for the first and third quarters of each fiscal year on Form N-Q. Forms N-Q are available on the SEC's web site at http://www.sec.gov. A fund's Forms N-Q may be reviewed and copied at the SEC's Public Reference Room in Washington, DC. Information regarding the operation of the SEC's Public Reference Room may be obtained by calling 1-800-SEC-0330. For a complete list of a fund's portfolio holdings, view the fund's most recent holdings listing, semiannual report, or annual report on Fidelity's web site at http://www.fidelity.com, http://www.advisor.fidelity.com, or http://www.401k.com, as applicable.
NOT FDIC INSURED • MAY LOSE VALUE • NO BANK GUARANTEE
Neither the fund nor Fidelity Distributors Corporation is a bank.
Annual Report
Average annual total return reflects the change in the value of an investment, assuming reinvestment of the class' distributions from dividend income and capital gains (the profits earned upon the sale of securities that have grown in value, if any) and assuming a constant rate of performance each year. The $10,000 table and the fund's returns do not reflect the deduction of taxes that a shareholder would pay on fund distributions or the redemption of fund shares. During periods of reimbursement by Fidelity, a fund's total return will be greater than it would be had the reimbursement not occurred. How a fund did yesterday is no guarantee of how it will do tomorrow.
Average Annual Total Returns
Periods ended October 31, 2013 | Past 1
year | Past 5
years | Past 10
years |
Class Z A, B | 27.06% | 12.59% | 8.75% |
A The initial offering of Class Z shares took place on August 13, 2013. Returns between January 6, 2005 and August 13, 2013, are those of Institutional Class. Returns prior to January 6, 2005, are those of Fidelity® International Discovery Fund, the original class of the fund.
B Prior to October 1, 2004, the fund operated under certain different investment policies. The fund's historical performance may not represent its current investment policies.
$10,000 Over 10 Years
Let's say hypothetically that $10,000 was invested in Fidelity Advisor® International Discovery Fund - Class Z on October 31, 2003. The chart shows how the value of your investment would have changed, and also shows how the MSCI® EAFE® Index performed over the same period. See footnote A above for additional information regarding the performance of Class Z.
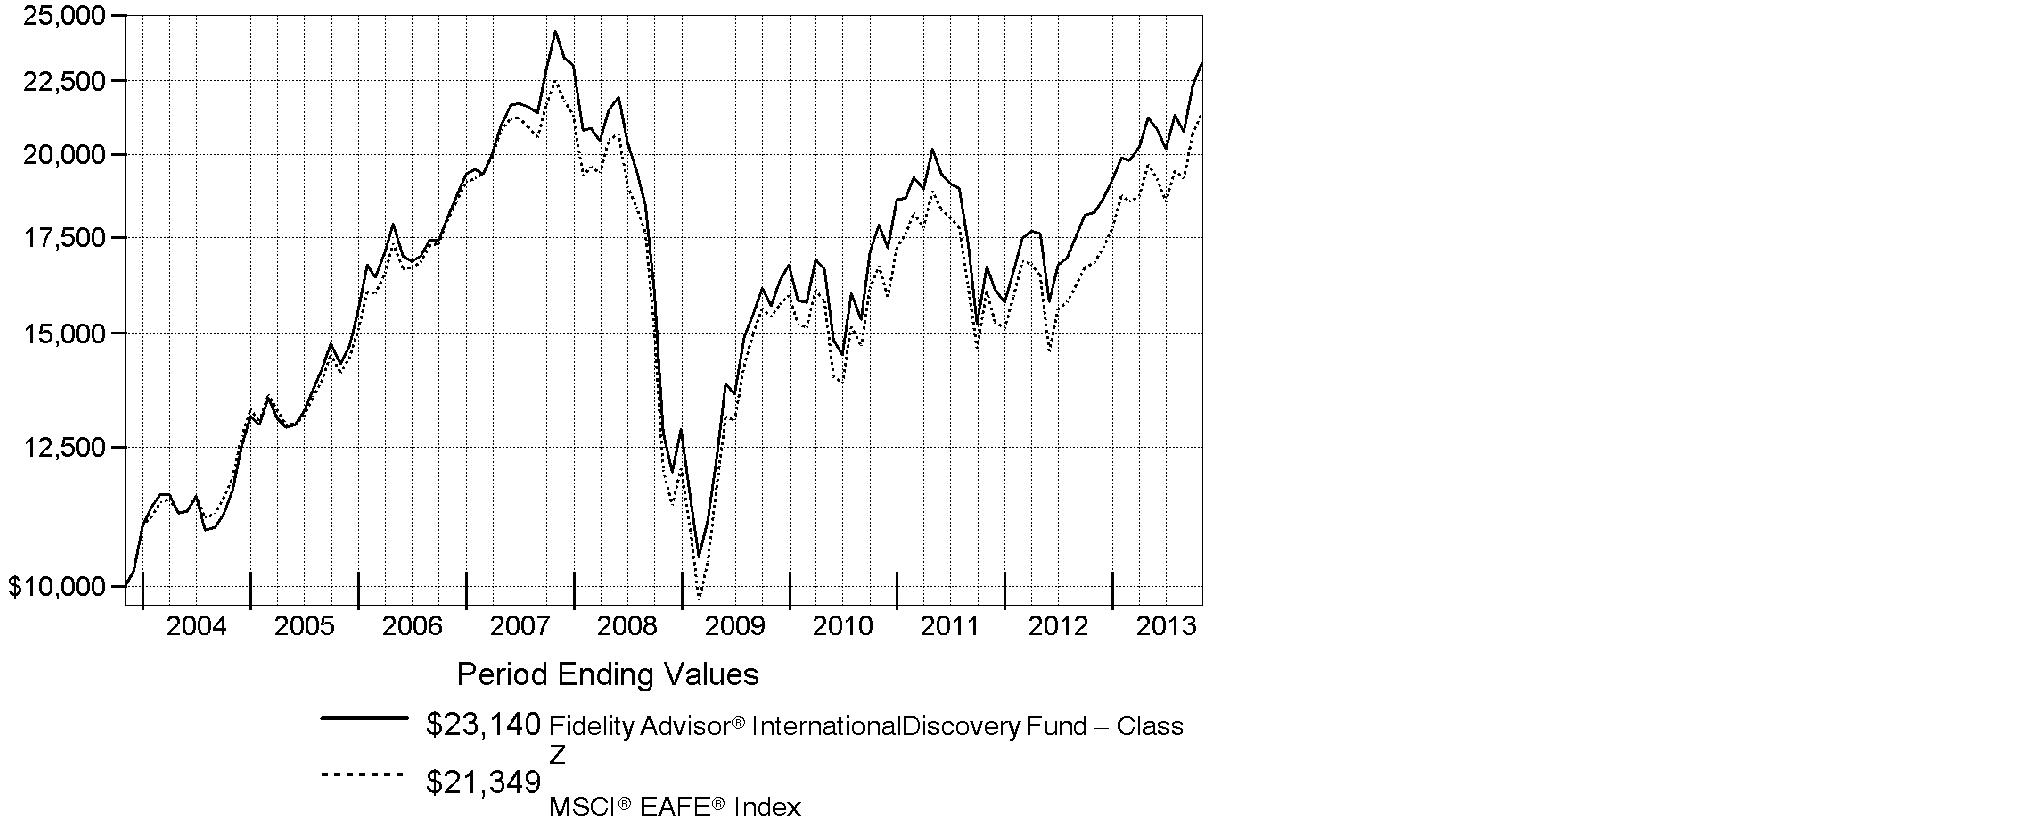
Annual Report
Market Recap: On balance, global equity markets remained upbeat for the 12-month period ending October 31, 2013. The MSCI® ACWI® (All Country World Index) Index gained 23.75% for the period, amid investor preference for higher-risk assets. The period was not without turbulence, however. In the spring and summer, central banks worldwide, especially in the U.S. and China, made clear their intentions to maintain accommodative monetary policies. That stance, combined with modest cyclical improvements around the globe and generally low valuations, underpinned the broad rally in equities. Europe (+32%) shone brightly, with most markets in the region - large and small - registering solid, index-beating gains. Another bright spot was Japan, which, despite a struggling yen and taking a second-half breather, posted a 34% result for the full year. The U.S. - by far the index's biggest constituent - also outperformed the global market with a roughly 28% advance. Meanwhile, Asia-Pacific ex Japan (+14%) lagged, hurt in part by a slowdown in Australia's mining industry as well as currency headwinds. Foreign-exchange and commodity weakness also curbed results in resource-heavy Canada and emerging markets (EM), both of which were up 7%. Country-level EM performance diverged meaningfully for the period, as evidenced by performance in Brazil (-1%), Russia (+12%), India (+1%) and China (+8%).
Comments from William Kennedy, Portfolio Manager of Fidelity Advisor® International Discovery Fund: For the year, the fund's Class Z shares tracked the 27.02% gain of its benchmark, the MSCI® EAFE® Index. (For specific class-level results, please refer to the performance section of this report.) Security selection aided relative performance, with notable outperformance in the U.K. and Japan. Positioning in the Asia Pacific ex Japan region and the materials sector also contributed, as did security selection in information technology. Top individual contributors included U.K.-based online-only supermarket Ocado Group, an out-of-index position that rallied after the company significantly expanded its business capacity. An overweighting in real estate leasing company ORIX stood out, as improved economic activity drove up real estate prices in Japan. By contrast, stock picks in core European countries, emerging markets and the automobiles & components segment of consumer discretionary detracted, along with a small cash position in an up market. Individual disappointments included Housing Development Finance, a large mortgage provider in India, whose stock declined along with the Indian rupee. An average underweighting in Toyota Motor also hurt, as the weakening yen combined with the company's market-share increases to propel the stock higher.
The views expressed above reflect those of the portfolio manager(s) only through the end of the period as stated on the cover of this report and do not necessarily represent the views of Fidelity or any other person in the Fidelity organization. Any such views are subject to change at any time based upon market or other conditions and Fidelity disclaims any responsibility to update such views. These views may not be relied on as investment advice and, because investment decisions for a Fidelity fund are based on numerous factors, may not be relied on as an indication of trading intent on behalf of any Fidelity fund.
Annual Report
Shareholder Expense Example
As a shareholder of the Fund, you incur two types of costs: (1) transaction costs, including sales charges (loads) on purchase payments or redemption proceeds, redemption fees and (2) ongoing costs, including management fees, distribution and/or service (12b-1) fees and other Fund expenses. This Example is intended to help you understand your ongoing costs (in dollars) of investing in the Fund and to compare these costs with the ongoing costs of investing in other mutual funds.
The actual expense Example is based on an investment of $1,000 invested at the beginning of the period and held for the entire period (May 1, 2013 to October 31, 2013) for Class A, Class T, Class B, Class C, International Discovery, Class K and Institutional Class and for the period (August 13, 2013 to October 31, 2013) for Class Z. The hypothetical expense Example is based on an investment of $1,000 invested for the one-half year period (May 1, 2013 to October 31, 2013).
Actual Expenses
The first line of the accompanying table for each class of the Fund provides information about actual account values and actual expenses. You may use the information in this line, together with the amount you invested, to estimate the expenses that you paid over the period. Simply divide your account value by $1,000.00 (for example, an $8,600 account value divided by $1,000.00 = 8.6), then multiply the result by the number in the first line for a class of the Fund under the heading entitled "Expenses Paid During Period" to estimate the expenses you paid on your account during this period. A small balance maintenance fee of $12.00 that is charged once a year may apply for certain accounts with a value of less than $2,000. This fee is not included in the table below. If it was, the estimate of expenses you paid during the period would be higher, and your ending account value lower, by this amount. In addition, the Fund, as a shareholder in the underlying Fidelity Central Funds, will indirectly bear its pro-rata share of the fees and expenses incurred by the underlying Fidelity Central Funds. These fees and expenses are not included in the Fund's annualized expense ratio used to calculate the expense estimate in the table below.
Hypothetical Example for Comparison Purposes
The second line of the accompanying table for each class of the Fund provides information about hypothetical account values and hypothetical expenses based on a Class' actual expense ratio and an assumed rate of return of 5% per year before expenses, which is not the Class' actual return. The hypothetical account values and expenses may not be used to estimate the actual ending account balance or expenses you paid for the period. You may use this information to compare the ongoing costs of investing in the Fund and other funds. To do so, compare this 5% hypothetical example with the 5% hypothetical examples that appear in the shareholder reports of the other funds. A small balance maintenance fee of $12.00 that is charged once a year may apply for certain accounts with a value of less than $2,000. This fee is not included in the table below. If it was, the estimate of expenses you paid during the period would be higher, and your ending account value lower, by this amount. In addition, the Fund, as a shareholder in the underlying Fidelity Central Funds, will indirectly bear its pro-rata share of the fees and expenses incurred by the underlying Fidelity Central Funds. These fees and expenses are not included in the Fund's annualized expense ratio used to calculate the expense estimate in the table below.
Annual Report
Please note that the expenses shown in the table are meant to highlight your ongoing costs only and do not reflect any transaction costs. Therefore, the second line of the table is useful in comparing ongoing costs only, and will not help you determine the relative total costs of owning different funds. In addition, if these transactional costs were included, your costs would have been higher.
| Annualized
Expense Ratio B | Beginning
Account Value | Ending
Account Value
October 31, 2013 | Expenses Paid
During Period |
Class A | 1.34% | | | |
Actual | | $ 1,000.00 | $ 1,089.10 | $ 7.06 C |
HypotheticalA | | $ 1,000.00 | $ 1,018.45 | $ 6.82 D |
Class T | 1.58% | | | |
Actual | | $ 1,000.00 | $ 1,087.90 | $ 8.31 C |
HypotheticalA | | $ 1,000.00 | $ 1,017.24 | $ 8.03 D |
Class B | 2.09% | | | |
Actual | | $ 1,000.00 | $ 1,085.00 | $ 10.98 C |
HypotheticalA | | $ 1,000.00 | $ 1,014.67 | $ 10.61 D |
Class C | 2.09% | | | |
Actual | | $ 1,000.00 | $ 1,085.30 | $ 10.99 C |
HypotheticalA | | $ 1,000.00 | $ 1,014.67 | $ 10.61 D |
International Discovery | .99% | | | |
Actual | | $ 1,000.00 | $ 1,091.00 | $ 5.22 C |
HypotheticalA | | $ 1,000.00 | $ 1,020.21 | $ 5.04 D |
Class K | .85% | | | |
Actual | | $ 1,000.00 | $ 1,092.00 | $ 4.48 C |
HypotheticalA | | $ 1,000.00 | $ 1,020.92 | $ 4.33 D |
Institutional Class | .99% | | | |
Actual | | $ 1,000.00 | $ 1,091.10 | $ 5.22 C |
HypotheticalA | | $ 1,000.00 | $ 1,020.21 | $ 5.04 D |
Class Z | .85% | | | |
Actual | | $ 1,000.00 | $ 1,068.50 | $ 1.93 C |
HypotheticalA | | $ 1,000.00 | $ 1,020.92 | $ 4.33 D |
A 5% return per year before expenses
B Annualized expense ratio reflects expenses net of applicable fee waivers.
Annual Report
Shareholder Expense Example - continued
C Actual expenses are equal to each Class' annualized expense ratio; multiplied by the average account value over the period, multiplied by 184/365 (to reflect the one-half year period) for Class A, Class T, Class B, Class C, International Discovery, Class K and Institutional Class and multiplied by 80/365 (to reflect the period August 13, 2013 to October 31, 2013) for Class Z.
D Hypothetical expenses are equal to each Class' annualized expense ratio, multiplied by the average account value over the period, multiplied by 184/365 (to reflect the one-half year period).
Annual Report
Investment Changes (Unaudited)
Geographic Diversification (% of fund's net assets) |
As of October 31, 2013 |
 | Japan 18.2% | |
 | United Kingdom 15.9% | |
 | France 10.9% | |
 | Germany 8.7% | |
 | Switzerland 6.4% | |
 | United States of America* 5.5% | |
 | Sweden 4.1% | |
 | Spain 3.6% | |
 | Netherlands 3.3% | |
 | Other 23.4% | |

Percentages are based on country or territory of incorporation and are adjusted for the effect of futures contracts, if applicable. |
* Includes Short-Term Investments and Net Other Assets (Liabilities) |
As of April 30, 2013 |
| Japan 20.5% | |
| United Kingdom 16.1% | |
| France 9.7% | |
| Germany 7.5% | |
| Switzerland 6.3% | |
| United States of America* 5.2% | |
| Australia 3.9% | |
| Sweden 2.7% | |
| Netherlands 2.5% | |
| Other 25.6% | |

Percentages are based on country or territory of incorporation and are adjusted for the effect of futures contracts, if applicable. |
* Includes Short-Term Investments and Net Other Assets (Liabilities) |
Asset Allocation as of October 31, 2013 |
| % of fund's
net assets | % of fund's net assets
6 months ago |
Stocks and Equity Futures | 97.2 | 96.6 |
Short-Term Investments and Net Other Assets (Liabilities) | 2.8 | 3.4 |
Top Ten Stocks as of October 31, 2013 |
| % of fund's
net assets | % of fund's net assets
6 months ago |
Roche Holding AG (participation certificate) (Switzerland, Pharmaceuticals) | 2.0 | 1.0 |
Australia & New Zealand Banking Group Ltd. (Australia, Commercial Banks) | 1.8 | 1.6 |
Bayer AG (Germany, Pharmaceuticals) | 1.6 | 0.8 |
Toyota Motor Corp. (Japan, Automobiles) | 1.6 | 0.7 |
Total SA (France, Oil, Gas & Consumable Fuels) | 1.5 | 0.0 |
Volkswagen AG (Germany, Automobiles) | 1.5 | 0.7 |
UBS AG (Switzerland, Capital Markets) | 1.4 | 1.1 |
ORIX Corp. (Japan, Diversified Financial Services) | 1.4 | 1.1 |
SoftBank Corp. (Japan, Wireless Telecommunication Services) | 1.4 | 0.6 |
Banco Bilbao Vizcaya Argentaria SA (Spain, Commercial Banks) | 1.3 | 0.7 |
| 15.5 | |
Market Sectors as of October 31, 2013 |
| % of fund's
net assets | % of fund's net assets
6 months ago |
Financials | 24.8 | 24.3 |
Consumer Discretionary | 16.4 | 16.5 |
Industrials | 13.0 | 12.1 |
Consumer Staples | 10.1 | 11.3 |
Health Care | 9.5 | 8.9 |
Information Technology | 7.7 | 7.5 |
Materials | 5.2 | 5.7 |
Telecommunication Services | 5.1 | 4.1 |
Energy | 3.8 | 3.0 |
Utilities | 0.6 | 1.1 |
Annual Report
Investments October 31, 2013
Showing Percentage of Net Assets
Common Stocks - 94.7% |
| Shares | | Value (000s) |
Australia - 3.2% |
Ansell Ltd. | 2,268,950 | | $ 41,796 |
Australia & New Zealand Banking Group Ltd. | 6,493,040 | | 207,673 |
Ramsay Health Care Ltd. | 1,619,364 | | 59,385 |
Woodside Petroleum Ltd. | 1,461,485 | | 53,623 |
TOTAL AUSTRALIA | | 362,477 |
Austria - 0.2% |
Andritz AG | 455,300 | | 28,047 |
Bailiwick of Jersey - 2.6% |
Experian PLC | 6,115,400 | | 124,529 |
Wolseley PLC | 1,508,304 | | 81,283 |
WPP PLC | 3,996,700 | | 84,910 |
TOTAL BAILIWICK OF JERSEY | | 290,722 |
Belgium - 2.1% |
Anheuser-Busch InBev SA NV | 1,183,927 | | 122,730 |
KBC Groupe SA | 2,102,810 | | 114,632 |
TOTAL BELGIUM | | 237,362 |
Bermuda - 0.3% |
Cheung Kong Infrastructure Holdings Ltd. | 5,048,000 | | 35,127 |
Brazil - 0.1% |
Arezzo Industria e Comercio SA | 1,051,500 | | 15,724 |
British Virgin Islands - 0.4% |
Mail.Ru Group Ltd. GDR (Reg. S) | 1,193,800 | | 44,027 |
Canada - 1.0% |
Constellation Software, Inc. | 159,200 | | 29,002 |
InterOil Corp. (a)(d) | 204,400 | | 14,196 |
Suncor Energy, Inc. | 2,012,600 | | 73,138 |
TOTAL CANADA | | 116,336 |
Cayman Islands - 1.2% |
Baidu.com, Inc. sponsored ADR (a) | 123,100 | | 19,807 |
Cimc Enric Holdings Ltd. | 16,316,000 | | 22,981 |
ENN Energy Holdings Ltd. | 5,084,000 | | 30,132 |
Eurasia Drilling Co. Ltd. GDR (Reg. S) | 630,200 | | 26,689 |
Greatview Aseptic Pack Co. Ltd. | 26,392,000 | | 16,612 |
Sands China Ltd. | 1,460,800 | | 10,382 |
Youku Tudou, Inc. ADR (a)(d) | 300,200 | | 8,177 |
TOTAL CAYMAN ISLANDS | | 134,780 |
Common Stocks - continued |
| Shares | | Value (000s) |
Cyprus - 0.0% |
SPDI Secure Property Development & Investment PLC (a) | 529,830 | | $ 597 |
Denmark - 0.6% |
Novo Nordisk A/S Series B | 396,489 | | 66,036 |
Finland - 0.7% |
Sampo Oyj (A Shares) | 1,739,800 | | 82,418 |
France - 10.9% |
Arkema SA | 487,670 | | 55,368 |
Atos Origin SA | 388,851 | | 33,198 |
AXA SA | 5,364,600 | | 134,022 |
BNP Paribas SA | 1,544,345 | | 114,361 |
Bureau Veritas SA | 1,413,000 | | 42,667 |
Danone SA | 905,500 | | 67,152 |
Edenred SA | 1,177,900 | | 40,022 |
Havas SA | 5,201,268 | | 43,333 |
Iliad SA | 213,972 | | 48,924 |
Kering SA | 373,000 | | 84,753 |
Lafarge SA (Bearer) (d) | 605,900 | | 41,939 |
LVMH Moet Hennessy - Louis Vuitton SA | 612,502 | | 117,924 |
Sanofi SA | 890,979 | | 94,999 |
Schneider Electric SA | 1,383,800 | | 116,583 |
Technip SA | 192,300 | | 20,144 |
Total SA | 2,831,600 | | 173,727 |
TOTAL FRANCE | | 1,229,116 |
Germany - 7.2% |
Aareal Bank AG (a) | 1,044,895 | | 40,185 |
adidas AG | 541,900 | | 61,863 |
BASF AG | 1,265,455 | | 131,663 |
Bayer AG | 1,471,500 | | 182,890 |
Brenntag AG | 444,700 | | 75,353 |
GEA Group AG | 1,254,770 | | 54,602 |
GSW Immobilien AG | 430,481 | | 20,019 |
HeidelbergCement Finance AG | 860,300 | | 67,818 |
KION Group AG (a) | 577,867 | | 23,538 |
LEG Immobilien AG | 184,948 | | 10,547 |
Siemens AG | 1,110,885 | | 141,963 |
TOTAL GERMANY | | 810,441 |
Common Stocks - continued |
| Shares | | Value (000s) |
Hong Kong - 1.8% |
AIA Group Ltd. | 20,789,200 | | $ 105,515 |
Techtronic Industries Co. Ltd. | 39,683,000 | | 99,809 |
TOTAL HONG KONG | | 205,324 |
India - 0.6% |
Housing Development Finance Corp. Ltd. | 3,139,461 | | 43,561 |
United Spirits Ltd. | 444,545 | | 18,569 |
TOTAL INDIA | | 62,130 |
Indonesia - 0.1% |
PT Tower Bersama Infrastructure Tbk | 17,734,500 | | 8,967 |
Ireland - 2.0% |
Actavis PLC (a) | 308,100 | | 47,626 |
Bank of Ireland (a) | 146,718,100 | | 53,399 |
James Hardie Industries PLC CDI | 6,070,470 | | 62,711 |
Kerry Group PLC Class A | 945,600 | | 60,555 |
TOTAL IRELAND | | 224,291 |
Italy - 1.0% |
De Longhi SpA | 2,248,100 | | 34,797 |
Moleskine SpA | 4,183,000 | | 10,223 |
Tod's SpA | 117,793 | | 19,624 |
UniCredit SpA | 3,689,800 | | 27,754 |
World Duty Free SpA (a) | 2,253,904 | | 24,972 |
TOTAL ITALY | | 117,370 |
Japan - 17.2% |
ABC-MART, Inc. | 826,300 | | 41,324 |
Aozora Bank Ltd. | 16,056,000 | | 46,675 |
ARNEST ONE Corp. (d) | 306,200 | | 8,395 |
Astellas Pharma, Inc. | 768,700 | | 42,852 |
Cosmos Pharmaceutical Corp. | 245,800 | | 29,946 |
Daikin Industries Ltd. | 1,089,400 | | 62,677 |
Don Quijote Co. Ltd. | 1,818,400 | | 121,044 |
Hajime Construction Co. Ltd. | 34,900 | | 2,406 |
Hitachi Ltd. | 5,121,000 | | 35,822 |
Japan Exchange Group, Inc. | 2,589,500 | | 60,201 |
Japan Tobacco, Inc. | 3,948,700 | | 142,879 |
Kakaku.com, Inc. | 1,903,000 | | 36,807 |
KDDI Corp. | 2,082,700 | | 112,792 |
Keyence Corp. | 304,060 | | 130,317 |
Leopalace21 Corp. (a) | 6,899,700 | | 47,901 |
Common Stocks - continued |
| Shares | | Value (000s) |
Japan - continued |
Miraca Holdings, Inc. | 196,700 | | $ 8,863 |
Mitsubishi UFJ Financial Group, Inc. | 18,169,200 | | 115,706 |
Nomura Real Estate Holdings, Inc. | 563,300 | | 14,252 |
Omron Corp. | 1,225,300 | | 46,759 |
ORIX Corp. | 9,072,900 | | 157,152 |
Park24 Co. Ltd. | 1,342,800 | | 26,218 |
Rakuten, Inc. | 5,237,700 | | 68,245 |
Santen Pharmaceutical Co. Ltd. | 1,166,900 | | 59,239 |
Seven & i Holdings Co., Ltd. | 2,167,000 | | 80,198 |
Shinsei Bank Ltd. | 24,904,000 | | 58,308 |
Ship Healthcare Holdings, Inc. | 1,076,700 | | 44,182 |
SoftBank Corp. | 2,099,300 | | 156,773 |
Toyota Motor Corp. | 2,789,300 | | 180,853 |
USS Co. Ltd. | 450,400 | | 6,596 |
TOTAL JAPAN | | 1,945,382 |
Korea (South) - 0.9% |
Hyundai Motor Co. | 206,848 | | 49,311 |
NHN Corp. | 69,296 | | 38,981 |
Orion Corp. | 14,973 | | 14,602 |
TOTAL KOREA (SOUTH) | | 102,894 |
Luxembourg - 0.3% |
Brait SA | 6,048,833 | | 29,465 |
Mexico - 0.2% |
Alsea S.A.B. de CV | 7,662,195 | | 23,831 |
Netherlands - 3.3% |
AEGON NV | 5,028,800 | | 40,014 |
ASML Holding NV | 772,233 | | 73,084 |
European Aeronautic Defence and Space Co. (EADS) NV | 176,700 | | 12,142 |
Koninklijke Ahold NV | 2,412,842 | | 45,930 |
Koninklijke Philips Electronics NV | 2,496,700 | | 88,235 |
Randstad Holding NV | 717,740 | | 44,296 |
Royal DSM NV | 536,200 | | 40,617 |
Yandex NV (a) | 861,400 | | 31,751 |
TOTAL NETHERLANDS | | 376,069 |
New Zealand - 0.4% |
Ryman Healthcare Group Ltd. | 7,311,565 | | 45,597 |
Norway - 1.0% |
DNB ASA | 6,068,755 | | 107,551 |
Common Stocks - continued |
| Shares | | Value (000s) |
Philippines - 0.1% |
Alliance Global Group, Inc. | 26,741,800 | | $ 16,306 |
Russia - 0.5% |
Mobile TeleSystems OJSC sponsored ADR | 2,313,400 | | 52,746 |
Singapore - 0.4% |
Global Logistic Properties Ltd. | 16,214,205 | | 40,333 |
South Africa - 1.1% |
Naspers Ltd. Class N | 1,302,700 | | 121,851 |
Spain - 3.6% |
Amadeus IT Holding SA Class A | 1,319,900 | | 49,014 |
Antena 3 de Television SA | 1,515,400 | | 25,411 |
Banco Bilbao Vizcaya Argentaria SA | 12,546,524 | | 146,630 |
Criteria CaixaCorp SA | 4,210,900 | | 21,892 |
Distribuidora Internacional de Alimentacion SA | 5,726,396 | | 52,349 |
Grifols SA ADR | 1,208,550 | | 36,450 |
Inditex SA (d) | 481,679 | | 79,134 |
TOTAL SPAIN | | 410,880 |
Sweden - 4.1% |
ASSA ABLOY AB (B Shares) | 1,783,400 | | 88,536 |
Intrum Justitia AB | 1,835,800 | | 48,869 |
Investment AB Kinnevik (B Shares) | 2,363,300 | | 87,091 |
Nordea Bank AB | 6,100,600 | | 78,140 |
Svenska Cellulosa AB (SCA) (B Shares) | 3,591,900 | | 101,991 |
Svenska Handelsbanken AB (A Shares) | 1,258,200 | | 57,007 |
TOTAL SWEDEN | | 461,634 |
Switzerland - 6.4% |
Credit Suisse Group | 1,039,246 | | 32,329 |
Lonza Group AG | 476,868 | | 42,623 |
Partners Group Holding AG | 230,056 | | 59,609 |
Roche Holding AG (participation certificate) | 821,773 | | 227,506 |
Schindler Holding AG (participation certificate) | 260,065 | | 36,888 |
SGS SA (Reg.) | 7,770 | | 18,206 |
Swatch Group AG (Bearer) | 36,702 | | 23,481 |
Syngenta AG (Switzerland) | 179,374 | | 72,398 |
UBS AG | 8,311,378 | | 160,751 |
Zurich Insurance Group AG | 180,481 | | 49,907 |
TOTAL SWITZERLAND | | 723,698 |
Common Stocks - continued |
| Shares | | Value (000s) |
Taiwan - 0.6% |
ECLAT Textile Co. Ltd. | 2,457,180 | | $ 27,005 |
Taiwan Semiconductor Manufacturing Co. Ltd. | 11,289,000 | | 41,528 |
TOTAL TAIWAN | | 68,533 |
United Kingdom - 15.9% |
Aberdeen Asset Management PLC | 5,975,132 | | 42,432 |
Alabama Noor Hospitals Group PLC (a) | 1,829,400 | | 24,933 |
Associated British Foods PLC | 1,571,500 | | 57,123 |
Barclays PLC | 22,636,113 | | 95,241 |
BG Group PLC | 3,923,700 | | 80,119 |
BHP Billiton PLC | 2,080,582 | | 64,204 |
British American Tobacco PLC (United Kingdom) | 881,200 | | 48,618 |
Croda International PLC | 630,000 | | 24,607 |
Diageo PLC | 4,394,219 | | 140,077 |
Foxtons Group PLC | 2,178,500 | | 11,134 |
Hikma Pharmaceuticals PLC | 3,197,720 | | 61,578 |
HSBC Holdings PLC (United Kingdom) | 12,266,193 | | 134,454 |
Intertek Group PLC | 893,600 | | 47,741 |
ITV PLC | 11,642,037 | | 35,635 |
Jazztel PLC (a) | 4,681,964 | | 51,364 |
Legal & General Group PLC | 26,720,558 | | 92,671 |
Liberty Global PLC Class A (a) | 610,800 | | 47,868 |
London Stock Exchange Group PLC | 1,729,000 | | 45,521 |
Meggitt PLC | 6,842,366 | | 62,809 |
Next PLC | 781,744 | | 68,250 |
Ocado Group PLC (a) | 8,103,297 | | 56,389 |
Persimmon PLC | 2,082,200 | | 42,233 |
Reckitt Benckiser Group PLC | 788,600 | | 61,300 |
Rolls-Royce Group PLC | 4,197,715 | | 77,402 |
Rotork PLC | 717,800 | | 32,951 |
Royal Mail PLC | 788,800 | | 7,083 |
SABMiller PLC | 1,478,600 | | 77,145 |
Taylor Wimpey PLC | 18,277,100 | | 32,295 |
The Restaurant Group PLC | 1,992,100 | | 18,398 |
Ultra Electronics Holdings PLC | 614,667 | | 19,061 |
Vodafone Group PLC | 36,632,743 | | 134,177 |
TOTAL UNITED KINGDOM | | 1,794,813 |
United States of America - 2.7% |
Beam, Inc. | 387,400 | | 26,072 |
Google, Inc. Class A (a) | 60,100 | | 61,938 |
Illumina, Inc. (a) | 12,500 | | 1,169 |
Common Stocks - continued |
| Shares | | Value (000s) |
United States of America - continued |
MasterCard, Inc. Class A | 160,100 | | $ 114,808 |
McGraw-Hill Companies, Inc. | 488,400 | | 34,032 |
Sohu.com, Inc. (a) | 313,700 | | 21,005 |
Visa, Inc. Class A | 260,000 | | 51,134 |
TOTAL UNITED STATES OF AMERICA | | 310,158 |
TOTAL COMMON STOCKS (Cost $8,462,801) |
10,703,033
|
Nonconvertible Preferred Stocks - 1.5% |
| | | |
Germany - 1.5% |
Volkswagen AG | 650,200 | | 165,262 |
United Kingdom - 0.0% |
Rolls-Royce Group PLC Series C | 361,003,490 | | 579 |
TOTAL NONCONVERTIBLE PREFERRED STOCKS (Cost $133,620) |
165,841
|
Government Obligations - 0.1% |
| Principal Amount (000s) | | |
United States of America - 0.1% |
U.S. Treasury Bills, yield at date of purchase 0.02% to 0.04% 1/2/14 (e)
(Cost $6,960) | | $ 6,960 | |
6,960
|
Money Market Funds - 4.0% |
| Shares | | |
Fidelity Cash Central Fund, 0.09% (b) | 431,996,301 | | 431,996 |
Fidelity Securities Lending Cash Central Fund, 0.09% (b)(c) | 22,072,034 | | 22,072 |
TOTAL MONEY MARKET FUNDS (Cost $454,068) |
454,068
|
TOTAL INVESTMENT PORTFOLIO - 100.3% (Cost $9,057,449) | | 11,329,902 |
NET OTHER ASSETS (LIABILITIES) - (0.3)% | | (35,016) |
NET ASSETS - 100% | $ 11,294,886 |
Futures Contracts |
| Expiration Date | | Underlying Face Amount at Value (000s) | | Unrealized Appreciation/
(Depreciation) (000s) |
Purchased |
Equity Index Contracts |
1,572 Nikkei 225 Index Contracts (Japan) | Dec. 2013 | | $ 113,695 | | $ 4,238 |
|
The face value of futures purchased as a percentage of net assets is 1% |
Legend |
(a) Non-income producing |
(b) Affiliated fund that is generally available only to investment companies and other accounts managed by Fidelity Investments. The rate quoted is the annualized seven-day yield of the fund at period end. A complete unaudited listing of the fund's holdings as of its most recent quarter end is available upon request. In addition, each Fidelity Central Fund's financial statements, which are not covered by the Fund's Report of Independent Registered Public Accounting Firm, are available on the SEC's website or upon request. |
(c) Investment made with cash collateral received from securities on loan. |
(d) Security or a portion of the security is on loan at period end. |
(e) Security or a portion of the security was pledged to cover margin requirements for futures contracts. At period end, the value of securities pledged amounted to $6,960,000. |
Affiliated Central Funds |
Information regarding fiscal year to date income earned by the Fund from investments in Fidelity Central Funds is as follows: |
Fund | Income earned
(Amounts in thousands) |
Fidelity Cash Central Fund | $ 420 |
Fidelity Securities Lending Cash Central Fund | 5,441 |
Total | $ 5,861 |
Other Affiliated Issuers |
An affiliated company is a company in which the Fund has ownership of at least 5% of the voting securities. Fiscal year to date transactions with companies which are or were affiliates are as follows: |
Affiliate
(Amounts in thousands) | Value, beginning of period | Purchases | Sales Proceeds | Dividend Income | Value,
end of
period |
Boyner Buyuk Magazacilik A/S | $ 10,764 | $ - | $ 16,020 | $ - | $ - |
Other Information |
Categorizations in the Schedule of Investments are based on country or territory of incorporation. |
The following is a summary of the inputs used, as of October 31, 2013, involving the Fund's assets and liabilities carried at fair value. The inputs or methodology used for valuing securities may not be an indication of the risk associated with investing in those securities. For more information on valuation inputs, and their aggregation into the levels used in the table below, please refer to the Investment Valuation section in the accompanying Notes to Financial Statements. |
Valuation Inputs at Reporting Date: |
Description
(Amounts in thousands) | Total | Level 1 | Level 2 | Level 3 |
Investments in Securities: | | | | |
Equities: | | | | |
Consumer Discretionary | $ 1,843,308 | $ 1,414,445 | $ 418,062 | $ 10,801 |
Consumer Staples | 1,147,236 | 582,788 | 564,448 | - |
Energy | 441,636 | 267,909 | 173,727 | - |
Financials | 2,821,082 | 1,658,069 | 1,163,013 | - |
Health Care | 1,087,724 | 771,553 | 316,171 | - |
Industrials | 1,451,790 | 1,132,697 | 319,093 | - |
Information Technology | 867,159 | 575,926 | 291,233 | - |
Materials | 577,937 | 441,335 | 136,602 | - |
Telecommunication Services | 565,743 | 162,001 | 403,742 | - |
Utilities | 65,259 | 65,259 | - | - |
Government Obligations | 6,960 | - | 6,960 | - |
Money Market Funds | 454,068 | 454,068 | - | - |
Total Investments in Securities: | $ 11,329,902 | $ 7,526,050 | $ 3,793,051 | $ 10,801 |
Derivative Instruments: | | | | |
Assets | | | | |
Futures Contracts | $ 4,238 | $ 4,238 | $ - | $ - |
The following is a summary of transfers between Level 1 and Level 2 for the period ended October 31, 2013. Transfers are assumed to have occurred at the beginning of the period, and are primarily attributable to the valuation techniques used for foreign equity securities, as discussed in the accompanying Notes to Financial Statements: |
Transfers | Total (000s) |
Level 1 to Level 2 | $ 712,449 |
Level 2 to Level 1 | $ 0 |
Value of Derivative Instruments |
The following table is a summary of the Fund's value of derivative instruments by primary risk exposure as of October 31, 2013. For additional information on derivative instruments, please refer to the Derivative Instruments section in the accompanying Notes to Financial Statements. |
Primary Risk Exposure /
Derivative Type | Value |
| Asset | Liability |
Equity Risk | | |
Futures Contracts (a) | $ 4,238 | $ - |
(a) Reflects gross cumulative appreciation (depreciation) on futures contracts as presented in the Schedule of Investments. Only the period end receivable or payable for daily variation margin and net unrealized appreciation (depreciation) are presented in the Statement of Assets and Liabilities. |
See accompanying notes which are an integral part of the financial statements.
Annual Report
Statement of Assets and Liabilities
Amounts in thousands (except per-share amounts) | October 31, 2013 |
| | |
Assets | | |
Investment in securities, at value (including securities loaned of $21,646) - See accompanying schedule: Unaffiliated issuers (cost $8,603,381) | $ 10,875,834 | |
Fidelity Central Funds (cost $454,068) | 454,068 | |
Total Investments (cost $9,057,449) | | $ 11,329,902 |
Foreign currency held at value (cost $934) | | 924 |
Receivable for investments sold | | 8,555 |
Receivable for fund shares sold | | 7,336 |
Dividends receivable | | 20,216 |
Distributions receivable from Fidelity Central Funds | | 122 |
Prepaid expenses | | 35 |
Other receivables | | 4,081 |
Total assets | | 11,371,171 |
| | |
Liabilities | | |
Payable for investments purchased | $ 38,436 | |
Payable for fund shares redeemed | 5,719 | |
Accrued management fee | 6,631 | |
Distribution and service plan fees payable | 128 | |
Payable for daily variation margin for derivative instruments | 983 | |
Other affiliated payables | 1,581 | |
Other payables and accrued expenses | 735 | |
Collateral on securities loaned, at value | 22,072 | |
Total liabilities | | 76,285 |
| | |
Net Assets | | $ 11,294,886 |
Net Assets consist of: | | |
Paid in capital | | $ 9,866,929 |
Undistributed net investment income | | 131,430 |
Accumulated undistributed net realized gain (loss) on investments and foreign currency transactions | | (979,010) |
Net unrealized appreciation (depreciation) on investments and assets and liabilities in foreign currencies | | 2,275,537 |
Net Assets | | $ 11,294,886 |
See accompanying notes which are an integral part of the financial statements.
Annual Report
Statement of Assets and Liabilities - continued
Amounts in thousands (except per-share amounts) | October 31, 2013 |
| | |
Calculation of Maximum Offering Price Class A:
Net Asset Value and redemption price per share ($346,717.68 ÷ 8,780.120 shares) | | $ 39.49 |
| | |
Maximum offering price per share (100/94.25 of $39.49) | | $ 41.90 |
Class T:
Net Asset Value and redemption price per share ($53,183.51 ÷ 1,355.789 shares) | | $ 39.23 |
| | |
Maximum offering price per share (100/96.50 of $39.23) | | $ 40.65 |
Class B:
Net Asset Value and offering price per share ($6,686.96 ÷ 171.088 shares)A | | $ 39.08 |
| | |
Class C:
Net Asset Value and offering price per share ($36,470.54 ÷ 933.457 shares)A | | $ 39.07 |
| | |
International Discovery:
Net Asset Value, offering price and redemption price per share ($7,799,575.78 ÷ 195,853.386 shares) | | $ 39.82 |
| | |
Class K:
Net Asset Value, offering price and redemption price per share ($2,576,018.46 ÷ 64,786.777 shares) | | $ 39.76 |
| | |
Institutional Class:
Net Asset Value, offering price and redemption price per share ($476,126.48 ÷ 11,975.218 shares) | | $ 39.76 |
| | |
Class Z:
Net Asset Value, offering price and redemption price per share ($106.86 ÷ 2.687 shares) | | $ 39.77 |
A Redemption price per share is equal to net asset value less any applicable contingent deferred sales charge.
See accompanying notes which are an integral part of the financial statements.
Annual Report
Financial Statements - continued
Statement of Operations
Amounts in thousands | Year ended October 31, 2013 |
| | |
Investment Income | | |
Dividends | | $ 233,738 |
Interest | | 3 |
Income from Fidelity Central Funds | | 5,861 |
Income before foreign taxes withheld | | 239,602 |
Less foreign taxes withheld | | (17,198) |
Total income | | 222,404 |
| | |
Expenses | | |
Management fee
Basic fee | $ 67,899 | |
Performance adjustment | 6,089 | |
Transfer agent fees | 16,474 | |
Distribution and service plan fees | 1,432 | |
Accounting and security lending fees | 1,778 | |
Custodian fees and expenses | 1,352 | |
Independent trustees' compensation | 54 | |
Registration fees | 215 | |
Audit | 119 | |
Legal | 24 | |
Miscellaneous | 76 | |
Total expenses before reductions | 95,512 | |
Expense reductions | (2,311) | 93,201 |
Net investment income (loss) | | 129,203 |
Realized and Unrealized Gain (Loss) Net realized gain (loss) on: | | |
Investment securities: | | |
Unaffiliated issuers | 671,713 | |
Other affiliated issuers | 4,258 | |
Foreign currency transactions | (1,963) | |
Futures contracts | 51,368 | |
Total net realized gain (loss) | | 725,376 |
Change in net unrealized appreciation (depreciation) on: Investment securities | 1,459,188 | |
Assets and liabilities in foreign currencies | (54) | |
Futures contracts | 4,238 | |
Total change in net unrealized appreciation (depreciation) | | 1,463,372 |
Net gain (loss) | | 2,188,748 |
Net increase (decrease) in net assets resulting from operations | | $ 2,317,951 |
See accompanying notes which are an integral part of the financial statements.
Annual Report
Statement of Changes in Net Assets
Amounts in thousands | Year ended
October 31,
2013 | Year ended
October 31,
2012 |
Increase (Decrease) in Net Assets | | |
Operations | | |
Net investment income (loss) | $ 129,203 | $ 143,212 |
Net realized gain (loss) | 725,376 | (207,579) |
Change in net unrealized appreciation (depreciation) | 1,463,372 | 762,141 |
Net increase (decrease) in net assets resulting
from operations | 2,317,951 | 697,774 |
Distributions to shareholders from net investment income | (146,031) | (118,968) |
Distributions to shareholders from net realized gain | (8,413) | - |
Total distributions | (154,444) | (118,968) |
Share transactions - net increase (decrease) | 714,712 | (915,362) |
Redemption fees | 128 | 128 |
Total increase (decrease) in net assets | 2,878,347 | (336,428) |
| | |
Net Assets | | |
Beginning of period | 8,416,539 | 8,752,967 |
End of period (including undistributed net investment income of $131,430 and undistributed net investment income of $126,507, respectively) | $ 11,294,886 | $ 8,416,539 |
See accompanying notes which are an integral part of the financial statements.
Annual Report
Financial Highlights - Class A
Years ended October 31, | 2013 | 2012 | 2011 | 2010 | 2009 |
Selected Per-Share Data | | | | | |
Net asset value, beginning of period | $ 31.66 | $ 29.43 | $ 32.07 | $ 28.57 | $ 23.68 |
Income from Investment Operations | | | | | |
Net investment income (loss) C | .34 | .41 | .42 | .31 | .31 |
Net realized and unrealized gain (loss) | 7.97 | 2.11 | (2.52) | 3.51 | 4.84 |
Total from investment operations | 8.31 | 2.52 | (2.10) | 3.82 | 5.15 |
Distributions from net investment income | (.45) | (.29) | (.38) | (.28) | (.26) |
Distributions from net realized gain | (.03) | - | (.16) | (.04) | - |
Total distributions | (.48) | (.29) | (.54) | (.32) | (.26) |
Redemption fees added to paid in capital C,G | - | - | - | - | - |
Net asset value, end of period | $ 39.49 | $ 31.66 | $ 29.43 | $ 32.07 | $ 28.57 |
Total Return A,B | 26.59% | 8.70% | (6.71)% | 13.43% | 22.14% |
Ratios to Average Net Assets D,F | | | | |
Expenses before reductions | 1.35% | 1.34% | 1.30% | 1.33% | 1.37% |
Expenses net of fee waivers, if any | 1.35% | 1.34% | 1.29% | 1.33% | 1.37% |
Expenses net of all reductions | 1.33% | 1.31% | 1.25% | 1.28% | 1.32% |
Net investment income (loss) | .97% | 1.41% | 1.31% | 1.06% | 1.28% |
Supplemental Data | | | | | |
Net assets, end of period (in millions) | $ 347 | $ 299 | $ 320 | $ 392 | $ 414 |
Portfolio turnover rate E | 65% | 68% | 75% | 82% | 98% |
A Total returns would have been lower if certain expenses had not been reduced during the applicable periods shown.
B Total returns do not include the effect of the sales charges.
C Calculated based on average shares outstanding during the period.
D Fees and expenses of any underlying Fidelity Central Funds are not included in the Fund's expense ratio. The Fund indirectly bears its proportionate share of the expenses of any underlying Fidelity Central Funds.
E Amount does not include the portfolio activity of any underlying Fidelity Central Funds.
F Expense ratios reflect operating expenses of the class. Expenses before reductions do not reflect amounts reimbursed by the investment adviser or reductions from brokerage service arrangements or reductions from other expense offset arrangements and do not represent the amount paid by the class during periods when reimbursements or reductions occur. Expenses net of fee waivers reflect expenses after reimbursement by the investment adviser but prior to reductions from brokerage service arrangements or other expense offset arrangements. Expenses net of all reductions represent the net expenses paid by the class.
G Amount represents less than $.01 per share.
See accompanying notes which are an integral part of the financial statements.
Annual Report
Financial Highlights - Class T
Years ended October 31, | 2013 | 2012 | 2011 | 2010 | 2009 |
Selected Per-Share Data | | | | | |
Net asset value, beginning of period | $ 31.42 | $ 29.18 | $ 31.81 | $ 28.35 | $ 23.49 |
Income from Investment Operations | | | | | |
Net investment income (loss) C | .26 | .34 | .34 | .23 | .24 |
Net realized and unrealized gain (loss) | 7.92 | 2.09 | (2.51) | 3.48 | 4.81 |
Total from investment operations | 8.18 | 2.43 | (2.17) | 3.71 | 5.05 |
Distributions from net investment income | (.34) | (.19) | (.30) | (.21) | (.19) |
Distributions from net realized gain | (.03) | - | (.16) | (.04) | - |
Total distributions | (.37) | (.19) | (.46) | (.25) | (.19) |
Redemption fees added to paid in capital C,G | - | - | - | - | - |
Net asset value, end of period | $ 39.23 | $ 31.42 | $ 29.18 | $ 31.81 | $ 28.35 |
Total Return A,B | 26.31% | 8.41% | (6.96)% | 13.14% | 21.79% |
Ratios to Average Net Assets D,F | | | | |
Expenses before reductions | 1.59% | 1.59% | 1.56% | 1.60% | 1.65% |
Expenses net of fee waivers, if any | 1.59% | 1.59% | 1.55% | 1.60% | 1.65% |
Expenses net of all reductions | 1.57% | 1.56% | 1.51% | 1.56% | 1.60% |
Net investment income (loss) | .73% | 1.16% | 1.05% | .79% | 1.00% |
Supplemental Data | | | | | |
Net assets, end of period (in millions) | $ 53 | $ 46 | $ 61 | $ 92 | $ 83 |
Portfolio turnover rate E | 65% | 68% | 75% | 82% | 98% |
A Total returns would have been lower if certain expenses had not been reduced during the applicable periods shown.
B Total returns do not include the effect of the sales charges.
C Calculated based on average shares outstanding during the period.
D Fees and expenses of any underlying Fidelity Central Funds are not included in the Fund's expense ratio. The Fund indirectly bears its proportionate share of the expenses of any underlying Fidelity Central Funds.
E Amount does not include the portfolio activity of any underlying Fidelity Central Funds.
F Expense ratios reflect operating expenses of the class. Expenses before reductions do not reflect amounts reimbursed by the investment adviser or reductions from brokerage service arrangements or reductions from other expense offset arrangements and do not represent the amount paid by the class during periods when reimbursements or reductions occur. Expenses net of fee waivers reflect expenses after reimbursement by the investment adviser but prior to reductions from brokerage service arrangements or other expense offset arrangements. Expenses net of all reductions represent the net expenses paid by the class.
G Amount represents less than $.01 per share.
See accompanying notes which are an integral part of the financial statements.
Annual Report
Financial Highlights - Class B
Years ended October 31, | 2013 | 2012 | 2011 | 2010 | 2009 |
Selected Per-Share Data | | | | | |
Net asset value, beginning of period | $ 31.28 | $ 29.02 | $ 31.60 | $ 28.18 | $ 23.25 |
Income from Investment Operations | | | | | |
Net investment income (loss) C | .08 | .19 | .17 | .08 | .12 |
Net realized and unrealized gain (loss) | 7.90 | 2.09 | (2.48) | 3.44 | 4.81 |
Total from investment operations | 7.98 | 2.28 | (2.31) | 3.52 | 4.93 |
Distributions from net investment income | (.15) | (.02) | (.12) | (.06) | - |
Distributions from net realized gain | (.03) | - | (.16) | (.04) | - |
Total distributions | (.18) | (.02) | (.27) H | (.10) | - |
Redemption fees added to paid in capital C,G | - | - | - | - | - |
Net asset value, end of period | $ 39.08 | $ 31.28 | $ 29.02 | $ 31.60 | $ 28.18 |
Total Return A,B | 25.64% | 7.85% | (7.39)% | 12.52% | 21.20% |
Ratios to Average Net Assets D,F | | | | |
Expenses before reductions | 2.10% | 2.09% | 2.06% | 2.12% | 2.16% |
Expenses net of fee waivers, if any | 2.10% | 2.09% | 2.06% | 2.12% | 2.16% |
Expenses net of all reductions | 2.08% | 2.06% | 2.02% | 2.08% | 2.11% |
Net investment income (loss) | .22% | .66% | .54% | .27% | .49% |
Supplemental Data | | | | | |
Net assets, end of period (in millions) | $ 7 | $ 8 | $ 10 | $ 14 | $ 16 |
Portfolio turnover rate E | 65% | 68% | 75% | 82% | 98% |
A Total returns would have been lower if certain expenses had not been reduced during the applicable periods shown.
B Total returns do not include the effect of the contingent deferred sales charge.
C Calculated based on average shares outstanding during the period.
D Fees and expenses of any underlying Fidelity Central Funds are not included in the Fund's expense ratio. The Fund indirectly bears its proportionate share of the expenses of any underlying Fidelity Central Funds.
E Amount does not include the portfolio activity of any underlying Fidelity Central Funds.
F Expense ratios reflect operating expenses of the class. Expenses before reductions do not reflect amounts reimbursed by the investment adviser or reductions from brokerage service arrangements or reductions from other expense offset arrangements and do not represent the amount paid by the class during periods when reimbursements or reductions occur. Expenses net of fee waivers reflect expenses after reimbursement by the investment adviser but prior to reductions from brokerage service arrangements or other expense offset arrangements. Expenses net of all reductions represent the net expenses paid by the class.
G Amount represents less than $.01 per share.
H Total distributions of $.27 per share is comprised of distributions from net investment income of $.115 and distributions from net realized gain of $.155 per share.
See accompanying notes which are an integral part of the financial statements.
Annual Report
Financial Highlights - Class C
Years ended October 31, | 2013 | 2012 | 2011 | 2010 | 2009 |
Selected Per-Share Data | | | | | |
Net asset value, beginning of period | $ 31.32 | $ 29.08 | $ 31.68 | $ 28.23 | $ 23.31 |
Income from Investment Operations | | | | | |
Net investment income (loss) C | .08 | .19 | .18 | .09 | .12 |
Net realized and unrealized gain (loss) | 7.90 | 2.09 | (2.49) | 3.45 | 4.82 |
Total from investment operations | 7.98 | 2.28 | (2.31) | 3.54 | 4.94 |
Distributions from net investment income | (.20) | (.04) | (.14) | (.05) | (.02) |
Distributions from net realized gain | (.03) | - | (.16) | (.04) | - |
Total distributions | (.23) | (.04) | (.29) H | (.09) | (.02) |
Redemption fees added to paid in capital C,G | - | - | - | - | - |
Net asset value, end of period | $ 39.07 | $ 31.32 | $ 29.08 | $ 31.68 | $ 28.23 |
Total Return A,B | 25.65% | 7.86% | (7.37)% | 12.54% | 21.22% |
Ratios to Average Net Assets D,F | | | | |
Expenses before reductions | 2.10% | 2.09% | 2.05% | 2.09% | 2.14% |
Expenses net of fee waivers, if any | 2.09% | 2.09% | 2.04% | 2.09% | 2.14% |
Expenses net of all reductions | 2.07% | 2.06% | 2.00% | 2.05% | 2.09% |
Net investment income (loss) | .23% | .66% | .56% | .30% | .51% |
Supplemental Data | | | | | |
Net assets, end of period (in millions) | $ 36 | $ 30 | $ 33 | $ 44 | $ 43 |
Portfolio turnover rate E | 65% | 68% | 75% | 82% | 98% |
A Total returns would have been lower if certain expenses had not been reduced during the applicable periods shown.
B Total returns do not include the effect of the contingent deferred sales charge.
C Calculated based on average shares outstanding during the period.
D Fees and expenses of any underlying Fidelity Central Funds are not included in the Fund's expense ratio. The Fund indirectly bears its proportionate share of the expenses of any underlying Fidelity Central Funds.
E Amount does not include the portfolio activity of any underlying Fidelity Central Funds.
F Expense ratios reflect operating expenses of the class. Expenses before reductions do not reflect amounts reimbursed by the investment adviser or reductions from brokerage service arrangements or reductions from other expense offset arrangements and do not represent the amount paid by the class during periods when reimbursements or reductions occur. Expenses net of fee waivers reflect expenses after reimbursement by the investment adviser but prior to reductions from brokerage service arrangements or other expense offset arrangements. Expenses net of all reductions represent the net expenses paid by the class.
G Amount represents less than $.01 per share.
H Total distributions of $.29 per share is comprised of distributions from net investment income of $.137 and distributions from net realized gain of $.155 per share.
See accompanying notes which are an integral part of the financial statements.
Annual Report
Financial Highlights - International Discovery
Years ended October 31, | 2013 | 2012 | 2011 | 2010 | 2009 |
Selected Per-Share Data | | | | | |
Net asset value, beginning of period | $ 31.91 | $ 29.69 | $ 32.34 | $ 28.79 | $ 23.88 |
Income from Investment Operations | | | | | |
Net investment income (loss) B | .47 | .51 | .53 | .40 | .37 |
Net realized and unrealized gain (loss) | 8.02 | 2.12 | (2.54) | 3.54 | 4.88 |
Total from investment operations | 8.49 | 2.63 | (2.01) | 3.94 | 5.25 |
Distributions from net investment income | (.55) | (.41) | (.48) | (.35) | (.34) |
Distributions from net realized gain | (.03) | - | (.16) | (.04) | - |
Total distributions | (.58) | (.41) | (.64) | (.39) | (.34) |
Redemption fees added to paid in capital B,F | - | - | - | - | - |
Net asset value, end of period | $ 39.82 | $ 31.91 | $ 29.69 | $ 32.34 | $ 28.79 |
Total Return A | 27.03% | 9.03% | (6.39)% | 13.76% | 22.47% |
Ratios to Average Net Assets C,E | | | | |
Expenses before reductions | 1.00% | 1.01% | .97% | 1.05% | 1.12% |
Expenses net of fee waivers, if any | 1.00% | 1.01% | .96% | 1.05% | 1.12% |
Expenses net of all reductions | .98% | .98% | .92% | 1.00% | 1.07% |
Net investment income (loss) | 1.32% | 1.73% | 1.64% | 1.35% | 1.53% |
Supplemental Data | | | | | |
Net assets, end of period (in millions) | $ 7,800 | $ 5,965 | $ 6,806 | $ 8,133 | $ 8,114 |
Portfolio turnover rate D | 65% | 68% | 75% | 82% | 98% |
A Total returns would have been lower if certain expenses had not been reduced during the applicable periods shown.
B Calculated based on average shares outstanding during the period.
C Fees and expenses of any underlying Fidelity Central Funds are not included in the Fund's expense ratio. The Fund indirectly bears its proportionate share of the expenses of any underlying Fidelity Central Funds.
D Amount does not include the portfolio activity of any underlying Fidelity Central Funds.
E Expense ratios reflect operating expenses of the class. Expenses before reductions do not reflect amounts reimbursed by the investment adviser or reductions from brokerage service arrangements or reductions from other expense offset arrangements and do not represent the amount paid by the class during periods when reimbursements or reductions occur. Expenses net of fee waivers reflect expenses after reimbursement by the investment adviser but prior to reductions from brokerage service arrangements or other expense offset arrangements. Expenses net of all reductions represent the net expenses paid by the class.
F Amount represents less than $.01 per share.
See accompanying notes which are an integral part of the financial statements.
Annual Report
Financial Highlights - Class K
Years ended October 31, | 2013 | 2012 | 2011 | 2010 | 2009 |
Selected Per-Share Data | | | | | |
Net asset value, beginning of period | $ 31.87 | $ 29.66 | $ 32.32 | $ 28.78 | $ 23.90 |
Income from Investment Operations | | | | | |
Net investment income (loss) B | .52 | .57 | .58 | .46 | .44 |
Net realized and unrealized gain (loss) | 8.01 | 2.11 | (2.54) | 3.53 | 4.86 |
Total from investment operations | 8.53 | 2.68 | (1.96) | 3.99 | 5.30 |
Distributions from net investment income | (.61) | (.47) | (.55) | (.41) | (.42) |
Distributions from net realized gain | (.03) | - | (.16) | (.04) | - |
Total distributions | (.64) | (.47) | (.70) G | (.45) | (.42) |
Redemption fees added to paid in capital B,F | - | - | - | - | - |
Net asset value, end of period | $ 39.76 | $ 31.87 | $ 29.66 | $ 32.32 | $ 28.78 |
Total Return A | 27.23% | 9.24% | (6.24)% | 13.96% | 22.80% |
Ratios to Average Net Assets C,E | | | | |
Expenses before reductions | .85% | .83% | .80% | .84% | .88% |
Expenses net of fee waivers, if any | .85% | .83% | .79% | .84% | .88% |
Expenses net of all reductions | .83% | .80% | .75% | .79% | .83% |
Net investment income (loss) | 1.47% | 1.91% | 1.81% | 1.55% | 1.77% |
Supplemental Data | | | | | |
Net assets, end of period (in millions) | $ 2,576 | $ 1,776 | $ 1,245 | $ 1,078 | $ 674 |
Portfolio turnover rate D | 65% | 68% | 75% | 82% | 98% |
A Total returns would have been lower if certain expenses had not been reduced during the applicable periods shown.
B Calculated based on average shares outstanding during the period.
C Fees and expenses of any underlying Fidelity Central Funds are not included in the Fund's expense ratio. The Fund indirectly bears its proportionate share of the expenses of any underlying Fidelity Central Funds.
D Amount does not include the portfolio activity of any underlying Fidelity Central Funds.
E Expense ratios reflect operating expenses of the class. Expenses before reductions do not reflect amounts reimbursed by the investment adviser or reductions from brokerage service arrangements or reductions from other expense offset arrangements and do not represent the amount paid by the class during periods when reimbursements or reductions occur. Expenses net of fee waivers reflect expenses after reimbursement by the investment adviser but prior to reductions from brokerage service arrangements or other expense offset arrangements. Expenses net of all reductions represent the net expenses paid by the class.
F Amount represents less than $.01 per share.
G Total distributions of $.70 per share is comprised of distributions from net investment income of $.548 and distributions from net realized gain of $.155 per share.
See accompanying notes which are an integral part of the financial statements.
Annual Report
Financial Highlights - Institutional Class
Years ended October 31, | 2013 | 2012 | 2011 | 2010 | 2009 |
Selected Per-Share Data | | | | | |
Net asset value, beginning of period | $ 31.87 | $ 29.65 | $ 32.31 | $ 28.77 | $ 23.91 |
Income from Investment Operations | | | | | |
Net investment income (loss) B | .47 | .52 | .54 | .41 | .39 |
Net realized and unrealized gain (loss) | 8.01 | 2.11 | (2.55) | 3.55 | 4.86 |
Total from investment operations | 8.48 | 2.63 | (2.01) | 3.96 | 5.25 |
Distributions from net investment income | (.56) | (.41) | (.50) | (.38) | (.39) |
Distributions from net realized gain | (.03) | - | (.16) | (.04) | - |
Total distributions | (.59) | (.41) | (.65) G | (.42) | (.39) |
Redemption fees added to paid in capital B,F | - | - | - | - | - |
Net asset value, end of period | $ 39.76 | $ 31.87 | $ 29.65 | $ 32.31 | $ 28.77 |
Total Return A | 27.03% | 9.07% | (6.39)% | 13.84% | 22.52% |
Ratios to Average Net Assets C,E | | | | |
Expenses before reductions | 1.00% | 1.00% | .95% | .99% | 1.05% |
Expenses net of fee waivers, if any | 1.00% | 1.00% | .94% | .99% | 1.05% |
Expenses net of all reductions | .97% | .97% | .90% | .95% | 1.00% |
Net investment income (loss) | 1.33% | 1.75% | 1.66% | 1.40% | 1.60% |
Supplemental Data | | | | | |
Net assets, end of period (in millions) | $ 476 | $ 294 | $ 278 | $ 319 | $ 267 |
Portfolio turnover rate D | 65% | 68% | 75% | 82% | 98% |
A Total returns would have been lower if certain expenses had not been reduced during the applicable periods shown.
B Calculated based on average shares outstanding during the period.
C Fees and expenses of any underlying Fidelity Central Funds are not included in the Fund's expense ratio. The Fund indirectly bears its proportionate share of the expenses of any underlying Fidelity Central Funds.
D Amount does not include the portfolio activity of any underlying Fidelity Central Funds.
E Expense ratios reflect operating expenses of the class. Expenses before reductions do not reflect amounts reimbursed by the investment adviser or reductions from brokerage service arrangements or reductions from other expense offset arrangements and do not represent the amount paid by the class during periods when reimbursements or reductions occur. Expenses net of fee waivers reflect expenses after reimbursement by the investment adviser but prior to reductions from brokerage service arrangements or other expense offset arrangements. Expenses net of all reductions represent the net expenses paid by the class.
F Amount represents less than $.01 per share.
G Total distributions of $.65 per share is comprised of distributions from net investment income of $.497 and distributions from net realized gain of $.155 per share.
See accompanying notes which are an integral part of the financial statements.
Annual Report
Financial Highlights - Class Z
Year ended October 31, | 2013 G |
Selected Per-Share Data | |
Net asset value, beginning of period | $ 37.22 |
Income from Investment Operations | |
Net investment income (loss) D | .07 |
Net realized and unrealized gain (loss) | 2.48 |
Total from investment operations | 2.55 |
Redemption fees added to paid in capital D,I | - |
Net asset value, end of period | $ 39.77 |
Total Return B,C | 6.85% |
Ratios to Average Net Assets E,H | |
Expenses before reductions | .85% A |
Expenses net of fee waivers, if any | .85% A |
Expenses net of all reductions | .83% A |
Net investment income (loss) | .76% A |
Supplemental Data | |
Net assets, end of period (000 omitted) | $ 107 |
Portfolio turnover rate F | 65% |
A Annualized
B Total returns for periods of less than one year are not annualized.
C Total returns would have been lower if certain expenses had not been reduced during the applicable periods shown.
D Calculated based on average shares outstanding during the period.
E Fees and expenses of any underlying Fidelity Central Funds are not included in the Fund's expense ratio. The Fund indirectly bears its proportionate share of the expenses of any underlying Fidelity Central Funds.
F Amount does not include the portfolio activity of any underlying Fidelity Central Funds.
G For the period August 13, 2013 (commencement of sale of shares) to October 31, 2013.
H Expense ratios reflect operating expenses of the class. Expenses before reductions do not reflect amounts reimbursed by the investment adviser or reductions from brokerage service arrangements or reductions from other expense offset arrangements and do not represent the amount paid by the class during periods when reimbursements or reductions occur. Expense ratios before reductions for start-up periods may not be representative of longer-term operating periods. Expenses net of fee waivers reflect expenses after reimbursement by the investment adviser but prior to reductions from brokerage service arrangements or other expense offset arrangements. Expenses net of all reductions represent the net expenses paid by the class.
I Amount represents less than $.01 per share.
See accompanying notes which are an integral part of the financial statements.
Annual Report
Notes to Financial Statements
For the period ended October 31, 2013
(Amounts in thousands except percentages)
1. Organization.
Fidelity International Discovery Fund (the Fund) is a fund of Fidelity Investment Trust (the Trust) and is authorized to issue an unlimited number of shares. The Trust is registered under the Investment Company Act of 1940, as amended (the 1940 Act), as an open-end management investment company organized as a Massachusetts business trust. The Fund commenced sale of Class Z shares on August 13, 2013. The Fund offers Class A, Class T, Class C, International Discovery, Class K, Institutional Class and Class Z shares, each of which, along with Class B shares, has equal rights as to assets and voting privileges. Class B shares are closed to new accounts and additional purchases, except for exchanges and reinvestments. Each class has exclusive voting rights with respect to matters that affect that class. Class B shares will automatically convert to Class A shares after a holding period of seven years from the initial date of purchase.
2. Investments in Fidelity Central Funds.
The Fund invests in Fidelity Central Funds, which are open-end investment companies generally available only to other investment companies and accounts managed by Fidelity Management & Research Company (FMR) and its affiliates. The Fund's Schedule of Investments lists each of the Fidelity Central Funds held as of period end, if any, as an investment of the Fund, but does not include the underlying holdings of each Fidelity Central Fund. As an Investing Fund, the Fund indirectly bears its proportionate share of the expenses of the underlying Fidelity Central Funds.
The Money Market Central Funds seek preservation of capital and current income and are managed by Fidelity Investments Money Management, Inc. (FIMM), an affiliate of FMR.
A complete unaudited list of holdings for each Fidelity Central Fund is available upon request or at the Securities and Exchange Commission (the SEC) website at www.sec.gov. In addition, the financial statements of the Fidelity Central Funds, which are not covered by the Fund's Report of Independent Registered Public Accounting Firm, are available on the SEC website or upon request.
3. Significant Accounting Policies.
The financial statements have been prepared in conformity with accounting principles generally accepted in the United States of America (GAAP), which require management to make certain estimates and assumptions at the date of the financial statements. Actual results could differ from those estimates. Subsequent events, if any, through the date that the financial statements were issued have been evaluated in the preparation of
Annual Report
3. Significant Accounting Policies - continued
the financial statements. The following summarizes the significant accounting policies of the Fund:
Investment Valuation. Investments are valued as of 4:00 p.m. Eastern time on the last calendar day of the period. In accordance with valuation policies and procedures approved by the Board of Trustees (the Board), the Fund attempts to obtain prices from one or more third party pricing vendors or brokers to value its investments. When current market prices, quotations or currency exchange rates are not readily available or reliable, investments will be fair valued in good faith by the FMR Fair Value Committee (the Committee), in accordance with procedures adopted by the Board. Factors used in determining fair value vary by investment type and may include market or investment specific events, changes in interest rates and credit quality. The frequency with which these procedures are used cannot be predicted and they may be utilized to a significant extent. The Committee oversees the Fund's valuation policies and procedures and is responsible for approving and reporting to the Board all fair value determinations.
The Fund categorizes the inputs to valuation techniques used to value its investments into a disclosure hierarchy consisting of three levels as shown below:
Level 1 - quoted prices in active markets for identical investments
Level 2 - other significant observable inputs (including quoted prices for similar investments, interest rates, prepayment speeds, etc.)
Level 3 - unobservable inputs (including the Fund's own assumptions based on the best information available)
Valuation techniques used to value the Fund's investments by major category are as follows:
Equity securities, including restricted securities, for which market quotations are readily available, are valued at the last reported sale price or official closing price as reported by a third party pricing vendor on the primary market or exchange on which they are traded and are categorized as Level 1 in the hierarchy. In the event there were no sales during the day or closing prices are not available, securities are valued at the last quoted bid price or may be valued using the last available price and are generally categorized as Level 2 in the hierarchy. For foreign equity securities, when market or security specific events arise, comparisons to the valuation of American Depositary Receipts (ADRs), futures contracts, Exchange-Traded Funds (ETFs) and certain indexes as well as quoted prices for similar securities may be used and would be categorized as Level 2 in the hierarchy. Utilizing these techniques may result in transfers between Level 1 and Level 2. For equity securities, including restricted securities, where observable inputs are
Annual Report
Notes to Financial Statements - continued
(Amounts in thousands except percentages)
3. Significant Accounting Policies - continued
Investment Valuation - continued
limited, assumptions about market activity and risk are used and these securities may be categorized as Level 3 in the hierarchy.
Debt securities, including restricted securities, are valued based on evaluated prices received from third party pricing vendors or from brokers who make markets in such securities. For U.S. government and government agency obligations, pricing vendors utilize matrix pricing which considers yield or price of bonds of comparable quality, coupon, maturity and type as well as broker-supplied prices. When independent prices are unavailable or unreliable, debt securities may be valued utilizing pricing methodologies which consider similar factors that would be used by third party pricing vendors. Debt securities are generally categorized as Level 2 in the hierarchy but may be Level 3 depending on the circumstances.
Futures contracts are valued at the settlement price established each day by the board of trade or exchange on which they are traded and are categorized as Level 1 in the hierarchy. Investments in open-end mutual funds, including the Fidelity Central Funds, are valued at their closing net asset value (NAV) each business day and are categorized as Level 1 in the hierarchy.
Changes in valuation techniques may result in transfers in or out of an assigned level within the disclosure hierarchy. The aggregate value of investments by input level, as of October 31, 2013, including information on transfers between Levels 1 and 2, is included at the end of the Fund's Schedule of Investments.
Foreign Currency. The Fund may use foreign currency contracts to facilitate transactions in foreign-denominated securities. Gains and losses from these transactions may arise from changes in the value of the foreign currency or if the counterparties do not perform under the contracts' terms.
Foreign-denominated assets, including investment securities, and liabilities are translated into U.S. dollars at the exchange rates at period end. Purchases and sales of investment securities, income and dividends received and expenses denominated in foreign currencies are translated into U.S. dollars at the exchange rate in effect on the transaction date.
The effects of exchange rate fluctuations on investments are included with the net realized and unrealized gain (loss) on investment securities. Other foreign currency transactions resulting in realized and unrealized gain (loss) are disclosed separately.
Investment Transactions and Income. For financial reporting purposes, the Fund's investment holdings and NAV include trades executed through the end of the last business day of the period. The NAV per share for processing shareholder transactions is
Annual Report
3. Significant Accounting Policies - continued
Investment Transactions and Income - continued
calculated as of the close of business of the New York Stock Exchange (NYSE), normally 4:00 p.m. Eastern time and includes trades executed through the end of the prior business day. Gains and losses on securities sold are determined on the basis of identified cost. Dividend income is recorded on the ex-dividend date, except for certain dividends from foreign securities where the ex-dividend date may have passed, which are recorded as soon as the Fund is informed of the ex-dividend date. Non-cash dividends included in dividend income, if any, are recorded at the fair market value of the securities received. Distributions received on securities that represent a return of capital or capital gain are recorded as a reduction of cost of investments and/or as a realized gain. Subsequent to ex-dividend date the Fund determines the components of these distributions, based upon receipt of tax filings or other correspondence relating to the underlying investment. Interest income and distributions from the Fidelity Central Funds are accrued as earned. Interest income includes coupon interest and amortization of premium and accretion of discount on debt securities. Investment income is recorded net of foreign taxes withheld where recovery of such taxes is uncertain.
Class Allocations and Expenses. Investment income, realized and unrealized capital gains and losses, common expenses of the Fund, and certain fund-level expense reductions, if any, are allocated daily on a pro-rata basis to each class based on the relative net assets of each class to the total net assets of the Fund. Each class differs with respect to transfer agent and distribution and service plan fees incurred. Certain expense reductions may also differ by class. For the reporting period, the allocated portion of income and expenses to each class as a percent of its average net assets may vary due to the timing of recording these transactions in relation to fluctuating net assets of the classes. Expenses directly attributable to a fund are charged to that fund. Expenses attributable to more than one fund are allocated among the respective funds on the basis of relative net assets or other appropriate methods. Expense estimates are accrued in the period to which they relate and adjustments are made when actual amounts are known.
Deferred Trustee Compensation. Under a Deferred Compensation Plan (the Plan), independent Trustees may elect to defer receipt of a portion of their annual compensation. Deferred amounts are invested in a cross-section of Fidelity funds, are marked-to-market and remain in the Fund until distributed in accordance with the Plan. The investment of deferred amounts and the offsetting payable to the Trustees are included in the accompanying Statement of Assets and Liabilities.
Income Tax Information and Distributions to Shareholders. Each year, the Fund intends to qualify as a regulated investment company under Subchapter M of the Internal Revenue Code, including distributing substantially all of its taxable income and realized gains. As a result, no provision for U.S. Federal income taxes is required. As of
Annual Report
Notes to Financial Statements - continued
(Amounts in thousands except percentages)
3. Significant Accounting Policies - continued
Income Tax Information and Distributions to Shareholders - continued
October 31, 2013, the Fund did not have any unrecognized tax benefits in the financial statements; nor is the Fund aware of any tax positions for which it is reasonably possible that the total amounts of unrecognized tax benefits will significantly change in the next twelve months. The Fund files a U.S. federal tax return, in addition to state and local tax returns as required. The Fund's federal income tax returns are subject to examination by the Internal Revenue Service (IRS) for a period of three fiscal years after they are filed. State and local tax returns may be subject to examination for an additional fiscal year depending on the jurisdiction. Foreign taxes are provided for based on the Fund's understanding of the tax rules and rates that exist in the foreign markets in which it invests.
Distributions are declared and recorded on the ex-dividend date. Income dividends and capital gain distributions are declared separately for each class. Income and capital gain distributions are determined in accordance with income tax regulations, which may differ from GAAP.
Capital accounts within the financial statements are adjusted for permanent book-tax differences. These adjustments have no impact on net assets or the results of operations. Temporary book-tax differences will reverse in a subsequent period.
Book-tax differences are primarily due to futures contracts, foreign currency transactions, passive foreign investment companies (PFIC), market discount, deferred trustees compensation, capital loss carryforwards and losses deferred due to wash sales.
The federal tax cost of investment securities and unrealized appreciation (depreciation) as of period end were as follows:
Gross unrealized appreciation | $ 2,288,825 |
Gross unrealized depreciation | (128,376) |
Net unrealized appreciation (depreciation) on securities and other investments | $ 2,160,449 |
| |
Tax Cost | $ 9,169,453 |
The tax-based components of distributable earnings as of period end were as follows:
Undistributed ordinary income | $ 219,779 |
Capital loss carryforward | $ (950,903) |
Net unrealized appreciation (depreciation) | $ 2,159,295 |
Annual Report
3. Significant Accounting Policies - continued
Income Tax Information and Distributions to Shareholders - continued
Capital loss carryforwards are only available to offset future capital gains of the Fund to the extent provided by regulations and may be limited. Under the Regulated Investment Company Modernization Act of 2010 (the Act), the Fund is permitted to carry forward capital losses incurred in taxable years beginning after December 22, 2010 for an unlimited period and such capital losses are required to be used prior to any losses that expire. The capital loss carryforward information presented below, including any applicable limitation, is estimated as of fiscal period end and is subject to adjustment.
Fiscal year of expiration | |
2017 | $ (950,903) |
The tax character of distributions paid was as follows:
| October 31, 2013 | October 31, 2012 |
Ordinary Income | $ 154,444 | $ 118,968 |
Short-Term Trading (Redemption) Fees. Shares held by investors in the Fund less than 30 days may have been subject to a redemption fee equal to 1.00% of the net asset value of shares redeemed. All redemption fees, which reduce the proceeds of the shareholder redemption, are retained by the Fund and accounted for as an addition to paid in capital.
New Accounting Pronouncement. The Financial Accounting Standards Board issued in December 2011, Accounting Standard Update No. 2011-11, Disclosures about Offsetting Assets and Liabilities, and in January 2013, Accounting Standards Update No. 2013-1 Clarifying the Scope of Disclosures about Offsetting Assets and Liabilities. These updates create new disclosure requirements requiring entities to disclose both gross and net information for derivatives and other financial instruments that are either offset in the Statement of Assets and Liabilities or subject to an enforceable master netting arrangement or similar agreement. The disclosure requirements are effective for annual reporting periods beginning on or after January 1, 2013, and interim periods within those annual periods. Management expects that the impact of the updates' adoption will be limited to additional financial statement disclosures as applicable.
4. Derivative Instruments.
Risk Exposures and the Use of Derivative Instruments. The Fund's investment objective allows the Fund to enter into various types of derivative contracts, including futures contracts. Derivatives are investments whose value is primarily derived from underlying assets, indices or reference rates and may be transacted on an exchange or
Annual Report
Notes to Financial Statements - continued
(Amounts in thousands except percentages)
4. Derivative Instruments - continued
Risk Exposures and the Use of Derivative Instruments - continued
over-the-counter (OTC). Derivatives may involve a future commitment to buy or sell a specified asset based on specified terms, to exchange future cash flows at periodic intervals based on a notional principal amount, or for one party to make one or more payments upon the occurrence of specified events in exchange for periodic payments from the other party.
The Fund used derivatives to increase returns and to manage exposure to certain risks as defined below. The success of any strategy involving derivatives depends on analysis of numerous economic factors, and if the strategies for investment do not work as intended, the Fund may not achieve its objectives.
The Fund's use of derivatives increased or decreased its exposure to the following risk:
Equity Risk | Equity risk relates to the fluctuations in the value of financial instruments as a result of changes in market prices (other than those arising from interest rate risk or foreign exchange risk), whether caused by factors specific to an individual investment, its issuer, or all factors affecting all instruments traded in a market or market segment. |
The Fund is also exposed to additional risks from investing in derivatives, such as liquidity risk and counterparty credit risk. Liquidity risk is the risk that the Fund will be unable to close out the derivative in the open market in a timely manner. Counterparty credit risk is the risk that the counterparty will not be able to fulfill its obligation to the Fund. Counterparty credit risk related to exchange-traded futures contracts may be mitigated by the protection provided by the exchange on which they trade.
Investing in derivatives may involve greater risks than investing in the underlying assets directly and, to varying degrees, may involve risk of loss in excess of any initial investment and collateral received and amounts recognized in the Statement of Assets and Liabilities. In addition, there may be the risk that the change in value of the derivative contract does not correspond to the change in value of the underlying instrument.
Futures Contracts. A futures contract is an agreement between two parties to buy or sell a specified underlying instrument for a fixed price at a specified future date. The Fund used futures contracts to manage its exposure to the stock market.
Upon entering into a futures contract, a fund is required to deposit either cash or securities (initial margin) with a clearing broker in an amount equal to a certain percentage of the face value of the contract. Futures contracts are marked-to-market daily and subsequent daily payments (variation margin) are made or received by a fund depending on the daily fluctuations in the value of the futures contracts and are recorded as unrealized
Annual Report
4. Derivative Instruments - continued
Futures Contracts - continued
appreciation or (depreciation). This receivable and/or payable, if any, is included in daily variation margin for derivative instruments in the Statement of Assets and Liabilities. Realized gain or (loss) is recorded upon the expiration or closing of a futures contract.
Any open futures contracts at period end are presented in the Schedule of Investments under the caption "Futures Contracts." The underlying face amount at value reflects each contract's exposure to the underlying instrument or index at period end and is representative of activity for the period. Securities deposited to meet initial margin requirements are identified in the Schedule of Investments.
During the period the Fund recognized net realized gain (loss) of $51,368 and a change in net unrealized appreciation (depreciation) of $4,238 related to its investment in futures contracts. These amounts are included in the Statement of Operations.
5. Purchases and Sales of Investments.
Purchases and sales of securities, other than short-term securities, aggregated $6,591,378 and $5,993,057, respectively.
6. Fees and Other Transactions with Affiliates.
Management Fee. FMR and its affiliates provide the Fund with investment management related services for which the Fund pays a monthly management fee. The management fee is the sum of an individual fund fee rate that is based on an annual rate of .45% of the Fund's average net assets and an annualized group fee rate that averaged .25% during the period. The group fee rate is based upon the average net assets of all the mutual funds advised by FMR, including any mutual funds previously advised by FMR that are currently advised by Fidelity SelectCo, LLC, an affiliate of FMR. The group fee rate decreases as assets under management increase and increases as assets under management decrease. In addition, the management fee is subject to a performance adjustment (up to a maximum of ± .20% of the Fund's average net assets over a 36 month performance period). The upward or downward adjustment to the management fee is based on the relative investment performance of International Discovery as compared to an appropriate benchmark index over the same 36 month performance period. For the reporting period, the total annual management fee rate, including the performance adjustment, was .77% of the Fund's average net assets. The performance adjustment included in the management fee rate may be higher or lower than the maximum performance adjustment rate due to the difference between the average net assets for the reporting and performance periods.
Annual Report
Notes to Financial Statements - continued
(Amounts in thousands except percentages)
6. Fees and Other Transactions with Affiliates - continued
Distribution and Service Plan Fees. In accordance with Rule 12b-1 of the 1940 Act, the Fund has adopted separate Distribution and Service Plans for each class of shares. Certain classes pay Fidelity Distributors Corporation (FDC), an affiliate of FMR, separate Distribution and Service Fees, each of which is based on an annual percentage of each class' average net assets. In addition, FDC may pay financial intermediaries for selling shares of the Fund and providing shareholder support services. For the period, the Distribution and Service Fee rates, total fees and amounts retained by FDC were as follows:
| Distribution
Fee | Service
Fee | Total Fees | Retained
by FDC |
Class A | -% | .25% | $ 796 | $ 9 |
Class T | .25% | .25% | 243 | 2 |
Class B | .75% | .25% | 69 | 52 |
Class C | .75% | .25% | 324 | 25 |
| | | $ 1,432 | $ 88 |
Sales Load. FDC may receive a front-end sales charge of up to 5.75% for selling Class A shares and 3.50% for selling Class T shares, some of which is paid to financial intermediaries for selling shares of the Fund. Depending on the holding period, FDC may receive contingent deferred sales charges levied on Class A, Class T, Class B, and Class C redemptions. The deferred sales charges range from 5.00% to 1.00% for Class B shares, 1.00% for Class C shares, 1.00% for certain purchases of Class A shares and .25% for certain purchases of Class T shares.
For the period, sales charge amounts retained by FDC were as follows:
| Retained
by FDC |
Class A | $ 56 |
Class T | 5 |
Class B* | 9 |
Class C* | 2 |
| $ 72 |
* When Class B and Class C shares are initially sold, FDC pays commissions from its own resources to financial intermediaries through which the sales are made.
Transfer Agent Fees. Fidelity Investments Institutional Operations Company, Inc., (FIIOC), an affiliate of FMR, is the transfer, dividend disbursing and shareholder servicing agent for each class of the Fund. FIIOC receives account fees and asset-based fees that vary according to the account size and type of account of the shareholders of the respective classes of the Fund, except for Class Z. FIIOC receives an asset-based fee of
Annual Report
6. Fees and Other Transactions with Affiliates - continued
Transfer Agent Fees - continued
Class K's and Class Z's average net assets. FIIOC pays for typesetting, printing and mailing of shareholder reports, except proxy statements.
For the period, transfer agent fees for each applicable class were as follows:
| Amount | % of
Average
Net Assets |
Class A | $ 954 | .30 |
Class T | 141 | .29 |
Class B | 21 | .30 |
Class C | 96 | .29 |
International Discovery | 13,480 | .20 |
Class K | 1,069 | .05 |
Institutional Class | 713 | .19 |
Class Z | -* | .05** |
| $ 16,474 | |
* Amount represents eleven dollars.
** Annualized
Accounting and Security Lending Fees. Fidelity Service Company, Inc. (FSC), an affiliate of FMR, maintains the Fund's accounting records. The accounting fee is based on the level of average net assets for each month. Under a separate contract, FSC administers the security lending program. The security lending fee is based on the number and duration of lending transactions.
Brokerage Commissions. The Fund placed a portion of its portfolio transactions with brokerage firms which are affiliates of the investment adviser. Brokerage commissions are included in net realized gain (loss) and change in net unrealized appreciation (depreciation) in the Statement of Operations. The commissions paid to these affiliated firms were $4 for the period.
7. Committed Line of Credit.
The Fund participates with other funds managed by FMR or an affiliate in a $4.25 billion credit facility (the "line of credit") to be utilized for temporary or emergency purposes to fund shareholder redemptions or for other short-term liquidity purposes. The Fund has agreed to pay commitment fees on its pro-rata portion of the line of credit, which amounted to $20 and is reflected in Miscellaneous expenses on the Statement of Operations. During the period, there were no borrowings on this line of credit.
Annual Report
Notes to Financial Statements - continued
(Amounts in thousands except percentages)
8. Security Lending.
The Fund lends portfolio securities through a lending agent from time to time in order to earn additional income. For equity securities, a lending agent is used and may loan securities to certain qualified borrowers, including Fidelity Capital Markets (FCM), a broker-dealer affiliated with the Fund. On the settlement date of the loan, the Fund receives collateral (in the form of U.S. Treasury obligations, letters of credit and/or cash) against the loaned securities and maintains collateral in an amount not less than 100% of the market value of the loaned securities during the period of the loan. The market value of the loaned securities is determined at the close of business of the Fund and any additional required collateral is delivered to the Fund on the next business day. If the borrower defaults on its obligation to return the securities loaned because of insolvency or other reasons, the Fund may apply collateral received from the borrower against the obligation. The Fund may experience delays and costs in recovering the securities loaned. Any cash collateral received is invested in the Fidelity Securities Lending Cash Central Fund. The value of loaned securities and cash collateral at period end are disclosed on the Fund's Statement of Assets and Liabilities. At period end, there were no security loans outstanding with FCM. Security lending income represents the income earned on investing cash collateral, less rebates paid to borrowers and any lending agent fees associated with the loan, plus any premium payments received for lending certain types of securities. Security lending income is presented in the Statement of Operations as a component of income from Fidelity Central Funds. Total security lending income during the period amounted to $5,441, including $40 from securities loaned to FCM.
9. Expense Reductions.
FMR voluntarily agreed to reimburse a portion of the following class' operating expense.
During the period, this reimbursement reduced expenses as follows:
| Reimbursement |
International Discovery | $ 10 |
Class K | 3 |
Institutional Class | 1 |
| $ 14 |
Commissions paid to certain brokers with whom FMR, or its affiliates, places trades on behalf of the Fund include an amount in addition to trade execution, which may be rebated back to the Fund to offset certain expenses. This amount totaled $2,236 for the period.
In addition, FMR reimbursed a portion of the Fund's operating expenses during the period in the amount of $61.
Annual Report
10. Distributions to Shareholders.
Distributions to shareholders of each class were as follows:
Years ended October 31, | 2013 | 2012 |
From net investment income | | |
Class A | $ 4,138 | $ 3,123 |
Class T | 492 | 388 |
Class B | 34 | 6 |
Class C | 186 | 44 |
International Discovery | 101,466 | 90,633 |
Class K | 34,651 | 20,917 |
Institutional Class | 5,064 | 3,857 |
Total | $ 146,031 | $ 118,968 |
From net realized gain | | |
Class A | $ 297 | $ - |
Class T | 46 | - |
Class B | 7 | - |
Class C | 30 | - |
International Discovery | 5,914 | - |
Class K | 1,827 | - |
Institutional Class | 292 | - |
Total | $ 8,413 | $ - |
11. Share Transactions.
Transactions for each class of shares were as follows:
| Shares | Dollars |
Years ended October 31, | 2013 A | 2012 | 2013 A | 2012 |
Class A | | | | |
Shares sold | 1,772 | 1,927 | $ 62,186 | $ 56,732 |
Reinvestment of distributions | 132 | 101 | 4,249 | 2,828 |
Shares redeemed | (2,553) | (3,468) | (88,988) | (100,935) |
Net increase (decrease) | (649) | (1,440) | $ (22,553) | $ (41,375) |
Class T | | | | |
Shares sold | 227 | 220 | $ 7,911 | $ 6,409 |
Reinvestment of distributions | 16 | 13 | 512 | 369 |
Shares redeemed | (347) | (860) | (11,997) | (25,207) |
Net increase (decrease) | (104) | (627) | $ (3,574) | $ (18,429) |
Class B | | | | |
Shares sold | 4 | 3 | $ 137 | $ 87 |
Reinvestment of distributions | 1 | - | 39 | 5 |
Shares redeemed | (75) | (113) | (2,570) | (3,297) |
Net increase (decrease) | (70) | (110) | $ (2,394) | $ (3,205) |
Annual Report
Notes to Financial Statements - continued
(Amounts in thousands except percentages)
11. Share Transactions - continued
| Shares | Dollars |
Years ended October 31, | 2013 A | 2012 | 2013 A | 2012 |
Class C | | | | |
Shares sold | 184 | 212 | $ 6,532 | $ 6,111 |
Reinvestment of distributions | 6 | 1 | 193 | 39 |
Shares redeemed | (207) | (395) | (7,250) | (11,440) |
Net increase (decrease) | (17) | (182) | $ (525) | $ (5,290) |
International Discovery | | | | |
Shares sold | 37,338 | 20,324 | $ 1,332,523 | $ 608,478 |
Reinvestment of distributions | 3,176 | 3,081 | 102,608 | 86,858 |
Shares redeemed | (31,569) | (65,748) | (1,103,313) | (1,937,202) |
Net increase (decrease) | 8,945 | (42,343) | $ 331,818 | $ (1,241,866) |
Class K | | | | |
Shares sold | 19,989 | 26,836 | $ 699,723 | $ 788,860 |
Reinvestment of distributions | 1,132 | 744 | 36,478 | 20,917 |
Shares redeemed | (12,053) | (13,817) | (423,712) | (410,022) |
Net increase (decrease) | 9,068 | 13,763 | $ 312,489 | $ 399,755 |
Institutional Class | | | | |
Shares sold | 4,893 | 2,049 | $ 175,669 | $ 59,460 |
Reinvestment of distributions | 68 | 53 | 2,182 | 1,502 |
Shares redeemed | (2,219) | (2,256) | (78,500) | (65,914) |
Net increase (decrease) | 2,742 | (154) | $ 99,351 | $ (4,952) |
Class Z | | | | |
Shares sold | 3 | - | $ 100 | $ - |
Net increase (decrease) | 3 | - | $ 100 | $ - |
A Share transactions for Class Z are for the period August 13, 2013 (commencement of sale of shares) to October 31, 2013.
12. Other.
The Fund's organizational documents provide former and current trustees and officers with a limited indemnification against liabilities arising in connection with the performance of their duties to the Fund. In the normal course of business, the Fund may also enter into contracts that provide general indemnifications. The Fund's maximum exposure under these arrangements is unknown as this would be dependent on future claims that may be made against the Fund. The risk of material loss from such claims is considered remote.
At the end of the period, Strategic Advisers International Fund was the owner of record of approximately 11% of the total outstanding shares of the Fund.
Annual Report
To the Trustees of Fidelity Investment Trust and the Shareholders of Fidelity International Discovery Fund:
In our opinion, the accompanying statement of assets and liabilities, including the schedule of investments, and the related statements of operations and of changes in net assets and the financial highlights present fairly, in all material respects, the financial position of Fidelity International Discovery Fund (a fund of Fidelity Investment Trust) at October 31, 2013, the results of its operations for the year then ended, the changes in its net assets for each of the two years in the period then ended and the financial highlights for each of the periods indicated, in conformity with accounting principles generally accepted in the United States of America. These financial statements and financial highlights (hereafter referred to as "financial statements") are the responsibility of the Fidelity International Discovery Fund's management. Our responsibility is to express an opinion on these financial statements based on our audits. We conducted our audits of these financial statements in accordance with the standards of the Public Company Accounting Oversight Board (United States). Those standards require that we plan and perform the audit to obtain reasonable assurance about whether the financial statements are free of material misstatement. An audit includes examining, on a test basis, evidence supporting the amounts and disclosures in the financial statements, assessing the accounting principles used and significant estimates made by management, and evaluating the overall financial statement presentation. We believe that our audits, which included confirmation of securities at October 31, 2013 by correspondence with the custodian and brokers, provide a reasonable basis for our opinion.
PricewaterhouseCoopers LLP
Boston, Massachusetts
December 16, 2013
Annual Report
The Trustees, Member of the Advisory Board, and executive officers of the trust and fund, as applicable, are listed below. The Board of Trustees governs the fund and is responsible for protecting the interests of shareholders. The Trustees are experienced executives who meet periodically throughout the year to oversee the fund's activities, review contractual arrangements with companies that provide services to the fund, oversee management of the risks associated with such activities and contractual arrangements, and review the fund's performance. Except for James C. Curvey, Ned C. Lautenbach, Ronald P. O'Hanley, and William S. Stavropoulos, each of the Trustees oversees 171 funds. Mr. Curvey oversees 394 funds. Mr. Lautenbach, Mr. O'Hanley, and Mr. Stavropoulos each oversees 245 funds.
The Trustees hold office without limit in time except that (a) any Trustee may resign; (b) any Trustee may be removed by written instrument, signed by at least two-thirds of the number of Trustees prior to such removal; (c) any Trustee who requests to be retired or who has become incapacitated by illness or injury may be retired by written instrument signed by a majority of the other Trustees; and (d) any Trustee may be removed at any special meeting of shareholders by a two-thirds vote of the outstanding voting securities of the trust. Each Trustee who is not an interested person of the trust and the fund (as defined in the 1940 Act) (Independent Trustee), shall retire not later than the last day of the calendar year in which his or her 75th birthday occurs. The Independent Trustees may waive this mandatory retirement age policy with respect to individual Trustees. The executive officers and Advisory Board Member hold office without limit in time, except that any officer and Advisory Board Member may resign or may be removed by a vote of a majority of the Trustees at any regular meeting or any special meeting of the Trustees. Except as indicated, each individual has held the office shown or other offices in the same company for the past five years.
Experience, Skills, Attributes, and Qualifications of the Fund's Trustees. The Governance and Nominating Committee has adopted a statement of policy that describes the experience, qualifications, attributes, and skills that are necessary and desirable for potential Independent Trustee candidates (Statement of Policy). The Board believes that each Trustee satisfied at the time he or she was initially elected or appointed a Trustee, and continues to satisfy, the standards contemplated by the Statement of Policy. The Governance and Nominating Committee also engages professional search firms to help identify potential Independent Trustee candidates who have the experience, qualifications, attributes, and skills consistent with the Statement of Policy. From time to time, additional criteria based on the composition and skills of the current Independent Trustees, as well as experience or skills that may be appropriate in light of future changes to board composition, business conditions, and regulatory or other developments, have also been considered by the professional search firms and the Governance and Nominating Committee. In addition, the Board takes into account the Trustees' commitment and participation in Board and committee meetings, as well as their leadership of standing and ad hoc committees throughout their tenure.
Annual Report
In determining that a particular Trustee was and continues to be qualified to serve as a Trustee, the Board has considered a variety of criteria, none of which, in isolation, was controlling. The Board believes that, collectively, the Trustees have balanced and diverse experience, qualifications, attributes, and skills, which allow the Board to operate effectively in governing the fund and protecting the interests of shareholders. Information about the specific experience, skills, attributes, and qualifications of each Trustee, which in each case led to the Board's conclusion that the Trustee should serve (or continue to serve) as a trustee of the fund, is provided below.
Board Structure and Oversight Function. James C. Curvey is an interested person (as defined in the 1940 Act) and currently serves as Chairman. The Trustees have determined that an interested Chairman is appropriate and benefits shareholders because an interested Chairman has a personal and professional stake in the quality and continuity of services provided to the fund. Independent Trustees exercise their informed business judgment to appoint an individual of their choosing to serve as Chairman, regardless of whether the Trustee happens to be independent or a member of management. The Independent Trustees have determined that they can act independently and effectively without having an Independent Trustee serve as Chairman and that a key structural component for assuring that they are in a position to do so is for the Independent Trustees to constitute a substantial majority for the Board. The Independent Trustees also regularly meet in executive session. Ned C. Lautenbach serves as Chairman of the Independent Trustees and as such (i) acts as a liaison between the Independent Trustees and management with respect to matters important to the Independent Trustees and (ii) with management prepares agendas for Board meetings.
Fidelity funds are overseen by different Boards of Trustees. The fund's Board oversees Fidelity's equity and high income funds and another Board oversees Fidelity's investment-grade bond, money market, and asset allocation funds. The asset allocation funds may invest in Fidelity funds overseen by the fund's Board. The use of separate Boards, each with its own committee structure, allows the Trustees of each group of Fidelity funds to focus on the unique issues of the funds they oversee, including common research, investment, and operational issues. On occasion, the separate Boards establish joint committees to address issues of overlapping consequences for the Fidelity funds overseen by each Board.
The Trustees operate using a system of committees to facilitate the timely and efficient consideration of all matters of importance to the Trustees, the fund, and fund shareholders and to facilitate compliance with legal and regulatory requirements and oversight of the fund's activities and associated risks. The Board, acting through its committees, has charged FMR and its affiliates with (i) identifying events or circumstances the occurrence of which could have demonstrably adverse effects on the fund's business and/or reputation; (ii) implementing processes and controls to lessen the possibility that such events or circumstances occur or to mitigate the effects of such events or circumstances if they do occur; and (iii) creating and maintaining a system designed to evaluate continuously business and market conditions in order to facilitate the identification and implementation processes described in (i) and (ii) above. Because the day-to-day operations and activities of the fund are carried out by or through FMR, its affiliates and other service providers, the fund's exposure to risks is mitigated but not eliminated by the processes overseen by the Trustees. While each of the Board's committees has responsibility for overseeing different aspects of the fund's activities, oversight is exercised primarily through the Operations, Audit, and Compliance Committees. In addition, the Independent Trustees have worked with FMR to enhance the Board's oversight of investment and financial risks, legal and regulatory risks, technology risks, and operational risks, including the development of additional risk reporting to the Board. For example, a working group comprised of Independent Trustees and FMR has worked and continues to work to review the Fidelity funds' valuation-related activities, reporting and risk management. Appropriate personnel, including but not limited to the fund's Chief Compliance Officer (CCO), FMR's internal auditor, the independent accountants, the fund's Treasurer and portfolio management personnel, make periodic reports to the Board's committees, as appropriate, including an annual review of FMR's risk management program for the Fidelity funds. The responsibilities of each standing committee, including their oversight responsibilities, are described further under "Standing Committees of the Fund's Trustees."
Annual Report
Trustees and Officers - continued
The fund's Statement of Additional Information (SAI) includes more information about the Trustees. To request a free copy, call Fidelity at 1-877-208-0098.
Interested Trustees*:
Correspondence intended for each Trustee who is an interested person may be sent to Fidelity Investments, 245 Summer Street, Boston, Massachusetts 02210.
Name, Year of Birth; Principal Occupations and Other Relevant Experience+ |
James C. Curvey (1935) |
Year of Election or Appointment: 2007 Trustee Chairman of the Board of Trustees |
| Mr. Curvey also serves as Trustee of other Fidelity funds. Mr. Curvey is a Director of Fidelity Investments Money Management, Inc. (2009-present), Director of Fidelity Research & Analysis Co. (2009-present) and Director of FMR and FMR Co., Inc. (2007-present). Mr. Curvey is also Vice Chairman (2007-present) and Director of FMR LLC. In addition, Mr. Curvey serves as an Overseer for the Boston Symphony Orchestra and a member of the Trustees of Villanova University. Previously, Mr. Curvey was the Vice Chairman (2006-2007) and Director (2000-2007) of FMR Corp. |
Ronald P. O'Hanley (1957) |
Year of Election or Appointment: 2011 Trustee |
| Mr. O'Hanley also serves as Trustee of other Fidelity funds. He is Director of Fidelity SelectCo, LLC (2013-present), FMR Co., Inc. (2010-present), Director of Fidelity Investments Money Management, Inc. (2010-present), Director of Fidelity Research & Analysis Company (2010-present), President of Fidelity Asset Management and Corporate Services and a Member of Fidelity's Executive Committee (2010-present). Previously, Mr. O'Hanley served as President and Chief Executive Officer of BNY Mellon Asset Management (2007-2010). Mr. O'Hanley also served as Vice Chairman of Bank New York Mellon Corp. and a member of that firm's Executive Committee. Prior to the 2007 merger of The Bank of New York and Mellon Financial Corporation, he was Vice Chairman of Mellon Financial Corporation and President and Chief Executive Officer of Mellon Asset Management. He joined Mellon in February 1997. Mr. O'Hanley currently serves as Chairman of the Boston Public Library Foundation Board of Directors and sits on the Board of Directors of Beth Israel Deaconess Medical Center, the Board of Trustees of the Marine Biological Laboratory and the Advisory Board of the Maxwell School of Citizenship and Public Administration at Syracuse University. Mr. O'Hanley also chairs the Council on Asset Management for the Financial Services Roundtable and is a member of the Board of Directors of Institutional Investor's U.S. Institute. |
* Trustees have been determined to be "Interested Trustees" by virtue of, among other things, their affiliation with the trust or various entities under common control with FMR.
+ The information above includes each Trustee's principal occupation during the last five years and other information relating to the experience, attributes, and skills relevant to each Trustee's qualifications to serve as a Trustee, which led to the conclusion that each Trustee should serve as a Trustee for the fund.
Annual Report
Trustees and Officers - continued
Independent Trustees:
Correspondence intended for each Independent Trustee (that is, the Trustees other than the Interested Trustees) may be sent to Fidelity Investments, P.O. Box 55235, Boston, Massachusetts 02205-5235.
Name, Year of Birth; Principal Occupations and Other Relevant Experience+ |
Dennis J. Dirks (1948) |
Year of Election or Appointment: 2005 Trustee |
| Mr. Dirks also serves as Trustee of other Fidelity funds. Prior to his retirement in May 2003, Mr. Dirks was Chief Operating Officer and a member of the Board of The Depository Trust & Clearing Corporation (DTCC). He also served as President, Chief Operating Officer, and Board member of The Depository Trust Company (DTC) and President and Board member of the National Securities Clearing Corporation (NSCC). In addition, Mr. Dirks served as Chief Executive Officer and Board member of the Government Securities Clearing Corporation, Chief Executive Officer and Board member of the Mortgage-Backed Securities Clearing Corporation, as a Trustee and a member of the Finance Committee of Manhattan College (2005-2008), and as a Trustee and a member of the Finance Committee of AHRC of Nassau County (2006-2008). Mr. Dirks is a member of the Independent Directors Council (IDC) Governing Council (2010-present) and Board of Directors for The Brookville Center for Children's Services, Inc. (2009-present). |
Alan J. Lacy (1953) |
Year of Election or Appointment: 2008 Trustee |
| Mr. Lacy also serves as Trustee of other Fidelity funds. Mr. Lacy serves as Senior Adviser (2007-present) of Oak Hill Capital Partners, L.P. (private equity). Mr. Lacy also served as Chief Executive Officer (2000-2005) and Vice Chairman (2005-2006) of Sears Holdings Corporation and Sears, Roebuck and Co. (retail). In addition, Mr. Lacy serves as a member of the Board of Directors of Dave & Buster's Entertainment, Inc. (restaurant and entertainment complexes, 2010-present), Earth Fare, Inc. (retail grocery, 2012-present), The Hillman Companies, Inc. (hardware wholesalers, 2010-present), and Bristol-Myers Squibb Company (global pharmaceuticals, 2008-present). Mr. Lacy is a member of the Board of Trustees of The National Parks Conservation Association (2006-present). Previously, Mr. Lacy served as Chairman of the Board of Trustees of the National Parks Conservation Association (2008-2011) and as a member of the Board of Directors for the Western Union Company (global money transfer, 2006-2011). |
Ned C. Lautenbach (1944) |
Year of Election or Appointment: 2000 Trustee Chairman of the Independent Trustees |
| Mr. Lautenbach also serves as Trustee of other Fidelity funds. Mr. Lautenbach currently serves as the Lead Director of the Eaton Corporation Board of Directors (diversified industrial, 1997-present). Mr. Lautenbach is Chairman of the Board of Directors of the Philharmonic Center for the Arts in Naples, Florida (2012-present) and a member of the Council on Foreign Relations (1994-present). Previously, Mr. Lautenbach was a Partner/Advisory Partner at Clayton, Dubilier & Rice, LLC (private equity investment, 1998-2010), as well as a Director of Sony Corporation (2006-2007). |
Joseph Mauriello (1944) |
Year of Election or Appointment: 2008 Trustee |
| Mr. Mauriello also serves as Trustee of other Fidelity funds. Prior to his retirement in January 2006, Mr. Mauriello served in numerous senior management positions including Deputy Chairman and Chief Operating Officer (2004-2005), and Vice Chairman of Financial Services (2002-2004) of KPMG LLP US (professional services, 1965-2005). Mr. Mauriello currently serves as a member of the Board of Directors of XL Group plc. (global insurance and re-insurance, 2006-present). Previously, Mr. Mauriello served as a Director of the Hamilton Funds of the Bank of New York (2006-2007) and of Arcadia Resources Inc. (health care services and products, 2007-2012). |
Robert W. Selander (1950) |
Year of Election or Appointment: 2011 Trustee |
| Mr. Selander also serves as Trustee of other Fidelity funds. Previously, Mr. Selander served as a Member of the Advisory Board of other Fidelity funds (2011), and Executive Vice Chairman (2010), Chief Executive Officer (2009-2010), and President and Chief Executive Officer (1997-2009) of Mastercard, Inc. |
Cornelia M. Small (1944) |
Year of Election or Appointment: 2005 Trustee |
| Ms. Small also serves as Trustee of other Fidelity funds. Ms. Small is a member of the Board of Directors (2009-present) and Chair of the Investment Committee (2010-present) of the Teagle Foundation. Ms. Small also serves on the Investment Committee of the Berkshire Taconic Community Foundation (2008-present). Previously, Ms. Small served as Chairperson (2002-2008) and a member of the Investment Committee and Chairperson (2008-2012) and a member of the Board of Trustees of Smith College. In addition, Ms. Small served as Chief Investment Officer, Director of Global Equity Investments, and a member of the Board of Directors of Scudder, Stevens & Clark and Scudder Kemper Investments. |
William S. Stavropoulos (1939) |
Year of Election or Appointment: 2001 Trustee Vice Chairman of the Independent Trustees |
| Mr. Stavropoulos also serves as Trustee of other Fidelity funds. Mr. Stavropoulos serves as President and Founder of the Michigan Baseball Foundation, the Great Lakes Loons (2007-present). Mr. Stavropoulos is Chairman Emeritus of the Board of Directors of The Dow Chemical Company, where he previously served in numerous senior management positions, including President, CEO (1995-2000; 2002-2004), Chairman of the Executive Committee (2000-2006), and as a member of the Board of Directors (1990-2006). Currently, Mr. Stavropoulos is Chairman of the Board of Directors of Univar Inc. (global distributor of commodity and specialty chemicals), a Director of Teradata Corporation (data warehousing and technology solutions), and Maersk Inc. (industrial conglomerate), and a member of the Advisory Board for Metalmark Capital LLC (private equity investment, 2005-present). Mr. Stavropoulos is an operating advisor to Clayton, Dubilier & Rice, LLC (private equity investment). In addition, Mr. Stavropoulos is a member of the University of Notre Dame Advisory Council for the College of Science, a Trustee of the Rollin L. Gerstacker Foundation, and a Director of the Naples Philharmonic Center for the Arts. Previously, Mr. Stavropoulos served as a Director of Chemical Financial Corporation (bank holding company, 1993-2012) and Tyco International, Ltd. (multinational manufacturing and services, 2007-2012). |
David M. Thomas (1949) |
Year of Election or Appointment: 2008 Trustee |
| Mr. Thomas also serves as Trustee of other Fidelity funds. Mr. Thomas serves as Non-Executive Chairman of the Board of Directors of Fortune Brands Home and Security (home and security products, 2011-present), and as a member of the Board of Directors of Interpublic Group of Companies, Inc. (marketing communication, 2004-present). Previously, Mr. Thomas served as Executive Chairman (2005-2006) and Chairman and Chief Executive Officer (2000-2005) of IMS Health, Inc. (pharmaceutical and healthcare information solutions), and a Director of Fortune Brands, Inc. (consumer products, 2000-2011). |
+ The information above includes each Trustee's principal occupation during the last five years and other information relating to the experience, attributes, and skills relevant to each Trustee's qualifications to serve as a Trustee, which led to the conclusion that each Trustee should serve as a Trustee for the fund.
Advisory Board Member and Executive Officers:
Correspondence intended for each executive officer and Peter S. Lynch may be sent to Fidelity Investments, 245 Summer Street, Boston, Massachusetts 02210. Executive officers appear below in alphabetical order.
Name, Year of Birth; Principal Occupation |
Peter S. Lynch (1944) |
Year of Election or Appointment: 2003 Member of the Advisory Board |
| Mr. Lynch also serves as Member of the Advisory Board of other Fidelity funds. Mr. Lynch is Vice Chairman and a Director of FMR and FMR Co., Inc. In addition, Mr. Lynch serves as a Trustee of Boston College and as the Chairman of the Inner-City Scholarship Fund. Previously, Mr. Lynch served on the Special Olympics International Board of Directors (1997-2006). |
Elizabeth Paige Baumann (1968) |
Year of Election or Appointment: 2012 Anti-Money Laundering (AML) Officer |
| Ms. Baumann also serves as AML Officer of other funds. She is Chief AML Officer of FMR LLC (2012-present) and is an employee of Fidelity Investments. Previously, Ms. Baumann served as Vice President and Deputy Anti-Money Laundering Officer (2007-2012). |
William C. Coffey (1969) |
Year of Election or Appointment: 2009 Assistant Secretary |
| Mr. Coffey also serves as Assistant Secretary of other funds. He is Senior Vice President and Deputy General Counsel of FMR LLC (2010-present), and is an employee of Fidelity Investments. Previously, Mr. Coffey served as Vice President and Associate General Counsel of FMR LLC (2005-2009). |
Jonathan Davis (1968) |
Year of Election or Appointment: 2010 Assistant Treasurer |
| Mr. Davis also serves as Assistant Treasurer of other funds. Mr. Davis is an employee of Fidelity Investments. Previously, Mr. Davis served as Vice President and Associate General Counsel of FMR LLC (2003-2010). |
Adrien E. Deberghes (1967) |
Year of Election or Appointment: 2008 Deputy Treasurer |
| Mr. Deberghes also serves as an officer of other funds. He is an employee of Fidelity Investments (2008-present). Prior to joining Fidelity Investments, Mr. Deberghes was Senior Vice President of Mutual Fund Administration at State Street Corporation (2007-2008), Senior Director of Mutual Fund Administration at Investors Bank & Trust (2005-2007), and Director of Finance for Dunkin' Brands (2000-2005). |
Stephanie J. Dorsey (1969) |
Year of Election or Appointment: 2010 Assistant Treasurer |
| Ms. Dorsey also serves as an officer of other funds. She is an employee of Fidelity Investments (2008-present) and has served in other fund officer roles. Prior to joining Fidelity Investments, Ms. Dorsey served as Treasurer (2004-2008) of the JPMorgan Mutual Funds and Vice President (2004-2008) of JPMorgan Chase Bank. |
Scott C. Goebel (1968) |
Year of Election or Appointment: 2008 Secretary and Chief Legal Officer (CLO) |
| Mr. Goebel serves as Secretary and CLO of other funds. Mr. Goebel also serves as Secretary of Fidelity Investments Money Management, Inc. (FIMM) (2010-present) and Fidelity Research and Analysis Company (FRAC) (2010-present); General Counsel, Secretary, and Senior Vice President of FMR (2008-present) and FMR Co., Inc. (2008-present); Chief Legal Officer of Fidelity Management & Research (Hong Kong) Limited (2008-present) and Assistant Secretary of Fidelity Management & Research (Japan) Inc. (2008-present), and Fidelity Management & Research (U.K.) Inc. (2008-present). Previously, Mr. Goebel served as Secretary and CLO of other Fidelity funds (2008-2013), Assistant Secretary of FIMM (2008-2010), FRAC (2008-2010), and certain funds (2007-2008); and as Vice President and Secretary of Fidelity Distributors Corporation (FDC) (2005-2007). Mr. Goebel has been employed by FMR LLC or an affiliate since 2001. |
Joseph A. Hanlon (1968) |
Year of Election or Appointment: 2012 Chief Compliance Officer |
| Mr. Hanlon also serves as Chief Compliance Officer of other funds. Mr. Hanlon serves as Compliance Officer of FMR, FMR Co., Inc., Fidelity Investments Money Management, Inc. (FIMM), Fidelity Research and Analysis Company (FRAC), and Fidelity Management & Research (Hong Kong) (2009-present), as Senior Vice President of the Fidelity Asset Management Division (2009-present), and is an employee of Fidelity Investments. Previously, Mr. Hanlon served as Compliance Officer of Fidelity Management & Research (Japan) Inc. (2009-2013), Strategic Advisers, Inc. (2009-2013), and Fidelity Management & Research (U.K.) Inc. (2009-2013). |
Bruce T. Herring (1965) |
Year of Election or Appointment: 2006 Vice President of certain Equity Funds |
| Mr. Herring also serves as Vice President of other funds. He serves as Chief Investment Officer of Fidelity Global Asset Allocation (GAA) (2013-present), Chief Investment Officer and Director of Fidelity Management & Research (U.K.) Inc. (2010-present), Group Chief Investment Officer of FMR, and President of Fidelity Research & Analysis Company (2010-present). Previously, Mr. Herring served as Vice President (2005-2006) and Senior Vice President (2006-2007) of Fidelity Management & Research Company, Vice President of FMR Co., Inc. (2001-2007), and as a portfolio manager for Fidelity U.S. Equity Funds. |
Brian B. Hogan (1964) |
Year of Election or Appointment: 2009 Vice President |
| Mr. Hogan also serves as Vice President of other funds. Mr. Hogan serves as President of FMR's Equity Division (2009-present). Previously, Mr. Hogan served as Senior Vice President, Equity Research of FMR (2006-2009) and as a portfolio manager. |
Chris Maher (1972) |
Year of Election or Appointment: 2013 Assistant Treasurer |
| Mr. Maher serves as Assistant Treasurer of other funds. Mr. Maher is Vice President of Valuation Oversight and is an employee of Fidelity Investments. Previously, Mr. Maher served as Vice President of Asset Management Compliance (2013), Vice President of FMR's Program Management Group (2010-2013), and Vice President of Valuation Oversight (2008-2010). |
Christine Reynolds (1958) |
Year of Election or Appointment: 2008 Chief Financial Officer |
| Ms. Reynolds also serves as Chief Financial Officer of other funds. Ms. Reynolds became President of Fidelity Pricing and Cash Management Services (FPCMS) in August 2008. Ms. Reynolds served as Chief Operating Officer of FPCMS (2007-2008). Previously, Ms. Reynolds served as President, Treasurer, and Anti-Money Laundering officer of the Fidelity funds (2004-2007). |
Kenneth B. Robins (1969) |
Year of Election or Appointment: 2008 President and Treasurer |
| Mr. Robins also serves as an officer of other funds. Mr. Robins serves as Executive Vice President of Fidelity Investments Money Management, Inc. (FIMM) (2013-present) and is an employee of Fidelity Investments (2004-present). Previously, Mr. Robins served in other fund officer roles. |
Gary W. Ryan (1958) |
Year of Election or Appointment: 2005 Assistant Treasurer |
| Mr. Ryan also serves as Assistant Treasurer of other funds. Mr. Ryan is an employee of Fidelity Investments and has served in other fund officer roles. Previously, Mr. Ryan served as Vice President of Fund Reporting in Fidelity Pricing and Cash Management Services (FPCMS) (1999-2005). |
Stephen Sadoski (1971) |
Year of Election or Appointment: 2012 Deputy Treasurer |
| Mr. Sadoski also serves as Deputy Treasurer of other funds. He is an employee of Fidelity Investments (2012-present) and has served in another fund officer role. Prior to joining Fidelity Investments, Mr. Sadoski served as an assistant chief accountant in the Division of Investment Management of the Securities and Exchange Commission (SEC) (2009-2012) and as a senior manager at Deloitte & Touche LLP (1997-2009). |
Stacie M. Smith (1974) |
Year of Election or Appointment: 2013 Deputy Treasurer |
| Ms. Smith also serves as an officer of other funds. She is an employee of Fidelity Investments (2009-present) and has served in other fund officer roles. Prior to joining Fidelity Investments, Ms. Smith served as Senior Audit Manager of Ernst & Young LLP (1996-2009). |
Renee Stagnone (1975) |
Year of Election or Appointment: 2013 Deputy Treasurer |
| Ms. Stagnone also serves as Deputy Treasurer of other funds. Ms. Stagnone is an employee of Fidelity Investments. |
Joseph F. Zambello (1957) |
Year of Election or Appointment: 2011 Deputy Treasurer |
| Mr. Zambello also serves as Deputy Treasurer of other funds. Mr. Zambello is an employee of Fidelity Investments. Previously, Mr. Zambello served as Vice President of FMR's Program Management Group (2009-2011) and Vice President of the Transfer Agent Oversight Group (2005-2009). |
Annual Report
The Board of Trustees of Fidelity Advisor International Discovery Fund voted to pay to shareholders of record at the opening of business on record date, the following distributions per share derived from capital gains realized from sales of portfolio securities, and dividends derived from net investment income:
| Pay Date | Record Date | Dividends | Capital Gains |
Class Z | 12/09/13 | 12/06/13 | $0.541 | $0.311 |
The fund will notify shareholders in January 2014 of amounts for use in preparing 2013 income tax returns.
Annual Report
Board Approval of Investment Advisory Contracts and Management Fees
Fidelity International Discovery Fund
Each year, the Board of Trustees, including the Independent Trustees (together, the Board), votes on the renewal of the management contract and sub-advisory agreements (together, the Advisory Contracts) for the fund. The Board, assisted by the advice of fund counsel and Independent Trustees' counsel, requests and considers a broad range of information relevant to the renewal of the Advisory Contracts throughout the year.
The Board meets regularly and, at each of its meetings, covers an extensive agenda of topics and materials and considers factors that are relevant to its annual consideration of the renewal of the fund's Advisory Contracts, including the services and support provided to the fund and its shareholders. The Board has established various standing committees, each composed of and chaired by Independent Trustees with varying backgrounds, to which the Board has assigned specific subject matter responsibilities in order to enhance effective decision-making by the Board. The Board, acting directly and through its Committees, requests and receives information concerning the annual consideration of the renewal of the fund's Advisory Contracts. The Board also meets as needed to consider matters specifically related to the Board's annual consideration of the renewal of Advisory Contracts. Members of the Board may also meet with trustees of other Fidelity funds through ad hoc joint committees to discuss certain matters relevant to the Fidelity funds.
At its July 2013 meeting, the Board, including the Independent Trustees, unanimously determined to renew the fund's Advisory Contracts. In reaching its determination, the Board considered all factors it believed relevant, including (i) the nature, extent, and quality of the services to be provided to the fund and its shareholders (including the investment performance of the fund); (ii) the competitiveness of the fund's management fee and total expense ratio relative to peer funds; (iii) the total costs of the services to be provided by and the profits to be realized by Fidelity from its relationship with the fund; (iv) the extent to which economies of scale exist and would be realized as the fund grows; and (v) whether fee levels reflect these economies of scale, if any, for the benefit of fund shareholders.
In considering whether to renew the Advisory Contracts for the fund, the Board reached a determination, with the assistance of fund counsel and Independent Trustees' counsel and through the exercise of its business judgment, that the renewal of the Advisory Contracts was in the best interests of the fund and its shareholders and that the compensation payable under the Advisory Contracts was fair and reasonable. The Board's decision to renew the Advisory Contracts was not based on any single factor, but rather was based on a comprehensive consideration of all the information provided to the Board at its meetings throughout the year. The Board, in reaching its determination to renew the Advisory Contracts, was aware that shareholders in the fund have a broad range of investment choices available to them, including a wide choice among mutual funds offered by Fidelity's competitors, and that the fund's shareholders, who have the opportunity to review and weigh the disclosure provided by the fund in its prospectus and other public disclosures, have chosen to invest in this fund, which is a part of the Fidelity family of funds.
Annual Report
Board Approval of Investment Advisory Contracts and
Management Fees - continued
Nature, Extent, and Quality of Services Provided. The Board considered the staffing within the investment adviser, Fidelity Management & Research Company (FMR), and the sub-advisers (together, the Investment Advisers) as it relates to the fund, including the backgrounds of the fund's investment personnel, and also considered the fund's investment objective, strategies, and related investment philosophy. The Independent Trustees also had discussions with senior management of Fidelity's investment operations and investment groups. The Board considered the structure of the portfolio manager compensation program and whether this structure provides appropriate incentives to act in the best interests of the fund.
Resources Dedicated to Investment Management and Support Services. The Board and the Fund Oversight and Research Committees reviewed the general qualifications and capabilities of the Investment Advisers' investment staff, including its size, education, experience, and resources, as well as the Investment Advisers' approach to recruiting, training, managing, and compensating investment personnel. The Board noted that FMR has continued to increase the resources devoted to non-U.S. offices, including expansion of Fidelity's global investment organization. The Board also noted that Fidelity's analysts have extensive resources, tools and capabilities that allow them to conduct sophisticated quantitative and fundamental analysis, as well as credit analysis of issuers, counterparties and guarantors. Further, the Board believes that Fidelity's investment professionals have sufficient access to global information and data so as to provide competitive investment results over time, and that those professionals also have access to sophisticated tools that permit them to assess portfolio construction and risk and performance attribution characteristics continuously, as well as to transmit new information and research conclusions rapidly around the world. Additionally, in its deliberations, the Board considered the Investment Advisers' trading and risk management capabilities and resources, which are an integral part of the investment management process.
Shareholder and Administrative Services. The Board considered (i) the nature, extent, quality, and cost of advisory, administrative, and shareholder services performed by the Investment Advisers and their affiliates under the Advisory Contracts and under separate agreements covering transfer agency, pricing and bookkeeping, and securities lending services for the fund; (ii) the nature and extent of the supervision of third party service providers, principally custodians and subcustodians; and (iii) the resources devoted to, and the record of compliance with, the fund's compliance policies and procedures. The Board also reviewed the allocation of fund brokerage, including allocations to brokers affiliated with the Investment Advisers, the use of brokerage commissions to pay fund expenses, and the use of "soft" commission dollars to pay for research services.
Annual Report
The Board noted that the growth of fund assets over time across the complex allows Fidelity to reinvest in the development of services designed to enhance the value or convenience of the Fidelity funds as investment vehicles. These services include 24-hour access to account information and market information through telephone representatives and over the Internet, investor education materials and asset allocation tools, and the expanded availability of Fidelity Investor Centers.
Investment in a Large Fund Family. The Board considered the benefits to shareholders of investing in a Fidelity fund, including the benefits of investing in a fund that is part of a large family of funds offering a variety of investment disciplines and providing a large variety of mutual fund investor services. The Board noted that Fidelity had taken, or had made recommendations that resulted in the Fidelity funds taking, a number of actions over the previous year that benefited particular funds, including (i) continuing to dedicate additional resources to investment research and to the support of the senior management team that oversees asset management; (ii) persisting in efforts to enhance Fidelity's global research capabilities; (iii) launching new funds and making other enhancements to meet client needs for global and income-oriented solutions; (iv) continuing to launch dedicated lower cost underlying funds to meet portfolio construction needs related to expanding underlying fund options for Fidelity funds of funds, specifically for the Freedom Fund product lines; (v) rationalizing product lines and gaining increased efficiencies through the mergers of several funds into other funds; (vi) strengthening Fidelity's index fund offerings by reducing investment minimums and adopting or lowering existing expense caps for certain funds and classes; (vii) enhancing Global Asset Allocation product offerings by launching new funds and strategies, including "open architecture" target date funds that utilize affiliated and unaffiliated sub-advisers; (viii) modifying the eligibility criteria for Institutional Class shares of Advisor funds to increase their marketability to a portion of the defined contribution plan market; (ix) creating a new low-cost retirement share class for certain Advisor funds to appeal to large retirement plans; (x) transitioning the management of certain Fidelity commodity funds to Geode Capital Management LLC, a registered commodity pool operator, while retaining administrative responsibilities for the funds; (xi) reorganizing a number of funds; and (xii) taking steps toward establishing a new Fidelity adviser to manage sector-based funds and products.
Investment Performance. The Board considered whether the fund has operated in accordance with its investment objective, as well as its record of compliance with its investment restrictions and its performance history.
The Board took into account discussions with the Investment Advisers about fund investment performance that occur at Board meetings throughout the year. In this regard the Board noted that as part of regularly scheduled fund reviews and other reports to the Board on fund performance, the Board periodically considers annualized return information for the fund, for different time periods, measured against a securities market index ("benchmark index") and a peer group of mutual funds with similar objectives ("peer group"). In its evaluation of fund investment performance, the Board gave particular attention to information indicating changes in performance of certain Fidelity funds for specific time periods and the Investment Advisers' explanations for any overperformance or underperformance.
Annual Report
Board Approval of Investment Advisory Contracts and
Management Fees - continued
In addition to reviewing absolute and relative fund performance, the Independent Trustees periodically consider the appropriateness of fund performance metrics in evaluating the results achieved. In general, the Independent Trustees believe that fund performance should be evaluated based on net performance (after fees and expenses) of both the highest performing and lowest performing classes, where applicable, compared to appropriate benchmark indices, over appropriate time periods which may include full market cycles, and compared to peer groups, as applicable, over the same periods, taking into account relevant factors including the following: general market conditions; issuer-specific information; tactical opportunities for investment; and fund cash flows and other factors.
The Independent Trustees recognize that shareholders evaluate performance on a net basis over their own holding periods, for which one-, three-, and five-year periods are used as a proxy. For this reason, the performance information reviewed by the Board also included net cumulative calendar year total return information for the fund and an appropriate benchmark index and peer group for the most recent one-, three-, and five-year periods, as shown below. Returns are shown compared to the 25th percentile (top of box) and 75th percentile (bottom of box) of the peer universe. Returns of the benchmark index are "net MA," i.e., adjusted for tax withholding rates applicable to U.S.-based mutual funds organized as Massachusetts business trusts.
Annual Report
Fidelity International Discovery Fund

The Board also considered that the fund's management fee is subject to upward or downward adjustment depending upon whether, and to what extent, the fund's investment performance for the performance period exceeds, or is exceeded by, a securities index, thus leading to a performance adjustment for the same period. The Board noted that the performance adjustment provides FMR with a strong economic incentive to seek to achieve superior performance for the fund's shareholders and helps to more closely align the interests of FMR and the fund's shareholders.
Based on its review, the Board concluded that the nature, extent, and quality of services provided to the fund under the Advisory Contracts should benefit the fund's shareholders.
Competitiveness of Management Fee and Total Expense Ratio. The Board considered the fund's management fee and total expense ratio compared to "mapped groups" of competitive funds and classes. Fidelity creates "mapped groups" by combining similar Lipper investment objective categories that have comparable management fee characteristics. Combining Lipper investment objective categories aids the Board's management fee and total expense ratio comparisons by broadening the competitive group used for comparison and by reducing the number of universes to which various Fidelity funds are compared.
Management Fee. The Board considered two proprietary management fee comparisons for the 12-month periods shown in the chart below. The group of Lipper funds used by the Board for management fee comparisons is referred to below as the "Total Mapped Group." The Total Mapped Group comparison focuses on a fund's standing in terms of gross management fees before expense reimbursements or caps, and without giving effect to the fund's performance adjustment, relative to the total universe of funds with comparable investment mandates, regardless of whether their management fee structures also are comparable. Funds with comparable investment mandates offer exposure to similar types of securities. Funds with comparable management fee structures have similar management fee contractual arrangements (e.g., flat rate charged for advisory services, all-inclusive fee rate, etc.). "TMG %" represents the percentage of funds in the Total Mapped Group that had management fees that were lower than the fund's. For example, a TMG % of 16% means that 84% of the funds in the Total Mapped Group had higher management fees than the fund. The "Asset-Size Peer Group" (ASPG) comparison focuses on a fund's standing relative to a subset of non-Fidelity funds within the Total Mapped Group that are similar in size and management fee structure. The ASPG represents at least 15% of the funds in the Total Mapped Group with comparable asset size and management fee structures, subject to a minimum of 50 funds (or all funds in the Total Mapped Group if fewer than 50). Additional information, such as the ASPG quartile in which the fund's management fee ranked and the impact of the fund's performance adjustment, is also included in the chart and considered by the Board.
Annual Report
Board Approval of Investment Advisory Contracts and
Management Fees - continued
Fidelity International Discovery Fund

The Board noted that the fund's management fee ranked below the median of its Total Mapped Group and below the median of its ASPG for 2012. The Board also noted the effect of the fund's positive performance adjustment on the fund's management fee ranking.
Annual Report
Based on its review, the Board concluded that the fund's management fee is fair and reasonable in light of the services that the fund receives and the other factors considered.
Total Expense Ratio. In its review of each class's total expense ratio, the Board considered the fund's management fee as well as other fund or class expenses, as applicable, such as transfer agent fees, pricing and bookkeeping fees, fund-paid 12b-1 fees, and custodial, legal, and audit fees. The Board also noted the effects of any waivers and reimbursements on fees and expenses, as well as the impact of the fund's performance adjustment. As part of its review, the Board also considered the current and historical total expense ratios of each class of the fund compared to competitive fund median expenses. Each class of the fund is compared to those funds and classes in the Total Mapped Group (used by the Board for management fee comparisons) that have a similar sales load structure.
The Board noted that the total expense ratio of each of Class A, Class B, Class C, Institutional Class, the retail class, and Class K ranked below its competitive median for 2012 and the total expense ratio of Class T ranked above its competitive median for 2012. The Board considered that, in general, various factors can affect total expense ratios. The Board noted that the total expense ratio of Class T was above the competitive median primarily because of higher 12b-1 fees on Class T. Class T has a higher 12b-1 fee, but a lower front-end sales charge, than traditionally priced front-end sales charge classes. The Board considered that Class T is primarily sold load-waived in the retirement plan market where its 0.50% 12b-1 fee is comparable to competing no-load, higher 12b-1 fee classes designed specifically for retirement plans. The Board noted that the fund offers multiple classes, each of which has a different sales load and 12b-1 fee structure, and that the multiple structures are intended to offer a range of pricing options for the intermediary market. The Board also noted that the total expense ratios of the classes vary primarily by the level of their 12b-1 fees, although differences in transfer agent fees may also cause expenses to vary from class to class.
Fees Charged to Other Fidelity Clients. The Board also considered Fidelity fee structures and other information with respect to clients of FMR and its affiliates, such as other mutual funds advised or subadvised by FMR or its affiliates, pension plan clients, and other institutional clients. The Board noted the findings of the 2013 ad hoc joint committee (created with the board of other Fidelity funds), which reviewed and compared Fidelity's institutional investment advisory business with its business of providing services to the Fidelity funds, including the differences in services provided, fees charged, and costs incurred, as well as competition in their respective marketplaces.
Based on its review of total expense ratios and fees charged to other Fidelity clients, the Board concluded that the total expense ratio of each class of the fund was reasonable, although Class T was above the median of the universe presented for comparison, in light of the services that the fund and its shareholders receive and the other factors considered.
Annual Report
Board Approval of Investment Advisory Contracts and
Management Fees - continued
Costs of the Services and Profitability. The Board considered the revenues earned and the expenses incurred by Fidelity in conducting the business of developing, marketing, distributing, managing, administering and servicing the fund and servicing the fund's shareholders. The Board also considered the level of Fidelity's profits in respect of all the Fidelity funds.
On an annual basis, FMR presents to the Board Fidelity's profitability for the fund. Fidelity calculates the profitability for each fund, as well as aggregate profitability for groups of Fidelity funds and all Fidelity funds, using a series of detailed revenue and cost allocation methodologies which originate with the books and records of Fidelity on which Fidelity's audited financial statements are based. The Audit Committee of the Board reviews any significant changes from the prior year's methodologies.
PricewaterhouseCoopers LLP (PwC), independent registered public accounting firm and auditor to Fidelity and certain Fidelity funds, has been engaged annually by the Board as part of the Board's assessment of Fidelity's profitability analysis. PwC's engagement includes the review and assessment of the methodologies used by Fidelity in determining the revenues and expenses attributable to Fidelity's mutual fund business, and completion of agreed-upon procedures surrounding the mathematical accuracy of fund profitability and its conformity to allocation methodologies. After considering PwC's reports issued under the engagement and information provided by Fidelity, the Board concluded that while other allocation methods may also be reasonable, Fidelity's profitability methodologies are reasonable in all material respects.
The Board also reviewed Fidelity's non-fund businesses and fall-out benefits related to the mutual fund business as well as cases where Fidelity's affiliates may benefit from or be related to the fund's business.
The Board considered the costs of the services provided by and the profits realized by Fidelity in connection with the operation of the fund and was satisfied that the profitability was not excessive in the circumstances.
Economies of Scale. The Board considered whether there have been economies of scale in respect of the management of the Fidelity funds, whether the Fidelity funds (including the fund) have appropriately benefited from any such economies of scale, and whether there is potential for realization of any further economies of scale. The Board considered the extent to which the fund will benefit from economies of scale through increased services to the fund, through waivers or reimbursements, or through fee or expense reductions. The Board also noted that in 2009, it and the board of other Fidelity funds created an ad hoc committee (the Economies of Scale Committee) to analyze whether FMR attains economies of scale in respect of the management and servicing of the Fidelity funds, whether the Fidelity funds have appropriately benefited from such economies of scale, and whether there is potential for realization of any further economies of scale.
Annual Report
The Board recognized that the fund's management contract incorporates a "group fee" structure, which provides for lower group fee rates as total fund assets under FMR's management increase, and for higher group fee rates as total fund assets under FMR's management decrease. FMR calculates the group fee rates based on a tiered asset "breakpoint" schedule that varies based on asset class. The Board considered that the group fee is designed to deliver the benefits of economies of scale to fund shareholders when total Fidelity fund assets increase, even if assets of any particular fund are unchanged or have declined, because some portion of Fidelity's costs are attributable to services provided to all Fidelity funds, and all funds benefit if those costs can be allocated among more assets. The Board concluded that, given the group fee structure, fund shareholders will benefit from lower management fees as assets under FMR's management increase at the fund complex level, regardless of whether Fidelity achieves any such economies of scale.
The Board concluded, taking into account the analysis of the Economies of Scale Committee, that economies of scale, if any, are being appropriately shared between fund shareholders and Fidelity.
Amendment to Description of Group Fee Rate. At its July 2013 meeting, the Board voted to approve an amendment to the fund's management contract to modify the description of the "group fee rate" effective August 1, 2013. The Board noted that under the prior description in the contract, the group fee rate was based on the average net assets of all registered investment companies with which FMR has management contracts. Under the contract's tiered asset breakpoint schedule, the group fee rate is lower as total fund assets under FMR's management increase, and higher as total fund assets under FMR's management decrease. The Board considered that the prior description would have excluded the assets of 64 Fidelity sector funds from the group fee rate calculation once Fidelity SelectCo, LLC, an affiliate of FMR, assumed management responsibilities for those funds. The Board noted that modifying the description of the group fee rate to continue to include the assets of those 64 funds for purposes of determining group fee rate breakpoints would avoid an immediate adverse impact on the group fee rate for any fund.
Additional Information Requested by the Board. In order to develop fully the factual basis for consideration of the Fidelity funds' Advisory Contracts, the Board requested and received additional information on certain topics, including: (i) fund performance trends and Fidelity's long-term strategies for certain funds; (ii) the potential to further rationalize the Fidelity fund lineup with the possibility of achieving savings for the funds and Fidelity; (iii) the methodology with respect to competitive fund data and peer group classifications; (iv) the arrangements with, and performance of, certain sub-advisers on behalf of the Fidelity funds, as well as certain proposed participating affiliate arrangements; (v) the realization of fall-out benefits in certain Fidelity business units; (vi) Fidelity's group fee structures, including the rationale for the individual fee rates of certain categories of funds and the definition of group assets; (vii) trends regarding industry use of performance fee structures and the performance adjustment methodologies applicable to the Fidelity funds; (viii) additional competitive analysis regarding the total expenses for certain classes; and (ix) fund profitability methodology, including Fidelity's cost allocation methodology, and the impact of certain factors on fund profitability results.
Annual Report
Board Approval of Investment Advisory Contracts and
Management Fees - continued
Based on its evaluation of all of the conclusions noted above, and after considering all factors it believed relevant, the Board ultimately concluded that the advisory fee structures are fair and reasonable, and that the fund's Advisory Contracts should be renewed.
Annual Report
Investment Adviser
Fidelity Management & Research Company
Boston, MA
Investment Sub-Advisers
FMR Co., Inc.
Fidelity Management & Research
(U.K.) Inc.
FIL Investment Advisors
FIL Investments (Japan) Limited
FIL Investment Advisors (UK) Limited
Fidelity Management & Research
(Hong Kong) Limited
Fidelity Management & Research
(Japan) Inc.
General Distributor
Fidelity Distributors Corporation
Smithfield, RI
Transfer and Service Agents
Fidelity Investments Institutional Operations Company, Inc.
Boston, MA
Fidelity Service Company, Inc.
Boston, MA
Custodian
The Northern Trust Company
Chicago, IL
(Fidelity Investment logo)(registered trademark)
AIDZ-UANN-1213
1.9585031.100
Fidelity®
International Small Cap
Fund
Annual Report
October 31, 2013
(Fidelity Cover Art)
Contents
Performance | (Click Here) | How the fund has done over time. |
Management's Discussion of Fund Performance | (Click Here) | The Portfolio Managers' review of fund performance and strategy. |
Shareholder Expense Example | (Click Here) | An example of shareholder expenses. |
Investment Changes | (Click Here) | A summary of major shifts in the fund's investments over the past six months. |
Investments | (Click Here) | A complete list of the fund's investments with their market values. |
Financial Statements | (Click Here) | Statements of assets and liabilities, operations, and changes in net assets, as well as financial highlights. |
Notes | (Click Here) | Notes to financial statements. |
Report of Independent Registered Public Accounting Firm | (Click Here) | |
Trustees and Officers | (Click Here) | |
Distributions | (Click Here) | |
Board Approval of Investment Advisory Contracts and Management Fees | (Click Here) | |
To view a fund's proxy voting guidelines and proxy voting record for the 12-month period ended June 30, visit http://www.fidelity.com/proxyvotingresults or visit the Securities and Exchange Commission's (SEC) web site at http://www.sec.gov. You may also call 1-800-544-8544 to request a free copy of the proxy voting guidelines.
Standard & Poor's, S&P and S&P 500 are registered service marks of The McGraw-Hill Companies, Inc. and have been licensed for use by Fidelity Distributors Corporation.
Other third-party marks appearing herein are the property of their respective owners.
All other marks appearing herein are registered or unregistered trademarks or service marks of FMR LLC or an affiliated company. © 2013 FMR LLC. All rights reserved.
Annual Report
This report and the financial statements contained herein are submitted for the general information of the shareholders of the fund. This report is not authorized for distribution to prospective investors in the fund unless preceded or accompanied by an effective prospectus.
A fund files its complete schedule of portfolio holdings with the SEC for the first and third quarters of each fiscal year on Form N-Q. Forms N-Q are available on the SEC's web site at http://www.sec.gov. A fund's Forms N-Q may be reviewed and copied at the SEC's Public Reference Room in Washington, DC. Information regarding the operation of the SEC's Public Reference Room may be obtained by calling 1-800-SEC-0330. For a complete list of a fund's portfolio holdings, view the most recent holdings listing, semiannual report, or annual report on Fidelity's web site at http://www.fidelity.com, http://www.advisor.fidelity.com, or http://www.401k.com, as applicable.
NOT FDIC INSURED • MAY LOSE VALUE • NO BANK GUARANTEE
Neither the fund nor Fidelity Distributors Corporation is a bank.
Annual Report
Average annual total return reflects the change in the value of an investment, assuming reinvestment of the class' distributions from dividend income and capital gains (the profits earned upon the sale of securities that have grown in value, if any) and assuming a constant rate of performance each year. The $10,000 table and the fund's returns do not reflect the deduction of taxes that a shareholder would pay on fund distributions or the redemption of fund shares. During periods of reimbursement by Fidelity, a fund's total return will be greater than it would be had the reimbursement not occurred. How a fund did yesterday is no guarantee of how it will do tomorrow.
Average Annual Total Returns
Periods ended October 31, 2013 | Past 1
year | Past 5
years | Past 10
years |
Fidelity® International Small Cap Fund | 36.56% | 19.77% | 11.56% |
$10,000 Over 10 Years
Let's say hypothetically that $10,000 was invested in Fidelity® International Small Cap Fund, a class of the fund, on October 31, 2003. The chart shows how the value of your investment would have changed, and also shows how the MSCI® EAFE® Small Cap Index performed over the same period.
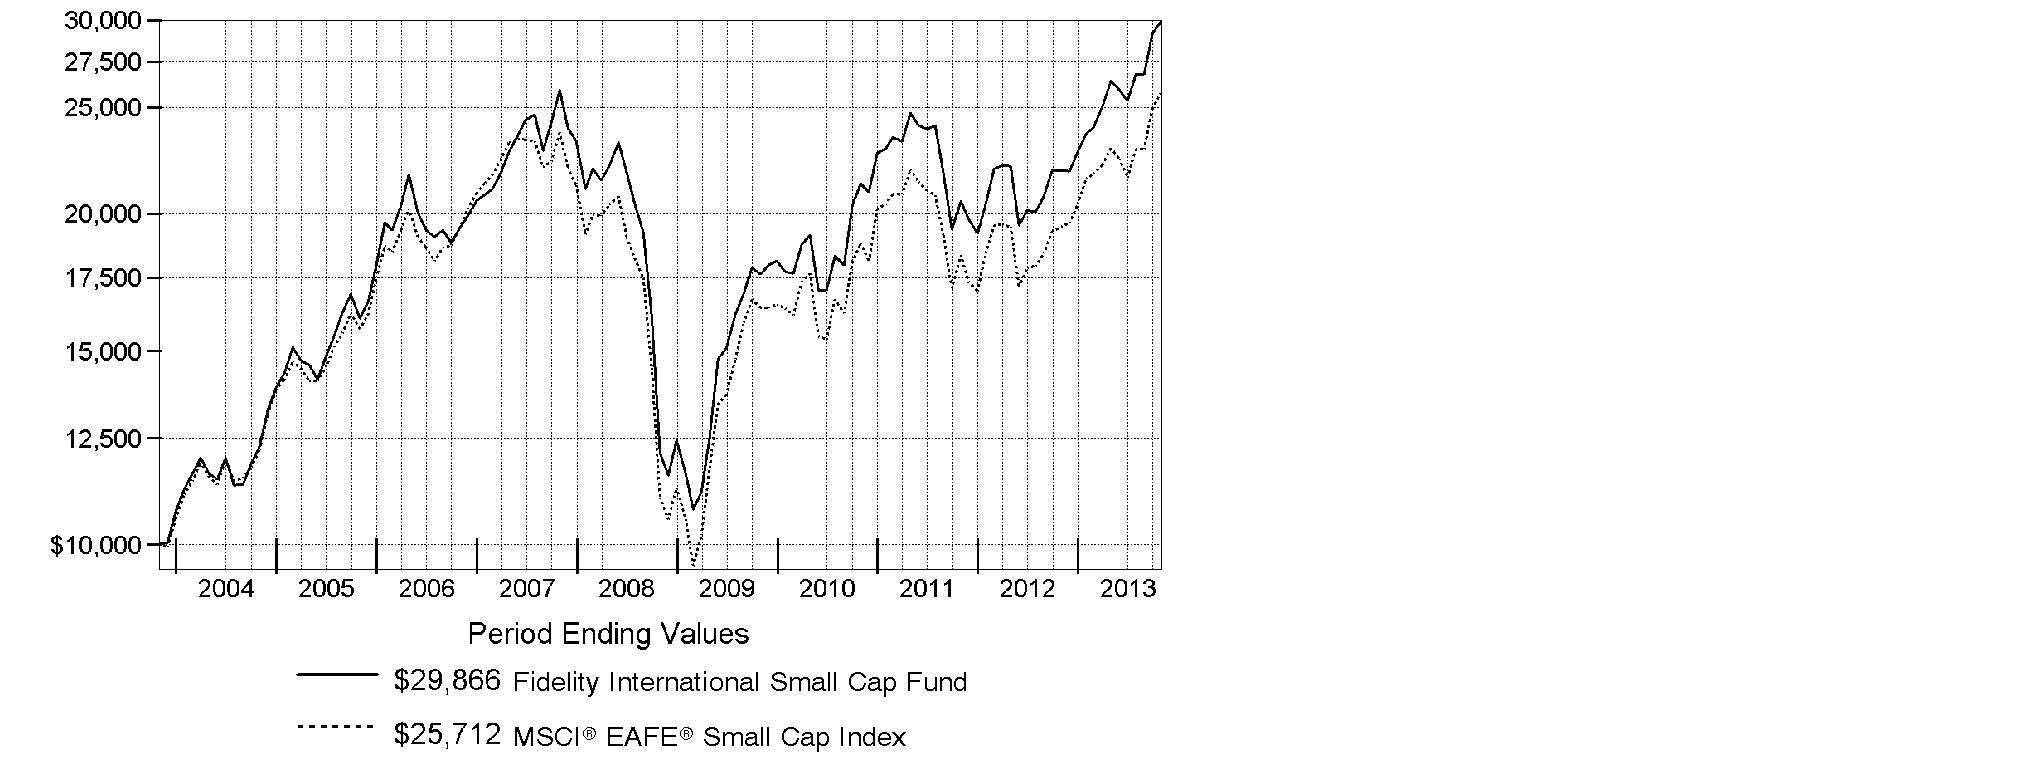
Annual Report
Market Recap: On balance, global equity markets remained upbeat for the 12-month period ending October 31, 2013. The MSCI® ACWI® (All Country World Index) Index gained 23.75% for the period, amid investor preference for higher-risk assets. The period was not without turbulence, however. In the spring and summer, central banks worldwide, especially in the U.S. and China, made clear their intentions to maintain accommodative monetary policies. That stance, combined with modest cyclical improvements around the globe and generally low valuations, underpinned the broad rally in equities. Europe (+32%) shone brightly, with most markets in the region - large and small - registering solid, index-beating gains. Another bright spot was Japan, which, despite a struggling yen and taking a second-half breather, posted a 34% result for the full year. The U.S. - by far the index's biggest constituent - also outperformed the global market with a roughly 28% advance. Meanwhile, Asia-Pacific ex Japan (+14%) lagged, hurt in part by a slowdown in Australia's mining industry as well as currency headwinds. Foreign-exchange and commodity weakness also curbed results in resource-heavy Canada and emerging markets (EM), both of which were up 7%. Country-level EM performance diverged meaningfully for the period, as evidenced by performance in Brazil (-1%), Russia (+12%), India (+1%) and China (+8%).
Comments from Colin Stone, Dale Nicholls and Nicholas Price, Co-Portfolio Managers of Fidelity® International Small Cap Fund: For the year, the fund's Retail Class shares returned 36.56%, surpassing the 32.33% gain of the MSCI® EAFE® Small Cap Index. The Japanese and Asia-Pacific ex Japan subportfolios outperformed their respective benchmarks by substantial margins, but the emerging Europe/Middle East/Africa (EMEA) sleeve trailed its benchmark, weighed down by security selection in materials and energy. Versus the index, a non-index stake in Dublin-based mineral sands miner Kenmare Resources detracted from the EMEA subportfolio's results, while one key contributor was U.K. online-only food retailer Ocado Group. In the Asia-Pacific ex Japan subportfolio, one positive was Sino Gas & Energy Holdings, an Australian exploration and production firm developing gas assets in China. On the negative side, relative performance suffered from not owning high-flying casino stock and Hong Kong benchmark component Melco International Development. In the Japanese subportfolio, our results were lifted by Pigeon, Japan's leading manufacturer of baby-care products. A non-index position in video game developer Nintendo worked against us, and I sold it in the first quarter of 2013.
The views expressed above reflect those of the portfolio manager(s) only through the end of the period as stated on the cover of this report and do not necessarily represent the views of Fidelity or any other person in the Fidelity organization. Any such views are subject to change at any time based upon market or other conditions and Fidelity disclaims any responsibility to update such views. These views may not be relied on as investment advice and, because investment decisions for a Fidelity fund are based on numerous factors, may not be relied on as an indication of trading intent on behalf of any Fidelity fund.
Annual Report
Shareholder Expense Example
As a shareholder of the Fund, you incur two types of costs: (1) transaction costs, including sales charges (loads) on purchase payments or redemption proceeds, redemption fees and (2) ongoing costs, including management fees, distribution and/or service (12b-1) fees and other Fund expenses. This Example is intended to help you understand your ongoing costs (in dollars) of investing in the Fund and to compare these costs with the ongoing costs of investing in other mutual funds.
The Example is based on an investment of $1,000 invested at the beginning of the period and held for the entire period (May 1, 2013 to October 31, 2013).
Actual Expenses
The first line of the accompanying table for each class of the Fund provides information about actual account values and actual expenses. You may use the information in this line, together with the amount you invested, to estimate the expenses that you paid over the period. Simply divide your account value by $1,000.00 (for example, an $8,600 account value divided by $1,000.00 = 8.6), then multiply the result by the number in the first line for a class of the Fund under the heading entitled "Expenses Paid During Period" to estimate the expenses you paid on your account during this period. A small balance maintenance fee of $12.00 that is charged once a year may apply for certain accounts with a value of less than $2,000. This fee is not included in the table below. If it was, the estimate of expenses you paid during the period would be higher, and your ending account value lower, by this amount. In addition, the Fund, as a shareholder in the underlying Fidelity Central Funds, will indirectly bear its pro-rata share of the fees and expenses incurred by the underlying Fidelity Central Funds. These fees and expenses are not included in the Fund's annualized expense ratio used to calculate the expense estimate in the table below.
Hypothetical Example for Comparison Purposes
The second line of the accompanying table for each class of the Fund provides information about hypothetical account values and hypothetical expenses based on a Class' actual expense ratio and an assumed rate of return of 5% per year before expenses, which is not the Class' actual return. The hypothetical account values and expenses may not be used to estimate the actual ending account balance or expenses you paid for the period. You may use this information to compare the ongoing costs of investing in the Fund and other funds. To do so, compare this 5% hypothetical example with the 5% hypothetical examples that appear in the shareholder reports of the other funds. A small balance maintenance fee of $12.00 that is charged once a year may apply for certain accounts with a value of less than $2,000. This fee is not included in the table below. If it was, the estimate of expenses you paid during the period would be higher, and your ending account value lower, by this amount. In addition, the Fund, as a shareholder in the underlying Fidelity Central Funds, will indirectly bear its pro-rata share of the fees and expenses incurred by the underlying Fidelity Central Funds. These fees and expenses are not included in the Fund's annualized expense ratio used to calculate the expense estimate in the table below.
Please note that the expenses shown in the table are meant to highlight your ongoing costs only and do not reflect any transaction costs. Therefore, the second line of the table is useful in comparing ongoing costs only, and will not help you determine the relative total costs of owning different funds. In addition, if these transactional costs were included, your costs would have been higher.
Annual Report
Shareholder Expense Example - continued
| Annualized
Expense RatioB | Beginning
Account Value
May 1, 2013 | Ending
Account Value
October 31, 2013 | Expenses Paid
During Period*
May 1, 2013
to October 31, 2013 |
Class A | 1.63% | | | |
Actual | | $ 1,000.00 | $ 1,129.50 | $ 8.75 |
HypotheticalA | | $ 1,000.00 | $ 1,016.99 | $ 8.29 |
Class T | 1.88% | | | |
Actual | | $ 1,000.00 | $ 1,128.00 | $ 10.08 |
HypotheticalA | | $ 1,000.00 | $ 1,015.73 | $ 9.55 |
Class B | 2.37% | | | |
Actual | | $ 1,000.00 | $ 1,125.30 | $ 12.70 |
HypotheticalA | | $ 1,000.00 | $ 1,013.26 | $ 12.03 |
Class C | 2.34% | | | |
Actual | | $ 1,000.00 | $ 1,125.30 | $ 12.54 |
HypotheticalA | | $ 1,000.00 | $ 1,013.41 | $ 11.88 |
International Small Cap | 1.33% | | | |
Actual | | $ 1,000.00 | $ 1,131.00 | $ 7.14 |
HypotheticalA | | $ 1,000.00 | $ 1,018.50 | $ 6.77 |
Institutional Class | 1.21% | | | |
Actual | | $ 1,000.00 | $ 1,131.50 | $ 6.50 |
HypotheticalA | | $ 1,000.00 | $ 1,019.11 | $ 6.16 |
A 5% return per year before expenses
B Annualized expense ratio reflects expenses net of applicable fee waivers.
* Expenses are equal to each Class' annualized expense ratio, multiplied by the average account value over the period, multiplied by 184/365 (to reflect the one-half year period).
Annual Report
Investment Changes (Unaudited)
Geographic Diversification (% of fund's net assets) |
As of October 31, 2013 |
 | Japan 26.4% | |
 | United Kingdom 18.0% | |
 | Germany 9.7% | |
 | United States of America* 5.6% | |
 | France 3.9% | |
 | Cayman Islands 3.4% | |
 | Australia 3.4% | |
 | Ireland 2.7% | |
 | Bermuda 2.6% | |
 | Other 24.3% | |

* Includes Short-Term Investments and Net Other Assets (Liabilities) |
Percentages are based on country or territory of incorporation and are adjusted for the effect of futures contracts, if applicable. |
As of April 30, 2013 |
| Japan 29.9% | |
| United Kingdom 18.9% | |
| Germany 7.6% | |
| Australia 4.7% | |
| United States of America* 4.1% | |
| Cayman Islands 3.4% | |
| France 3.3% | |
| Luxembourg 2.7% | |
| Singapore 2.6% | |
 | Other 22.8% | |

* Includes Short-Term Investments and Net Other Assets (Liabilities) |
Percentages are based on country or territory of incorporation and are adjusted for the effect of futures contracts, if applicable. |
Asset Allocation as of October 31, 2013 |
| % of fund's
net assets | % of fund's net assets
6 months ago |
Stocks | 94.3 | 95.8 |
Bonds | 0.2 | 0.2 |
Short-Term Investments and Net Other Assets (Liabilities) | 5.5 | 4.0 |
Top Ten Stocks as of October 31, 2013 |
| % of fund's
net assets | % of fund's net assets
6 months ago |
Tokyo Tatemono Co. Ltd. (Japan, Real Estate Management & Development) | 1.9 | 1.5 |
Pigeon Corp. (Japan, Household Products) | 1.7 | 2.0 |
Eurofins Scientific SA (Luxembourg, Life Sciences Tools & Services) | 1.4 | 1.4 |
Hokkaido Electric Power Co., Inc. (Japan, Electric Utilities) | 1.4 | 0.0 |
Aareal Bank AG (Germany, Thrifts & Mortgage Finance) | 1.3 | 0.0 |
Playtech Ltd. (Isle of Man, Software) | 1.2 | 1.3 |
Wirecard AG (Germany, IT Services) | 1.2 | 0.9 |
ASOS PLC (United Kingdom, Internet & Catalog Retail) | 1.2 | 1.1 |
Foster Electric Co. Ltd. (Japan, Household Durables) | 1.2 | 0.0 |
Stanley Electric Co. Ltd. (Japan, Auto Components) | 1.2 | 0.7 |
| 13.7 | |
Market Sectors as of October 31, 2013 |
| % of fund's
net assets | % of fund's net assets
6 months ago |
Consumer Discretionary | 22.5 | 23.0 |
Financials | 17.7 | 17.8 |
Industrials | 16.1 | 14.8 |
Information Technology | 14.4 | 16.1 |
Health Care | 8.7 | 8.6 |
Energy | 4.8 | 5.2 |
Materials | 4.7 | 5.4 |
Consumer Staples | 3.2 | 3.8 |
Utilities | 1.9 | 0.3 |
Telecommunication Services | 0.5 | 1.0 |
Annual Report
Investments October 31, 2013
Showing Percentage of Net Assets
Common Stocks - 93.6% |
| Shares | | Value |
Australia - 3.4% |
Acrux Ltd. | 381,062 | | $ 965,231 |
Alkane Resources Ltd. (a) | 911,891 | | 336,131 |
Austal Ltd. (a) | 3,050,012 | | 2,176,453 |
Base Resources Ltd. (a) | 750,579 | | 294,405 |
Beach Energy Ltd. | 1,213,515 | | 1,640,144 |
Berkeley Resources Ltd. (a) | 1,198,037 | | 294,404 |
Boart Longyear Ltd. (d) | 1,678,919 | | 682,337 |
Clinuvel Pharmaceuticals Ltd. (a)(d) | 325,070 | | 476,222 |
Dart Energy Ltd. (a)(d) | 10,057,900 | | 1,330,871 |
Donaco International Ltd. (d) | 2,061,089 | | 1,383,107 |
Goodman Group unit | 202,411 | | 968,022 |
Greencross Ltd. | 154,770 | | 958,140 |
iiNet Ltd. | 133,255 | | 818,649 |
Iluka Resources Ltd. | 80,327 | | 781,987 |
Independence Group NL | 244,610 | | 915,525 |
iProperty Group Ltd. (a) | 601,773 | | 1,035,154 |
Karoon Gas Australia Ltd. (a) | 452,184 | | 1,893,301 |
Maverick Drilling & Exploration Ltd. (a)(d) | 971,087 | | 468,090 |
Nanosonics Ltd. (a) | 1,384,184 | | 1,138,188 |
Navitas Ltd. | 273,638 | | 1,500,048 |
Neon Energy Ltd. (a) | 1,049,972 | | 287,791 |
NewSat Ltd. (a) | 2,252,414 | | 1,021,857 |
Normandy Mt. Leyshon Ltd. (a) | 1,907,227 | | 225,327 |
Prairie Downs Metals Ltd. (a) | 881,954 | | 291,753 |
Prana Biotechnology Ltd. (a)(d) | 2,224,059 | | 1,064,716 |
QRxPharma Ltd. (a)(d) | 249,195 | | 163,691 |
Ramsay Health Care Ltd. | 10,050 | | 368,552 |
SEEK Ltd. | 161,332 | | 1,980,753 |
Sierra Mining Ltd. (a) | 2,406,178 | | 648,147 |
Silver Lake Resources Ltd. (a) | 840,689 | | 611,824 |
Sino Gas & Energy Ltd. (a) | 22,392,147 | | 4,973,525 |
Sirtex Medical Ltd. | 98,794 | | 1,161,587 |
SomnoMed Ltd. (a) | 584,445 | | 684,961 |
Spark Infrastructure Group unit | 1,255,671 | | 2,011,622 |
Starpharma Holdings Ltd. (a) | 869,513 | | 735,529 |
Tiger Resources Ltd. (a) | 1,511,941 | | 564,459 |
Tissue Therapies Ltd. (a) | 2,581,301 | | 609,929 |
Troy Resources NL (d) | 289,032 | | 366,059 |
Vision Group Holdings Ltd. (a) | 1,221,604 | | 837,084 |
TOTAL AUSTRALIA | | 38,665,575 |
Common Stocks - continued |
| Shares | | Value |
Austria - 0.3% |
Ams AG | 30,950 | | $ 3,380,333 |
Bailiwick of Jersey - 1.9% |
Informa PLC | 1,067,014 | | 9,572,207 |
LXB Retail Properties PLC (a) | 1,426,200 | | 2,766,991 |
Regus PLC | 2,817,600 | | 9,265,884 |
TOTAL BAILIWICK OF JERSEY | | 21,605,082 |
Belgium - 0.1% |
EVS Broadcast Equipment SA | 24,123 | | 1,581,970 |
Bermuda - 2.6% |
APT Satellite Holdings Ltd. | 1,573,000 | | 1,710,356 |
Asia Satellite Telecommunications Holdings Ltd. | 271,000 | | 1,052,122 |
Biosensors International Group Ltd. | 1,016,000 | | 768,830 |
China Animal Healthcare Ltd. (a) | 2,129,000 | | 681,016 |
China Singyes Solar Tech Holdings Ltd. | 981,600 | | 1,064,782 |
Digital China Holdings Ltd. (H Shares) | 423,000 | | 555,416 |
Dukang Distillers Holdings Ltd. (a) | 2,072,000 | | 725,584 |
I.T Ltd. | 1,552,000 | | 472,426 |
Imagi International Holdings Ltd. (a) | 27,752,000 | | 332,895 |
Luk Fook Holdings International Ltd. | 612,000 | | 2,186,560 |
Oakley Capital Investments Ltd. (a) | 1,560,300 | | 4,396,887 |
Oriental Watch Holdings Ltd. | 1,540,000 | | 492,609 |
PAX Global Technology Ltd. (a) | 1,769,000 | | 748,397 |
Petra Diamonds Ltd. (a) | 2,255,500 | | 4,050,445 |
REXLot Holdings Ltd. | 10,075,000 | | 883,658 |
STELUX Holdings International | 2,958,000 | | 1,007,239 |
Vostok Nafta Investment Ltd. SDR | 818,000 | | 6,658,822 |
Vtech Holdings Ltd. | 154,900 | | 2,223,703 |
TOTAL BERMUDA | | 30,011,747 |
British Virgin Islands - 0.4% |
Kalahari Energy (a)(g) | 1,451,000 | | 15 |
Mail.Ru Group Ltd.: | | | |
GDR (f) | 112,800 | | 4,160,064 |
GDR (Reg. S) | 12,700 | | 468,376 |
TOTAL BRITISH VIRGIN ISLANDS | | 4,628,455 |
Canada - 0.6% |
Africa Oil Corp. (a) | 81,500 | | 723,819 |
Africa Oil Corp. (Sweden) (a) | 457,500 | | 4,059,575 |
AirSea Lines (a)(g) | 1,893,338 | | 26 |
Asanko Gold, Inc. (a) | 26,400 | | 62,034 |
Common Stocks - continued |
| Shares | | Value |
Canada - continued |
Mood Media Corp. (a) | 136,700 | | $ 86,531 |
Mood Media Corp. (United Kingdom) (a) | 1,139,822 | | 767,588 |
Mountain Province Diamonds, Inc. (a) | 254,200 | | 1,292,150 |
Rock Well Petroleum, Inc. (a)(g) | 770,400 | | 7 |
TOTAL CANADA | | 6,991,730 |
Cayman Islands - 3.4% |
21Vianet Group, Inc. ADR (a) | 42,300 | | 761,400 |
51job, Inc. sponsored ADR (a) | 19,200 | | 1,470,720 |
AirMedia Group, Inc. ADR (a) | 352,100 | | 595,049 |
Airtac International Group | 90,950 | | 658,140 |
AMVIG Holdings Ltd. | 764,000 | | 358,695 |
AutoNavi Holdings Ltd. ADR (a)(d) | 34,300 | | 530,278 |
Bitauto Holdings Ltd. ADR (a) | 120,000 | | 2,941,200 |
Bonjour Holdings Ltd. | 4,332,000 | | 938,702 |
Changshouhua Food Co. Ltd. | 872,000 | | 921,151 |
China Automation Group Ltd. | 1,872,000 | | 393,572 |
China High Precision Automation Group Ltd. | 712,000 | | 27,551 |
China Lilang Ltd. | 724,000 | | 467,850 |
China Lodging Group Ltd. ADR (a) | 26,500 | | 582,470 |
China Medical System Holdings Ltd. | 1,204,000 | | 1,082,404 |
China Metal International Holdings, Inc. | 2,522,000 | | 709,140 |
China Metal Recycling (Holdings) Ltd. (a) | 436,800 | | 1 |
China Outfitters Holdings Ltd. (d) | 1,888,000 | | 311,704 |
CNinsure, Inc. ADR (a) | 78,600 | | 381,210 |
Convenience Retail Asia Ltd. | 700,000 | | 487,553 |
EVA Precision Industrial Holdings Ltd. | 5,134,000 | | 735,037 |
Greatview Aseptic Pack Co. Ltd. | 1,196,000 | | 752,803 |
Haitian International Holdings Ltd. | 338,000 | | 814,374 |
Hop Hing Group Holdings Ltd. | 7,392,000 | | 314,634 |
Hutchison China Meditech Ltd. (a) | 77,117 | | 780,228 |
Integrated Waste Solutions Group Health Ltd. (a) | 2,055,000 | | 145,252 |
Kingdee International Software Group Co. Ltd. (a) | 1,564,400 | | 504,450 |
KongZhong Corp. sponsored ADR (a) | 56,200 | | 463,650 |
Lee's Pharmaceutical Holdings Ltd. | 1,155,000 | | 1,071,127 |
Marwyn Value Investors II Ltd. (a) | 2,130,100 | | 6,497,803 |
Ming Fai International Holdings Ltd. | 9,133,000 | | 1,001,296 |
Perfect World Co. Ltd. sponsored ADR Class B | 31,700 | | 555,701 |
Royale Furniture Holdings Ltd. | 10,111,437 | | 528,200 |
Shenguan Holdings Group Ltd. | 3,154,000 | | 1,407,564 |
SINA Corp. (a) | 6,100 | | 509,716 |
SITC International Holdings Co. Ltd. | 3,686,000 | | 1,559,407 |
Common Stocks - continued |
| Shares | | Value |
Cayman Islands - continued |
Sitoy Group Holdings Ltd. | 727,000 | | $ 398,523 |
SouFun Holdings Ltd. ADR | 51,000 | | 2,714,730 |
Vipshop Holdings Ltd. ADR (a)(d) | 12,600 | | 868,518 |
VST Holdings Ltd. | 2,767,600 | | 546,166 |
WuXi PharmaTech Cayman, Inc. sponsored ADR (a) | 42,300 | | 1,237,275 |
Xinyi Glass Holdings Ltd. | 1,670,000 | | 1,654,276 |
Yip's Chemical Holdings Ltd. | 592,000 | | 497,851 |
TOTAL CAYMAN ISLANDS | | 39,177,371 |
China - 0.1% |
Xinjiang Goldwind Science & Technology Co. Ltd. (H Shares) | 938,000 | | 958,205 |
Denmark - 0.1% |
ALK-Abello A/S | 6,657 | | 632,586 |
Finland - 1.1% |
Amer Group PLC (A Shares) | 274,500 | | 5,642,714 |
Rakentajain Konevuokraamo Oyj (B Shares) | 343,656 | | 6,873,002 |
TOTAL FINLAND | | 12,515,716 |
France - 3.9% |
ALTEN | 165,500 | | 7,498,493 |
Audika SA (a) | 113,900 | | 1,531,013 |
Ipsos SA | 128,172 | | 5,406,103 |
Sartorius Stedim Biotech | 53,000 | | 7,969,653 |
Sopra Group SA | 61,000 | | 5,335,442 |
SR Teleperformance SA | 178,251 | | 9,453,313 |
The Lisi Group | 52,800 | | 8,151,062 |
TOTAL FRANCE | | 45,345,079 |
Germany - 9.7% |
Aareal Bank AG (a) | 394,704 | | 15,179,633 |
AURELIUS AG | 136,500 | | 4,659,268 |
Brenntag AG | 40,600 | | 6,879,556 |
CANCOM AG | 49,600 | | 1,904,500 |
CENTROTEC Sustainable AG | 289,265 | | 7,201,063 |
CompuGROUP Holding AG | 199,511 | | 5,199,658 |
CTS Eventim AG | 199,177 | | 9,722,051 |
Deutz AG (a) | 903,600 | | 8,600,309 |
GFK AG | 195,601 | | 11,433,101 |
Ichor Coal NV (a) | 355,000 | | 1,928,005 |
Lanxess AG | 88,385 | | 6,221,045 |
MTU Aero Engines Holdings AG | 60,089 | | 6,003,902 |
Rational AG | 15,920 | | 4,885,076 |
Common Stocks - continued |
| Shares | | Value |
Germany - continued |
United Internet AG | 200,152 | | $ 7,908,111 |
Wirecard AG | 387,100 | | 14,114,586 |
TOTAL GERMANY | | 111,839,864 |
Hong Kong - 0.8% |
Dah Sing Banking Group Ltd. | 598,800 | | 1,129,170 |
Guotai Junan International Holdings Ltd. | 1,331,000 | | 569,963 |
Magnificent Estates Ltd. | 25,682,000 | | 1,242,197 |
Singamas Container Holdings Ltd. | 5,744,000 | | 1,340,983 |
Sinosoft Tech Group Ltd. | 1,164,000 | | 279,252 |
Techtronic Industries Co. Ltd. | 1,012,500 | | 2,546,595 |
Wing Hang Bank Ltd. | 153,000 | | 2,176,693 |
TOTAL HONG KONG | | 9,284,853 |
India - 0.8% |
Ahluwalia Contracts (India) Ltd. (a) | 230,314 | | 96,986 |
Britannia Industries Ltd. | 46,936 | | 715,609 |
MT Educare Ltd. | 211,299 | | 345,456 |
Page Industries Ltd. | 90,084 | | 6,535,563 |
Shriram City Union Finance Ltd. | 32,081 | | 526,501 |
Thangamayil Jewellery Ltd. | 173,245 | | 478,768 |
WABCO India Ltd. | 14,137 | | 388,238 |
TOTAL INDIA | | 9,087,121 |
Indonesia - 0.5% |
PT Clipan Finance Indonesia Tbk | 13,895,400 | | 517,723 |
PT Clipan Finance Indonesia Tbk warrants 10/7/14 (a) | 2,275,700 | | 6,460 |
PT Global Mediacom Tbk | 1,729,000 | | 292,958 |
PT Mayora Indah Tbk | 410,667 | | 1,067,419 |
PT Media Nusantara Citra Tbk | 5,091,500 | | 1,129,180 |
PT Mitra Adiperkasa Tbk | 801,000 | | 383,711 |
PT MNC Sky Vision Tbk (a) | 2,487,000 | | 512,951 |
PT Nippon Indosari Corpindo Tbk | 881,500 | | 484,832 |
PT Pembangunan Perumahan Persero Tbk | 4,982,500 | | 579,023 |
PT Tiga Pilar Sejahtera Food Tbk | 8,562,500 | | 1,002,656 |
TOTAL INDONESIA | | 5,976,913 |
Ireland - 2.7% |
Glanbia PLC | 168,000 | | 2,354,013 |
Kenmare Resources PLC (a) | 11,445,200 | | 3,734,476 |
Paddy Power PLC (Ireland) | 157,509 | | 12,831,471 |
Common Stocks - continued |
| Shares | | Value |
Ireland - continued |
Smurfit Kappa Group PLC | 287,600 | | $ 6,989,751 |
United Drug PLC (United Kingdom) | 992,400 | | 4,964,588 |
TOTAL IRELAND | | 30,874,299 |
Isle of Man - 2.4% |
Exillon Energy PLC (a) | 1,097,300 | | 4,187,398 |
IBS Group Holding Ltd. GDR (Reg. S) | 336,400 | | 9,086,984 |
Playtech Ltd. | 1,209,747 | | 14,285,952 |
TOTAL ISLE OF MAN | | 27,560,334 |
Israel - 0.1% |
Sarin Technologies Ltd. | 957,750 | | 1,464,921 |
Italy - 2.3% |
Brunello Cucinelli SpA | 123,985 | | 3,871,835 |
Prysmian SpA | 263,900 | | 6,449,584 |
Salvatore Ferragamo Italia SpA | 244,915 | | 8,393,142 |
YOOX SpA (a) | 209,800 | | 7,548,683 |
TOTAL ITALY | | 26,263,244 |
Japan - 26.4% |
Accordia Golf Co. Ltd. | 504,500 | | 5,536,995 |
ACOM Co. Ltd. (a) | 586,600 | | 2,296,933 |
AEON Financial Service Co. Ltd. (d) | 243,800 | | 7,487,160 |
AEON Mall Co. Ltd. | 66,550 | | 1,890,084 |
Amada Co. Ltd. | 610,000 | | 5,247,570 |
CAC Corp. | 47,400 | | 421,311 |
Career Design Center Co. Ltd. | 676 | | 800,696 |
Chugoku Electric Power Co., Inc. | 112,600 | | 1,726,008 |
Creek & River Co. Ltd. | 91,200 | | 392,559 |
Daiwa Industries Ltd. | 42,000 | | 264,291 |
en-japan, Inc. | 113,700 | | 2,539,549 |
Enigmo, Inc. (a)(d) | 48,400 | | 3,444,988 |
Foster Electric Co. Ltd. (d) | 705,400 | | 13,801,537 |
Fuji Corp. | 47,500 | | 783,216 |
Fuji Media Holdings, Inc. | 54,000 | | 1,076,510 |
Fujibo Holdings, Inc. | 464,000 | | 945,493 |
G-Tekt Corp. | 20,500 | | 605,963 |
H.I.S. Co. Ltd. | 92,600 | | 4,994,351 |
Hajime Construction Co. Ltd. (d) | 81,800 | | 5,640,232 |
Heiwa Corp. | 49,200 | | 824,899 |
Higashi Nihon House Co. Ltd. | 508,000 | | 2,715,643 |
Hokkaido Electric Power Co., Inc. (a) | 1,235,300 | | 15,913,286 |
Common Stocks - continued |
| Shares | | Value |
Japan - continued |
Hoshizaki Electric Co. Ltd. | 155,300 | | $ 5,690,961 |
Iida Home Max Co., Ltd. (d) | 107,000 | | 2,454,917 |
Iino Kaiun Kaisha Ltd. | 500,800 | | 3,298,120 |
ISE Chemical Corp. | 56,000 | | 484,012 |
ITC Networks Corp. | 28,700 | | 246,885 |
Iwatsuka Confectionary Co. Ltd. | 16,000 | | 825,210 |
JAFCO Co. Ltd. | 56,600 | | 2,838,507 |
Juki Corp. (a)(d) | 1,588,000 | | 2,998,722 |
Justsystems Corp. (a) | 69,100 | | 665,856 |
K's Denki Corp. | 141,100 | | 4,143,098 |
Kakaku.com, Inc. | 685,200 | | 13,252,683 |
Kanto Natural Gas Development | 72,000 | | 507,631 |
KAWAI Musical Instruments Manufacturing Co. Ltd. (d) | 523,000 | | 986,578 |
Koshidaka Holdings Co. Ltd. | 23,100 | | 813,634 |
Kotobuki Spirits Co. Ltd. | 15,300 | | 200,081 |
Kyushu Electric Power Co., Inc. (a) | 69,400 | | 977,140 |
Leopalace21 Corp. (a) | 1,331,600 | | 9,244,644 |
Mazda Motor Corp. (a) | 1,441,000 | | 6,486,674 |
N Field Co. Ltd. | 15,700 | | 1,744,507 |
Nichias Corp. | 501,000 | | 3,389,511 |
Nihon Nohyaku Co. Ltd. | 374,000 | | 4,482,832 |
Nikkiso Co. Ltd. | 549,000 | | 6,791,930 |
Nippon Koei Co. Ltd. | 70,000 | | 329,304 |
Nippon Seiki Co. Ltd. | 34,000 | | 554,333 |
Nippon Shinyaku Co. Ltd. | 345,000 | | 5,946,976 |
Nippon Yusen KK | 719,000 | | 2,196,902 |
Nitta Corp. | 157,400 | | 3,315,251 |
Nomura Real Estate Holdings, Inc. | 222,300 | | 5,624,508 |
NTT Urban Development Co. | 279,800 | | 3,571,744 |
ORIX Corp. | 679,400 | | 11,767,947 |
Pal Co. Ltd. | 68,700 | | 1,919,793 |
Parco Co. Ltd. | 41,700 | | 428,718 |
Pigeon Corp. | 373,100 | | 19,249,422 |
Pressance Corp. (d) | 23,100 | | 739,680 |
Rakuten, Inc. | 626,900 | | 8,168,282 |
Rohto Pharmaceutical Co. Ltd. | 130,000 | | 1,886,600 |
Sakata INX Corp. | 332,000 | | 3,151,073 |
San-Ai Oil Co. Ltd. | 97,000 | | 418,926 |
Sawada Holdings Co. Ltd. | 259,800 | | 2,439,741 |
Sega Sammy Holdings, Inc. | 248,000 | | 6,357,615 |
Shinkawa Ltd. | 52,000 | | 336,857 |
Shinko Kogyo Co. Ltd. | 268,900 | | 2,215,210 |
Common Stocks - continued |
| Shares | | Value |
Japan - continued |
Shinko Shoji Co. Ltd. | 2,900 | | $ 24,819 |
Shinsei Bank Ltd. | 133,000 | | 311,394 |
Sosei Group Corp. (a) | 113,900 | | 4,904,553 |
Sourcenext Corp. (a)(d) | 83,100 | | 688,377 |
Stanley Electric Co. Ltd. | 584,700 | | 13,600,715 |
Sumitomo Heavy Industries Ltd. | 1,196,000 | | 5,293,423 |
Takeuchi Manufacturing Co. Ltd. | 28,700 | | 605,375 |
Tohoku Electric Power Co., Inc. (a) | 134,200 | | 1,624,383 |
Tokyo Tatemono Co. Ltd. | 2,341,000 | | 21,977,316 |
Tokyu Fudosan Holdings Corp. (a) | 498,000 | | 4,918,312 |
Topcon Corp. | 541,300 | | 8,162,127 |
Toshiba Plant Systems & Services Corp. | 16,000 | | 282,310 |
Toyo Engineering Corp. | 218,000 | | 928,891 |
Uchiyama Holdings Co. Ltd. | 39,200 | | 1,177,753 |
VT Holdings Co. Ltd. | 54,100 | | 728,136 |
Welcia Holdings Co. Ltd. | 14,300 | | 865,000 |
WirelessGate, Inc. (a) | 24,200 | | 741,079 |
Yamaha Motor Co. Ltd. | 207,200 | | 3,173,994 |
Yamaya Corp. | 47,300 | | 681,356 |
TOTAL JAPAN | | 303,181,602 |
Korea (South) - 0.4% |
Daou Technology, Inc. | 133,650 | | 1,832,322 |
Koh Young Technology, Inc. | 23,358 | | 696,593 |
Korea Plant Service & Engineering Co. Ltd. | 7,274 | | 368,744 |
SBS Contents Hub Co. Ltd. | 31,723 | | 443,885 |
Soulbrain Co. Ltd. | 11,656 | | 582,097 |
WeMade Entertainment Co. Ltd. (a) | 9,761 | | 435,036 |
TOTAL KOREA (SOUTH) | | 4,358,677 |
Luxembourg - 2.6% |
AZ Electronic Materials SA | 1,117,200 | | 5,150,041 |
Eurofins Scientific SA | 58,899 | | 16,149,965 |
Grand City Properties SA (a) | 1,009,573 | | 8,106,602 |
TOTAL LUXEMBOURG | | 29,406,608 |
Malaysia - 0.1% |
JobStreet Corp. Bhd | 2,446,200 | | 1,666,190 |
Netherlands - 0.6% |
Yandex NV (a) | 175,600 | | 6,472,616 |
Norway - 1.6% |
Aker Solutions ASA (d) | 511,200 | | 7,067,261 |
Common Stocks - continued |
| Shares | | Value |
Norway - continued |
Norwegian Air Shuttle A/S (a)(d) | 46,500 | | $ 1,912,944 |
Schibsted ASA (B Shares) (d) | 73,100 | | 4,469,709 |
Sevan Drilling ASA (a)(d) | 4,908,300 | | 4,707,905 |
TOTAL NORWAY | | 18,157,819 |
Singapore - 2.3% |
Amtek Engineering Ltd. | 3,304,000 | | 1,276,703 |
Cordlife Group Ltd. | 1,021,000 | | 982,205 |
CSE Global Ltd. | 1,069,000 | | 813,239 |
Goodpack Ltd. | 1,541,000 | | 2,375,636 |
Mapletree Industrial (REIT) | 1,118,722 | | 1,247,327 |
OSIM International Ltd. | 1,092,000 | | 1,854,870 |
Pertama Holdings Ltd. (e) | 23,060,000 | | 12,066,495 |
Petra Foods Ltd. | 370,000 | | 1,057,398 |
Sino Grandness Food Industry Group Ltd. (a) | 3,087,000 | | 1,776,852 |
Venture Corp. Ltd. | 325,000 | | 2,035,502 |
Yoma Strategic Holdings Ltd. | 1,060,000 | | 652,793 |
TOTAL SINGAPORE | | 26,139,020 |
South Africa - 0.5% |
Blue Label Telecoms Ltd. | 6,485,319 | | 6,098,509 |
Sweden - 0.9% |
Avanza Bank Holding AB | 167,100 | | 5,376,556 |
Rezidor Hotel Group AB (a) | 942,170 | | 5,365,093 |
TOTAL SWEDEN | | 10,741,649 |
Switzerland - 2.5% |
Clariant AG (Reg.) | 159,700 | | 2,816,113 |
Julius Baer Group Ltd. | 113,210 | | 5,563,491 |
Meyer Burger Technology AG (a)(d) | 286,600 | | 3,363,961 |
Sika AG (Bearer) | 1,610 | | 5,076,553 |
Temenos Group AG | 75,008 | | 1,913,744 |
VZ Holding AG | 53,370 | | 9,587,601 |
TOTAL SWITZERLAND | | 28,321,463 |
Taiwan - 0.2% |
Merida Industry Co. Ltd. | 85,000 | | 643,961 |
Taiwan Hon Chuan Enterprise Co. Ltd. | 185,000 | | 389,672 |
Tong Hsing Electronics Industries Ltd. | 135,721 | | 716,990 |
TOTAL TAIWAN | | 1,750,623 |
Thailand - 0.2% |
Toyo-Thai Corp. PCL | 2,200,600 | | 2,722,027 |
Common Stocks - continued |
| Shares | | Value |
United Kingdom - 18.0% |
Amerisur Resources PLC (a)(d) | 5,712,324 | | $ 4,030,022 |
ASOS PLC (a) | 152,776 | | 13,889,291 |
Aveva Group PLC | 179,175 | | 7,429,299 |
Bond International Software PLC | 843,266 | | 1,270,967 |
Brammer PLC (d) | 1,302,600 | | 10,108,770 |
Brewin Dolphin Holding PLC | 980,163 | | 4,463,325 |
Cineworld Group PLC | 187,861 | | 1,116,760 |
Close Brothers Group PLC | 347,270 | | 7,043,681 |
Countrywide PLC | 778,100 | | 6,961,639 |
Craneware PLC | 813,500 | | 6,091,389 |
Devro PLC | 103,098 | | 522,867 |
Dicom Group PLC (a) | 1,215,200 | | 7,384,632 |
Foxtons Group PLC | 1,383,300 | | 7,069,822 |
Hunting PLC | 352,500 | | 5,041,571 |
IG Group Holdings PLC | 1,188,002 | | 11,686,208 |
Innovation Group PLC (a)(d) | 9,382,600 | | 4,776,489 |
International Personal Finance PLC | 870,900 | | 8,064,216 |
John Wood Group PLC | 470,700 | | 6,128,330 |
Johnson Matthey PLC | 106,195 | | 5,115,003 |
Keronite PLC (a)(g) | 13,620,267 | | 218 |
Lombard Medical Technologies PLC (a) | 1,260,400 | | 4,132,792 |
Moneysupermarket.com Group PLC | 4,001,600 | | 9,842,398 |
Mothercare PLC (a)(d) | 578,200 | | 3,550,739 |
Ocado Group PLC (a) | 913,800 | | 6,358,911 |
Perform Group PLC (a) | 701,700 | | 6,300,592 |
Petroceltic International PLC (a) | 1,117,274 | | 2,543,841 |
Pureprofile Media PLC (a)(g) | 1,108,572 | | 622,120 |
Regenersis PLC | 1,231,800 | | 5,075,925 |
Rockhopper Exploration PLC (a)(d) | 1,084,100 | | 2,516,111 |
Salamander Energy PLC (a) | 632,400 | | 1,087,504 |
Serco Group PLC | 683,068 | | 6,100,438 |
Silverdell PLC | 12,644,400 | | 1,550,963 |
Sinclair Pharma PLC (a)(d) | 8,403,003 | | 4,311,480 |
Sphere Medical Holding PLC (a) | 817,054 | | 373,368 |
Sthree PLC | 1,060,309 | | 6,111,858 |
Synergy Health PLC | 353,353 | | 5,875,292 |
Ted Baker PLC | 343,975 | | 9,414,609 |
TMO Renewables Ltd. (a)(g) | 1,000,000 | | 64,136 |
Travis Perkins PLC | 189,500 | | 5,639,350 |
Tungsten Corp. PLC | 1,150,600 | | 4,137,126 |
Wolfson Microelectronics PLC (a) | 1,463,200 | | 3,296,263 |
TOTAL UNITED KINGDOM | | 207,100,315 |
Common Stocks - continued |
| Shares | | Value |
United States of America - 0.1% |
CTC Media, Inc. | 4,300 | | $ 54,352 |
GI Dynamics, Inc. CDI (a) | 1,286,187 | | 972,512 |
Mudalla Technology, Inc. (Reg. S) (a) | 996,527 | | 16 |
YOU On Demand Holdings, Inc. (a) | 114,474 | | 203,764 |
YOU On Demand Holdings, Inc. warrants 8/30/17 (a) | 27,500 | | 0 |
TOTAL UNITED STATES OF AMERICA | | 1,230,644 |
TOTAL COMMON STOCKS (Cost $829,518,560) |
1,075,193,160
|
Nonconvertible Preferred Stocks - 0.7% |
| | | |
Brazil - 0.7% |
Alpargatas Sa (PN)
(Cost $7,863,928) | 1,125,920 | |
7,790,269
|
Convertible Bonds - 0.2% |
| Principal Amount | | |
Canada - 0.2% |
Caracal Energy, Inc. 12% 9/30/17 (g)
(Cost $1,400,000) | | $ 1,400,000 | |
1,775,964
|
Money Market Funds - 8.3% |
| Shares | | |
Fidelity Cash Central Fund, 0.09% (b) | 72,010,764 | | 72,010,764 |
Fidelity Securities Lending Cash Central Fund, 0.09% (b)(c) | 23,742,135 | | 23,742,135 |
TOTAL MONEY MARKET FUNDS (Cost $95,752,899) |
95,752,899
|
TOTAL INVESTMENT PORTFOLIO - 102.8% (Cost $934,535,387) | | 1,180,512,292 |
NET OTHER ASSETS (LIABILITIES) - (2.8)% | | (32,073,166) |
NET ASSETS - 100% | $ 1,148,439,126 |
Legend |
(a) Non-income producing |
(b) Affiliated fund that is generally available only to investment companies and other accounts managed by Fidelity Investments. The rate quoted is the annualized seven-day yield of the fund at period end. A complete unaudited listing of the fund's holdings as of its most recent quarter end is available upon request. In addition, each Fidelity Central Fund's financial statements, which are not covered by the Fund's Report of Independent Registered Public Accounting Firm, are available on the SEC's website or upon request. |
(c) Investment made with cash collateral received from securities on loan. |
(d) Security or a portion of the security is on loan at period end. |
(e) Affiliated company |
(f) Security exempt from registration under Rule 144A of the Securities Act of 1933. These securities may be resold in transactions exempt from registration, normally to qualified institutional buyers. At the end of the period, the value of these securities amounted to $4,160,064 or 0.4% of net assets. |
(g) Restricted securities - Investment in securities not registered under the Securities Act of 1933 (excluding 144A issues). At the end of the period, the value of restricted securities (excluding 144A issues) amounted to $2,462,486 or 0.2% of net assets. |
Additional information on each restricted holding is as follows: |
Security | Acquisition Date | Acquisition Cost |
AirSea Lines | 8/4/06 | $ 1,199,182 |
Caracal Energy, Inc. 12% 9/30/17 | 9/12/12 | $ 1,400,000 |
Kalahari Energy | 9/1/06 | $ 1,813,750 |
Keronite PLC | 8/16/06 | $ 1,548,992 |
Pureprofile Media PLC | 5/3/05 - 1/11/06 | $ 1,173,341 |
Rock Well Petroleum, Inc. | 4/13/06 | $ 1,004,171 |
TMO Renewables Ltd. | 10/27/05 | $ 535,065 |
Affiliated Central Funds |
Information regarding fiscal year to date income earned by the Fund from investments in Fidelity Central Funds is as follows: |
Fund | Income earned |
Fidelity Cash Central Fund | $ 46,779 |
Fidelity Securities Lending Cash Central Fund | 663,324 |
Total | $ 710,103 |
Other Affiliated Issuers |
An affiliated company is a company in which the Fund has ownership of at least 5% of the voting securities. Fiscal year to date transactions with companies which are or were affiliates are as follows: |
Affiliate | Value, beginning of period | Purchases | Sales Proceeds | Dividend Income | Value,
end of
period |
Pertama Holdings Ltd. | $ 9,679,226 | $ - | $ - | $ 380,584 | $ 12,066,495 |
Other Information |
Categorizations in the Schedule of Investments are based on country or territory of incorporation. |
The following is a summary of the inputs used, as of October 31, 2013, involving the Fund's assets and liabilities carried at fair value. The inputs or methodology used for valuing securities may not be an indication of the risk associated with investing in those securities. For more information on valuation inputs, and their aggregation into the levels used in the tables below, please refer to the Investment Valuation section in the accompanying Notes to Financial Statements. |
Valuation Inputs at Reporting Date: |
Description | Total | Level 1 | Level 2 | Level 3 |
Investments in Securities: | | | | |
Equities: | | | | |
Consumer Discretionary | $ 260,457,290 | $ 175,431,185 | $ 79,385,857 | $ 5,640,248 |
Consumer Staples | 35,660,497 | 13,839,428 | 21,821,069 | - |
Energy | 55,836,047 | 54,909,468 | 926,557 | 22 |
Financials | 202,565,947 | 125,742,740 | 74,368,290 | 2,454,917 |
Health Care | 96,487,666 | 72,296,566 | 24,126,964 | 64,136 |
Industrials | 185,406,536 | 143,921,432 | 39,788,645 | 1,696,459 |
Information Technology | 162,730,680 | 134,837,106 | 27,243,903 | 649,671 |
Materials | 56,242,264 | 47,559,887 | 8,117,917 | 564,460 |
Telecommunication Services | 5,344,063 | 4,602,984 | 741,079 | - |
Utilities | 22,252,439 | 2,011,622 | 20,240,817 | - |
Corporate Bonds | 1,775,964 | - | 1,775,964 | - |
Money Market Funds | 95,752,899 | 95,752,899 | - | - |
Total Investments in Securities: | $ 1,180,512,292 | $ 870,905,317 | $ 298,537,062 | $ 11,069,913 |
The following is a summary of transfers between Level 1 and Level 2 for the period ended October 31, 2013. Transfers are assumed to have occurred at the beginning of the period, and are primarily attributable to the valuation techniques used for foreign equity securities, as discussed in the accompanying Notes to Financial Statements: |
Transfers | Total |
Level 1 to Level 2 | $ 93,219,288 |
Level 2 to Level 1 | $ 85,883 |
Valuation Inputs at Reporting Date: |
The following is a reconciliation of Investments in Securities for which Level 3 inputs were used in determining value: |
Investments in Securities: | |
Beginning Balance | $ 17,107,640 |
Net Realized Gain (Loss) on Investment Securities | 1,980,820 |
Net Unrealized Gain (Loss) on Investment Securities | (322,938) |
Cost of Purchases | 1,698,025 |
Proceeds of Sales | (7,832,736) |
Amortization/Accretion | - |
Transfers into Level 3 | 9,518,328 |
Transfers out of Level 3 | (11,079,226) |
Ending Balance | $ 11,069,913 |
The change in unrealized gain (loss) for the period attributable to Level 3 securities held at October 31, 2013 | $ 715,199 |
The information used in the above reconciliation represents fiscal year to date activity for any Investments in Securities identified as using Level 3 inputs at either the beginning or the end of the current fiscal period. Transfers into Level 3 were attributable to a lack of observable market data resulting from decreases in market activity, decreases in liquidity, security restructurings or corporate actions. Transfers out of Level 3 were attributable to observable market data becoming available for those securities. Transfers in or out of Level 3 represent the beginning value of any Security or Instrument where a change in the pricing level occurred from the beginning to the end of the period. The cost of purchases and the proceeds of sales may include securities received or delivered through corporate actions or exchanges. Realized and unrealized gains (losses) disclosed in the reconciliation are included in Net Gain (Loss) on the Fund's Statement of Operations. |
See accompanying notes which are an integral part of the financial statements.
Annual Report
Statement of Assets and Liabilities
| October 31, 2013 |
| | |
Assets | | |
Investment in securities, at value (including securities loaned of $21,984,564) - See accompanying schedule: Unaffiliated issuers (cost $832,370,202) | $ 1,072,692,898 | |
Fidelity Central Funds (cost $95,752,899) | 95,752,899 | |
Other affiliated issuers (cost $6,412,286) | 12,066,495 | |
Total Investments (cost $934,535,387) | | $ 1,180,512,292 |
Cash | | 4,686 |
Foreign currency held at value (cost $22,233) | | 22,233 |
Receivable for investments sold | | 1,202,840 |
Receivable for fund shares sold | | 2,252,442 |
Dividends receivable | | 1,689,783 |
Interest receivable | | 190,702 |
Distributions receivable from Fidelity Central Funds | | 43,612 |
Prepaid expenses | | 3,042 |
Other receivables | | 40,069 |
Total assets | | 1,185,961,701 |
| | |
Liabilities | | |
Payable for investments purchased | $ 11,458,863 | |
Payable for fund shares redeemed | 1,058,399 | |
Accrued management fee | 834,071 | |
Distribution and service plan fees payable | 21,407 | |
Other affiliated payables | 245,715 | |
Other payables and accrued expenses | 161,985 | |
Collateral on securities loaned, at value | 23,742,135 | |
Total liabilities | | 37,522,575 |
| | |
Net Assets | | $ 1,148,439,126 |
Net Assets consist of: | | |
Paid in capital | | $ 940,719,067 |
Undistributed net investment income | | 4,006,124 |
Accumulated undistributed net realized gain (loss) on investments and foreign currency transactions | | (42,239,141) |
Net unrealized appreciation (depreciation) on investments and assets and liabilities in foreign currencies | | 245,953,076 |
Net Assets | | $ 1,148,439,126 |
See accompanying notes which are an integral part of the financial statements.
Annual Report
Financial Statements - continued
Statement of Assets and Liabilities - continued
| October 31, 2013 |
| | |
Calculation of Maximum Offering Price Class A:
Net Asset Value and redemption price per share ($24,020,321 ÷ 912,078 shares) | | $ 26.34 |
| | |
Maximum offering price per share (100/94.25 of $26.34) | | $ 27.95 |
Class T:
Net Asset Value and redemption price per share ($13,530,248 ÷ 516,960 shares) | | $ 26.17 |
| | |
Maximum offering price per share (100/96.50 of $26.17) | | $ 27.12 |
Class B:
Net Asset Value and offering price per share ($794,911 ÷ 30,729 shares)A | | $ 25.87 |
| | |
Class C:
Net Asset Value and offering price per share ($13,426,348 ÷ 522,739 shares)A | | $ 25.68 |
| | |
International Small Cap:
Net Asset Value, offering price and redemption price per share ($1,029,629,175 ÷ 38,611,059 shares) | | $ 26.67 |
| | |
Institutional Class:
Net Asset Value, offering price and redemption price per share ($67,038,123 ÷ 2,513,397 shares) | | $ 26.67 |
A Redemption price per share is equal to net asset value less any applicable contingent deferred sales charge.
See accompanying notes which are an integral part of the financial statements.
Annual Report
Statement of Operations
| Year ended October 31, 2013 |
| | |
Investment Income | | |
Dividends (including $380,584 earned from other affiliated issuers) | | $ 15,849,730 |
Interest | | 168,107 |
Income from Fidelity Central Funds | | 710,103 |
Income before foreign taxes withheld | | 16,727,940 |
Less foreign taxes withheld | | (804,542) |
Total income | | 15,923,398 |
| | |
Expenses | | |
Management fee
Basic fee | $ 7,352,833 | |
Performance adjustment | 929,023 | |
Transfer agent fees | 2,205,642 | |
Distribution and service plan fees | 192,174 | |
Accounting and security lending fees | 417,104 | |
Custodian fees and expenses | 278,409 | |
Independent trustees' compensation | 4,726 | |
Registration fees | 90,493 | |
Audit | 152,551 | |
Legal | 2,053 | |
Miscellaneous | 6,690 | |
Total expenses before reductions | 11,631,698 | |
Expense reductions | (142,371) | 11,489,327 |
Net investment income (loss) | | 4,434,071 |
Realized and Unrealized Gain (Loss) Net realized gain (loss) on: | | |
Investment securities: | | |
Unaffiliated issuers | 66,377,894 | |
Foreign currency transactions | (228,900) | |
Futures contracts | (80,042) | |
Total net realized gain (loss) | | 66,068,952 |
Change in net unrealized appreciation (depreciation) on: Investment securities (net of decrease in deferred foreign taxes of $185,408) | 198,876,160 | |
Assets and liabilities in foreign currencies | (867) | |
Total change in net unrealized appreciation (depreciation) | | 198,875,293 |
Net gain (loss) | | 264,944,245 |
Net increase (decrease) in net assets resulting from operations | | $ 269,378,316 |
See accompanying notes which are an integral part of the financial statements.
Annual Report
Financial Statements - continued
Statement of Changes in Net Assets
| Year ended
October 31,
2013 | Year ended
October 31,
2012 |
Increase (Decrease) in Net Assets | | |
Operations | | |
Net investment income (loss) | $ 4,434,071 | $ 4,511,101 |
Net realized gain (loss) | 66,068,952 | (4,142,955) |
Change in net unrealized appreciation (depreciation) | 198,875,293 | 42,574,576 |
Net increase (decrease) in net assets resulting
from operations | 269,378,316 | 42,942,722 |
Distributions to shareholders from net investment income | (4,769,550) | (8,016,423) |
Distributions to shareholders from net realized gain | (11,754,787) | (12,577,679) |
Total distributions | (16,524,337) | (20,594,102) |
Share transactions - net increase (decrease) | 162,217,941 | (204,187,386) |
Redemption fees | 119,206 | 102,611 |
Total increase (decrease) in net assets | 415,191,126 | (181,736,155) |
| | |
Net Assets | | |
Beginning of period | 733,248,000 | 914,984,155 |
End of period (including undistributed net investment income of $4,006,124 and undistributed net investment income of $4,511,102, respectively) | $ 1,148,439,126 | $ 733,248,000 |
See accompanying notes which are an integral part of the financial statements.
Annual Report
Financial Highlights - Class A
Years ended October 31, | 2013 | 2012 | 2011 | 2010 | 2009 |
Selected Per-Share Data | | | | | |
Net asset value, beginning of period | $ 19.74 | $ 18.97 | $ 20.42 | $ 17.28 | $ 11.91 |
Income from Investment Operations | | | | | |
Net investment income (loss) C | .06 | .06 | .10 | .03 | .06 |
Net realized and unrealized gain (loss) | 6.94 | 1.09 | (.88) | 3.51 | 5.31 |
Total from investment operations | 7.00 | 1.15 | (.78) | 3.54 | 5.37 |
Distributions from net investment income | (.07) | (.11) | (.02) | (.06) | - |
Distributions from net realized gain | (.33) | (.27) | (.66) | (.34) | - |
Total distributions | (.40) | (.38) | (.68) | (.40) | - |
Redemption fees added to paid in capital C | - G | - G | .01 | - G | - G |
Net asset value, end of period | $ 26.34 | $ 19.74 | $ 18.97 | $ 20.42 | $ 17.28 |
Total Return A, B | 36.18% | 6.28% | (4.00)% | 20.85% | 45.09% |
Ratios to Average Net Assets D, F | | | | | |
Expenses before reductions | 1.61% | 1.63% | 1.56% | 1.71% | 1.75% |
Expenses net of fee waivers, if any | 1.61% | 1.63% | 1.55% | 1.65% | 1.65% |
Expenses net of all reductions | 1.60% | 1.60% | 1.54% | 1.63% | 1.62% |
Net investment income (loss) | .25% | .32% | .49% | .16% | .41% |
Supplemental Data | | | | | |
Net assets, end of period (000 omitted) | $ 24,020 | $ 14,125 | $ 17,185 | $ 19,720 | $ 17,590 |
Portfolio turnover rate E | 54% | 68% | 47% | 66% | 81% |
A Total returns would have been lower if certain expenses had not been reduced during the applicable periods shown.
B Total returns do not include the effect of the sales charges.
C Calculated based on average shares outstanding during the period.
D Fees and expenses of any underlying Fidelity Central Funds are not included in the Fund's expense ratio. The Fund indirectly bears its proportionate share of the expenses of any underlying Fidelity Central Funds.
E Amount does not include the portfolio activity of any underlying Fidelity Central Funds.
F Expense ratios reflect operating expenses of the class. Expenses before reductions do not reflect amounts reimbursed by the investment adviser or reductions from brokerage service arrangements or reductions from other expense offset arrangements and do not represent the amount paid by the class during periods when reimbursements or reductions occur. Expenses net of fee waivers reflect expenses after reimbursement by the investment adviser but prior to reductions from brokerage service arrangements or other expense offset arrangements. Expenses net of all reductions represent the net expenses paid by the class.
G Amount represents less than $.01 per share.
See accompanying notes which are an integral part of the financial statements.
Annual Report
Financial Highlights - Class T
Years ended October 31, | 2013 | 2012 | 2011 | 2010 | 2009 |
Selected Per-Share Data | | | | | |
Net asset value, beginning of period | $ 19.59 | $ 18.80 | $ 20.23 | $ 17.14 | $ 11.84 |
Income from Investment Operations | | | | | |
Net investment income (loss) C | - G | .01 | .05 | (.02) | .02 |
Net realized and unrealized gain (loss) | 6.90 | 1.08 | (.86) | 3.47 | 5.28 |
Total from investment operations | 6.90 | 1.09 | (.81) | 3.45 | 5.30 |
Distributions from net investment income | - | (.03) | - | (.02) | - |
Distributions from net realized gain | (.32) | (.27) | (.63) | (.34) | - |
Total distributions | (.32) | (.30) | (.63) | (.36) | - |
Redemption fees added to paid in capital C | - G | - G | .01 | - G | - G |
Net asset value, end of period | $ 26.17 | $ 19.59 | $ 18.80 | $ 20.23 | $ 17.14 |
Total Return A, B | 35.80% | 5.97% | (4.18)% | 20.46% | 44.76% |
Ratios to Average Net Assets D, F | | | | | |
Expenses before reductions | 1.87% | 1.88% | 1.82% | 1.97% | 2.00% |
Expenses net of fee waivers, if any | 1.87% | 1.88% | 1.81% | 1.90% | 1.90% |
Expenses net of all reductions | 1.85% | 1.85% | 1.79% | 1.88% | 1.86% |
Net investment income (loss) | (.01)% | .07% | .24% | (.09)% | .16% |
Supplemental Data | | | | | |
Net assets, end of period (000 omitted) | $ 13,530 | $ 9,262 | $ 13,744 | $ 16,092 | $ 15,760 |
Portfolio turnover rate E | 54% | 68% | 47% | 66% | 81% |
A Total returns would have been lower if certain expenses had not been reduced during the applicable periods shown.
B Total returns do not include the effect of the sales charges.
C Calculated based on average shares outstanding during the period.
D Fees and expenses of any underlying Fidelity Central Funds are not included in the Fund's expense ratio. The Fund indirectly bears its proportionate share of the expenses of any underlying Fidelity Central Funds.
E Amount does not include the portfolio activity of any underlying Fidelity Central Funds.
F Expense ratios reflect operating expenses of the class. Expenses before reductions do not reflect amounts reimbursed by the investment adviser or reductions from brokerage service arrangements or reductions from other expense offset arrangements and do not represent the amount paid by the class during periods when reimbursements or reductions occur. Expenses net of fee waivers reflect expenses after reimbursement by the investment adviser but prior to reductions from brokerage service arrangements or other expense offset arrangements. Expenses net of all reductions represent the net expenses paid by the class.
G Amount represents less than $.01 per share.
See accompanying notes which are an integral part of the financial statements.
Annual Report
Financial Highlights - Class B
Years ended October 31, | 2013 | 2012 | 2011 | 2010 | 2009 |
Selected Per-Share Data | | | | | |
Net asset value, beginning of period | $ 19.22 | $ 18.38 | $ 19.79 | $ 16.78 | $ 11.65 |
Income from Investment Operations | | | | | |
Net investment income (loss) C | (.11) | (.08) | (.05) | (.10) | (.04) |
Net realized and unrealized gain (loss) | 6.84 | 1.07 | (.85) | 3.39 | 5.17 |
Total from investment operations | 6.73 | .99 | (.90) | 3.29 | 5.13 |
Distributions from net realized gain | (.08) | (.15) | (.52) | (.28) | - |
Redemption fees added to paid in capital C | - G | - G | .01 | - G | - G |
Net asset value, end of period | $ 25.87 | $ 19.22 | $ 18.38 | $ 19.79 | $ 16.78 |
Total Return A, B | 35.14% | 5.45% | (4.68)% | 19.90% | 44.03% |
Ratios to Average Net Assets D, F | | | | | |
Expenses before reductions | 2.37% | 2.38% | 2.32% | 2.47% | 2.49% |
Expenses net of fee waivers, if any | 2.36% | 2.38% | 2.30% | 2.40% | 2.40% |
Expenses net of all reductions | 2.35% | 2.35% | 2.29% | 2.38% | 2.36% |
Net investment income (loss) | (.51)% | (.43)% | (.26)% | (.59)% | (.33)% |
Supplemental Data | | | | | |
Net assets, end of period (000 omitted) | $ 795 | $ 790 | $ 2,067 | $ 3,457 | $ 3,601 |
Portfolio turnover rate E | 54% | 68% | 47% | 66% | 81% |
A Total returns would have been lower if certain expenses had not been reduced during the applicable periods shown.
B Total returns do not include the effect of the contingent deferred sales charge.
C Calculated based on average shares outstanding during the period.
D Fees and expenses of any underlying Fidelity Central Funds are not included in the Fund's expense ratio. The Fund indirectly bears its proportionate share of the expenses of any underlying Fidelity Central Funds.
E Amount does not include the portfolio activity of any underlying Fidelity Central Funds.
F Expense ratios reflect operating expenses of the class. Expenses before reductions do not reflect amounts reimbursed by the investment adviser or reductions from brokerage service arrangements or reductions from other expense offset arrangements and do not represent the amount paid by the class during periods when reimbursements or reductions occur. Expenses net of fee waivers reflect expenses after reimbursement by the investment adviser but prior to reductions from brokerage service arrangements or other expense offset arrangements. Expenses net of all reductions represent the net expenses paid by the class.
G Amount represents less than $.01 per share.
See accompanying notes which are an integral part of the financial statements.
Annual Report
Financial Highlights - Class C
Years ended October 31, | 2013 | 2012 | 2011 | 2010 | 2009 |
Selected Per-Share Data | | | | | |
Net asset value, beginning of period | $ 19.18 | $ 18.38 | $ 19.85 | $ 16.85 | $ 11.70 |
Income from Investment Operations | | | | | |
Net investment income (loss) C | (.11) | (.08) | (.04) | (.10) | (.04) |
Net realized and unrealized gain (loss) | 6.79 | 1.07 | (.85) | 3.40 | 5.19 |
Total from investment operations | 6.68 | .99 | (.89) | 3.30 | 5.15 |
Distributions from net realized gain | (.18) | (.19) | (.59) | (.30) | - |
Redemption fees added to paid in capital C | - G | - G | .01 | - G | - G |
Net asset value, end of period | $ 25.68 | $ 19.18 | $ 18.38 | $ 19.85 | $ 16.85 |
Total Return A, B | 35.15% | 5.46% | (4.64)% | 19.86% | 44.02% |
Ratios to Average Net Assets D, F | | | | | |
Expenses before reductions | 2.33% | 2.38% | 2.27% | 2.42% | 2.49% |
Expenses net of fee waivers, if any | 2.33% | 2.38% | 2.26% | 2.40% | 2.40% |
Expenses net of all reductions | 2.32% | 2.35% | 2.24% | 2.37% | 2.36% |
Net investment income (loss) | (.47)% | (.43)% | (.21)% | (.59)% | (.33)% |
Supplemental Data | | | | | |
Net assets, end of period (000 omitted) | $ 13,426 | $ 6,799 | $ 9,545 | $ 13,501 | $ 5,814 |
Portfolio turnover rate E | 54% | 68% | 47% | 66% | 81% |
A Total returns would have been lower if certain expenses had not been reduced during the applicable periods shown.
B Total returns do not include the effect of the contingent deferred sales charge.
C Calculated based on average shares outstanding during the period.
D Fees and expenses of any underlying Fidelity Central Funds are not included in the Fund's expense ratio. The Fund indirectly bears its proportionate share of the expenses of any underlying Fidelity Central Funds.
E Amount does not include the portfolio activity of any underlying Fidelity Central Funds.
F Expense ratios reflect operating expenses of the class. Expenses before reductions do not reflect amounts reimbursed by the investment adviser or reductions from brokerage service arrangements or reductions from other expense offset arrangements and do not represent the amount paid by the class during periods when reimbursements or reductions occur. Expenses net of fee waivers reflect expenses after reimbursement by the investment adviser but prior to reductions from brokerage service arrangements or other expense offset arrangements. Expenses net of all reductions represent the net expenses paid by the class.
G Amount represents less than $.01 per share.
See accompanying notes which are an integral part of the financial statements.
Annual Report
Financial Highlights - International Small Cap
Years ended October 31, | 2013 | 2012 | 2011 | 2010 | 2009 |
Selected Per-Share Data | | | | | |
Net asset value, beginning of period | $ 19.99 | $ 19.23 | $ 20.66 | $ 17.48 | $ 12.03 |
Income from Investment Operations | | | | | |
Net investment income (loss) B | .12 | .11 | .17 | .07 | .08 |
Net realized and unrealized gain (loss) | 7.02 | 1.10 | (.89) | 3.53 | 5.37 |
Total from investment operations | 7.14 | 1.21 | (.72) | 3.60 | 5.45 |
Distributions from net investment income | (.14) | (.18) | (.06) | (.08) | - |
Distributions from net realized gain | (.33) | (.27) | (.66) | (.34) | - |
Total distributions | (.46) G | (.45) | (.72) | (.42) | - |
Redemption fees added to paid in capital B | - F | - F | .01 | - F | - F |
Net asset value, end of period | $ 26.67 | $ 19.99 | $ 19.23 | $ 20.66 | $ 17.48 |
Total Return A | 36.56% | 6.55% | (3.65)% | 21.02% | 45.30% |
Ratios to Average Net Assets C, E | | | | | |
Expenses before reductions | 1.33% | 1.35% | 1.26% | 1.44% | 1.48% |
Expenses net of fee waivers, if any | 1.32% | 1.35% | 1.25% | 1.44% | 1.48% |
Expenses net of all reductions | 1.31% | 1.33% | 1.23% | 1.42% | 1.44% |
Net investment income (loss) | .53% | .59% | .80% | .37% | .58% |
Supplemental Data | | | | | |
Net assets, end of period (000 omitted) | $ 1,029,629 | $ 692,769 | $ 856,692 | $ 808,478 | $ 669,035 |
Portfolio turnover rate D | 54% | 68% | 47% | 66% | 81% |
A Total returns would have been lower if certain expenses had not been reduced during the applicable periods shown.
B Calculated based on average shares outstanding during the period.
C Fees and expenses of any underlying Fidelity Central Funds are not included in the Fund's expense ratio. The Fund indirectly bears its proportionate share of the expenses of any underlying Fidelity Central Funds.
D Amount does not include the portfolio activity of any underlying Fidelity Central Funds.
E Expense ratios reflect operating expenses of the class. Expenses before reductions do not reflect amounts reimbursed by the investment adviser or reductions from brokerage service arrangements or reductions from other expense offset arrangements and do not represent the amount paid by the class during periods when reimbursements or reductions occur. Expenses net of fee waivers reflect expenses after reimbursement by the investment adviser but prior to reductions from brokerage service arrangements or other expense offset arrangements. Expenses net of all reductions represent the net expenses paid by the class.
F Amount represents less than $.01 per share.
G Total distributions of $.46 per share is comprised of distributions from net investment income of $.136 and distributions from net realized gain of $.327 per share.
See accompanying notes which are an integral part of the financial statements.
Annual Report
Financial Highlights - Institutional Class
Years ended October 31, | 2013 | 2012 | 2011 | 2010 | 2009 |
Selected Per-Share Data | | | | | |
Net asset value, beginning of period | $ 20.00 | $ 19.24 | $ 20.66 | $ 17.47 | $ 12.01 |
Income from Investment Operations | | | | | |
Net investment income (loss) B | .16 | .13 | .18 | .09 | .09 |
Net realized and unrealized gain (loss) | 7.00 | 1.10 | (.89) | 3.53 | 5.37 |
Total from investment operations | 7.16 | 1.23 | (.71) | 3.62 | 5.46 |
Distributions from net investment income | (.16) | (.20) | (.06) | (.09) | - |
Distributions from net realized gain | (.33) | (.27) | (.66) | (.34) | - |
Total distributions | (.49) | (.47) | (.72) | (.43) | - |
Redemption fees added to paid in capital B | - F | - F | .01 | - F | - F |
Net asset value, end of period | $ 26.67 | $ 20.00 | $ 19.24 | $ 20.66 | $ 17.47 |
Total Return A | 36.68% | 6.65% | (3.62)% | 21.15% | 45.46% |
Ratios to Average Net Assets C, E | | | | | |
Expenses before reductions | 1.20% | 1.25% | 1.22% | 1.34% | 1.45% |
Expenses net of fee waivers, if any | 1.20% | 1.25% | 1.21% | 1.34% | 1.40% |
Expenses net of all reductions | 1.18% | 1.22% | 1.19% | 1.31% | 1.37% |
Net investment income (loss) | .66% | .70% | .84% | .47% | .66% |
Supplemental Data | | | | | |
Net assets, end of period (000 omitted) | $ 67,038 | $ 9,503 | $ 15,752 | $ 8,231 | $ 2,696 |
Portfolio turnover rate D | 54% | 68% | 47% | 66% | 81% |
A Total returns would have been lower if certain expenses had not been reduced during the applicable periods shown.
B Calculated based on average shares outstanding during the period.
C Fees and expenses of any underlying Fidelity Central Funds are not included in the Fund's expense ratio. The Fund indirectly bears its proportionate share of the expenses of any underlying Fidelity Central Funds.
D Amount does not include the portfolio activity of any underlying Fidelity Central Funds.
E Expense ratios reflect operating expenses of the class. Expenses before reductions do not reflect amounts reimbursed by the investment adviser or reductions from brokerage service arrangements or reductions from other expense offset arrangements and do not represent the amount paid by the class during periods when reimbursements or reductions occur. Expenses net of fee waivers reflect expenses after reimbursement by the investment adviser but prior to reductions from brokerage service arrangements or other expense offset arrangements. Expenses net of all reductions represent the net expenses paid by the class.
F Amount represents less than $.01 per share.
See accompanying notes which are an integral part of the financial statements.
Annual Report
Notes to Financial Statements
For the period ended October 31, 2013
1. Organization.
Fidelity International Small Cap Fund (the Fund) is a fund of Fidelity Investment Trust (the Trust) and is authorized to issue an unlimited number of shares. The Trust is registered under the Investment Company Act of 1940, as amended (the 1940 Act), as an open-end management investment company organized as a Massachusetts business trust. The Fund offers Class A, Class T, Class C, International Small Cap and Institutional Class shares, each of which, along with Class B shares, has equal rights as to assets and voting privileges. Class B shares are closed to new accounts and additional purchases, except for exchanges and reinvestments. Each class has exclusive voting rights with respect to matters that affect that class. Class B shares will automatically convert to Class A shares after a holding period of seven years from the initial date of purchase. The Fund's investments in emerging markets can be subject to social, economic, regulatory, and political uncertainties and can be extremely volatile.
2. Investments in Fidelity Central Funds.
The Fund invests in Fidelity Central Funds, which are open-end investment companies generally available only to other investment companies and accounts managed by Fidelity Management & Research Company (FMR) and its affiliates. The Fund's Schedule of Investments lists each of the Fidelity Central Funds held as of period end, if any, as an investment of the Fund, but does not include the underlying holdings of each Fidelity Central Fund. As an Investing Fund, the Fund indirectly bears its proportionate share of the expenses of the underlying Fidelity Central Funds.
The Money Market Central Funds seek preservation of capital and current income and are managed by Fidelity Investments Money Management, Inc. (FIMM), an affiliate of FMR.
A complete unaudited list of holdings for each Fidelity Central Fund is available upon request or at the Securities and Exchange Commission (the SEC) website at www.sec.gov. In addition, the financial statements of the Fidelity Central Funds, which are not covered by the Fund's Report of Independent Registered Public Accounting Firm, are available on the SEC website or upon request.
3. Significant Accounting Policies.
The financial statements have been prepared in conformity with accounting principles generally accepted in the United States of America (GAAP), which require management to make certain estimates and assumptions at the date of the financial statements. Actual results could differ from those estimates. Subsequent events, if any, through the date that the financial statements were issued have been evaluated in the preparation of
Annual Report
3. Significant Accounting Policies - continued
the financial statements. The following summarizes the significant accounting policies of the Fund:
Investment Valuation. Investments are valued as of 4:00 p.m. Eastern time on the last calendar day of the period. In accordance with valuation policies and procedures approved by the Board of Trustees (the Board), the Fund attempts to obtain prices from one or more third party pricing vendors or brokers to value its investments. When current market prices, quotations or currency exchange rates are not readily available or reliable, investments will be fair valued in good faith by the FMR Fair Value Committee (the Committee), in accordance with procedures adopted by the Board. Factors used in determining fair value vary by investment type and may include market or investment specific events, changes in interest rates and credit quality. The frequency with which these procedures are used cannot be predicted and they may be utilized to a significant extent. The Committee oversees the Fund's valuation policies and procedures and is responsible for approving and reporting to the Board all fair value determinations.
The Fund categorizes the inputs to valuation techniques used to value its investments into a disclosure hierarchy consisting of three levels as shown below:
Level 1 - quoted prices in active markets for identical investments
Level 2 - other significant observable inputs (including quoted prices for similar investments, interest rates, prepayment speeds, etc.)
Level 3 - unobservable inputs (including the Fund's own assumptions based on the best information available)
Valuation techniques used to value the Fund's investments by major category are as follows:
Equity securities, including restricted securities, for which market quotations are readily available, are valued at the last reported sale price or official closing price as reported by a third party pricing vendor on the primary market or exchange on which they are traded and are categorized as Level 1 in the hierarchy. In the event there were no sales during the day or closing prices are not available, securities are valued at the last quoted bid price or may be valued using the last available price and are generally categorized as Level 2 in the hierarchy. For foreign equity securities, when market or security specific events arise, comparisons to the valuation of American Depositary Receipts (ADRs), futures contracts, Exchange-Traded Funds (ETFs) and certain indexes as well as quoted prices for similar securities may be used and would be categorized as Level 2 in the hierarchy. Utilizing these techniques may result in transfers between Level 1 and Level 2. For equity securities, including restricted securities, where observable inputs are limited, assumptions about market activity and risk are used and these securities may be categorized as Level 3 in the hierarchy.
Annual Report
Notes to Financial Statements - continued
3. Significant Accounting Policies - continued
Investment Valuation - continued
Debt securities, including restricted securities, are valued based on evaluated prices received from third party pricing vendors or from brokers who make markets in such securities. For corporate bonds, pricing vendors utilize matrix pricing which considers yield or price of bonds of comparable quality, coupon, maturity and type as well as broker-supplied prices. When independent prices are unavailable or unreliable, debt securities may be valued utilizing pricing methodologies which consider similar factors that would be used by third party pricing vendors. Debt securities are generally categorized as Level 2 in the hierarchy but may be Level 3 depending on the circumstances.
Investments in open-end mutual funds, including the Fidelity Central Funds, are valued at their closing net asset value (NAV) each business day and are categorized as Level 1 in the hierarchy.
Changes in valuation techniques may result in transfers in or out of an assigned level within the disclosure hierarchy. The aggregate value of investments by input level, as of October 31, 2013, including information on transfers between Levels 1 and 2, as well as a roll forward of Level 3 investments, is included at the end of the Fund's Schedule of Investments.
Foreign Currency. The Fund may use foreign currency contracts to facilitate transactions in foreign-denominated securities. Gains and losses from these transactions may arise from changes in the value of the foreign currency or if the counterparties do not perform under the contracts' terms.
Foreign-denominated assets, including investment securities, and liabilities are translated into U.S. dollars at the exchange rates at period end. Purchases and sales of investment securities, income and dividends received and expenses denominated in foreign currencies are translated into U.S. dollars at the exchange rate in effect on the transaction date.
The effects of exchange rate fluctuations on investments are included with the net realized and unrealized gain (loss) on investment securities. Other foreign currency transactions resulting in realized and unrealized gain (loss) are disclosed separately.
Investment Transactions and Income. For financial reporting purposes, the Fund's investment holdings and NAV include trades executed through the end of the last business day of the period. The NAV per share for processing shareholder transactions is calculated as of the close of business of the New York Stock Exchange (NYSE), normally 4:00 p.m. Eastern time and includes trades executed through the end of the prior business day. Gains and losses on securities sold are determined on the basis of identified cost. Dividend income is recorded on the ex-dividend date, except for certain dividends
Annual Report
3. Significant Accounting Policies - continued
Investment Transactions and Income - continued
from foreign securities where the ex-dividend date may have passed, which are recorded as soon as the Fund is informed of the ex-dividend date. Non-cash dividends included in dividend income, if any, are recorded at the fair market value of the securities received. Interest income and distributions from the Fidelity Central Funds are accrued as earned. Interest income includes coupon interest and amortization of premium and accretion of discount on debt securities. Investment income is recorded net of foreign taxes withheld where recovery of such taxes is uncertain.
Class Allocations and Expenses. Investment income, realized and unrealized capital gains and losses, common expenses of the Fund, and certain fund-level expense reductions, if any, are allocated daily on a pro-rata basis to each class based on the relative net assets of each class to the total net assets of the Fund. Each class differs with respect to transfer agent and distribution and service plan fees incurred. Certain expense reductions may also differ by class. For the reporting period, the allocated portion of income and expenses to each class as a percent of its average net assets may vary due to the timing of recording these transactions in relation to fluctuating net assets of the classes. Expenses directly attributable to a fund are charged to that fund. Expenses attributable to more than one fund are allocated among the respective funds on the basis of relative net assets or other appropriate methods. Expense estimates are accrued in the period to which they relate and adjustments are made when actual amounts are known.
Income Tax Information and Distributions to Shareholders. Each year, the Fund intends to qualify as a regulated investment company under Subchapter M of the Internal Revenue Code, including distributing substantially all of its taxable income and realized gains. As a result, no provision for U.S. Federal income taxes is required. As of October 31, 2013, the Fund did not have any unrecognized tax benefits in the financial statements; nor is the Fund aware of any tax positions for which it is reasonably possible that the total amounts of unrecognized tax benefits will significantly change in the next twelve months. The Fund files a U.S. federal tax return, in addition to state and local tax returns as required. The Fund's federal income tax returns are subject to examination by the Internal Revenue Service (IRS) for a period of three fiscal years after they are filed. State and local tax returns may be subject to examination for an additional fiscal year depending on the jurisdiction. Foreign taxes are provided for based on the Fund's understanding of the tax rules and rates that exist in the foreign markets in which it invests.
Distributions are declared and recorded on the ex-dividend date. Income dividends and capital gain distributions are declared separately for each class. Income and capital gain distributions are determined in accordance with income tax regulations, which may
Annual Report
Notes to Financial Statements - continued
3. Significant Accounting Policies - continued
Income Tax Information and Distributions to Shareholders - continued
differ from GAAP. In addition, the Fund claimed a portion of the payment made to redeeming shareholders as a distribution for income tax purposes.
Capital accounts within the financial statements are adjusted for permanent book-tax differences. These adjustments have no impact on net assets or the results of operations. Temporary book-tax differences will reverse in a subsequent period.
Book-tax differences are primarily due to futures transactions, foreign currency transactions, passive foreign investment companies (PFIC), capital loss carryforwards and losses deferred due to wash sales.
The federal tax cost of investment securities and unrealized appreciation (depreciation) as of period end were as follows:
Gross unrealized appreciation | $ 278,457,935 |
Gross unrealized depreciation | (70,365,537) |
Net unrealized appreciation (depreciation) on securities and other investments | $ 208,092,398 |
| |
Tax Cost | $ 972,419,894 |
The tax-based components of distributable earnings as of period end were as follows:
Undistributed ordinary income | $ 30,190,846 |
Capital loss carryforward | $ (30,539,357) |
Net unrealized appreciation (depreciation) | $ 208,068,569 |
Capital loss carryforwards are only available to offset future capital gains of the Fund to the extent provided by regulations and may be limited. Under the Regulated Investment Company Modernization Act of 2010 (the Act), the Fund is permitted to carry forward capital losses incurred in taxable years beginning after December 22, 2010 for an unlimited period and such capital losses are required to be used prior to any losses that expire. The capital loss carryforward information presented below, including any applicable limitation, is estimated as of fiscal period end and is subject to adjustment.
Fiscal year of expiration | |
2017 | $ (30,539,357) |
The tax character of distributions paid was as follows:
| October 31, 2013 | October 31, 2012 |
Ordinary Income | $ 16,524,337 | $ 20,594,102 |
Annual Report
3. Significant Accounting Policies - continued
Short-Term Trading (Redemption) Fees. Shares held by investors in the Fund less than 90 days may have been subject to a redemption fee equal to 2.00% of the net asset value of shares redeemed. All redemption fees, which reduce the proceeds of the shareholder redemption, are retained by the Fund and accounted for as an addition to paid in capital.
Restricted Securities. The Fund may invest in securities that are subject to legal or contractual restrictions on resale. These securities generally may be resold in transactions exempt from registration or to the public if the securities are registered. Disposal of these securities may involve time-consuming negotiations and expense, and prompt sale at an acceptable price may be difficult. Information regarding restricted securities is included at the end of the Fund's Schedule of Investments.
New Accounting Pronouncement. The Financial Accounting Standards Board issued in December 2011, Accounting Standard Update No. 2011-11, Disclosures about Offsetting Assets and Liabilities, and in January 2013, Accounting Standards Update No. 2013-1 Clarifying the Scope of Disclosures about Offsetting Assets and Liabilities. These updates create new disclosure requirements requiring entities to disclose both gross and net information for derivatives and other financial instruments that are either offset in the Statement of Assets and Liabilities or subject to an enforceable master netting arrangement or similar agreement. The disclosure requirements are effective for annual reporting periods beginning on or after January 1, 2013, and interim periods within those annual periods. Management expects that the impact of the updates' adoption will be limited to additional financial statement disclosures as applicable.
4. Derivative Instruments.
Risk Exposures and the Use of Derivative Instruments. The Fund's investment objective allows the Fund to enter into various types of derivative contracts, including futures contracts. Derivatives are investments whose value is primarily derived from underlying assets, indices or reference rates and may be transacted on an exchange or over-the-counter (OTC). Derivatives may involve a future commitment to buy or sell a specified asset based on specified terms, to exchange future cash flows at periodic intervals based on a notional principal amount, or for one party to make one or more payments upon the occurrence of specified events in exchange for periodic payments from the other party.
The Fund used derivatives to increase returns and to manage exposure to certain risks as defined below. The success of any strategy involving derivatives depends on analysis of numerous economic factors, and if the strategies for investment do not work as intended, the Fund may not achieve its objectives.
Annual Report
Notes to Financial Statements - continued
4. Derivative Instruments - continued
Risk Exposures and the Use of Derivative Instruments - continued
The Fund's use of derivatives increased or decreased its exposure to the following risk:
Equity Risk | Equity risk relates to the fluctuations in the value of financial instruments as a result of changes in market prices (other than those arising from interest rate risk or foreign exchange risk), whether caused by factors specific to an individual investment, its issuer, or all factors affecting all instruments traded in a market or market segment. |
The Fund is also exposed to additional risks from investing in derivatives, such as liquidity risk and counterparty credit risk. Liquidity risk is the risk that the Fund will be unable to close out the derivative in the open market in a timely manner. Counterparty credit risk is the risk that the counterparty will not be able to fulfill its obligation to the Fund. Counterparty credit risk related to exchange-traded futures contracts may be mitigated by the protection provided by the exchange on which they trade.
Investing in derivatives may involve greater risks than investing in the underlying assets directly and, to varying degrees, may involve risk of loss in excess of any initial investment and collateral received and amounts recognized in the Statement of Assets and Liabilities. In addition, there may be the risk that the change in value of the derivative contract does not correspond to the change in value of the underlying instrument.
Futures Contracts. A futures contract is an agreement between two parties to buy or sell a specified underlying instrument for a fixed price at a specified future date. The Fund used futures contracts to manage its exposure to the stock market.
Upon entering into a futures contract, a fund is required to deposit either cash or securities (initial margin) with a clearing broker in an amount equal to a certain percentage of the face value of the contract. Futures contracts are marked-to-market daily and subsequent daily payments (variation margin) are made or received by a fund depending on the daily fluctuations in the value of the futures contracts and are recorded as unrealized appreciation or (depreciation). This receivable and/or payable, if any, is included in daily variation margin for derivative instruments in the Statement of Assets and Liabilities. Realized gain or (loss) is recorded upon the expiration or closing of a futures contract.
Any open futures contracts at period end are presented in the Schedule of Investments under the caption "Futures Contracts." The underlying face amount at value reflects each contract's exposure to the underlying instrument or index at period end.
During the period the Fund recognized net realized gain (loss) of $(80,042) related to its investment in futures contracts. This amount is included in the Statement of Operations.
Annual Report
5. Purchases and Sales of Investments.
Purchases and sales of securities, other than short-term securities, aggregated $556,944,991 and $443,858,751, respectively.
6. Fees and Other Transactions with Affiliates.
Management Fee. FMR and its affiliates provide the Fund with investment management related services for which the Fund pays a monthly management fee. The management fee is the sum of an individual fund fee rate that is based on an annual rate of .60% of the Fund's average net assets and an annualized group fee rate that averaged .25% during the period. The group fee rate is based upon the average net assets of all the mutual funds advised by FMR, including any mutual funds previously advised by FMR that are currently advised by Fidelity SelectCo, LLC, an affiliate of FMR. The group fee rate decreases as assets under management increase and increases as assets under management decrease. In addition, the management fee is subject to a performance adjustment (up to a maximum of ± .20% of the Fund's average net assets over a 36 month performance period). The upward or downward adjustment to the management fee is based on the relative investment performance of International Small Cap as compared to an appropriate benchmark index over the same 36 month performance period. For the reporting period, the total annual management fee rate, including the performance adjustment, was .96% of the Fund's average net assets. The performance adjustment included in the management fee rate may be higher or lower than the maximum performance adjustment rate due to the difference between the average net assets for the reporting and performance periods.
Distribution and Service Plan Fees. In accordance with Rule 12b-1 of the 1940 Act, the Fund has adopted separate Distribution and Service Plans for each class of shares. Certain classes pay Fidelity Distributors Corporation (FDC), an affiliate of FMR, separate Distribution and Service Fees, each of which is based on an annual percentage of each class' average net assets. In addition, FDC may pay financial intermediaries for selling shares of the Fund and providing shareholder support services. For the period, the Distribution and Service Fee rates, total fees and amounts retained by FDC were as follows:
| Distribution
Fee | Service
Fee | Total Fees | Retained
by FDC |
Class A | -% | .25% | $ 42,679 | $ 1,371 |
Class T | .25% | .25% | 51,556 | 91 |
Class B | .75% | .25% | 7,500 | 5,677 |
Class C | .75% | .25% | 90,439 | 12,749 |
| | | $ 192,174 | $ 19,888 |
Annual Report
Notes to Financial Statements - continued
6. Fees and Other Transactions with Affiliates - continued
Sales Load. FDC may receive a front-end sales charge of up to 5.75% for selling Class A shares and 3.50% for selling Class T shares, some of which is paid to financial intermediaries for selling shares of the Fund. Depending on the holding period, FDC may receive contingent deferred sales charges levied on Class A, Class T, Class B, and Class C redemptions. The deferred sales charges range from 5.00% to 1.00% for Class B shares, 1.00% for Class C shares, 1.00% for certain purchases of Class A shares and .25% for certain purchases of Class T shares.
For the period, sales charge amounts retained by FDC were as follows:
| Retained
by FDC |
Class A | $ 13,853 |
Class T | 2,743 |
Class B* | 143 |
Class C* | 1,699 |
| $ 18,438 |
* When Class B and Class C shares are initially sold, FDC pays commissions from its own resources to financial intermediaries through which the sales
are made.
Transfer Agent Fees. Fidelity Investments Institutional Operations Company, Inc., (FIIOC), an affiliate of FMR, is the transfer, dividend disbursing and shareholder servicing agent for each class of the Fund. FIIOC receives account fees and asset-based fees that vary according to the account size and type of account of the shareholders of the respective classes of the Fund. FIIOC pays for typesetting, printing and mailing of shareholder reports, except proxy statements.
For the period, transfer agent fees for each class were as follows:
| Amount | % of
Average
Net Assets |
Class A | $ 50,833 | .30 |
Class T | 31,476 | .30 |
Class B | 2,235 | .30 |
Class C | 24,673 | .27 |
International Small Cap | 2,068,757 | .26 |
Institutional Class | 27,668 | .13 |
| $ 2,205,642 | |
Accounting and Security Lending Fees. Fidelity Service Company, Inc. (FSC), an affiliate of FMR, maintains the Fund's accounting records. The accounting fee is based on the level of average net assets for each month. Under a separate contract, FSC administers the security lending program. The security lending fee is based on the number and duration of lending transactions.
Annual Report
6. Fees and Other Transactions with Affiliates - continued
Brokerage Commissions. The Fund placed a portion of its portfolio transactions with brokerage firms which are affiliates of the investment adviser. Brokerage commissions are included in net realized gain (loss) and change in net unrealized appreciation (depreciation) in the Statement of Operations. The commissions paid to these affiliated firms were $510 for the period.
Other. During the period, FMR reimbursed the Fund for certain losses in the amount of $80,334.
7. Committed Line of Credit.
The Fund participates with other funds managed by FMR or an affiliate in a $4.25 billion credit facility (the "line of credit") to be utilized for temporary or emergency purposes to fund shareholder redemptions or for other short-term liquidity purposes. The Fund has agreed to pay commitment fees on its pro-rata portion of the line of credit, which amounted to $1,779 and is reflected in Miscellaneous expenses on the Statement of Operations. During the period, there were no borrowings on this line of credit.
8. Security Lending.
The Fund lends portfolio securities through a lending agent from time to time in order to earn additional income. For equity securities, a lending agent is used and may loan securities to certain qualified borrowers, including Fidelity Capital Markets (FCM), a broker-dealer affiliated with the Fund. On the settlement date of the loan, the Fund receives collateral (in the form of U.S. Treasury obligations, letters of credit and/or cash) against the loaned securities and maintains collateral in an amount not less than 100% of the market value of the loaned securities during the period of the loan. The market value of the loaned securities is determined at the close of business of the Fund and any additional required collateral is delivered to the Fund on the next business day. If the borrower defaults on its obligation to return the securities loaned because of insolvency or other reasons, the Fund may apply collateral received from the borrower against the obligation. The Fund may experience delays and costs in recovering the securities loaned. Any cash collateral received is invested in the Fidelity Securities Lending Cash Central Fund. The value of loaned securities and cash collateral at period end are disclosed on the Fund's Statement of Assets and Liabilities. The value of securities loaned to FCM at period end was $73,568. Security lending income represents the income earned on investing cash collateral, less rebates paid to borrowers and any lending agent fees associated with the loan, plus any premium payments received for lending certain types of securities. Security lending income is presented in the Statement of Operations as a component of income from Fidelity Central Funds. Total security lending income during the period amounted to $663,324, including $3,759 from securities loaned to FCM.
Annual Report
Notes to Financial Statements - continued
9. Expense Reductions.
Commissions paid to certain brokers with whom FMR, or its affiliates, places trades on behalf of the Fund include an amount in addition to trade execution, which may be rebated back to the Fund to offset certain expenses. This amount totaled $113,128 for the period.
In addition, FMR reimbursed a portion of the Fund's operating expenses during the period in the amount of $29,243.
10. Distributions to Shareholders.
Distributions to shareholders of each class were as follows:
Years ended October 31, | 2013 | 2012 |
From net investment income | | |
Class A | $ 53,369 | $ 98,060 |
Class T | - | 18,440 |
International Small Cap | 4,638,246 | 7,747,338 |
Institutional Class | 77,935 | 152,585 |
Total | $ 4,769,550 | $ 8,016,423 |
From net realized gain | | |
Class A | $ 235,834 | $ 246,964 |
Class T | 146,972 | 172,958 |
Class B | 3,106 | 15,448 |
Class C | 61,233 | 91,928 |
International Small Cap | 11,152,248 | 11,838,630 |
Institutional Class | 155,394 | 211,751 |
Total | $ 11,754,787 | $ 12,577,679 |
11. Share Transactions.
Transactions for each class of shares were as follows:
| Shares | Dollars |
Years ended October 31, | 2013 | 2012 | 2013 | 2012 |
Class A | | | | |
Shares sold | 398,633 | 190,464 | $ 9,321,444 | $ 3,581,689 |
Reinvestment of distributions | 13,843 | 18,159 | 269,801 | 323,949 |
Shares redeemed | (215,812) | (398,912) | (4,750,681) | (7,484,565) |
Net increase (decrease) | 196,664 | (190,289) | $ 4,840,564 | $ (3,578,927) |
Class T | | | | |
Shares sold | 141,247 | 67,193 | $ 3,379,516 | $ 1,245,760 |
Reinvestment of distributions | 7,380 | 10,478 | 143,239 | 185,991 |
Shares redeemed | (104,387) | (336,074) | (2,281,922) | (6,220,818) |
Net increase (decrease) | 44,240 | (258,403) | $ 1,240,833 | $ (4,789,067) |
Annual Report
11. Share Transactions - continued
| Shares | Dollars |
Years ended October 31, | 2013 | 2012 | 2013 | 2012 |
Class B | | | | |
Shares sold | 4,525 | 1,171 | $ 108,233 | $ 21,568 |
Reinvestment of distributions | 157 | 825 | 3,023 | 14,430 |
Shares redeemed | (15,050) | (73,396) | (330,538) | (1,354,968) |
Net increase (decrease) | (10,368) | (71,400) | $ (219,282) | $ (1,318,970) |
Class C | | | | |
Shares sold | 275,046 | 95,047 | $ 6,270,694 | $ 1,772,779 |
Reinvestment of distributions | 2,855 | 4,830 | 54,609 | 84,289 |
Shares redeemed | (109,571) | (264,717) | (2,419,306) | (4,745,500) |
Net increase (decrease) | 168,330 | (164,840) | $ 3,905,997 | $ (2,888,432) |
International Small Cap | | | | |
Shares sold | 11,248,438 | 4,700,621 | $ 266,912,412 | $ 88,441,440 |
Reinvestment of distributions | 770,505 | 1,033,828 | 15,163,539 | 18,629,579 |
Shares redeemed | (8,061,607) | (15,631,544) | (180,218,306) | (292,428,231) |
Net increase (decrease) | 3,957,336 | (9,897,095) | $ 101,857,645 | $ (185,357,212) |
Institutional Class | | | | |
Shares sold | 2,333,500 | 199,584 | $ 57,218,863 | $ 3,790,776 |
Reinvestment of distributions | 8,409 | 15,793 | 165,323 | 284,438 |
Shares redeemed | (303,629) | (559,093) | (6,792,002) | (10,329,992) |
Net increase (decrease) | 2,038,280 | (343,716) | $ 50,592,184 | $ (6,254,778) |
12. Other.
The Fund's organizational documents provide former and current trustees and officers with a limited indemnification against liabilities arising in connection with the performance of their duties to the Fund. In the normal course of business, the Fund may also enter into contracts that provide general indemnifications. The Fund's maximum exposure under these arrangements is unknown as this would be dependent on future claims that may be made against the Fund. The risk of material loss from such claims is considered remote.
At the end of the period, FMR or its affiliates were the owners of record of 13% of the total outstanding shares of the Fund.
Annual Report
To the Trustees of Fidelity Investment Trust and Shareholders of Fidelity International Small Cap Fund:
We have audited the accompanying statement of assets and liabilities of Fidelity International Small Cap Fund (the Fund), a fund of Fidelity Investment Trust, including the schedule of investments, as of October 31, 2013, and the related statement of operations for the year then ended, the statement of changes in net assets for each of the two years in the period then ended, and the financial highlights for each of the five years in the period then ended. These financial statements and financial highlights are the responsibility of the Fund's management. Our responsibility is to express an opinion on these financial statements and financial highlights based on our audits.
We conducted our audits in accordance with the standards of the Public Company Accounting Oversight Board (United States). Those standards require that we plan and perform the audit to obtain reasonable assurance about whether the financial statements and financial highlights are free of material misstatement. The Fund is not required to have, nor were we engaged to perform, an audit of its internal control over financial reporting. Our audits included consideration of internal control over financial reporting as a basis for designing audit procedures that are appropriate in the circumstances, but not for the purpose of expressing an opinion on the effectiveness of the Fund's internal control over financial reporting. Accordingly, we express no such opinion. An audit also includes examining, on a test basis, evidence supporting the amounts and disclosures in the financial statements, assessing the accounting principles used and significant estimates made by management, as well as evaluating the overall financial statement presentation. Our procedures included confirmation of securities owned as of October 31, 2013, by correspondence with the custodians and brokers; where replies were not received from brokers, we performed other auditing procedures. We believe that our audits provide a reasonable basis for our opinion.
In our opinion, the financial statements and financial highlights referred to above present fairly, in all material respects, the financial position of Fidelity International Small Cap Fund as of October 31, 2013, the results of its operations for the year then ended, the changes in its net assets for each of the two years in the period then ended, and the financial highlights for each of the five years in the period then ended, in conformity with accounting principles generally accepted in the United States of America.
DELOITTE & TOUCHE LLP
Boston, Massachusetts
December 13, 2013
Annual Report
The Trustees, Member of the Advisory Board, and executive officers of the trust and fund, as applicable, are listed below. The Board of Trustees governs the fund and is responsible for protecting the interests of shareholders. The Trustees are experienced executives who meet periodically throughout the year to oversee the fund's activities, review contractual arrangements with companies that provide services to the fund, oversee management of the risks associated with such activities and contractual arrangements, and review the fund's performance. Except for James C. Curvey, Ned C. Lautenbach, Ronald P. O'Hanley, and William S. Stavropoulos, each of the Trustees oversees 171 funds. Mr. Curvey oversees 394 funds. Mr. Lautenbach, Mr. O'Hanley, and Mr. Stavropoulos each oversees 245 funds.
The Trustees hold office without limit in time except that (a) any Trustee may resign; (b) any Trustee may be removed by written instrument, signed by at least two-thirds of the number of Trustees prior to such removal; (c) any Trustee who requests to be retired or who has become incapacitated by illness or injury may be retired by written instrument signed by a majority of the other Trustees; and (d) any Trustee may be removed at any special meeting of shareholders by a two-thirds vote of the outstanding voting securities of the trust. Each Trustee who is not an interested person of the trust and the fund (as defined in the 1940 Act) (Independent Trustee), shall retire not later than the last day of the calendar year in which his or her 75th birthday occurs. The Independent Trustees may waive this mandatory retirement age policy with respect to individual Trustees. The executive officers and Advisory Board Member hold office without limit in time, except that any officer and Advisory Board Member may resign or may be removed by a vote of a majority of the Trustees at any regular meeting or any special meeting of the Trustees. Except as indicated, each individual has held the office shown or other offices in the same company for the past five years.
Experience, Skills, Attributes, and Qualifications of the Fund's Trustees. The Governance and Nominating Committee has adopted a statement of policy that describes the experience, qualifications, attributes, and skills that are necessary and desirable for potential Independent Trustee candidates (Statement of Policy). The Board believes that each Trustee satisfied at the time he or she was initially elected or appointed a Trustee, and continues to satisfy, the standards contemplated by the Statement of Policy. The Governance and Nominating Committee also engages professional search firms to help identify potential Independent Trustee candidates who have the experience, qualifications, attributes, and skills consistent with the Statement of Policy. From time to time, additional criteria based on the composition and skills of the current Independent Trustees, as well as experience or skills that may be appropriate in light of future changes to board composition, business conditions, and regulatory or other developments, have also been considered by the professional search firms and the Governance and Nominating Committee. In addition, the Board takes into account the Trustees' commitment and participation in Board and committee meetings, as well as their leadership of standing and ad hoc committees throughout their tenure.
Annual Report
Trustees and Officers - continued
In determining that a particular Trustee was and continues to be qualified to serve as a Trustee, the Board has considered a variety of criteria, none of which, in isolation, was controlling. The Board believes that, collectively, the Trustees have balanced and diverse experience, qualifications, attributes, and skills, which allow the Board to operate effectively in governing the fund and protecting the interests of shareholders. Information about the specific experience, skills, attributes, and qualifications of each Trustee, which in each case led to the Board's conclusion that the Trustee should serve (or continue to serve) as a trustee of the fund, is provided below.
Board Structure and Oversight Function. James C. Curvey is an interested person (as defined in the 1940 Act) and currently serves as Chairman. The Trustees have determined that an interested Chairman is appropriate and benefits shareholders because an interested Chairman has a personal and professional stake in the quality and continuity of services provided to the fund. Independent Trustees exercise their informed business judgment to appoint an individual of their choosing to serve as Chairman, regardless of whether the Trustee happens to be independent or a member of management. The Independent Trustees have determined that they can act independently and effectively without having an Independent Trustee serve as Chairman and that a key structural component for assuring that they are in a position to do so is for the Independent Trustees to constitute a substantial majority for the Board. The Independent Trustees also regularly meet in executive session. Ned C. Lautenbach serves as Chairman of the Independent Trustees and as such (i) acts as a liaison between the Independent Trustees and management with respect to matters important to the Independent Trustees and (ii) with management prepares agendas for Board meetings.
Fidelity funds are overseen by different Boards of Trustees. The fund's Board oversees Fidelity's equity and high income funds and another Board oversees Fidelity's investment-grade bond, money market, and asset allocation funds. The asset allocation funds may invest in Fidelity funds overseen by the fund's Board. The use of separate Boards, each with its own committee structure, allows the Trustees of each group of Fidelity funds to focus on the unique issues of the funds they oversee, including common research, investment, and operational issues. On occasion, the separate Boards establish joint committees to address issues of overlapping consequences for the Fidelity funds overseen by each Board.
The Trustees operate using a system of committees to facilitate the timely and efficient consideration of all matters of importance to the Trustees, the fund, and fund shareholders and to facilitate compliance with legal and regulatory requirements and oversight of the fund's activities and associated risks. The Board, acting through its committees, has charged FMR and its affiliates with (i) identifying events or circumstances the occurrence of which could have demonstrably adverse effects on the fund's business and/or reputation; (ii) implementing processes and controls to lessen the possibility that such events or circumstances occur or to mitigate the effects of such events or circumstances if they do occur; and (iii) creating and maintaining a system designed to evaluate continuously business and market conditions in order to facilitate the identification and implementation processes described in (i) and (ii) above. Because the day-to-day operations and activities of the fund are carried out by or through FMR, its affiliates and other service providers, the fund's exposure to risks is mitigated but not eliminated by the processes overseen by the Trustees. While each of the Board's committees has responsibility for overseeing different aspects of the fund's activities, oversight is exercised primarily through the Operations, Audit, and Compliance Committees. In addition, the Independent Trustees have worked with FMR to enhance the Board's oversight of investment and financial risks, legal and regulatory risks, technology risks, and operational risks, including the development of additional risk reporting to the Board. For example, a working group comprised of Independent Trustees and FMR has worked and continues to work to review the Fidelity funds' valuation-related activities, reporting and risk management. Appropriate personnel, including but not limited to the fund's Chief Compliance Officer (CCO), FMR's internal auditor, the independent accountants, the fund's Treasurer and portfolio management personnel, make periodic reports to the Board's committees, as appropriate, including an annual review of FMR's risk management program for the Fidelity funds. The responsibilities of each standing committee, including their oversight responsibilities, are described further under "Standing Committees of the Fund's Trustees."
Annual Report
The fund's Statement of Additional Information (SAI) includes more information about the Trustees. To request a free copy, call Fidelity at 1-800-544-8544.
Interested Trustees*:
Correspondence intended for each Trustee who is an interested person may be sent to Fidelity Investments, 245 Summer Street, Boston, Massachusetts 02210.
Name, Year of Birth; Principal Occupations and Other Relevant Experience+ |
James C. Curvey (1935) |
Year of Election or Appointment: 2007 Trustee Chairman of the Board of Trustees |
| Mr. Curvey also serves as Trustee of other Fidelity funds. Mr. Curvey is a Director of Fidelity Investments Money Management, Inc. (2009-present), Director of Fidelity Research & Analysis Co. (2009-present) and Director of FMR and FMR Co., Inc. (2007-present). Mr. Curvey is also Vice Chairman (2007-present) and Director of FMR LLC. In addition, Mr. Curvey serves as an Overseer for the Boston Symphony Orchestra and a member of the Trustees of Villanova University. Previously, Mr. Curvey was the Vice Chairman (2006-2007) and Director (2000-2007) of FMR Corp. |
Ronald P. O'Hanley (1957) |
Year of Election or Appointment: 2011 Trustee |
| Mr. O'Hanley also serves as Trustee of other Fidelity funds. He is Director of Fidelity SelectCo, LLC (2013-present), FMR Co., Inc. (2010-present), Director of Fidelity Investments Money Management, Inc. (2010-present), Director of Fidelity Research & Analysis Company (2010-present), President of Fidelity Asset Management and Corporate Services and a Member of Fidelity's Executive Committee (2010-present). Previously, Mr. O'Hanley served as President and Chief Executive Officer of BNY Mellon Asset Management (2007-2010). Mr. O'Hanley also served as Vice Chairman of Bank New York Mellon Corp. and a member of that firm's Executive Committee. Prior to the 2007 merger of The Bank of New York and Mellon Financial Corporation, he was Vice Chairman of Mellon Financial Corporation and President and Chief Executive Officer of Mellon Asset Management. He joined Mellon in February 1997. Mr. O'Hanley currently serves as Chairman of the Boston Public Library Foundation Board of Directors and sits on the Board of Directors of Beth Israel Deaconess Medical Center, the Board of Trustees of the Marine Biological Laboratory and the Advisory Board of the Maxwell School of Citizenship and Public Administration at Syracuse University. Mr. O'Hanley also chairs the Council on Asset Management for the Financial Services Roundtable and is a member of the Board of Directors of Institutional Investor's U.S. Institute. |
* Trustees have been determined to be "Interested Trustees" by virtue of, among other things, their affiliation with the trust or various entities under common control with FMR.
+ The information above includes each Trustee's principal occupation during the last five years and other information relating to the experience, attributes, and skills relevant to each Trustee's qualifications to serve as a Trustee, which led to the conclusion that each Trustee should serve as a Trustee for the fund.
Annual Report
Independent Trustees:
Correspondence intended for each Independent Trustee (that is, the Trustees other than the Interested Trustees) may be sent to Fidelity Investments, P.O. Box 55235, Boston, Massachusetts 02205-5235.
Name, Year of Birth; Principal Occupations and Other Relevant Experience+ |
Dennis J. Dirks (1948) |
Year of Election or Appointment: 2005 Trustee |
| Mr. Dirks also serves as Trustee of other Fidelity funds. Prior to his retirement in May 2003, Mr. Dirks was Chief Operating Officer and a member of the Board of The Depository Trust & Clearing Corporation (DTCC). He also served as President, Chief Operating Officer, and Board member of The Depository Trust Company (DTC) and President and Board member of the National Securities Clearing Corporation (NSCC). In addition, Mr. Dirks served as Chief Executive Officer and Board member of the Government Securities Clearing Corporation, Chief Executive Officer and Board member of the Mortgage-Backed Securities Clearing Corporation, as a Trustee and a member of the Finance Committee of Manhattan College (2005-2008), and as a Trustee and a member of the Finance Committee of AHRC of Nassau County (2006-2008). Mr. Dirks is a member of the Independent Directors Council (IDC) Governing Council (2010-present) and Board of Directors for The Brookville Center for Children's Services, Inc. (2009-present). |
Alan J. Lacy (1953) |
Year of Election or Appointment: 2008 Trustee |
| Mr. Lacy also serves as Trustee of other Fidelity funds. Mr. Lacy serves as Senior Adviser (2007-present) of Oak Hill Capital Partners, L.P. (private equity). Mr. Lacy also served as Chief Executive Officer (2000-2005) and Vice Chairman (2005-2006) of Sears Holdings Corporation and Sears, Roebuck and Co. (retail). In addition, Mr. Lacy serves as a member of the Board of Directors of Dave & Buster's Entertainment, Inc. (restaurant and entertainment complexes, 2010-present), Earth Fare, Inc. (retail grocery, 2012-present), The Hillman Companies, Inc. (hardware wholesalers, 2010-present), and Bristol-Myers Squibb Company (global pharmaceuticals, 2008-present). Mr. Lacy is a member of the Board of Trustees of The National Parks Conservation Association (2006-present). Previously, Mr. Lacy served as Chairman of the Board of Trustees of the National Parks Conservation Association (2008-2011) and as a member of the Board of Directors for the Western Union Company (global money transfer, 2006-2011). |
Ned C. Lautenbach (1944) |
Year of Election or Appointment: 2000 Trustee Chairman of the Independent Trustees |
| Mr. Lautenbach also serves as Trustee of other Fidelity funds. Mr. Lautenbach currently serves as the Lead Director of the Eaton Corporation Board of Directors (diversified industrial, 1997-present). Mr. Lautenbach is Chairman of the Board of Directors of the Philharmonic Center for the Arts in Naples, Florida (2012-present) and a member of the Council on Foreign Relations (1994-present). Previously, Mr. Lautenbach was a Partner/Advisory Partner at Clayton, Dubilier & Rice, LLC (private equity investment, 1998-2010), as well as a Director of Sony Corporation (2006-2007). |
Joseph Mauriello (1944) |
Year of Election or Appointment: 2008 Trustee |
| Mr. Mauriello also serves as Trustee of other Fidelity funds. Prior to his retirement in January 2006, Mr. Mauriello served in numerous senior management positions including Deputy Chairman and Chief Operating Officer (2004-2005), and Vice Chairman of Financial Services (2002-2004) of KPMG LLP US (professional services, 1965-2005). Mr. Mauriello currently serves as a member of the Board of Directors of XL Group plc. (global insurance and re-insurance, 2006-present). Previously, Mr. Mauriello served as a Director of the Hamilton Funds of the Bank of New York (2006-2007) and of Arcadia Resources Inc. (health care services and products, 2007-2012). |
Robert W. Selander (1950) |
Year of Election or Appointment: 2011 Trustee |
| Mr. Selander also serves as Trustee of other Fidelity funds. Previously, Mr. Selander served as a Member of the Advisory Board of other Fidelity funds (2011), and Executive Vice Chairman (2010), Chief Executive Officer (2009-2010), and President and Chief Executive Officer (1997-2009) of Mastercard, Inc. |
Cornelia M. Small (1944) |
Year of Election or Appointment: 2005 Trustee |
| Ms. Small also serves as Trustee of other Fidelity funds. Ms. Small is a member of the Board of Directors (2009-present) and Chair of the Investment Committee (2010-present) of the Teagle Foundation. Ms. Small also serves on the Investment Committee of the Berkshire Taconic Community Foundation (2008-present). Previously, Ms. Small served as Chairperson (2002-2008) and a member of the Investment Committee and Chairperson (2008-2012) and a member of the Board of Trustees of Smith College. In addition, Ms. Small served as Chief Investment Officer, Director of Global Equity Investments, and a member of the Board of Directors of Scudder, Stevens & Clark and Scudder Kemper Investments. |
William S. Stavropoulos (1939) |
Year of Election or Appointment: 2001 Trustee Vice Chairman of the Independent Trustees |
| Mr. Stavropoulos also serves as Trustee of other Fidelity funds. Mr. Stavropoulos serves as President and Founder of the Michigan Baseball Foundation, the Great Lakes Loons (2007-present). Mr. Stavropoulos is Chairman Emeritus of the Board of Directors of The Dow Chemical Company, where he previously served in numerous senior management positions, including President, CEO (1995-2000; 2002-2004), Chairman of the Executive Committee (2000-2006), and as a member of the Board of Directors (1990-2006). Currently, Mr. Stavropoulos is Chairman of the Board of Directors of Univar Inc. (global distributor of commodity and specialty chemicals), a Director of Teradata Corporation (data warehousing and technology solutions), and Maersk Inc. (industrial conglomerate), and a member of the Advisory Board for Metalmark Capital LLC (private equity investment, 2005-present). Mr. Stavropoulos is an operating advisor to Clayton, Dubilier & Rice, LLC (private equity investment). In addition, Mr. Stavropoulos is a member of the University of Notre Dame Advisory Council for the College of Science, a Trustee of the Rollin L. Gerstacker Foundation, and a Director of the Naples Philharmonic Center for the Arts. Previously, Mr. Stavropoulos served as a Director of Chemical Financial Corporation (bank holding company, 1993-2012) and Tyco International, Ltd. (multinational manufacturing and services, 2007-2012). |
David M. Thomas (1949) |
Year of Election or Appointment: 2008 Trustee |
| Mr. Thomas also serves as Trustee of other Fidelity funds. Mr. Thomas serves as Non-Executive Chairman of the Board of Directors of Fortune Brands Home and Security (home and security products, 2011-present), and as a member of the Board of Directors of Interpublic Group of Companies, Inc. (marketing communication, 2004-present). Previously, Mr. Thomas served as Executive Chairman (2005-2006) and Chairman and Chief Executive Officer (2000-2005) of IMS Health, Inc. (pharmaceutical and healthcare information solutions), and a Director of Fortune Brands, Inc. (consumer products, 2000-2011). |
+ The information above includes each Trustee's principal occupation during the last five years and other information relating to the experience, attributes, and skills relevant to each Trustee's qualifications to serve as a Trustee, which led to the conclusion that each Trustee should serve as a Trustee for the fund.
Advisory Board Member and Executive Officers:
Correspondence intended for each executive officer and Peter S. Lynch may be sent to Fidelity Investments, 245 Summer Street, Boston, Massachusetts 02210. Executive officers appear below in alphabetical order.
Name, Year of Birth; Principal Occupation |
Peter S. Lynch (1944) |
Year of Election or Appointment: 2003 Member of the Advisory Board |
| Mr. Lynch also serves as Member of the Advisory Board of other Fidelity funds. Mr. Lynch is Vice Chairman and a Director of FMR and FMR Co., Inc. In addition, Mr. Lynch serves as a Trustee of Boston College and as the Chairman of the Inner-City Scholarship Fund. Previously, Mr. Lynch served on the Special Olympics International Board of Directors (1997-2006). |
Elizabeth Paige Baumann (1968) |
Year of Election or Appointment: 2012 Anti-Money Laundering (AML) Officer |
| Ms. Baumann also serves as AML Officer of other funds. She is Chief AML Officer of FMR LLC (2012-present) and is an employee of Fidelity Investments. Previously, Ms. Baumann served as Vice President and Deputy Anti-Money Laundering Officer (2007-2012). |
William C. Coffey (1969) |
Year of Election or Appointment: 2009 Assistant Secretary |
| Mr. Coffey also serves as Assistant Secretary of other funds. He is Senior Vice President and Deputy General Counsel of FMR LLC (2010-present), and is an employee of Fidelity Investments. Previously, Mr. Coffey served as Vice President and Associate General Counsel of FMR LLC (2005-2009). |
Jonathan Davis (1968) |
Year of Election or Appointment: 2010 Assistant Treasurer |
| Mr. Davis also serves as Assistant Treasurer of other funds. Mr. Davis is an employee of Fidelity Investments. Previously, Mr. Davis served as Vice President and Associate General Counsel of FMR LLC (2003-2010). |
Adrien E. Deberghes (1967) |
Year of Election or Appointment: 2008 Deputy Treasurer |
| Mr. Deberghes also serves as an officer of other funds. He is an employee of Fidelity Investments (2008-present). Prior to joining Fidelity Investments, Mr. Deberghes was Senior Vice President of Mutual Fund Administration at State Street Corporation (2007-2008), Senior Director of Mutual Fund Administration at Investors Bank & Trust (2005-2007), and Director of Finance for Dunkin' Brands (2000-2005). |
Stephanie J. Dorsey (1969) |
Year of Election or Appointment: 2010 Assistant Treasurer |
| Ms. Dorsey also serves as an officer of other funds. She is an employee of Fidelity Investments (2008-present) and has served in other fund officer roles. Prior to joining Fidelity Investments, Ms. Dorsey served as Treasurer (2004-2008) of the JPMorgan Mutual Funds and Vice President (2004-2008) of JPMorgan Chase Bank. |
Scott C. Goebel (1968) |
Year of Election or Appointment: 2008 Secretary and Chief Legal Officer (CLO) |
| Mr. Goebel serves as Secretary and CLO of other funds. Mr. Goebel also serves as Secretary of Fidelity Investments Money Management, Inc. (FIMM) (2010-present) and Fidelity Research and Analysis Company (FRAC) (2010-present); General Counsel, Secretary, and Senior Vice President of FMR (2008-present) and FMR Co., Inc. (2008-present); Chief Legal Officer of Fidelity Management & Research (Hong Kong) Limited (2008-present) and Assistant Secretary of Fidelity Management & Research (Japan) Inc. (2008-present), and Fidelity Management & Research (U.K.) Inc. (2008-present). Previously, Mr. Goebel served as Secretary and CLO of other Fidelity funds (2008-2013), Assistant Secretary of FIMM (2008-2010), FRAC (2008-2010), and certain funds (2007-2008); and as Vice President and Secretary of Fidelity Distributors Corporation (FDC) (2005-2007). Mr. Goebel has been employed by FMR LLC or an affiliate since 2001. |
Joseph A. Hanlon (1968) |
Year of Election or Appointment: 2012 Chief Compliance Officer |
| Mr. Hanlon also serves as Chief Compliance Officer of other funds. Mr. Hanlon serves as Compliance Officer of FMR, FMR Co., Inc., Fidelity Investments Money Management, Inc. (FIMM), Fidelity Research and Analysis Company (FRAC), and Fidelity Management & Research (Hong Kong) (2009-present), as Senior Vice President of the Fidelity Asset Management Division (2009-present), and is an employee of Fidelity Investments. Previously, Mr. Hanlon served as Compliance Officer of Fidelity Management & Research (Japan) Inc. (2009-2013), Strategic Advisers, Inc. (2009-2013), and Fidelity Management & Research (U.K.) Inc. (2009-2013). |
Bruce T. Herring (1965) |
Year of Election or Appointment: 2006 Vice President of certain Equity Funds |
| Mr. Herring also serves as Vice President of other funds. He serves as Chief Investment Officer of Fidelity Global Asset Allocation (GAA) (2013-present), Chief Investment Officer and Director of Fidelity Management & Research (U.K.) Inc. (2010-present), Group Chief Investment Officer of FMR, and President of Fidelity Research & Analysis Company (2010-present). Previously, Mr. Herring served as Vice President (2005-2006) and Senior Vice President (2006-2007) of Fidelity Management & Research Company, Vice President of FMR Co., Inc. (2001-2007), and as a portfolio manager for Fidelity U.S. Equity Funds. |
Brian B. Hogan (1964) |
Year of Election or Appointment: 2009 Vice President |
| Mr. Hogan also serves as Vice President of other funds. Mr. Hogan serves as President of FMR's Equity Division (2009-present). Previously, Mr. Hogan served as Senior Vice President, Equity Research of FMR (2006-2009) and as a portfolio manager. |
Chris Maher (1972) |
Year of Election or Appointment: 2013 Assistant Treasurer |
| Mr. Maher serves as Assistant Treasurer of other funds. Mr. Maher is Vice President of Valuation Oversight and is an employee of Fidelity Investments. Previously, Mr. Maher served as Vice President of Asset Management Compliance (2013), Vice President of FMR's Program Management Group (2010-2013), and Vice President of Valuation Oversight (2008-2010). |
Christine Reynolds (1958) |
Year of Election or Appointment: 2008 Chief Financial Officer |
| Ms. Reynolds also serves as Chief Financial Officer of other funds. Ms. Reynolds became President of Fidelity Pricing and Cash Management Services (FPCMS) in August 2008. Ms. Reynolds served as Chief Operating Officer of FPCMS (2007-2008). Previously, Ms. Reynolds served as President, Treasurer, and Anti-Money Laundering officer of the Fidelity funds (2004-2007). |
Kenneth B. Robins (1969) |
Year of Election or Appointment: 2008 President and Treasurer |
| Mr. Robins also serves as an officer of other funds. Mr. Robins serves as Executive Vice President of Fidelity Investments Money Management, Inc. (FIMM) (2013-present) and is an employee of Fidelity Investments (2004-present). Previously, Mr. Robins served in other fund officer roles. |
Gary W. Ryan (1958) |
Year of Election or Appointment: 2005 Assistant Treasurer |
| Mr. Ryan also serves as Assistant Treasurer of other funds. Mr. Ryan is an employee of Fidelity Investments and has served in other fund officer roles. Previously, Mr. Ryan served as Vice President of Fund Reporting in Fidelity Pricing and Cash Management Services (FPCMS) (1999-2005). |
Stephen Sadoski (1971) |
Year of Election or Appointment: 2012 Deputy Treasurer |
| Mr. Sadoski also serves as Deputy Treasurer of other funds. He is an employee of Fidelity Investments (2012-present) and has served in another fund officer role. Prior to joining Fidelity Investments, Mr. Sadoski served as an assistant chief accountant in the Division of Investment Management of the Securities and Exchange Commission (SEC) (2009-2012) and as a senior manager at Deloitte & Touche LLP (1997-2009). |
Stacie M. Smith (1974) |
Year of Election or Appointment: 2013 Deputy Treasurer |
| Ms. Smith also serves as an officer of other funds. She is an employee of Fidelity Investments (2009-present) and has served in other fund officer roles. Prior to joining Fidelity Investments, Ms. Smith served as Senior Audit Manager of Ernst & Young LLP (1996-2009). |
Renee Stagnone (1975) |
Year of Election or Appointment: 2013 Deputy Treasurer |
| Ms. Stagnone also serves as Deputy Treasurer of other funds. Ms. Stagnone is an employee of Fidelity Investments. |
Joseph F. Zambello (1957) |
Year of Election or Appointment: 2011 Deputy Treasurer |
| Mr. Zambello also serves as Deputy Treasurer of other funds. Mr. Zambello is an employee of Fidelity Investments. Previously, Mr. Zambello served as Vice President of FMR's Program Management Group (2009-2011) and Vice President of the Transfer Agent Oversight Group (2005-2009). |
Annual Report
The Board of Trustees of Fidelity International Small Cap Fund voted to pay to shareholders of record at the opening of business on record date, the following distributions per share derived from capital gains realized from sales of portfolio securities, and dividends derived from net investment income:
| Pay Date | Record Date | Dividends | Capital Gains |
International Small Cap | 12/09/13 | 12/06/13 | $0.092 | $0.597 |
International Small Cap Fund designates 53% of the dividend distributed during the fiscal year as amounts which may be taken into account as a dividend for purposes of the maximum rate under section 1(h)(11) of the Internal Revenue Code.
The amounts per share which represent income derived from sources within, and taxes paid to, foreign countries or possessions of the United States are as follows:
| Pay Date | Income | Taxes |
International Small Cap | 12/10/12 | $0.2470 | $0.0142 |
The fund will notify shareholders in January 2014 of amounts for use in preparing 2013 income tax returns.
Annual Report
Board Approval of Investment Advisory Contracts and Management Fees
Fidelity International Small Cap Fund
Each year, the Board of Trustees, including the Independent Trustees (together, the Board), votes on the renewal of the management contract and sub-advisory agreements (together, the Advisory Contracts) for the fund. The Board, assisted by the advice of fund counsel and Independent Trustees' counsel, requests and considers a broad range of information relevant to the renewal of the Advisory Contracts throughout the year.
The Board meets regularly and, at each of its meetings, covers an extensive agenda of topics and materials and considers factors that are relevant to its annual consideration of the renewal of the fund's Advisory Contracts, including the services and support provided to the fund and its shareholders. The Board has established various standing committees, each composed of and chaired by Independent Trustees with varying backgrounds, to which the Board has assigned specific subject matter responsibilities in order to enhance effective decision-making by the Board. The Board, acting directly and through its Committees, requests and receives information concerning the annual consideration of the renewal of the fund's Advisory Contracts. The Board also meets as needed to consider matters specifically related to the Board's annual consideration of the renewal of Advisory Contracts. Members of the Board may also meet with trustees of other Fidelity funds through ad hoc joint committees to discuss certain matters relevant to the Fidelity funds.
At its July 2013 meeting, the Board, including the Independent Trustees, unanimously determined to renew the fund's Advisory Contracts. In reaching its determination, the Board considered all factors it believed relevant, including (i) the nature, extent, and quality of the services to be provided to the fund and its shareholders (including the investment performance of the fund); (ii) the competitiveness of the fund's management fee and total expense ratio relative to peer funds; (iii) the total costs of the services to be provided by and the profits to be realized by Fidelity from its relationship with the fund; (iv) the extent to which economies of scale exist and would be realized as the fund grows; and (v) whether fee levels reflect these economies of scale, if any, for the benefit of fund shareholders.
In considering whether to renew the Advisory Contracts for the fund, the Board reached a determination, with the assistance of fund counsel and Independent Trustees' counsel and through the exercise of its business judgment, that the renewal of the Advisory Contracts was in the best interests of the fund and its shareholders and that the compensation payable under the Advisory Contracts was fair and reasonable. The Board's decision to renew the Advisory Contracts was not based on any single factor, but rather was based on a comprehensive consideration of all the information provided to the Board at its meetings throughout the year. The Board, in reaching its determination to renew the Advisory Contracts, was aware that shareholders in the fund have a broad range of investment choices available to them, including a wide choice among mutual funds offered by Fidelity's competitors, and that the fund's shareholders, who have the opportunity to review and weigh the disclosure provided by the fund in its prospectus and other public disclosures, have chosen to invest in this fund, which is a part of the Fidelity family of funds.
Annual Report
Nature, Extent, and Quality of Services Provided. The Board considered the staffing within the investment adviser, Fidelity Management & Research Company (FMR), and the sub-advisers (together, the Investment Advisers) as it relates to the fund, including the backgrounds of the fund's investment personnel, and also considered the fund's investment objective, strategies, and related investment philosophy. The Independent Trustees also had discussions with senior management of Fidelity's investment operations and investment groups. The Board considered the structure of the portfolio manager compensation program and whether this structure provides appropriate incentives to act in the best interests of the fund.
Resources Dedicated to Investment Management and Support Services. The Board and the Fund Oversight and Research Committees reviewed the general qualifications and capabilities of the Investment Advisers' investment staff, including its size, education, experience, and resources, as well as the Investment Advisers' approach to recruiting, training, managing, and compensating investment personnel. The Board noted that FMR has continued to increase the resources devoted to non-U.S. offices, including expansion of Fidelity's global investment organization. The Board also noted that Fidelity's analysts have extensive resources, tools and capabilities that allow them to conduct sophisticated quantitative and fundamental analysis, as well as credit analysis of issuers, counterparties and guarantors. Further, the Board believes that Fidelity's investment professionals have sufficient access to global information and data so as to provide competitive investment results over time, and that those professionals also have access to sophisticated tools that permit them to assess portfolio construction and risk and performance attribution characteristics continuously, as well as to transmit new information and research conclusions rapidly around the world. Additionally, in its deliberations, the Board considered the Investment Advisers' trading and risk management capabilities and resources, which are an integral part of the investment management process.
Shareholder and Administrative Services. The Board considered (i) the nature, extent, quality, and cost of advisory, administrative, and shareholder services performed by the Investment Advisers and their affiliates under the Advisory Contracts and under separate agreements covering transfer agency, pricing and bookkeeping, and securities lending services for the fund; (ii) the nature and extent of the supervision of third party service providers, principally custodians and subcustodians; and (iii) the resources devoted to, and the record of compliance with, the fund's compliance policies and procedures. The Board also reviewed the allocation of fund brokerage, including allocations to brokers affiliated with the Investment Advisers, the use of brokerage commissions to pay fund expenses, and the use of "soft" commission dollars to pay for research services.
Annual Report
Board Approval of Investment Advisory Contracts and
Management Fees - continued
The Board noted that the growth of fund assets over time across the complex allows Fidelity to reinvest in the development of services designed to enhance the value or convenience of the Fidelity funds as investment vehicles. These services include 24-hour access to account information and market information through telephone representatives and over the Internet, investor education materials and asset allocation tools, and the expanded availability of Fidelity Investor Centers.
Investment in a Large Fund Family. The Board considered the benefits to shareholders of investing in a Fidelity fund, including the benefits of investing in a fund that is part of a large family of funds offering a variety of investment disciplines and providing a large variety of mutual fund investor services. The Board noted that Fidelity had taken, or had made recommendations that resulted in the Fidelity funds taking, a number of actions over the previous year that benefited particular funds, including (i) continuing to dedicate additional resources to investment research and to the support of the senior management team that oversees asset management; (ii) persisting in efforts to enhance Fidelity's global research capabilities; (iii) launching new funds and making other enhancements to meet client needs for global and income-oriented solutions; (iv) continuing to launch dedicated lower cost underlying funds to meet portfolio construction needs related to expanding underlying fund options for Fidelity funds of funds, specifically for the Freedom Fund product lines; (v) rationalizing product lines and gaining increased efficiencies through the mergers of several funds into other funds; (vi) strengthening Fidelity's index fund offerings by reducing investment minimums and adopting or lowering existing expense caps for certain funds and classes; (vii) enhancing Global Asset Allocation product offerings by launching new funds and strategies, including "open architecture" target date funds that utilize affiliated and unaffiliated sub-advisers; (viii) modifying the eligibility criteria for Institutional Class shares of Advisor funds to increase their marketability to a portion of the defined contribution plan market; (ix) creating a new low-cost retirement share class for certain Advisor funds to appeal to large retirement plans; (x) transitioning the management of certain Fidelity commodity funds to Geode Capital Management LLC, a registered commodity pool operator, while retaining administrative responsibilities for the funds; (xi) reorganizing a number of funds; and (xii) taking steps toward establishing a new Fidelity adviser to manage sector-based funds and products.
Investment Performance. The Board considered whether the fund has operated in accordance with its investment objective, as well as its record of compliance with its investment restrictions and its performance history.
The Board took into account discussions with the Investment Advisers about fund investment performance that occur at Board meetings throughout the year. In this regard the Board noted that as part of regularly scheduled fund reviews and other reports to the Board on fund performance, the Board periodically considers annualized return information for the fund, for different time periods, measured against a securities market index ("benchmark index") and a peer group of mutual funds with similar objectives ("peer group"). In its evaluation of fund investment performance, the Board gave particular attention to information indicating changes in performance of certain Fidelity funds for specific time periods and the Investment Advisers' explanations for any overperformance or underperformance.
Annual Report
In addition to reviewing absolute and relative fund performance, the Independent Trustees periodically consider the appropriateness of fund performance metrics in evaluating the results achieved. In general, the Independent Trustees believe that fund performance should be evaluated based on net performance (after fees and expenses) of both the highest performing and lowest performing classes, where applicable, compared to appropriate benchmark indices, over appropriate time periods which may include full market cycles, and compared to peer groups, as applicable, over the same periods, taking into account relevant factors including the following: general market conditions; issuer-specific information; tactical opportunities for investment; and fund cash flows and other factors.
The Independent Trustees recognize that shareholders evaluate performance on a net basis over their own holding periods, for which one-, three-, and five-year periods are used as a proxy. For this reason, the performance information reviewed by the Board also included net cumulative calendar year total return information for the fund and an appropriate benchmark index and peer group for the most recent one-, three-, and five-year periods, as shown below. Returns are shown compared to the 25th percentile (top of box) and 75th percentile (bottom of box) of the peer universe. Returns of the benchmark index are "net MA," i.e., adjusted for tax withholding rates applicable to U.S.-based mutual funds organized as Massachusetts business trusts.
Annual Report
Board Approval of Investment Advisory Contracts and
Management Fees - continued
Fidelity International Small Cap Fund
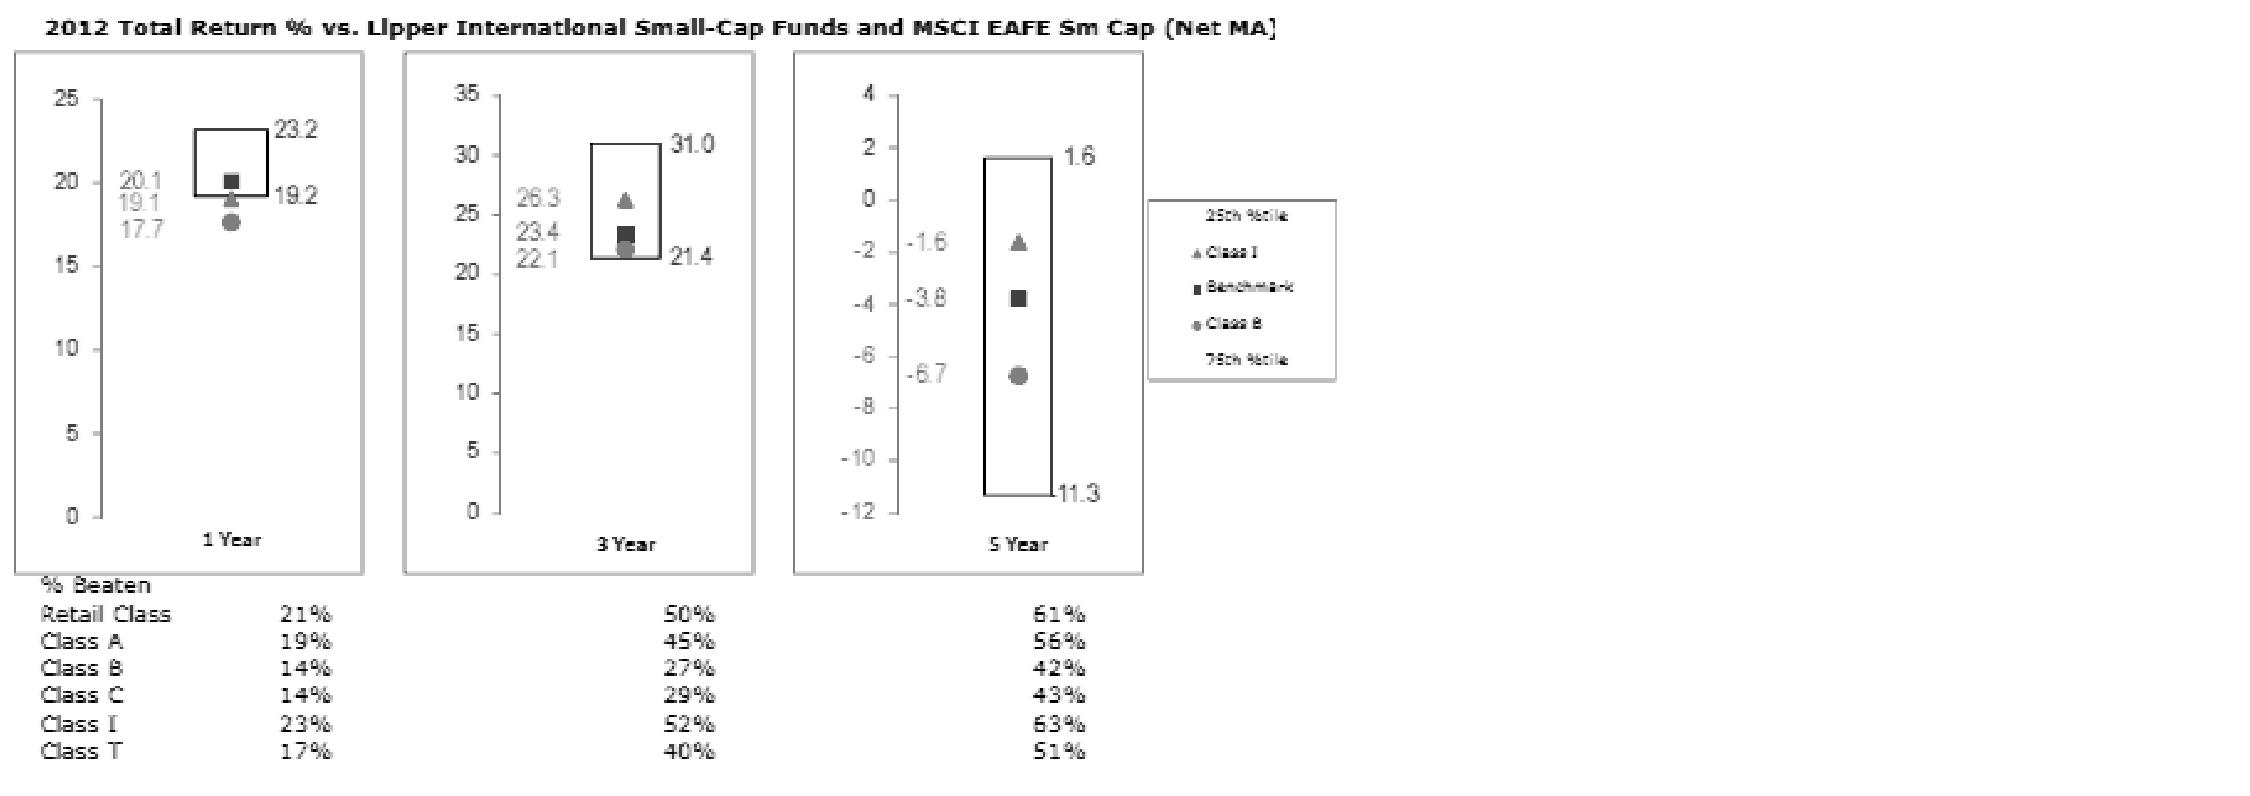
The Board also considered that the fund's management fee is subject to upward or downward adjustment depending upon whether, and to what extent, the fund's investment performance for the performance period exceeds, or is exceeded by, a securities index, thus leading to a performance adjustment for the same period. The Board noted that the performance adjustment provides FMR with a strong economic incentive to seek to achieve superior performance for the fund's shareholders and helps to more closely align the interests of FMR and the fund's shareholders.
Based on its review, the Board concluded that the nature, extent, and quality of services provided to the fund under the Advisory Contracts should benefit the fund's shareholders.
Competitiveness of Management Fee and Total Expense Ratio. The Board considered the fund's management fee and total expense ratio compared to "mapped groups" of competitive funds and classes. Fidelity creates "mapped groups" by combining similar Lipper investment objective categories that have comparable management fee characteristics. Combining Lipper investment objective categories aids the Board's management fee and total expense ratio comparisons by broadening the competitive group used for comparison and by reducing the number of universes to which various Fidelity funds are compared.
Management Fee. The Board considered two proprietary management fee comparisons for the 12-month periods shown in the chart below. The group of Lipper funds used by the Board for management fee comparisons is referred to below as the "Total Mapped Group." The Total Mapped Group is broader than the Lipper peer group used by the Board for performance comparisons because the Total Mapped Group combines several Lipper investment objective categories while the Lipper peer group does not. The Total Mapped Group comparison focuses on a fund's standing in terms of gross management fees before expense reimbursements or caps, and without giving effect to the fund's performance adjustment, relative to the total universe of funds with comparable investment mandates, regardless of whether their management fee structures also are comparable. Funds with comparable investment mandates offer exposure to similar types of securities. Funds with comparable management fee structures have similar management fee contractual arrangements (e.g., flat rate charged for advisory services, all-inclusive fee rate, etc.). "TMG %" represents the percentage of funds in the Total Mapped Group that had management fees that were lower than the fund's. For example, a TMG % of 19% means that 81% of the funds in the Total Mapped Group had higher management fees than the fund. The "Asset-Size Peer Group" (ASPG) comparison focuses on a fund's standing relative to a subset of non-Fidelity funds within the Total Mapped Group that are similar in size and management fee structure. The ASPG represents at least 15% of the funds in the Total Mapped Group with comparable asset size and management fee structures, subject to a minimum of 50 funds (or all funds in the Total Mapped Group if fewer than 50). Additional information, such as the ASPG quartile in which the fund's management fee ranked and the impact of the fund's performance adjustment, is also included in the chart and considered by the Board.
Annual Report
Fidelity International Small Cap Fund

The Board noted that the fund's management fee ranked below the median of its Total Mapped Group and below the median of its ASPG for 2012. The Board also noted the effect of the fund's positive performance adjustment on the fund's management fee ranking.
Annual Report
Board Approval of Investment Advisory Contracts and
Management Fees - continued
Based on its review, the Board concluded that the fund's management fee is fair and reasonable in light of the services that the fund receives and the other factors considered.
Total Expense Ratio. In its review of each class's total expense ratio, the Board considered the fund's management fee as well as other fund or class expenses, as applicable, such as transfer agent fees, pricing and bookkeeping fees, fund-paid 12b-1 fees, and custodial, legal, and audit fees. The Board also noted the effects of any waivers and reimbursements on fees and expenses, as well as the impact of the fund's performance adjustment. As part of its review, the Board also considered the current and historical total expense ratios of each class of the fund compared to competitive fund median expenses. Each class of the fund is compared to those funds and classes in the Total Mapped Group (used by the Board for management fee comparisons) that have a similar sales load structure.
The Board noted that the total expense ratio of each of Class A, Class C, Institutional Class, and the retail class ranked below its competitive median for 2012, the total expense ratio of Class B ranked equal to its competitive median for 2012, and the total expense ratio of Class T ranked above its competitive median for 2012. The Board considered that, in general, various factors can affect total expense ratios. The Board noted that the total expense ratio of Class T was above the competitive median primarily because of higher 12b-1 fees on Class T. Class T has a higher 12b-1 fee, but a lower front-end sales charge, than traditionally priced front-end sales charge classes. The Board considered that Class T is primarily sold load-waived in the retirement plan market where its 0.50% 12b-1 fee is comparable to competing no-load, higher 12b-1 fee classes designed specifically for retirement plans. The Board noted that the fund offers multiple classes, each of which has a different sales load and 12b-1 fee structure, and that the multiple structures are intended to offer a range of pricing options for the intermediary market. The Board also noted that the total expense ratios of the classes vary primarily by the level of their 12b-1 fees, although differences in transfer agent fees may also cause expenses to vary from class to class.
Fees Charged to Other Fidelity Clients. The Board also considered Fidelity fee structures and other information with respect to clients of FMR and its affiliates, such as other mutual funds advised or subadvised by FMR or its affiliates, pension plan clients, and other institutional clients. The Board noted the findings of the 2013 ad hoc joint committee (created with the board of other Fidelity funds), which reviewed and compared Fidelity's institutional investment advisory business with its business of providing services to the Fidelity funds, including the differences in services provided, fees charged, and costs incurred, as well as competition in their respective marketplaces.
Annual Report
Based on its review of total expense ratios and fees charged to other Fidelity clients, the Board concluded that the total expense ratio of each class of the fund was reasonable, although Class T was above the median of the universe presented for comparison, in light of the services that the fund and its shareholders receive and the other factors considered.
Costs of the Services and Profitability. The Board considered the revenues earned and the expenses incurred by Fidelity in conducting the business of developing, marketing, distributing, managing, administering and servicing the fund and servicing the fund's shareholders. The Board also considered the level of Fidelity's profits in respect of all the Fidelity funds.
On an annual basis, FMR presents to the Board Fidelity's profitability for the fund. Fidelity calculates the profitability for each fund, as well as aggregate profitability for groups of Fidelity funds and all Fidelity funds, using a series of detailed revenue and cost allocation methodologies which originate with the books and records of Fidelity on which Fidelity's audited financial statements are based. The Audit Committee of the Board reviews any significant changes from the prior year's methodologies.
PricewaterhouseCoopers LLP (PwC), independent registered public accounting firm and auditor to Fidelity and certain Fidelity funds, has been engaged annually by the Board as part of the Board's assessment of Fidelity's profitability analysis. PwC's engagement includes the review and assessment of the methodologies used by Fidelity in determining the revenues and expenses attributable to Fidelity's mutual fund business, and completion of agreed-upon procedures surrounding the mathematical accuracy of fund profitability and its conformity to allocation methodologies. After considering PwC's reports issued under the engagement and information provided by Fidelity, the Board concluded that while other allocation methods may also be reasonable, Fidelity's profitability methodologies are reasonable in all material respects.
The Board also reviewed Fidelity's non-fund businesses and fall-out benefits related to the mutual fund business as well as cases where Fidelity's affiliates may benefit from or be related to the fund's business.
The Board considered the costs of the services provided by and the profits realized by Fidelity in connection with the operation of the fund and was satisfied that the profitability was not excessive in the circumstances.
Economies of Scale. The Board considered whether there have been economies of scale in respect of the management of the Fidelity funds, whether the Fidelity funds (including the fund) have appropriately benefited from any such economies of scale, and whether there is potential for realization of any further economies of scale. The Board considered the extent to which the fund will benefit from economies of scale through increased services to the fund, through waivers or reimbursements, or through fee or expense reductions. The Board also noted that in 2009, it and the board of other Fidelity funds created an ad hoc committee (the Economies of Scale Committee) to analyze whether FMR attains economies of scale in respect of the management and servicing of the Fidelity funds, whether the Fidelity funds have appropriately benefited from such economies of scale, and whether there is potential for realization of any further economies of scale.
Annual Report
Board Approval of Investment Advisory Contracts and
Management Fees - continued
The Board recognized that the fund's management contract incorporates a "group fee" structure, which provides for lower group fee rates as total fund assets under FMR's management increase, and for higher group fee rates as total fund assets under FMR's management decrease. FMR calculates the group fee rates based on a tiered asset "breakpoint" schedule that varies based on asset class. The Board considered that the group fee is designed to deliver the benefits of economies of scale to fund shareholders when total Fidelity fund assets increase, even if assets of any particular fund are unchanged or have declined, because some portion of Fidelity's costs are attributable to services provided to all Fidelity funds, and all funds benefit if those costs can be allocated among more assets. The Board concluded that, given the group fee structure, fund shareholders will benefit from lower management fees as assets under FMR's management increase at the fund complex level, regardless of whether Fidelity achieves any such economies of scale.
The Board concluded, taking into account the analysis of the Economies of Scale Committee, that economies of scale, if any, are being appropriately shared between fund shareholders and Fidelity.
Amendment to Description of Group Fee Rate. At its July 2013 meeting, the Board voted to approve an amendment to the fund's management contract to modify the description of the "group fee rate" effective August 1, 2013. The Board noted that under the prior description in the contract, the group fee rate was based on the average net assets of all registered investment companies with which FMR has management contracts. Under the contract's tiered asset breakpoint schedule, the group fee rate is lower as total fund assets under FMR's management increase, and higher as total fund assets under FMR's management decrease. The Board considered that the prior description would have excluded the assets of 64 Fidelity sector funds from the group fee rate calculation once Fidelity SelectCo, LLC, an affiliate of FMR, assumed management responsibilities for those funds. The Board noted that modifying the description of the group fee rate to continue to include the assets of those 64 funds for purposes of determining group fee rate breakpoints would avoid an immediate adverse impact on the group fee rate for any fund.
Additional Information Requested by the Board. In order to develop fully the factual basis for consideration of the Fidelity funds' Advisory Contracts, the Board requested and received additional information on certain topics, including: (i) fund performance trends and Fidelity's long-term strategies for certain funds; (ii) the potential to further rationalize the Fidelity fund lineup with the possibility of achieving savings for the funds and Fidelity; (iii) the methodology with respect to competitive fund data and peer group classifications; (iv) the arrangements with, and performance of, certain sub-advisers on behalf of the Fidelity funds, as well as certain proposed participating affiliate arrangements; (v) the realization of fall-out benefits in certain Fidelity business units; (vi) Fidelity's group fee structures, including the rationale for the individual fee rates of certain categories of funds and the definition of group assets; (vii) trends regarding industry use of performance fee structures and the performance adjustment methodologies applicable to the Fidelity funds; (viii) additional competitive analysis regarding the total expenses for certain classes; and (ix) fund profitability methodology, including Fidelity's cost allocation methodology, and the impact of certain factors on fund profitability results.
Annual Report
Based on its evaluation of all of the conclusions noted above, and after considering all factors it believed relevant, the Board ultimately concluded that the advisory fee structures are fair and reasonable, and that the fund's Advisory Contracts should be renewed.
Annual Report
Investment Adviser
Fidelity Management & Research Company
Boston, MA
Investment Sub-Advisers
FMR Co., Inc.
Fidelity Management & Research
(U.K.) Inc.
Fidelity Management & Research
(Hong Kong) Limited
Fidelity Management & Research
(Japan) Inc.
FIL Investment Advisors
FIL Investments (Japan) Limited
FIL Investment Advisors (UK)
Limited
General Distributor
Fidelity Distributors Corporation
Smithfield, RI
Transfer and Service Agents
Fidelity Investments Institutional
Operations Company, Inc.
Boston, MA
Fidelity Service Company, Inc.
Boston, MA
Custodian
The Bank of New York Mellon
New York, NY
The Fidelity Telephone Connection
Mutual Fund 24-Hour Service
Exchanges/Redemptions
and Account Assistance 1-800-544-6666
Product Information 1-800-544-8888
Retirement Accounts 1-800-544-4774
(8 a.m. - 9 p.m.)
TDD Service 1-800-544-0118
for the deaf and hearing impaired
(9 a.m. - 9 p.m. Eastern time)
Fidelity Automated Service
Telephone (FAST®)
1-800-544-5555
Automated line for quickest service
(Fidelity Investment logo)(registered trademark)
Corporate Headquarters
245 Summer St., Boston, MA 02210
www.fidelity.com
ISC-UANN-1213
1.793584.110
(Fidelity Investment logo)(registered trademark)
Fidelity Advisor®
International Small Cap
Fund - Class A, Class T, Class B
and Class C
Annual Report
October 31, 2013
(Fidelity Cover Art)
Class A, Class T, Class B, and
Class C are classes of Fidelity®
International Small Cap Fund
Contents
Performance | (Click Here) | How the fund has done over time. |
Management's Discussion of Fund Performance | (Click Here) | The Portfolio Managers' review of fund performance and strategy. |
Shareholder Expense Example | (Click Here) | An example of shareholder expenses. |
Investment Changes | (Click Here) | A summary of major shifts in the fund's investments over the past six months. |
Investments | (Click Here) | A complete list of the fund's investments with their market values. |
Financial Statements | (Click Here) | Statements of assets and liabilities, operations, and changes in net assets, as well as financial highlights. |
Notes | (Click Here) | Notes to financial statements. |
Report of Independent Registered Public Accounting Firm | (Click Here) | |
Trustees and Officers | (Click Here) | |
Distributions | (Click Here) | |
Board Approval of Investment Advisory Contracts and Management Fees | (Click Here) | |
To view a fund's proxy voting guidelines and proxy voting record for the 12-month period ended June 30, visit http://www.fidelity.com/proxyvotingresults or visit the Securities and Exchange Commission's (SEC) web site at http://www.sec.gov. You may also call 1-877-208-0098 to request a free copy of the proxy voting guidelines.
Standard & Poor's, S&P and S&P 500 are registered service marks of The McGraw-Hill Companies, Inc. and have been licensed for use by Fidelity Distributors Corporation.
Other third-party marks appearing herein are the property of their respective owners.
All other marks appearing herein are registered or unregistered trademarks or service marks of FMR LLC or an affiliated company. © 2013 FMR LLC. All rights reserved.
Annual Report
This report and the financial statements contained herein are submitted for the general information of the shareholders of the fund. This report is not authorized for distribution to prospective investors in the fund unless preceded or accompanied by an effective prospectus.
A fund files its complete schedule of portfolio holdings with the SEC for the first and third quarters of each fiscal year on Form N-Q. Forms N-Q are available on the SEC's web site at http://www.sec.gov. A fund's Forms N-Q may be reviewed and copied at the SEC's Public Reference Room in Washington, DC. Information regarding the operation of the SEC's Public Reference Room may be obtained by calling 1-800-SEC-0330. For a complete list of a fund's portfolio holdings, view the most recent holdings listing, semiannual report, or annual report on Fidelity's web site at http://www.fidelity.com, http://www.advisor.fidelity.com, or http://www.401k.com, as applicable.
NOT FDIC INSURED • MAY LOSE VALUE • NO BANK GUARANTEE
Neither the fund nor Fidelity Distributors Corporation is a bank.
Annual Report
Average annual total return reflects the change in the value of an investment, assuming reinvestment of the class' distributions from dividend income and capital gains (the profits earned upon the sale of securities that have grown in value, if any) and assuming a constant rate of performance each year. The $10,000 table and the fund's returns do not reflect the deduction of taxes that a shareholder would pay on fund distributions or the redemption of fund shares. During periods of reimbursement by Fidelity, a fund's total return will be greater than it would be had the reimbursement not occurred. How a fund did yesterday is no guarantee of how it will do tomorrow.
Average Annual Total Returns
Periods ended October 31, 2013 | Past 1
year | Past 5
years | Past 10
years |
Class A (incl. 5.75% sales charge) | 28.35% | 18.08% | 10.59% |
Class T (incl. 3.50% sales charge) | 31.04% | 18.33% | 10.56% |
Class B (incl. contingent deferred sales charge) A | 30.14% | 18.39% | 10.63% |
Class C (incl. contingent deferred sales charge) B | 34.15% | 18.60% | 10.42% |
A Class B shares' contingent deferred sales charge included in the past one year, past five years, and past ten years total return figures are 5%, 2%, and 0%, respectively.
B Class C shares' contingent deferred sales charge included in the past one year, past five years, and past ten years total return figures are 1%, 0%, and 0%, respectively.
Annual Report
$10,000 Over 10 Years
Let's say hypothetically that $10,000 was invested in Fidelity Advisor® International Small Cap Fund - Class A on October 31, 2003, and the current 5.75% sales charge was paid. The chart shows how the value of your investment would have changed, and also shows how the MSCI® EAFE® Small Cap Index performed over the same period.
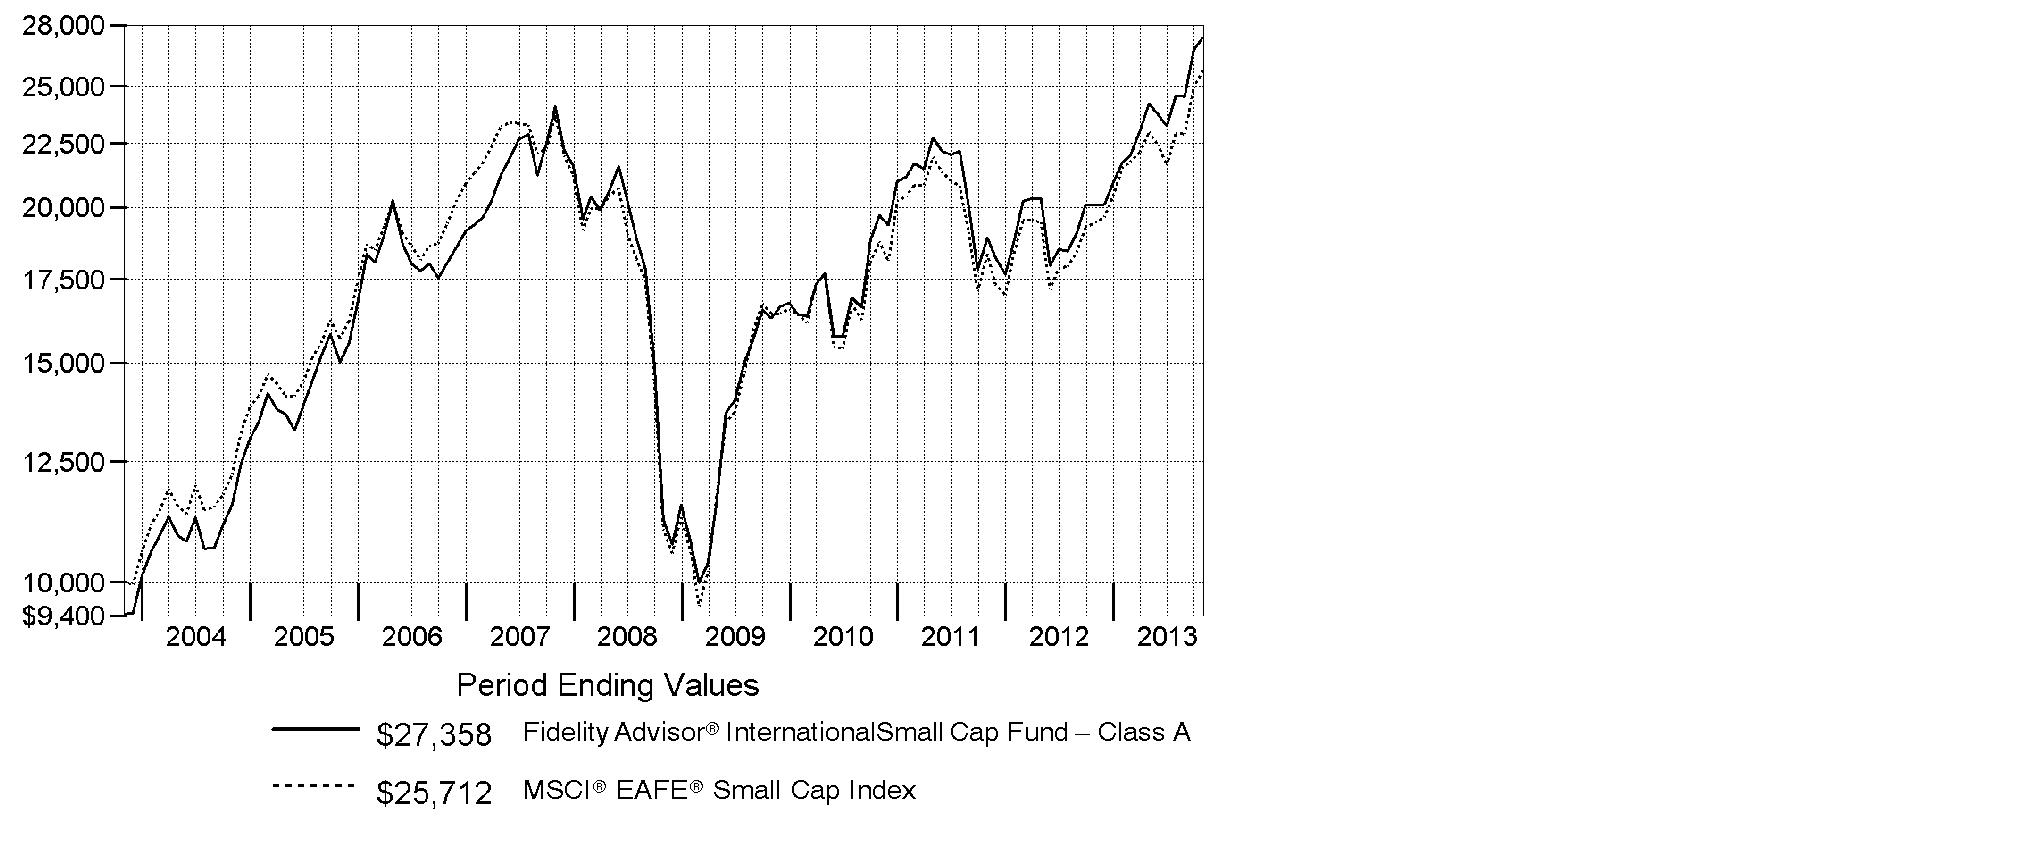
Annual Report
Market Recap: On balance, global equity markets remained upbeat for the 12-month period ending October 31, 2013. The MSCI® ACWI® (All Country World Index) Index gained 23.75% for the period, amid investor preference for higher-risk assets. The period was not without turbulence, however. In the spring and summer, central banks worldwide, especially in the U.S. and China, made clear their intentions to maintain accommodative monetary policies. That stance, combined with modest cyclical improvements around the globe and generally low valuations, underpinned the broad rally in equities. Europe (+32%) shone brightly, with most markets in the region - large and small - registering solid, index-beating gains. Another bright spot was Japan, which, despite a struggling yen and taking a second-half breather, posted a 34% result for the full year. The U.S. - by far the index's biggest constituent - also outperformed the global market with a roughly 28% advance. Meanwhile, Asia-Pacific ex Japan (+14%) lagged, hurt in part by a slowdown in Australia's mining industry as well as currency headwinds. Foreign-exchange and commodity weakness also curbed results in resource-heavy Canada and emerging markets (EM), both of which were up 7%. Country-level EM performance diverged meaningfully for the period, as evidenced by performance in Brazil (-1%), Russia (+12%), India (+1%) and China (+8%).
Comments from Colin Stone, Dale Nicholls and Nicholas Price, Co-Portfolio Managers of Fidelity Advisor® International Small Cap Fund: For the year, the fund's Class A, Class T, Class B and Class C shares returned 36.18%, 35.80%, 35.14% and 35.15%, respectively (excluding sales charges), surpassing the 32.33% gain of the MSCI® EAFE® Small Cap Index. The Japanese and Asia-Pacific ex Japan subportfolios outperformed their respective benchmarks by substantial margins, but the emerging Europe/Middle East/Africa (EMEA) sleeve trailed its benchmark, weighed down by security selection in materials and energy. Versus the index, a non-index stake in Dublin-based mineral sands miner Kenmare Resources detracted from the EMEA subportfolio's results, while one key contributor was U.K. online-only food retailer Ocado Group. In the Asia-Pacific ex Japan subportfolio, one positive was Sino Gas & Energy Holdings, an Australian exploration and production firm developing gas assets in China. On the negative side, relative performance suffered from not owning high-flying casino stock and Hong Kong benchmark component Melco International Development. In the Japanese subportfolio, our results were lifted by Pigeon, Japan's leading manufacturer of baby-care products. A non-index position in video game developer Nintendo worked against us, and I sold it in the first quarter of 2013.
The views expressed above reflect those of the portfolio manager(s) only through the end of the period as stated on the cover of this report and do not necessarily represent the views of Fidelity or any other person in the Fidelity organization. Any such views are subject to change at any time based upon market or other conditions and Fidelity disclaims any responsibility to update such views. These views may not be relied on as investment advice and, because investment decisions for a Fidelity fund are based on numerous factors, may not be relied on as an indication of trading intent on behalf of any Fidelity fund.
Annual Report
Shareholder Expense Example
As a shareholder of the Fund, you incur two types of costs: (1) transaction costs, including sales charges (loads) on purchase payments or redemption proceeds, redemption fees and (2) ongoing costs, including management fees, distribution and/or service (12b-1) fees and other Fund expenses. This Example is intended to help you understand your ongoing costs (in dollars) of investing in the Fund and to compare these costs with the ongoing costs of investing in other mutual funds.
The Example is based on an investment of $1,000 invested at the beginning of the period and held for the entire period (May 1, 2013 to October 31, 2013).
Actual Expenses
The first line of the accompanying table for each class of the Fund provides information about actual account values and actual expenses. You may use the information in this line, together with the amount you invested, to estimate the expenses that you paid over the period. Simply divide your account value by $1,000.00 (for example, an $8,600 account value divided by $1,000.00 = 8.6), then multiply the result by the number in the first line for a class of the Fund under the heading entitled "Expenses Paid During Period" to estimate the expenses you paid on your account during this period. A small balance maintenance fee of $12.00 that is charged once a year may apply for certain accounts with a value of less than $2,000. This fee is not included in the table below. If it was, the estimate of expenses you paid during the period would be higher, and your ending account value lower, by this amount. In addition, the Fund, as a shareholder in the underlying Fidelity Central Funds, will indirectly bear its pro-rata share of the fees and expenses incurred by the underlying Fidelity Central Funds. These fees and expenses are not included in the Fund's annualized expense ratio used to calculate the expense estimate in the table below.
Hypothetical Example for Comparison Purposes
The second line of the accompanying table for each class of the Fund provides information about hypothetical account values and hypothetical expenses based on a Class' actual expense ratio and an assumed rate of return of 5% per year before expenses, which is not the Class' actual return. The hypothetical account values and expenses may not be used to estimate the actual ending account balance or expenses you paid for the period. You may use this information to compare the ongoing costs of investing in the Fund and other funds. To do so, compare this 5% hypothetical example with the 5% hypothetical examples that appear in the shareholder reports of the other funds. A small balance maintenance fee of $12.00 that is charged once a year may apply for certain accounts with a value of less than $2,000. This fee is not included in the table below. If it was, the estimate of expenses you paid during the period would be higher, and your ending account value lower, by this amount. In addition, the Fund, as a shareholder in the underlying Fidelity Central Funds, will indirectly bear its pro-rata share of the fees and expenses incurred by the underlying Fidelity Central Funds. These fees and expenses are not included in the Fund's annualized expense ratio used to calculate the expense estimate in the table below.
Please note that the expenses shown in the table are meant to highlight your ongoing costs only and do not reflect any transaction costs. Therefore, the second line of the table is useful in comparing ongoing costs only, and will not help you determine the relative total costs of owning different funds. In addition, if these transactional costs were included, your costs would have been higher.
Annual Report
| Annualized
Expense RatioB | Beginning
Account Value
May 1, 2013 | Ending
Account Value
October 31, 2013 | Expenses Paid
During Period*
May 1, 2013
to October 31, 2013 |
Class A | 1.63% | | | |
Actual | | $ 1,000.00 | $ 1,129.50 | $ 8.75 |
HypotheticalA | | $ 1,000.00 | $ 1,016.99 | $ 8.29 |
Class T | 1.88% | | | |
Actual | | $ 1,000.00 | $ 1,128.00 | $ 10.08 |
HypotheticalA | | $ 1,000.00 | $ 1,015.73 | $ 9.55 |
Class B | 2.37% | | | |
Actual | | $ 1,000.00 | $ 1,125.30 | $ 12.70 |
HypotheticalA | | $ 1,000.00 | $ 1,013.26 | $ 12.03 |
Class C | 2.34% | | | |
Actual | | $ 1,000.00 | $ 1,125.30 | $ 12.54 |
HypotheticalA | | $ 1,000.00 | $ 1,013.41 | $ 11.88 |
International Small Cap | 1.33% | | | |
Actual | | $ 1,000.00 | $ 1,131.00 | $ 7.14 |
HypotheticalA | | $ 1,000.00 | $ 1,018.50 | $ 6.77 |
Institutional Class | 1.21% | | | |
Actual | | $ 1,000.00 | $ 1,131.50 | $ 6.50 |
HypotheticalA | | $ 1,000.00 | $ 1,019.11 | $ 6.16 |
A 5% return per year before expenses
B Annualized expense ratio reflects expenses net of applicable fee waivers.
* Expenses are equal to each Class' annualized expense ratio, multiplied by the average account value over the period, multiplied by 184/365 (to reflect the one-half year period).
Annual Report
Investment Changes (Unaudited)
Geographic Diversification (% of fund's net assets) |
As of October 31, 2013 |
 | Japan 26.4% | |
 | United Kingdom 18.0% | |
 | Germany 9.7% | |
 | United States of America* 5.6% | |
 | France 3.9% | |
 | Cayman Islands 3.4% | |
 | Australia 3.4% | |
 | Ireland 2.7% | |
 | Bermuda 2.6% | |
 | Other 24.3% | |

* Includes Short-Term Investments and Net Other Assets (Liabilities) |
Percentages are based on country or territory of incorporation and are adjusted for the effect of futures contracts, if applicable. |
As of April 30, 2013 |
| Japan 29.9% | |
| United Kingdom 18.9% | |
| Germany 7.6% | |
| Australia 4.7% | |
| United States of America* 4.1% | |
| Cayman Islands 3.4% | |
| France 3.3% | |
| Luxembourg 2.7% | |
| Singapore 2.6% | |
 | Other 22.8% | |

* Includes Short-Term Investments and Net Other Assets (Liabilities) |
Percentages are based on country or territory of incorporation and are adjusted for the effect of futures contracts, if applicable. |
Asset Allocation as of October 31, 2013 |
| % of fund's
net assets | % of fund's net assets
6 months ago |
Stocks | 94.3 | 95.8 |
Bonds | 0.2 | 0.2 |
Short-Term Investments and Net Other Assets (Liabilities) | 5.5 | 4.0 |
Top Ten Stocks as of October 31, 2013 |
| % of fund's
net assets | % of fund's net assets
6 months ago |
Tokyo Tatemono Co. Ltd. (Japan, Real Estate Management & Development) | 1.9 | 1.5 |
Pigeon Corp. (Japan, Household Products) | 1.7 | 2.0 |
Eurofins Scientific SA (Luxembourg, Life Sciences Tools & Services) | 1.4 | 1.4 |
Hokkaido Electric Power Co., Inc. (Japan, Electric Utilities) | 1.4 | 0.0 |
Aareal Bank AG (Germany, Thrifts & Mortgage Finance) | 1.3 | 0.0 |
Playtech Ltd. (Isle of Man, Software) | 1.2 | 1.3 |
Wirecard AG (Germany, IT Services) | 1.2 | 0.9 |
ASOS PLC (United Kingdom, Internet & Catalog Retail) | 1.2 | 1.1 |
Foster Electric Co. Ltd. (Japan, Household Durables) | 1.2 | 0.0 |
Stanley Electric Co. Ltd. (Japan, Auto Components) | 1.2 | 0.7 |
| 13.7 | |
Market Sectors as of October 31, 2013 |
| % of fund's
net assets | % of fund's net assets
6 months ago |
Consumer Discretionary | 22.5 | 23.0 |
Financials | 17.7 | 17.8 |
Industrials | 16.1 | 14.8 |
Information Technology | 14.4 | 16.1 |
Health Care | 8.7 | 8.6 |
Energy | 4.8 | 5.2 |
Materials | 4.7 | 5.4 |
Consumer Staples | 3.2 | 3.8 |
Utilities | 1.9 | 0.3 |
Telecommunication Services | 0.5 | 1.0 |
Annual Report
Investments October 31, 2013
Showing Percentage of Net Assets
Common Stocks - 93.6% |
| Shares | | Value |
Australia - 3.4% |
Acrux Ltd. | 381,062 | | $ 965,231 |
Alkane Resources Ltd. (a) | 911,891 | | 336,131 |
Austal Ltd. (a) | 3,050,012 | | 2,176,453 |
Base Resources Ltd. (a) | 750,579 | | 294,405 |
Beach Energy Ltd. | 1,213,515 | | 1,640,144 |
Berkeley Resources Ltd. (a) | 1,198,037 | | 294,404 |
Boart Longyear Ltd. (d) | 1,678,919 | | 682,337 |
Clinuvel Pharmaceuticals Ltd. (a)(d) | 325,070 | | 476,222 |
Dart Energy Ltd. (a)(d) | 10,057,900 | | 1,330,871 |
Donaco International Ltd. (d) | 2,061,089 | | 1,383,107 |
Goodman Group unit | 202,411 | | 968,022 |
Greencross Ltd. | 154,770 | | 958,140 |
iiNet Ltd. | 133,255 | | 818,649 |
Iluka Resources Ltd. | 80,327 | | 781,987 |
Independence Group NL | 244,610 | | 915,525 |
iProperty Group Ltd. (a) | 601,773 | | 1,035,154 |
Karoon Gas Australia Ltd. (a) | 452,184 | | 1,893,301 |
Maverick Drilling & Exploration Ltd. (a)(d) | 971,087 | | 468,090 |
Nanosonics Ltd. (a) | 1,384,184 | | 1,138,188 |
Navitas Ltd. | 273,638 | | 1,500,048 |
Neon Energy Ltd. (a) | 1,049,972 | | 287,791 |
NewSat Ltd. (a) | 2,252,414 | | 1,021,857 |
Normandy Mt. Leyshon Ltd. (a) | 1,907,227 | | 225,327 |
Prairie Downs Metals Ltd. (a) | 881,954 | | 291,753 |
Prana Biotechnology Ltd. (a)(d) | 2,224,059 | | 1,064,716 |
QRxPharma Ltd. (a)(d) | 249,195 | | 163,691 |
Ramsay Health Care Ltd. | 10,050 | | 368,552 |
SEEK Ltd. | 161,332 | | 1,980,753 |
Sierra Mining Ltd. (a) | 2,406,178 | | 648,147 |
Silver Lake Resources Ltd. (a) | 840,689 | | 611,824 |
Sino Gas & Energy Ltd. (a) | 22,392,147 | | 4,973,525 |
Sirtex Medical Ltd. | 98,794 | | 1,161,587 |
SomnoMed Ltd. (a) | 584,445 | | 684,961 |
Spark Infrastructure Group unit | 1,255,671 | | 2,011,622 |
Starpharma Holdings Ltd. (a) | 869,513 | | 735,529 |
Tiger Resources Ltd. (a) | 1,511,941 | | 564,459 |
Tissue Therapies Ltd. (a) | 2,581,301 | | 609,929 |
Troy Resources NL (d) | 289,032 | | 366,059 |
Vision Group Holdings Ltd. (a) | 1,221,604 | | 837,084 |
TOTAL AUSTRALIA | | 38,665,575 |
Common Stocks - continued |
| Shares | | Value |
Austria - 0.3% |
Ams AG | 30,950 | | $ 3,380,333 |
Bailiwick of Jersey - 1.9% |
Informa PLC | 1,067,014 | | 9,572,207 |
LXB Retail Properties PLC (a) | 1,426,200 | | 2,766,991 |
Regus PLC | 2,817,600 | | 9,265,884 |
TOTAL BAILIWICK OF JERSEY | | 21,605,082 |
Belgium - 0.1% |
EVS Broadcast Equipment SA | 24,123 | | 1,581,970 |
Bermuda - 2.6% |
APT Satellite Holdings Ltd. | 1,573,000 | | 1,710,356 |
Asia Satellite Telecommunications Holdings Ltd. | 271,000 | | 1,052,122 |
Biosensors International Group Ltd. | 1,016,000 | | 768,830 |
China Animal Healthcare Ltd. (a) | 2,129,000 | | 681,016 |
China Singyes Solar Tech Holdings Ltd. | 981,600 | | 1,064,782 |
Digital China Holdings Ltd. (H Shares) | 423,000 | | 555,416 |
Dukang Distillers Holdings Ltd. (a) | 2,072,000 | | 725,584 |
I.T Ltd. | 1,552,000 | | 472,426 |
Imagi International Holdings Ltd. (a) | 27,752,000 | | 332,895 |
Luk Fook Holdings International Ltd. | 612,000 | | 2,186,560 |
Oakley Capital Investments Ltd. (a) | 1,560,300 | | 4,396,887 |
Oriental Watch Holdings Ltd. | 1,540,000 | | 492,609 |
PAX Global Technology Ltd. (a) | 1,769,000 | | 748,397 |
Petra Diamonds Ltd. (a) | 2,255,500 | | 4,050,445 |
REXLot Holdings Ltd. | 10,075,000 | | 883,658 |
STELUX Holdings International | 2,958,000 | | 1,007,239 |
Vostok Nafta Investment Ltd. SDR | 818,000 | | 6,658,822 |
Vtech Holdings Ltd. | 154,900 | | 2,223,703 |
TOTAL BERMUDA | | 30,011,747 |
British Virgin Islands - 0.4% |
Kalahari Energy (a)(g) | 1,451,000 | | 15 |
Mail.Ru Group Ltd.: | | | |
GDR (f) | 112,800 | | 4,160,064 |
GDR (Reg. S) | 12,700 | | 468,376 |
TOTAL BRITISH VIRGIN ISLANDS | | 4,628,455 |
Canada - 0.6% |
Africa Oil Corp. (a) | 81,500 | | 723,819 |
Africa Oil Corp. (Sweden) (a) | 457,500 | | 4,059,575 |
AirSea Lines (a)(g) | 1,893,338 | | 26 |
Asanko Gold, Inc. (a) | 26,400 | | 62,034 |
Common Stocks - continued |
| Shares | | Value |
Canada - continued |
Mood Media Corp. (a) | 136,700 | | $ 86,531 |
Mood Media Corp. (United Kingdom) (a) | 1,139,822 | | 767,588 |
Mountain Province Diamonds, Inc. (a) | 254,200 | | 1,292,150 |
Rock Well Petroleum, Inc. (a)(g) | 770,400 | | 7 |
TOTAL CANADA | | 6,991,730 |
Cayman Islands - 3.4% |
21Vianet Group, Inc. ADR (a) | 42,300 | | 761,400 |
51job, Inc. sponsored ADR (a) | 19,200 | | 1,470,720 |
AirMedia Group, Inc. ADR (a) | 352,100 | | 595,049 |
Airtac International Group | 90,950 | | 658,140 |
AMVIG Holdings Ltd. | 764,000 | | 358,695 |
AutoNavi Holdings Ltd. ADR (a)(d) | 34,300 | | 530,278 |
Bitauto Holdings Ltd. ADR (a) | 120,000 | | 2,941,200 |
Bonjour Holdings Ltd. | 4,332,000 | | 938,702 |
Changshouhua Food Co. Ltd. | 872,000 | | 921,151 |
China Automation Group Ltd. | 1,872,000 | | 393,572 |
China High Precision Automation Group Ltd. | 712,000 | | 27,551 |
China Lilang Ltd. | 724,000 | | 467,850 |
China Lodging Group Ltd. ADR (a) | 26,500 | | 582,470 |
China Medical System Holdings Ltd. | 1,204,000 | | 1,082,404 |
China Metal International Holdings, Inc. | 2,522,000 | | 709,140 |
China Metal Recycling (Holdings) Ltd. (a) | 436,800 | | 1 |
China Outfitters Holdings Ltd. (d) | 1,888,000 | | 311,704 |
CNinsure, Inc. ADR (a) | 78,600 | | 381,210 |
Convenience Retail Asia Ltd. | 700,000 | | 487,553 |
EVA Precision Industrial Holdings Ltd. | 5,134,000 | | 735,037 |
Greatview Aseptic Pack Co. Ltd. | 1,196,000 | | 752,803 |
Haitian International Holdings Ltd. | 338,000 | | 814,374 |
Hop Hing Group Holdings Ltd. | 7,392,000 | | 314,634 |
Hutchison China Meditech Ltd. (a) | 77,117 | | 780,228 |
Integrated Waste Solutions Group Health Ltd. (a) | 2,055,000 | | 145,252 |
Kingdee International Software Group Co. Ltd. (a) | 1,564,400 | | 504,450 |
KongZhong Corp. sponsored ADR (a) | 56,200 | | 463,650 |
Lee's Pharmaceutical Holdings Ltd. | 1,155,000 | | 1,071,127 |
Marwyn Value Investors II Ltd. (a) | 2,130,100 | | 6,497,803 |
Ming Fai International Holdings Ltd. | 9,133,000 | | 1,001,296 |
Perfect World Co. Ltd. sponsored ADR Class B | 31,700 | | 555,701 |
Royale Furniture Holdings Ltd. | 10,111,437 | | 528,200 |
Shenguan Holdings Group Ltd. | 3,154,000 | | 1,407,564 |
SINA Corp. (a) | 6,100 | | 509,716 |
SITC International Holdings Co. Ltd. | 3,686,000 | | 1,559,407 |
Common Stocks - continued |
| Shares | | Value |
Cayman Islands - continued |
Sitoy Group Holdings Ltd. | 727,000 | | $ 398,523 |
SouFun Holdings Ltd. ADR | 51,000 | | 2,714,730 |
Vipshop Holdings Ltd. ADR (a)(d) | 12,600 | | 868,518 |
VST Holdings Ltd. | 2,767,600 | | 546,166 |
WuXi PharmaTech Cayman, Inc. sponsored ADR (a) | 42,300 | | 1,237,275 |
Xinyi Glass Holdings Ltd. | 1,670,000 | | 1,654,276 |
Yip's Chemical Holdings Ltd. | 592,000 | | 497,851 |
TOTAL CAYMAN ISLANDS | | 39,177,371 |
China - 0.1% |
Xinjiang Goldwind Science & Technology Co. Ltd. (H Shares) | 938,000 | | 958,205 |
Denmark - 0.1% |
ALK-Abello A/S | 6,657 | | 632,586 |
Finland - 1.1% |
Amer Group PLC (A Shares) | 274,500 | | 5,642,714 |
Rakentajain Konevuokraamo Oyj (B Shares) | 343,656 | | 6,873,002 |
TOTAL FINLAND | | 12,515,716 |
France - 3.9% |
ALTEN | 165,500 | | 7,498,493 |
Audika SA (a) | 113,900 | | 1,531,013 |
Ipsos SA | 128,172 | | 5,406,103 |
Sartorius Stedim Biotech | 53,000 | | 7,969,653 |
Sopra Group SA | 61,000 | | 5,335,442 |
SR Teleperformance SA | 178,251 | | 9,453,313 |
The Lisi Group | 52,800 | | 8,151,062 |
TOTAL FRANCE | | 45,345,079 |
Germany - 9.7% |
Aareal Bank AG (a) | 394,704 | | 15,179,633 |
AURELIUS AG | 136,500 | | 4,659,268 |
Brenntag AG | 40,600 | | 6,879,556 |
CANCOM AG | 49,600 | | 1,904,500 |
CENTROTEC Sustainable AG | 289,265 | | 7,201,063 |
CompuGROUP Holding AG | 199,511 | | 5,199,658 |
CTS Eventim AG | 199,177 | | 9,722,051 |
Deutz AG (a) | 903,600 | | 8,600,309 |
GFK AG | 195,601 | | 11,433,101 |
Ichor Coal NV (a) | 355,000 | | 1,928,005 |
Lanxess AG | 88,385 | | 6,221,045 |
MTU Aero Engines Holdings AG | 60,089 | | 6,003,902 |
Rational AG | 15,920 | | 4,885,076 |
Common Stocks - continued |
| Shares | | Value |
Germany - continued |
United Internet AG | 200,152 | | $ 7,908,111 |
Wirecard AG | 387,100 | | 14,114,586 |
TOTAL GERMANY | | 111,839,864 |
Hong Kong - 0.8% |
Dah Sing Banking Group Ltd. | 598,800 | | 1,129,170 |
Guotai Junan International Holdings Ltd. | 1,331,000 | | 569,963 |
Magnificent Estates Ltd. | 25,682,000 | | 1,242,197 |
Singamas Container Holdings Ltd. | 5,744,000 | | 1,340,983 |
Sinosoft Tech Group Ltd. | 1,164,000 | | 279,252 |
Techtronic Industries Co. Ltd. | 1,012,500 | | 2,546,595 |
Wing Hang Bank Ltd. | 153,000 | | 2,176,693 |
TOTAL HONG KONG | | 9,284,853 |
India - 0.8% |
Ahluwalia Contracts (India) Ltd. (a) | 230,314 | | 96,986 |
Britannia Industries Ltd. | 46,936 | | 715,609 |
MT Educare Ltd. | 211,299 | | 345,456 |
Page Industries Ltd. | 90,084 | | 6,535,563 |
Shriram City Union Finance Ltd. | 32,081 | | 526,501 |
Thangamayil Jewellery Ltd. | 173,245 | | 478,768 |
WABCO India Ltd. | 14,137 | | 388,238 |
TOTAL INDIA | | 9,087,121 |
Indonesia - 0.5% |
PT Clipan Finance Indonesia Tbk | 13,895,400 | | 517,723 |
PT Clipan Finance Indonesia Tbk warrants 10/7/14 (a) | 2,275,700 | | 6,460 |
PT Global Mediacom Tbk | 1,729,000 | | 292,958 |
PT Mayora Indah Tbk | 410,667 | | 1,067,419 |
PT Media Nusantara Citra Tbk | 5,091,500 | | 1,129,180 |
PT Mitra Adiperkasa Tbk | 801,000 | | 383,711 |
PT MNC Sky Vision Tbk (a) | 2,487,000 | | 512,951 |
PT Nippon Indosari Corpindo Tbk | 881,500 | | 484,832 |
PT Pembangunan Perumahan Persero Tbk | 4,982,500 | | 579,023 |
PT Tiga Pilar Sejahtera Food Tbk | 8,562,500 | | 1,002,656 |
TOTAL INDONESIA | | 5,976,913 |
Ireland - 2.7% |
Glanbia PLC | 168,000 | | 2,354,013 |
Kenmare Resources PLC (a) | 11,445,200 | | 3,734,476 |
Paddy Power PLC (Ireland) | 157,509 | | 12,831,471 |
Common Stocks - continued |
| Shares | | Value |
Ireland - continued |
Smurfit Kappa Group PLC | 287,600 | | $ 6,989,751 |
United Drug PLC (United Kingdom) | 992,400 | | 4,964,588 |
TOTAL IRELAND | | 30,874,299 |
Isle of Man - 2.4% |
Exillon Energy PLC (a) | 1,097,300 | | 4,187,398 |
IBS Group Holding Ltd. GDR (Reg. S) | 336,400 | | 9,086,984 |
Playtech Ltd. | 1,209,747 | | 14,285,952 |
TOTAL ISLE OF MAN | | 27,560,334 |
Israel - 0.1% |
Sarin Technologies Ltd. | 957,750 | | 1,464,921 |
Italy - 2.3% |
Brunello Cucinelli SpA | 123,985 | | 3,871,835 |
Prysmian SpA | 263,900 | | 6,449,584 |
Salvatore Ferragamo Italia SpA | 244,915 | | 8,393,142 |
YOOX SpA (a) | 209,800 | | 7,548,683 |
TOTAL ITALY | | 26,263,244 |
Japan - 26.4% |
Accordia Golf Co. Ltd. | 504,500 | | 5,536,995 |
ACOM Co. Ltd. (a) | 586,600 | | 2,296,933 |
AEON Financial Service Co. Ltd. (d) | 243,800 | | 7,487,160 |
AEON Mall Co. Ltd. | 66,550 | | 1,890,084 |
Amada Co. Ltd. | 610,000 | | 5,247,570 |
CAC Corp. | 47,400 | | 421,311 |
Career Design Center Co. Ltd. | 676 | | 800,696 |
Chugoku Electric Power Co., Inc. | 112,600 | | 1,726,008 |
Creek & River Co. Ltd. | 91,200 | | 392,559 |
Daiwa Industries Ltd. | 42,000 | | 264,291 |
en-japan, Inc. | 113,700 | | 2,539,549 |
Enigmo, Inc. (a)(d) | 48,400 | | 3,444,988 |
Foster Electric Co. Ltd. (d) | 705,400 | | 13,801,537 |
Fuji Corp. | 47,500 | | 783,216 |
Fuji Media Holdings, Inc. | 54,000 | | 1,076,510 |
Fujibo Holdings, Inc. | 464,000 | | 945,493 |
G-Tekt Corp. | 20,500 | | 605,963 |
H.I.S. Co. Ltd. | 92,600 | | 4,994,351 |
Hajime Construction Co. Ltd. (d) | 81,800 | | 5,640,232 |
Heiwa Corp. | 49,200 | | 824,899 |
Higashi Nihon House Co. Ltd. | 508,000 | | 2,715,643 |
Hokkaido Electric Power Co., Inc. (a) | 1,235,300 | | 15,913,286 |
Common Stocks - continued |
| Shares | | Value |
Japan - continued |
Hoshizaki Electric Co. Ltd. | 155,300 | | $ 5,690,961 |
Iida Home Max Co., Ltd. (d) | 107,000 | | 2,454,917 |
Iino Kaiun Kaisha Ltd. | 500,800 | | 3,298,120 |
ISE Chemical Corp. | 56,000 | | 484,012 |
ITC Networks Corp. | 28,700 | | 246,885 |
Iwatsuka Confectionary Co. Ltd. | 16,000 | | 825,210 |
JAFCO Co. Ltd. | 56,600 | | 2,838,507 |
Juki Corp. (a)(d) | 1,588,000 | | 2,998,722 |
Justsystems Corp. (a) | 69,100 | | 665,856 |
K's Denki Corp. | 141,100 | | 4,143,098 |
Kakaku.com, Inc. | 685,200 | | 13,252,683 |
Kanto Natural Gas Development | 72,000 | | 507,631 |
KAWAI Musical Instruments Manufacturing Co. Ltd. (d) | 523,000 | | 986,578 |
Koshidaka Holdings Co. Ltd. | 23,100 | | 813,634 |
Kotobuki Spirits Co. Ltd. | 15,300 | | 200,081 |
Kyushu Electric Power Co., Inc. (a) | 69,400 | | 977,140 |
Leopalace21 Corp. (a) | 1,331,600 | | 9,244,644 |
Mazda Motor Corp. (a) | 1,441,000 | | 6,486,674 |
N Field Co. Ltd. | 15,700 | | 1,744,507 |
Nichias Corp. | 501,000 | | 3,389,511 |
Nihon Nohyaku Co. Ltd. | 374,000 | | 4,482,832 |
Nikkiso Co. Ltd. | 549,000 | | 6,791,930 |
Nippon Koei Co. Ltd. | 70,000 | | 329,304 |
Nippon Seiki Co. Ltd. | 34,000 | | 554,333 |
Nippon Shinyaku Co. Ltd. | 345,000 | | 5,946,976 |
Nippon Yusen KK | 719,000 | | 2,196,902 |
Nitta Corp. | 157,400 | | 3,315,251 |
Nomura Real Estate Holdings, Inc. | 222,300 | | 5,624,508 |
NTT Urban Development Co. | 279,800 | | 3,571,744 |
ORIX Corp. | 679,400 | | 11,767,947 |
Pal Co. Ltd. | 68,700 | | 1,919,793 |
Parco Co. Ltd. | 41,700 | | 428,718 |
Pigeon Corp. | 373,100 | | 19,249,422 |
Pressance Corp. (d) | 23,100 | | 739,680 |
Rakuten, Inc. | 626,900 | | 8,168,282 |
Rohto Pharmaceutical Co. Ltd. | 130,000 | | 1,886,600 |
Sakata INX Corp. | 332,000 | | 3,151,073 |
San-Ai Oil Co. Ltd. | 97,000 | | 418,926 |
Sawada Holdings Co. Ltd. | 259,800 | | 2,439,741 |
Sega Sammy Holdings, Inc. | 248,000 | | 6,357,615 |
Shinkawa Ltd. | 52,000 | | 336,857 |
Shinko Kogyo Co. Ltd. | 268,900 | | 2,215,210 |
Common Stocks - continued |
| Shares | | Value |
Japan - continued |
Shinko Shoji Co. Ltd. | 2,900 | | $ 24,819 |
Shinsei Bank Ltd. | 133,000 | | 311,394 |
Sosei Group Corp. (a) | 113,900 | | 4,904,553 |
Sourcenext Corp. (a)(d) | 83,100 | | 688,377 |
Stanley Electric Co. Ltd. | 584,700 | | 13,600,715 |
Sumitomo Heavy Industries Ltd. | 1,196,000 | | 5,293,423 |
Takeuchi Manufacturing Co. Ltd. | 28,700 | | 605,375 |
Tohoku Electric Power Co., Inc. (a) | 134,200 | | 1,624,383 |
Tokyo Tatemono Co. Ltd. | 2,341,000 | | 21,977,316 |
Tokyu Fudosan Holdings Corp. (a) | 498,000 | | 4,918,312 |
Topcon Corp. | 541,300 | | 8,162,127 |
Toshiba Plant Systems & Services Corp. | 16,000 | | 282,310 |
Toyo Engineering Corp. | 218,000 | | 928,891 |
Uchiyama Holdings Co. Ltd. | 39,200 | | 1,177,753 |
VT Holdings Co. Ltd. | 54,100 | | 728,136 |
Welcia Holdings Co. Ltd. | 14,300 | | 865,000 |
WirelessGate, Inc. (a) | 24,200 | | 741,079 |
Yamaha Motor Co. Ltd. | 207,200 | | 3,173,994 |
Yamaya Corp. | 47,300 | | 681,356 |
TOTAL JAPAN | | 303,181,602 |
Korea (South) - 0.4% |
Daou Technology, Inc. | 133,650 | | 1,832,322 |
Koh Young Technology, Inc. | 23,358 | | 696,593 |
Korea Plant Service & Engineering Co. Ltd. | 7,274 | | 368,744 |
SBS Contents Hub Co. Ltd. | 31,723 | | 443,885 |
Soulbrain Co. Ltd. | 11,656 | | 582,097 |
WeMade Entertainment Co. Ltd. (a) | 9,761 | | 435,036 |
TOTAL KOREA (SOUTH) | | 4,358,677 |
Luxembourg - 2.6% |
AZ Electronic Materials SA | 1,117,200 | | 5,150,041 |
Eurofins Scientific SA | 58,899 | | 16,149,965 |
Grand City Properties SA (a) | 1,009,573 | | 8,106,602 |
TOTAL LUXEMBOURG | | 29,406,608 |
Malaysia - 0.1% |
JobStreet Corp. Bhd | 2,446,200 | | 1,666,190 |
Netherlands - 0.6% |
Yandex NV (a) | 175,600 | | 6,472,616 |
Norway - 1.6% |
Aker Solutions ASA (d) | 511,200 | | 7,067,261 |
Common Stocks - continued |
| Shares | | Value |
Norway - continued |
Norwegian Air Shuttle A/S (a)(d) | 46,500 | | $ 1,912,944 |
Schibsted ASA (B Shares) (d) | 73,100 | | 4,469,709 |
Sevan Drilling ASA (a)(d) | 4,908,300 | | 4,707,905 |
TOTAL NORWAY | | 18,157,819 |
Singapore - 2.3% |
Amtek Engineering Ltd. | 3,304,000 | | 1,276,703 |
Cordlife Group Ltd. | 1,021,000 | | 982,205 |
CSE Global Ltd. | 1,069,000 | | 813,239 |
Goodpack Ltd. | 1,541,000 | | 2,375,636 |
Mapletree Industrial (REIT) | 1,118,722 | | 1,247,327 |
OSIM International Ltd. | 1,092,000 | | 1,854,870 |
Pertama Holdings Ltd. (e) | 23,060,000 | | 12,066,495 |
Petra Foods Ltd. | 370,000 | | 1,057,398 |
Sino Grandness Food Industry Group Ltd. (a) | 3,087,000 | | 1,776,852 |
Venture Corp. Ltd. | 325,000 | | 2,035,502 |
Yoma Strategic Holdings Ltd. | 1,060,000 | | 652,793 |
TOTAL SINGAPORE | | 26,139,020 |
South Africa - 0.5% |
Blue Label Telecoms Ltd. | 6,485,319 | | 6,098,509 |
Sweden - 0.9% |
Avanza Bank Holding AB | 167,100 | | 5,376,556 |
Rezidor Hotel Group AB (a) | 942,170 | | 5,365,093 |
TOTAL SWEDEN | | 10,741,649 |
Switzerland - 2.5% |
Clariant AG (Reg.) | 159,700 | | 2,816,113 |
Julius Baer Group Ltd. | 113,210 | | 5,563,491 |
Meyer Burger Technology AG (a)(d) | 286,600 | | 3,363,961 |
Sika AG (Bearer) | 1,610 | | 5,076,553 |
Temenos Group AG | 75,008 | | 1,913,744 |
VZ Holding AG | 53,370 | | 9,587,601 |
TOTAL SWITZERLAND | | 28,321,463 |
Taiwan - 0.2% |
Merida Industry Co. Ltd. | 85,000 | | 643,961 |
Taiwan Hon Chuan Enterprise Co. Ltd. | 185,000 | | 389,672 |
Tong Hsing Electronics Industries Ltd. | 135,721 | | 716,990 |
TOTAL TAIWAN | | 1,750,623 |
Thailand - 0.2% |
Toyo-Thai Corp. PCL | 2,200,600 | | 2,722,027 |
Common Stocks - continued |
| Shares | | Value |
United Kingdom - 18.0% |
Amerisur Resources PLC (a)(d) | 5,712,324 | | $ 4,030,022 |
ASOS PLC (a) | 152,776 | | 13,889,291 |
Aveva Group PLC | 179,175 | | 7,429,299 |
Bond International Software PLC | 843,266 | | 1,270,967 |
Brammer PLC (d) | 1,302,600 | | 10,108,770 |
Brewin Dolphin Holding PLC | 980,163 | | 4,463,325 |
Cineworld Group PLC | 187,861 | | 1,116,760 |
Close Brothers Group PLC | 347,270 | | 7,043,681 |
Countrywide PLC | 778,100 | | 6,961,639 |
Craneware PLC | 813,500 | | 6,091,389 |
Devro PLC | 103,098 | | 522,867 |
Dicom Group PLC (a) | 1,215,200 | | 7,384,632 |
Foxtons Group PLC | 1,383,300 | | 7,069,822 |
Hunting PLC | 352,500 | | 5,041,571 |
IG Group Holdings PLC | 1,188,002 | | 11,686,208 |
Innovation Group PLC (a)(d) | 9,382,600 | | 4,776,489 |
International Personal Finance PLC | 870,900 | | 8,064,216 |
John Wood Group PLC | 470,700 | | 6,128,330 |
Johnson Matthey PLC | 106,195 | | 5,115,003 |
Keronite PLC (a)(g) | 13,620,267 | | 218 |
Lombard Medical Technologies PLC (a) | 1,260,400 | | 4,132,792 |
Moneysupermarket.com Group PLC | 4,001,600 | | 9,842,398 |
Mothercare PLC (a)(d) | 578,200 | | 3,550,739 |
Ocado Group PLC (a) | 913,800 | | 6,358,911 |
Perform Group PLC (a) | 701,700 | | 6,300,592 |
Petroceltic International PLC (a) | 1,117,274 | | 2,543,841 |
Pureprofile Media PLC (a)(g) | 1,108,572 | | 622,120 |
Regenersis PLC | 1,231,800 | | 5,075,925 |
Rockhopper Exploration PLC (a)(d) | 1,084,100 | | 2,516,111 |
Salamander Energy PLC (a) | 632,400 | | 1,087,504 |
Serco Group PLC | 683,068 | | 6,100,438 |
Silverdell PLC | 12,644,400 | | 1,550,963 |
Sinclair Pharma PLC (a)(d) | 8,403,003 | | 4,311,480 |
Sphere Medical Holding PLC (a) | 817,054 | | 373,368 |
Sthree PLC | 1,060,309 | | 6,111,858 |
Synergy Health PLC | 353,353 | | 5,875,292 |
Ted Baker PLC | 343,975 | | 9,414,609 |
TMO Renewables Ltd. (a)(g) | 1,000,000 | | 64,136 |
Travis Perkins PLC | 189,500 | | 5,639,350 |
Tungsten Corp. PLC | 1,150,600 | | 4,137,126 |
Wolfson Microelectronics PLC (a) | 1,463,200 | | 3,296,263 |
TOTAL UNITED KINGDOM | | 207,100,315 |
Common Stocks - continued |
| Shares | | Value |
United States of America - 0.1% |
CTC Media, Inc. | 4,300 | | $ 54,352 |
GI Dynamics, Inc. CDI (a) | 1,286,187 | | 972,512 |
Mudalla Technology, Inc. (Reg. S) (a) | 996,527 | | 16 |
YOU On Demand Holdings, Inc. (a) | 114,474 | | 203,764 |
YOU On Demand Holdings, Inc. warrants 8/30/17 (a) | 27,500 | | 0 |
TOTAL UNITED STATES OF AMERICA | | 1,230,644 |
TOTAL COMMON STOCKS (Cost $829,518,560) |
1,075,193,160
|
Nonconvertible Preferred Stocks - 0.7% |
| | | |
Brazil - 0.7% |
Alpargatas Sa (PN)
(Cost $7,863,928) | 1,125,920 | |
7,790,269
|
Convertible Bonds - 0.2% |
| Principal Amount | | |
Canada - 0.2% |
Caracal Energy, Inc. 12% 9/30/17 (g)
(Cost $1,400,000) | | $ 1,400,000 | |
1,775,964
|
Money Market Funds - 8.3% |
| Shares | | |
Fidelity Cash Central Fund, 0.09% (b) | 72,010,764 | | 72,010,764 |
Fidelity Securities Lending Cash Central Fund, 0.09% (b)(c) | 23,742,135 | | 23,742,135 |
TOTAL MONEY MARKET FUNDS (Cost $95,752,899) |
95,752,899
|
TOTAL INVESTMENT PORTFOLIO - 102.8% (Cost $934,535,387) | | 1,180,512,292 |
NET OTHER ASSETS (LIABILITIES) - (2.8)% | | (32,073,166) |
NET ASSETS - 100% | $ 1,148,439,126 |
Legend |
(a) Non-income producing |
(b) Affiliated fund that is generally available only to investment companies and other accounts managed by Fidelity Investments. The rate quoted is the annualized seven-day yield of the fund at period end. A complete unaudited listing of the fund's holdings as of its most recent quarter end is available upon request. In addition, each Fidelity Central Fund's financial statements, which are not covered by the Fund's Report of Independent Registered Public Accounting Firm, are available on the SEC's website or upon request. |
(c) Investment made with cash collateral received from securities on loan. |
(d) Security or a portion of the security is on loan at period end. |
(e) Affiliated company |
(f) Security exempt from registration under Rule 144A of the Securities Act of 1933. These securities may be resold in transactions exempt from registration, normally to qualified institutional buyers. At the end of the period, the value of these securities amounted to $4,160,064 or 0.4% of net assets. |
(g) Restricted securities - Investment in securities not registered under the Securities Act of 1933 (excluding 144A issues). At the end of the period, the value of restricted securities (excluding 144A issues) amounted to $2,462,486 or 0.2% of net assets. |
Additional information on each restricted holding is as follows: |
Security | Acquisition Date | Acquisition Cost |
AirSea Lines | 8/4/06 | $ 1,199,182 |
Caracal Energy, Inc. 12% 9/30/17 | 9/12/12 | $ 1,400,000 |
Kalahari Energy | 9/1/06 | $ 1,813,750 |
Keronite PLC | 8/16/06 | $ 1,548,992 |
Pureprofile Media PLC | 5/3/05 - 1/11/06 | $ 1,173,341 |
Rock Well Petroleum, Inc. | 4/13/06 | $ 1,004,171 |
TMO Renewables Ltd. | 10/27/05 | $ 535,065 |
Affiliated Central Funds |
Information regarding fiscal year to date income earned by the Fund from investments in Fidelity Central Funds is as follows: |
Fund | Income earned |
Fidelity Cash Central Fund | $ 46,779 |
Fidelity Securities Lending Cash Central Fund | 663,324 |
Total | $ 710,103 |
Other Affiliated Issuers |
An affiliated company is a company in which the Fund has ownership of at least 5% of the voting securities. Fiscal year to date transactions with companies which are or were affiliates are as follows: |
Affiliate | Value, beginning of period | Purchases | Sales Proceeds | Dividend Income | Value,
end of
period |
Pertama Holdings Ltd. | $ 9,679,226 | $ - | $ - | $ 380,584 | $ 12,066,495 |
Other Information |
Categorizations in the Schedule of Investments are based on country or territory of incorporation. |
The following is a summary of the inputs used, as of October 31, 2013, involving the Fund's assets and liabilities carried at fair value. The inputs or methodology used for valuing securities may not be an indication of the risk associated with investing in those securities. For more information on valuation inputs, and their aggregation into the levels used in the tables below, please refer to the Investment Valuation section in the accompanying Notes to Financial Statements. |
Valuation Inputs at Reporting Date: |
Description | Total | Level 1 | Level 2 | Level 3 |
Investments in Securities: | | | | |
Equities: | | | | |
Consumer Discretionary | $ 260,457,290 | $ 175,431,185 | $ 79,385,857 | $ 5,640,248 |
Consumer Staples | 35,660,497 | 13,839,428 | 21,821,069 | - |
Energy | 55,836,047 | 54,909,468 | 926,557 | 22 |
Financials | 202,565,947 | 125,742,740 | 74,368,290 | 2,454,917 |
Health Care | 96,487,666 | 72,296,566 | 24,126,964 | 64,136 |
Industrials | 185,406,536 | 143,921,432 | 39,788,645 | 1,696,459 |
Information Technology | 162,730,680 | 134,837,106 | 27,243,903 | 649,671 |
Materials | 56,242,264 | 47,559,887 | 8,117,917 | 564,460 |
Telecommunication Services | 5,344,063 | 4,602,984 | 741,079 | - |
Utilities | 22,252,439 | 2,011,622 | 20,240,817 | - |
Corporate Bonds | 1,775,964 | - | 1,775,964 | - |
Money Market Funds | 95,752,899 | 95,752,899 | - | - |
Total Investments in Securities: | $ 1,180,512,292 | $ 870,905,317 | $ 298,537,062 | $ 11,069,913 |
The following is a summary of transfers between Level 1 and Level 2 for the period ended October 31, 2013. Transfers are assumed to have occurred at the beginning of the period, and are primarily attributable to the valuation techniques used for foreign equity securities, as discussed in the accompanying Notes to Financial Statements: |
Transfers | Total |
Level 1 to Level 2 | $ 93,219,288 |
Level 2 to Level 1 | $ 85,883 |
Valuation Inputs at Reporting Date: |
The following is a reconciliation of Investments in Securities for which Level 3 inputs were used in determining value: |
Investments in Securities: | |
Beginning Balance | $ 17,107,640 |
Net Realized Gain (Loss) on Investment Securities | 1,980,820 |
Net Unrealized Gain (Loss) on Investment Securities | (322,938) |
Cost of Purchases | 1,698,025 |
Proceeds of Sales | (7,832,736) |
Amortization/Accretion | - |
Transfers into Level 3 | 9,518,328 |
Transfers out of Level 3 | (11,079,226) |
Ending Balance | $ 11,069,913 |
The change in unrealized gain (loss) for the period attributable to Level 3 securities held at October 31, 2013 | $ 715,199 |
The information used in the above reconciliation represents fiscal year to date activity for any Investments in Securities identified as using Level 3 inputs at either the beginning or the end of the current fiscal period. Transfers into Level 3 were attributable to a lack of observable market data resulting from decreases in market activity, decreases in liquidity, security restructurings or corporate actions. Transfers out of Level 3 were attributable to observable market data becoming available for those securities. Transfers in or out of Level 3 represent the beginning value of any Security or Instrument where a change in the pricing level occurred from the beginning to the end of the period. The cost of purchases and the proceeds of sales may include securities received or delivered through corporate actions or exchanges. Realized and unrealized gains (losses) disclosed in the reconciliation are included in Net Gain (Loss) on the Fund's Statement of Operations. |
See accompanying notes which are an integral part of the financial statements.
Annual Report
Statement of Assets and Liabilities
| October 31, 2013 |
| | |
Assets | | |
Investment in securities, at value (including securities loaned of $21,984,564) - See accompanying schedule: Unaffiliated issuers (cost $832,370,202) | $ 1,072,692,898 | |
Fidelity Central Funds (cost $95,752,899) | 95,752,899 | |
Other affiliated issuers (cost $6,412,286) | 12,066,495 | |
Total Investments (cost $934,535,387) | | $ 1,180,512,292 |
Cash | | 4,686 |
Foreign currency held at value (cost $22,233) | | 22,233 |
Receivable for investments sold | | 1,202,840 |
Receivable for fund shares sold | | 2,252,442 |
Dividends receivable | | 1,689,783 |
Interest receivable | | 190,702 |
Distributions receivable from Fidelity Central Funds | | 43,612 |
Prepaid expenses | | 3,042 |
Other receivables | | 40,069 |
Total assets | | 1,185,961,701 |
| | |
Liabilities | | |
Payable for investments purchased | $ 11,458,863 | |
Payable for fund shares redeemed | 1,058,399 | |
Accrued management fee | 834,071 | |
Distribution and service plan fees payable | 21,407 | |
Other affiliated payables | 245,715 | |
Other payables and accrued expenses | 161,985 | |
Collateral on securities loaned, at value | 23,742,135 | |
Total liabilities | | 37,522,575 |
| | |
Net Assets | | $ 1,148,439,126 |
Net Assets consist of: | | |
Paid in capital | | $ 940,719,067 |
Undistributed net investment income | | 4,006,124 |
Accumulated undistributed net realized gain (loss) on investments and foreign currency transactions | | (42,239,141) |
Net unrealized appreciation (depreciation) on investments and assets and liabilities in foreign currencies | | 245,953,076 |
Net Assets | | $ 1,148,439,126 |
See accompanying notes which are an integral part of the financial statements.
Annual Report
Statement of Assets and Liabilities - continued
| October 31, 2013 |
| | |
Calculation of Maximum Offering Price Class A:
Net Asset Value and redemption price per share ($24,020,321 ÷ 912,078 shares) | | $ 26.34 |
| | |
Maximum offering price per share (100/94.25 of $26.34) | | $ 27.95 |
Class T:
Net Asset Value and redemption price per share ($13,530,248 ÷ 516,960 shares) | | $ 26.17 |
| | |
Maximum offering price per share (100/96.50 of $26.17) | | $ 27.12 |
Class B:
Net Asset Value and offering price per share ($794,911 ÷ 30,729 shares)A | | $ 25.87 |
| | |
Class C:
Net Asset Value and offering price per share ($13,426,348 ÷ 522,739 shares)A | | $ 25.68 |
| | |
International Small Cap:
Net Asset Value, offering price and redemption price per share ($1,029,629,175 ÷ 38,611,059 shares) | | $ 26.67 |
| | |
Institutional Class:
Net Asset Value, offering price and redemption price per share ($67,038,123 ÷ 2,513,397 shares) | | $ 26.67 |
A Redemption price per share is equal to net asset value less any applicable contingent deferred sales charge.
See accompanying notes which are an integral part of the financial statements.
Annual Report
Financial Statements - continued
Statement of Operations
| Year ended October 31, 2013 |
| | |
Investment Income | | |
Dividends (including $380,584 earned from other affiliated issuers) | | $ 15,849,730 |
Interest | | 168,107 |
Income from Fidelity Central Funds | | 710,103 |
Income before foreign taxes withheld | | 16,727,940 |
Less foreign taxes withheld | | (804,542) |
Total income | | 15,923,398 |
| | |
Expenses | | |
Management fee
Basic fee | $ 7,352,833 | |
Performance adjustment | 929,023 | |
Transfer agent fees | 2,205,642 | |
Distribution and service plan fees | 192,174 | |
Accounting and security lending fees | 417,104 | |
Custodian fees and expenses | 278,409 | |
Independent trustees' compensation | 4,726 | |
Registration fees | 90,493 | |
Audit | 152,551 | |
Legal | 2,053 | |
Miscellaneous | 6,690 | |
Total expenses before reductions | 11,631,698 | |
Expense reductions | (142,371) | 11,489,327 |
Net investment income (loss) | | 4,434,071 |
Realized and Unrealized Gain (Loss) Net realized gain (loss) on: | | |
Investment securities: | | |
Unaffiliated issuers | 66,377,894 | |
Foreign currency transactions | (228,900) | |
Futures contracts | (80,042) | |
Total net realized gain (loss) | | 66,068,952 |
Change in net unrealized appreciation (depreciation) on: Investment securities (net of decrease in deferred foreign taxes of $185,408) | 198,876,160 | |
Assets and liabilities in foreign currencies | (867) | |
Total change in net unrealized appreciation (depreciation) | | 198,875,293 |
Net gain (loss) | | 264,944,245 |
Net increase (decrease) in net assets resulting from operations | | $ 269,378,316 |
See accompanying notes which are an integral part of the financial statements.
Annual Report
Statement of Changes in Net Assets
| Year ended
October 31,
2013 | Year ended
October 31,
2012 |
Increase (Decrease) in Net Assets | | |
Operations | | |
Net investment income (loss) | $ 4,434,071 | $ 4,511,101 |
Net realized gain (loss) | 66,068,952 | (4,142,955) |
Change in net unrealized appreciation (depreciation) | 198,875,293 | 42,574,576 |
Net increase (decrease) in net assets resulting
from operations | 269,378,316 | 42,942,722 |
Distributions to shareholders from net investment income | (4,769,550) | (8,016,423) |
Distributions to shareholders from net realized gain | (11,754,787) | (12,577,679) |
Total distributions | (16,524,337) | (20,594,102) |
Share transactions - net increase (decrease) | 162,217,941 | (204,187,386) |
Redemption fees | 119,206 | 102,611 |
Total increase (decrease) in net assets | 415,191,126 | (181,736,155) |
| | |
Net Assets | | |
Beginning of period | 733,248,000 | 914,984,155 |
End of period (including undistributed net investment income of $4,006,124 and undistributed net investment income of $4,511,102, respectively) | $ 1,148,439,126 | $ 733,248,000 |
See accompanying notes which are an integral part of the financial statements.
Annual Report
Financial Highlights - Class A
Years ended October 31, | 2013 | 2012 | 2011 | 2010 | 2009 |
Selected Per-Share Data | | | | | |
Net asset value, beginning of period | $ 19.74 | $ 18.97 | $ 20.42 | $ 17.28 | $ 11.91 |
Income from Investment Operations | | | | | |
Net investment income (loss) C | .06 | .06 | .10 | .03 | .06 |
Net realized and unrealized gain (loss) | 6.94 | 1.09 | (.88) | 3.51 | 5.31 |
Total from investment operations | 7.00 | 1.15 | (.78) | 3.54 | 5.37 |
Distributions from net investment income | (.07) | (.11) | (.02) | (.06) | - |
Distributions from net realized gain | (.33) | (.27) | (.66) | (.34) | - |
Total distributions | (.40) | (.38) | (.68) | (.40) | - |
Redemption fees added to paid in capital C | - G | - G | .01 | - G | - G |
Net asset value, end of period | $ 26.34 | $ 19.74 | $ 18.97 | $ 20.42 | $ 17.28 |
Total Return A, B | 36.18% | 6.28% | (4.00)% | 20.85% | 45.09% |
Ratios to Average Net Assets D, F | | | | | |
Expenses before reductions | 1.61% | 1.63% | 1.56% | 1.71% | 1.75% |
Expenses net of fee waivers, if any | 1.61% | 1.63% | 1.55% | 1.65% | 1.65% |
Expenses net of all reductions | 1.60% | 1.60% | 1.54% | 1.63% | 1.62% |
Net investment income (loss) | .25% | .32% | .49% | .16% | .41% |
Supplemental Data | | | | | |
Net assets, end of period (000 omitted) | $ 24,020 | $ 14,125 | $ 17,185 | $ 19,720 | $ 17,590 |
Portfolio turnover rate E | 54% | 68% | 47% | 66% | 81% |
A Total returns would have been lower if certain expenses had not been reduced during the applicable periods shown.
B Total returns do not include the effect of the sales charges.
C Calculated based on average shares outstanding during the period.
D Fees and expenses of any underlying Fidelity Central Funds are not included in the Fund's expense ratio. The Fund indirectly bears its proportionate share of the expenses of any underlying Fidelity Central Funds.
E Amount does not include the portfolio activity of any underlying Fidelity Central Funds.
F Expense ratios reflect operating expenses of the class. Expenses before reductions do not reflect amounts reimbursed by the investment adviser or reductions from brokerage service arrangements or reductions from other expense offset arrangements and do not represent the amount paid by the class during periods when reimbursements or reductions occur. Expenses net of fee waivers reflect expenses after reimbursement by the investment adviser but prior to reductions from brokerage service arrangements or other expense offset arrangements. Expenses net of all reductions represent the net expenses paid by the class.
G Amount represents less than $.01 per share.
See accompanying notes which are an integral part of the financial statements.
Annual Report
Financial Highlights - Class T
Years ended October 31, | 2013 | 2012 | 2011 | 2010 | 2009 |
Selected Per-Share Data | | | | | |
Net asset value, beginning of period | $ 19.59 | $ 18.80 | $ 20.23 | $ 17.14 | $ 11.84 |
Income from Investment Operations | | | | | |
Net investment income (loss) C | - G | .01 | .05 | (.02) | .02 |
Net realized and unrealized gain (loss) | 6.90 | 1.08 | (.86) | 3.47 | 5.28 |
Total from investment operations | 6.90 | 1.09 | (.81) | 3.45 | 5.30 |
Distributions from net investment income | - | (.03) | - | (.02) | - |
Distributions from net realized gain | (.32) | (.27) | (.63) | (.34) | - |
Total distributions | (.32) | (.30) | (.63) | (.36) | - |
Redemption fees added to paid in capital C | - G | - G | .01 | - G | - G |
Net asset value, end of period | $ 26.17 | $ 19.59 | $ 18.80 | $ 20.23 | $ 17.14 |
Total Return A, B | 35.80% | 5.97% | (4.18)% | 20.46% | 44.76% |
Ratios to Average Net Assets D, F | | | | | |
Expenses before reductions | 1.87% | 1.88% | 1.82% | 1.97% | 2.00% |
Expenses net of fee waivers, if any | 1.87% | 1.88% | 1.81% | 1.90% | 1.90% |
Expenses net of all reductions | 1.85% | 1.85% | 1.79% | 1.88% | 1.86% |
Net investment income (loss) | (.01)% | .07% | .24% | (.09)% | .16% |
Supplemental Data | | | | | |
Net assets, end of period (000 omitted) | $ 13,530 | $ 9,262 | $ 13,744 | $ 16,092 | $ 15,760 |
Portfolio turnover rate E | 54% | 68% | 47% | 66% | 81% |
A Total returns would have been lower if certain expenses had not been reduced during the applicable periods shown.
B Total returns do not include the effect of the sales charges.
C Calculated based on average shares outstanding during the period.
D Fees and expenses of any underlying Fidelity Central Funds are not included in the Fund's expense ratio. The Fund indirectly bears its proportionate share of the expenses of any underlying Fidelity Central Funds.
E Amount does not include the portfolio activity of any underlying Fidelity Central Funds.
F Expense ratios reflect operating expenses of the class. Expenses before reductions do not reflect amounts reimbursed by the investment adviser or reductions from brokerage service arrangements or reductions from other expense offset arrangements and do not represent the amount paid by the class during periods when reimbursements or reductions occur. Expenses net of fee waivers reflect expenses after reimbursement by the investment adviser but prior to reductions from brokerage service arrangements or other expense offset arrangements. Expenses net of all reductions represent the net expenses paid by the class.
G Amount represents less than $.01 per share.
See accompanying notes which are an integral part of the financial statements.
Annual Report
Financial Highlights - Class B
Years ended October 31, | 2013 | 2012 | 2011 | 2010 | 2009 |
Selected Per-Share Data | | | | | |
Net asset value, beginning of period | $ 19.22 | $ 18.38 | $ 19.79 | $ 16.78 | $ 11.65 |
Income from Investment Operations | | | | | |
Net investment income (loss) C | (.11) | (.08) | (.05) | (.10) | (.04) |
Net realized and unrealized gain (loss) | 6.84 | 1.07 | (.85) | 3.39 | 5.17 |
Total from investment operations | 6.73 | .99 | (.90) | 3.29 | 5.13 |
Distributions from net realized gain | (.08) | (.15) | (.52) | (.28) | - |
Redemption fees added to paid in capital C | - G | - G | .01 | - G | - G |
Net asset value, end of period | $ 25.87 | $ 19.22 | $ 18.38 | $ 19.79 | $ 16.78 |
Total Return A, B | 35.14% | 5.45% | (4.68)% | 19.90% | 44.03% |
Ratios to Average Net Assets D, F | | | | | |
Expenses before reductions | 2.37% | 2.38% | 2.32% | 2.47% | 2.49% |
Expenses net of fee waivers, if any | 2.36% | 2.38% | 2.30% | 2.40% | 2.40% |
Expenses net of all reductions | 2.35% | 2.35% | 2.29% | 2.38% | 2.36% |
Net investment income (loss) | (.51)% | (.43)% | (.26)% | (.59)% | (.33)% |
Supplemental Data | | | | | |
Net assets, end of period (000 omitted) | $ 795 | $ 790 | $ 2,067 | $ 3,457 | $ 3,601 |
Portfolio turnover rate E | 54% | 68% | 47% | 66% | 81% |
A Total returns would have been lower if certain expenses had not been reduced during the applicable periods shown.
B Total returns do not include the effect of the contingent deferred sales charge.
C Calculated based on average shares outstanding during the period.
D Fees and expenses of any underlying Fidelity Central Funds are not included in the Fund's expense ratio. The Fund indirectly bears its proportionate share of the expenses of any underlying Fidelity Central Funds.
E Amount does not include the portfolio activity of any underlying Fidelity Central Funds.
F Expense ratios reflect operating expenses of the class. Expenses before reductions do not reflect amounts reimbursed by the investment adviser or reductions from brokerage service arrangements or reductions from other expense offset arrangements and do not represent the amount paid by the class during periods when reimbursements or reductions occur. Expenses net of fee waivers reflect expenses after reimbursement by the investment adviser but prior to reductions from brokerage service arrangements or other expense offset arrangements. Expenses net of all reductions represent the net expenses paid by the class.
G Amount represents less than $.01 per share.
See accompanying notes which are an integral part of the financial statements.
Annual Report
Financial Highlights - Class C
Years ended October 31, | 2013 | 2012 | 2011 | 2010 | 2009 |
Selected Per-Share Data | | | | | |
Net asset value, beginning of period | $ 19.18 | $ 18.38 | $ 19.85 | $ 16.85 | $ 11.70 |
Income from Investment Operations | | | | | |
Net investment income (loss) C | (.11) | (.08) | (.04) | (.10) | (.04) |
Net realized and unrealized gain (loss) | 6.79 | 1.07 | (.85) | 3.40 | 5.19 |
Total from investment operations | 6.68 | .99 | (.89) | 3.30 | 5.15 |
Distributions from net realized gain | (.18) | (.19) | (.59) | (.30) | - |
Redemption fees added to paid in capital C | - G | - G | .01 | - G | - G |
Net asset value, end of period | $ 25.68 | $ 19.18 | $ 18.38 | $ 19.85 | $ 16.85 |
Total Return A, B | 35.15% | 5.46% | (4.64)% | 19.86% | 44.02% |
Ratios to Average Net Assets D, F | | | | | |
Expenses before reductions | 2.33% | 2.38% | 2.27% | 2.42% | 2.49% |
Expenses net of fee waivers, if any | 2.33% | 2.38% | 2.26% | 2.40% | 2.40% |
Expenses net of all reductions | 2.32% | 2.35% | 2.24% | 2.37% | 2.36% |
Net investment income (loss) | (.47)% | (.43)% | (.21)% | (.59)% | (.33)% |
Supplemental Data | | | | | |
Net assets, end of period (000 omitted) | $ 13,426 | $ 6,799 | $ 9,545 | $ 13,501 | $ 5,814 |
Portfolio turnover rate E | 54% | 68% | 47% | 66% | 81% |
A Total returns would have been lower if certain expenses had not been reduced during the applicable periods shown.
B Total returns do not include the effect of the contingent deferred sales charge.
C Calculated based on average shares outstanding during the period.
D Fees and expenses of any underlying Fidelity Central Funds are not included in the Fund's expense ratio. The Fund indirectly bears its proportionate share of the expenses of any underlying Fidelity Central Funds.
E Amount does not include the portfolio activity of any underlying Fidelity Central Funds.
F Expense ratios reflect operating expenses of the class. Expenses before reductions do not reflect amounts reimbursed by the investment adviser or reductions from brokerage service arrangements or reductions from other expense offset arrangements and do not represent the amount paid by the class during periods when reimbursements or reductions occur. Expenses net of fee waivers reflect expenses after reimbursement by the investment adviser but prior to reductions from brokerage service arrangements or other expense offset arrangements. Expenses net of all reductions represent the net expenses paid by the class.
G Amount represents less than $.01 per share.
See accompanying notes which are an integral part of the financial statements.
Annual Report
Financial Highlights - International Small Cap
Years ended October 31, | 2013 | 2012 | 2011 | 2010 | 2009 |
Selected Per-Share Data | | | | | |
Net asset value, beginning of period | $ 19.99 | $ 19.23 | $ 20.66 | $ 17.48 | $ 12.03 |
Income from Investment Operations | | | | | |
Net investment income (loss) B | .12 | .11 | .17 | .07 | .08 |
Net realized and unrealized gain (loss) | 7.02 | 1.10 | (.89) | 3.53 | 5.37 |
Total from investment operations | 7.14 | 1.21 | (.72) | 3.60 | 5.45 |
Distributions from net investment income | (.14) | (.18) | (.06) | (.08) | - |
Distributions from net realized gain | (.33) | (.27) | (.66) | (.34) | - |
Total distributions | (.46) G | (.45) | (.72) | (.42) | - |
Redemption fees added to paid in capital B | - F | - F | .01 | - F | - F |
Net asset value, end of period | $ 26.67 | $ 19.99 | $ 19.23 | $ 20.66 | $ 17.48 |
Total Return A | 36.56% | 6.55% | (3.65)% | 21.02% | 45.30% |
Ratios to Average Net Assets C, E | | | | | |
Expenses before reductions | 1.33% | 1.35% | 1.26% | 1.44% | 1.48% |
Expenses net of fee waivers, if any | 1.32% | 1.35% | 1.25% | 1.44% | 1.48% |
Expenses net of all reductions | 1.31% | 1.33% | 1.23% | 1.42% | 1.44% |
Net investment income (loss) | .53% | .59% | .80% | .37% | .58% |
Supplemental Data | | | | | |
Net assets, end of period (000 omitted) | $ 1,029,629 | $ 692,769 | $ 856,692 | $ 808,478 | $ 669,035 |
Portfolio turnover rate D | 54% | 68% | 47% | 66% | 81% |
A Total returns would have been lower if certain expenses had not been reduced during the applicable periods shown.
B Calculated based on average shares outstanding during the period.
C Fees and expenses of any underlying Fidelity Central Funds are not included in the Fund's expense ratio. The Fund indirectly bears its proportionate share of the expenses of any underlying Fidelity Central Funds.
D Amount does not include the portfolio activity of any underlying Fidelity Central Funds.
E Expense ratios reflect operating expenses of the class. Expenses before reductions do not reflect amounts reimbursed by the investment adviser or reductions from brokerage service arrangements or reductions from other expense offset arrangements and do not represent the amount paid by the class during periods when reimbursements or reductions occur. Expenses net of fee waivers reflect expenses after reimbursement by the investment adviser but prior to reductions from brokerage service arrangements or other expense offset arrangements. Expenses net of all reductions represent the net expenses paid by the class.
F Amount represents less than $.01 per share.
G Total distributions of $.46 per share is comprised of distributions from net investment income of $.136 and distributions from net realized gain of $.327 per share.
See accompanying notes which are an integral part of the financial statements.
Annual Report
Financial Highlights - Institutional Class
Years ended October 31, | 2013 | 2012 | 2011 | 2010 | 2009 |
Selected Per-Share Data | | | | | |
Net asset value, beginning of period | $ 20.00 | $ 19.24 | $ 20.66 | $ 17.47 | $ 12.01 |
Income from Investment Operations | | | | | |
Net investment income (loss) B | .16 | .13 | .18 | .09 | .09 |
Net realized and unrealized gain (loss) | 7.00 | 1.10 | (.89) | 3.53 | 5.37 |
Total from investment operations | 7.16 | 1.23 | (.71) | 3.62 | 5.46 |
Distributions from net investment income | (.16) | (.20) | (.06) | (.09) | - |
Distributions from net realized gain | (.33) | (.27) | (.66) | (.34) | - |
Total distributions | (.49) | (.47) | (.72) | (.43) | - |
Redemption fees added to paid in capital B | - F | - F | .01 | - F | - F |
Net asset value, end of period | $ 26.67 | $ 20.00 | $ 19.24 | $ 20.66 | $ 17.47 |
Total Return A | 36.68% | 6.65% | (3.62)% | 21.15% | 45.46% |
Ratios to Average Net Assets C, E | | | | | |
Expenses before reductions | 1.20% | 1.25% | 1.22% | 1.34% | 1.45% |
Expenses net of fee waivers, if any | 1.20% | 1.25% | 1.21% | 1.34% | 1.40% |
Expenses net of all reductions | 1.18% | 1.22% | 1.19% | 1.31% | 1.37% |
Net investment income (loss) | .66% | .70% | .84% | .47% | .66% |
Supplemental Data | | | | | |
Net assets, end of period (000 omitted) | $ 67,038 | $ 9,503 | $ 15,752 | $ 8,231 | $ 2,696 |
Portfolio turnover rate D | 54% | 68% | 47% | 66% | 81% |
A Total returns would have been lower if certain expenses had not been reduced during the applicable periods shown.
B Calculated based on average shares outstanding during the period.
C Fees and expenses of any underlying Fidelity Central Funds are not included in the Fund's expense ratio. The Fund indirectly bears its proportionate share of the expenses of any underlying Fidelity Central Funds.
D Amount does not include the portfolio activity of any underlying Fidelity Central Funds.
E Expense ratios reflect operating expenses of the class. Expenses before reductions do not reflect amounts reimbursed by the investment adviser or reductions from brokerage service arrangements or reductions from other expense offset arrangements and do not represent the amount paid by the class during periods when reimbursements or reductions occur. Expenses net of fee waivers reflect expenses after reimbursement by the investment adviser but prior to reductions from brokerage service arrangements or other expense offset arrangements. Expenses net of all reductions represent the net expenses paid by the class.
F Amount represents less than $.01 per share.
See accompanying notes which are an integral part of the financial statements.
Annual Report
Notes to Financial Statements
For the period ended October 31, 2013
1. Organization.
Fidelity International Small Cap Fund (the Fund) is a fund of Fidelity Investment Trust (the Trust) and is authorized to issue an unlimited number of shares. The Trust is registered under the Investment Company Act of 1940, as amended (the 1940 Act), as an open-end management investment company organized as a Massachusetts business trust. The Fund offers Class A, Class T, Class C, International Small Cap and Institutional Class shares, each of which, along with Class B shares, has equal rights as to assets and voting privileges. Class B shares are closed to new accounts and additional purchases, except for exchanges and reinvestments. Each class has exclusive voting rights with respect to matters that affect that class. Class B shares will automatically convert to Class A shares after a holding period of seven years from the initial date of purchase. The Fund's investments in emerging markets can be subject to social, economic, regulatory, and political uncertainties and can be extremely volatile.
2. Investments in Fidelity Central Funds.
The Fund invests in Fidelity Central Funds, which are open-end investment companies generally available only to other investment companies and accounts managed by Fidelity Management & Research Company (FMR) and its affiliates. The Fund's Schedule of Investments lists each of the Fidelity Central Funds held as of period end, if any, as an investment of the Fund, but does not include the underlying holdings of each Fidelity Central Fund. As an Investing Fund, the Fund indirectly bears its proportionate share of the expenses of the underlying Fidelity Central Funds.
The Money Market Central Funds seek preservation of capital and current income and are managed by Fidelity Investments Money Management, Inc. (FIMM), an affiliate of FMR.
A complete unaudited list of holdings for each Fidelity Central Fund is available upon request or at the Securities and Exchange Commission (the SEC) website at www.sec.gov. In addition, the financial statements of the Fidelity Central Funds, which are not covered by the Fund's Report of Independent Registered Public Accounting Firm, are available on the SEC website or upon request.
3. Significant Accounting Policies.
The financial statements have been prepared in conformity with accounting principles generally accepted in the United States of America (GAAP), which require management to make certain estimates and assumptions at the date of the financial statements. Actual results could differ from those estimates. Subsequent events, if any, through the date that the financial statements were issued have been evaluated in the preparation of
Annual Report
Notes to Financial Statements - continued
3. Significant Accounting Policies - continued
the financial statements. The following summarizes the significant accounting policies of the Fund:
Investment Valuation. Investments are valued as of 4:00 p.m. Eastern time on the last calendar day of the period. In accordance with valuation policies and procedures approved by the Board of Trustees (the Board), the Fund attempts to obtain prices from one or more third party pricing vendors or brokers to value its investments. When current market prices, quotations or currency exchange rates are not readily available or reliable, investments will be fair valued in good faith by the FMR Fair Value Committee (the Committee), in accordance with procedures adopted by the Board. Factors used in determining fair value vary by investment type and may include market or investment specific events, changes in interest rates and credit quality. The frequency with which these procedures are used cannot be predicted and they may be utilized to a significant extent. The Committee oversees the Fund's valuation policies and procedures and is responsible for approving and reporting to the Board all fair value determinations.
The Fund categorizes the inputs to valuation techniques used to value its investments into a disclosure hierarchy consisting of three levels as shown below:
Level 1 - quoted prices in active markets for identical investments
Level 2 - other significant observable inputs (including quoted prices for similar investments, interest rates, prepayment speeds, etc.)
Level 3 - unobservable inputs (including the Fund's own assumptions based on the best information available)
Valuation techniques used to value the Fund's investments by major category are as follows:
Equity securities, including restricted securities, for which market quotations are readily available, are valued at the last reported sale price or official closing price as reported by a third party pricing vendor on the primary market or exchange on which they are traded and are categorized as Level 1 in the hierarchy. In the event there were no sales during the day or closing prices are not available, securities are valued at the last quoted bid price or may be valued using the last available price and are generally categorized as Level 2 in the hierarchy. For foreign equity securities, when market or security specific events arise, comparisons to the valuation of American Depositary Receipts (ADRs), futures contracts, Exchange-Traded Funds (ETFs) and certain indexes as well as quoted prices for similar securities may be used and would be categorized as Level 2 in the hierarchy. Utilizing these techniques may result in transfers between Level 1 and Level 2. For equity securities, including restricted securities, where observable inputs are limited, assumptions about market activity and risk are used and these securities may be categorized as Level 3 in the hierarchy.
Annual Report
3. Significant Accounting Policies - continued
Investment Valuation - continued
Debt securities, including restricted securities, are valued based on evaluated prices received from third party pricing vendors or from brokers who make markets in such securities. For corporate bonds, pricing vendors utilize matrix pricing which considers yield or price of bonds of comparable quality, coupon, maturity and type as well as broker-supplied prices. When independent prices are unavailable or unreliable, debt securities may be valued utilizing pricing methodologies which consider similar factors that would be used by third party pricing vendors. Debt securities are generally categorized as Level 2 in the hierarchy but may be Level 3 depending on the circumstances.
Investments in open-end mutual funds, including the Fidelity Central Funds, are valued at their closing net asset value (NAV) each business day and are categorized as Level 1 in the hierarchy.
Changes in valuation techniques may result in transfers in or out of an assigned level within the disclosure hierarchy. The aggregate value of investments by input level, as of October 31, 2013, including information on transfers between Levels 1 and 2, as well as a roll forward of Level 3 investments, is included at the end of the Fund's Schedule of Investments.
Foreign Currency. The Fund may use foreign currency contracts to facilitate transactions in foreign-denominated securities. Gains and losses from these transactions may arise from changes in the value of the foreign currency or if the counterparties do not perform under the contracts' terms.
Foreign-denominated assets, including investment securities, and liabilities are translated into U.S. dollars at the exchange rates at period end. Purchases and sales of investment securities, income and dividends received and expenses denominated in foreign currencies are translated into U.S. dollars at the exchange rate in effect on the transaction date.
The effects of exchange rate fluctuations on investments are included with the net realized and unrealized gain (loss) on investment securities. Other foreign currency transactions resulting in realized and unrealized gain (loss) are disclosed separately.
Investment Transactions and Income. For financial reporting purposes, the Fund's investment holdings and NAV include trades executed through the end of the last business day of the period. The NAV per share for processing shareholder transactions is calculated as of the close of business of the New York Stock Exchange (NYSE), normally 4:00 p.m. Eastern time and includes trades executed through the end of the prior business day. Gains and losses on securities sold are determined on the basis of identified cost. Dividend income is recorded on the ex-dividend date, except for certain dividends
Annual Report
Notes to Financial Statements - continued
3. Significant Accounting Policies - continued
Investment Transactions and Income - continued
from foreign securities where the ex-dividend date may have passed, which are recorded as soon as the Fund is informed of the ex-dividend date. Non-cash dividends included in dividend income, if any, are recorded at the fair market value of the securities received. Interest income and distributions from the Fidelity Central Funds are accrued as earned. Interest income includes coupon interest and amortization of premium and accretion of discount on debt securities. Investment income is recorded net of foreign taxes withheld where recovery of such taxes is uncertain.
Class Allocations and Expenses. Investment income, realized and unrealized capital gains and losses, common expenses of the Fund, and certain fund-level expense reductions, if any, are allocated daily on a pro-rata basis to each class based on the relative net assets of each class to the total net assets of the Fund. Each class differs with respect to transfer agent and distribution and service plan fees incurred. Certain expense reductions may also differ by class. For the reporting period, the allocated portion of income and expenses to each class as a percent of its average net assets may vary due to the timing of recording these transactions in relation to fluctuating net assets of the classes. Expenses directly attributable to a fund are charged to that fund. Expenses attributable to more than one fund are allocated among the respective funds on the basis of relative net assets or other appropriate methods. Expense estimates are accrued in the period to which they relate and adjustments are made when actual amounts are known.
Income Tax Information and Distributions to Shareholders. Each year, the Fund intends to qualify as a regulated investment company under Subchapter M of the Internal Revenue Code, including distributing substantially all of its taxable income and realized gains. As a result, no provision for U.S. Federal income taxes is required. As of October 31, 2013, the Fund did not have any unrecognized tax benefits in the financial statements; nor is the Fund aware of any tax positions for which it is reasonably possible that the total amounts of unrecognized tax benefits will significantly change in the next twelve months. The Fund files a U.S. federal tax return, in addition to state and local tax returns as required. The Fund's federal income tax returns are subject to examination by the Internal Revenue Service (IRS) for a period of three fiscal years after they are filed. State and local tax returns may be subject to examination for an additional fiscal year depending on the jurisdiction. Foreign taxes are provided for based on the Fund's understanding of the tax rules and rates that exist in the foreign markets in which it invests.
Distributions are declared and recorded on the ex-dividend date. Income dividends and capital gain distributions are declared separately for each class. Income and capital gain distributions are determined in accordance with income tax regulations, which may
Annual Report
3. Significant Accounting Policies - continued
Income Tax Information and Distributions to Shareholders - continued
differ from GAAP. In addition, the Fund claimed a portion of the payment made to redeeming shareholders as a distribution for income tax purposes.
Capital accounts within the financial statements are adjusted for permanent book-tax differences. These adjustments have no impact on net assets or the results of operations. Temporary book-tax differences will reverse in a subsequent period.
Book-tax differences are primarily due to futures transactions, foreign currency transactions, passive foreign investment companies (PFIC), capital loss carryforwards and losses deferred due to wash sales.
The federal tax cost of investment securities and unrealized appreciation (depreciation) as of period end were as follows:
Gross unrealized appreciation | $ 278,457,935 |
Gross unrealized depreciation | (70,365,537) |
Net unrealized appreciation (depreciation) on securities and other investments | $ 208,092,398 |
| |
Tax Cost | $ 972,419,894 |
The tax-based components of distributable earnings as of period end were as follows:
Undistributed ordinary income | $ 30,190,846 |
Capital loss carryforward | $ (30,539,357) |
Net unrealized appreciation (depreciation) | $ 208,068,569 |
Capital loss carryforwards are only available to offset future capital gains of the Fund to the extent provided by regulations and may be limited. Under the Regulated Investment Company Modernization Act of 2010 (the Act), the Fund is permitted to carry forward capital losses incurred in taxable years beginning after December 22, 2010 for an unlimited period and such capital losses are required to be used prior to any losses that expire. The capital loss carryforward information presented below, including any applicable limitation, is estimated as of fiscal period end and is subject to adjustment.
Fiscal year of expiration | |
2017 | $ (30,539,357) |
The tax character of distributions paid was as follows:
| October 31, 2013 | October 31, 2012 |
Ordinary Income | $ 16,524,337 | $ 20,594,102 |
Annual Report
Notes to Financial Statements - continued
3. Significant Accounting Policies - continued
Short-Term Trading (Redemption) Fees. Shares held by investors in the Fund less than 90 days may have been subject to a redemption fee equal to 2.00% of the net asset value of shares redeemed. All redemption fees, which reduce the proceeds of the shareholder redemption, are retained by the Fund and accounted for as an addition to paid in capital.
Restricted Securities. The Fund may invest in securities that are subject to legal or contractual restrictions on resale. These securities generally may be resold in transactions exempt from registration or to the public if the securities are registered. Disposal of these securities may involve time-consuming negotiations and expense, and prompt sale at an acceptable price may be difficult. Information regarding restricted securities is included at the end of the Fund's Schedule of Investments.
New Accounting Pronouncement. The Financial Accounting Standards Board issued in December 2011, Accounting Standard Update No. 2011-11, Disclosures about Offsetting Assets and Liabilities, and in January 2013, Accounting Standards Update No. 2013-1 Clarifying the Scope of Disclosures about Offsetting Assets and Liabilities. These updates create new disclosure requirements requiring entities to disclose both gross and net information for derivatives and other financial instruments that are either offset in the Statement of Assets and Liabilities or subject to an enforceable master netting arrangement or similar agreement. The disclosure requirements are effective for annual reporting periods beginning on or after January 1, 2013, and interim periods within those annual periods. Management expects that the impact of the updates' adoption will be limited to additional financial statement disclosures as applicable.
4. Derivative Instruments.
Risk Exposures and the Use of Derivative Instruments. The Fund's investment objective allows the Fund to enter into various types of derivative contracts, including futures contracts. Derivatives are investments whose value is primarily derived from underlying assets, indices or reference rates and may be transacted on an exchange or over-the-counter (OTC). Derivatives may involve a future commitment to buy or sell a specified asset based on specified terms, to exchange future cash flows at periodic intervals based on a notional principal amount, or for one party to make one or more payments upon the occurrence of specified events in exchange for periodic payments from the other party.
The Fund used derivatives to increase returns and to manage exposure to certain risks as defined below. The success of any strategy involving derivatives depends on analysis of numerous economic factors, and if the strategies for investment do not work as intended, the Fund may not achieve its objectives.
Annual Report
4. Derivative Instruments - continued
Risk Exposures and the Use of Derivative Instruments - continued
The Fund's use of derivatives increased or decreased its exposure to the following risk:
Equity Risk | Equity risk relates to the fluctuations in the value of financial instruments as a result of changes in market prices (other than those arising from interest rate risk or foreign exchange risk), whether caused by factors specific to an individual investment, its issuer, or all factors affecting all instruments traded in a market or market segment. |
The Fund is also exposed to additional risks from investing in derivatives, such as liquidity risk and counterparty credit risk. Liquidity risk is the risk that the Fund will be unable to close out the derivative in the open market in a timely manner. Counterparty credit risk is the risk that the counterparty will not be able to fulfill its obligation to the Fund. Counterparty credit risk related to exchange-traded futures contracts may be mitigated by the protection provided by the exchange on which they trade.
Investing in derivatives may involve greater risks than investing in the underlying assets directly and, to varying degrees, may involve risk of loss in excess of any initial investment and collateral received and amounts recognized in the Statement of Assets and Liabilities. In addition, there may be the risk that the change in value of the derivative contract does not correspond to the change in value of the underlying instrument.
Futures Contracts. A futures contract is an agreement between two parties to buy or sell a specified underlying instrument for a fixed price at a specified future date. The Fund used futures contracts to manage its exposure to the stock market.
Upon entering into a futures contract, a fund is required to deposit either cash or securities (initial margin) with a clearing broker in an amount equal to a certain percentage of the face value of the contract. Futures contracts are marked-to-market daily and subsequent daily payments (variation margin) are made or received by a fund depending on the daily fluctuations in the value of the futures contracts and are recorded as unrealized appreciation or (depreciation). This receivable and/or payable, if any, is included in daily variation margin for derivative instruments in the Statement of Assets and Liabilities. Realized gain or (loss) is recorded upon the expiration or closing of a futures contract.
Any open futures contracts at period end are presented in the Schedule of Investments under the caption "Futures Contracts." The underlying face amount at value reflects each contract's exposure to the underlying instrument or index at period end.
During the period the Fund recognized net realized gain (loss) of $(80,042) related to its investment in futures contracts. This amount is included in the Statement of Operations.
Annual Report
Notes to Financial Statements - continued
5. Purchases and Sales of Investments.
Purchases and sales of securities, other than short-term securities, aggregated $556,944,991 and $443,858,751, respectively.
6. Fees and Other Transactions with Affiliates.
Management Fee. FMR and its affiliates provide the Fund with investment management related services for which the Fund pays a monthly management fee. The management fee is the sum of an individual fund fee rate that is based on an annual rate of .60% of the Fund's average net assets and an annualized group fee rate that averaged .25% during the period. The group fee rate is based upon the average net assets of all the mutual funds advised by FMR, including any mutual funds previously advised by FMR that are currently advised by Fidelity SelectCo, LLC, an affiliate of FMR. The group fee rate decreases as assets under management increase and increases as assets under management decrease. In addition, the management fee is subject to a performance adjustment (up to a maximum of ± .20% of the Fund's average net assets over a 36 month performance period). The upward or downward adjustment to the management fee is based on the relative investment performance of International Small Cap as compared to an appropriate benchmark index over the same 36 month performance period. For the reporting period, the total annual management fee rate, including the performance adjustment, was .96% of the Fund's average net assets. The performance adjustment included in the management fee rate may be higher or lower than the maximum performance adjustment rate due to the difference between the average net assets for the reporting and performance periods.
Distribution and Service Plan Fees. In accordance with Rule 12b-1 of the 1940 Act, the Fund has adopted separate Distribution and Service Plans for each class of shares. Certain classes pay Fidelity Distributors Corporation (FDC), an affiliate of FMR, separate Distribution and Service Fees, each of which is based on an annual percentage of each class' average net assets. In addition, FDC may pay financial intermediaries for selling shares of the Fund and providing shareholder support services. For the period, the Distribution and Service Fee rates, total fees and amounts retained by FDC were as follows:
| Distribution
Fee | Service
Fee | Total Fees | Retained
by FDC |
Class A | -% | .25% | $ 42,679 | $ 1,371 |
Class T | .25% | .25% | 51,556 | 91 |
Class B | .75% | .25% | 7,500 | 5,677 |
Class C | .75% | .25% | 90,439 | 12,749 |
| | | $ 192,174 | $ 19,888 |
Annual Report
6. Fees and Other Transactions with Affiliates - continued
Sales Load. FDC may receive a front-end sales charge of up to 5.75% for selling Class A shares and 3.50% for selling Class T shares, some of which is paid to financial intermediaries for selling shares of the Fund. Depending on the holding period, FDC may receive contingent deferred sales charges levied on Class A, Class T, Class B, and Class C redemptions. The deferred sales charges range from 5.00% to 1.00% for Class B shares, 1.00% for Class C shares, 1.00% for certain purchases of Class A shares and .25% for certain purchases of Class T shares.
For the period, sales charge amounts retained by FDC were as follows:
| Retained
by FDC |
Class A | $ 13,853 |
Class T | 2,743 |
Class B* | 143 |
Class C* | 1,699 |
| $ 18,438 |
* When Class B and Class C shares are initially sold, FDC pays commissions from its own resources to financial intermediaries through which the sales
are made.
Transfer Agent Fees. Fidelity Investments Institutional Operations Company, Inc., (FIIOC), an affiliate of FMR, is the transfer, dividend disbursing and shareholder servicing agent for each class of the Fund. FIIOC receives account fees and asset-based fees that vary according to the account size and type of account of the shareholders of the respective classes of the Fund. FIIOC pays for typesetting, printing and mailing of shareholder reports, except proxy statements.
For the period, transfer agent fees for each class were as follows:
| Amount | % of
Average
Net Assets |
Class A | $ 50,833 | .30 |
Class T | 31,476 | .30 |
Class B | 2,235 | .30 |
Class C | 24,673 | .27 |
International Small Cap | 2,068,757 | .26 |
Institutional Class | 27,668 | .13 |
| $ 2,205,642 | |
Accounting and Security Lending Fees. Fidelity Service Company, Inc. (FSC), an affiliate of FMR, maintains the Fund's accounting records. The accounting fee is based on the level of average net assets for each month. Under a separate contract, FSC administers the security lending program. The security lending fee is based on the number and duration of lending transactions.
Annual Report
Notes to Financial Statements - continued
6. Fees and Other Transactions with Affiliates - continued
Brokerage Commissions. The Fund placed a portion of its portfolio transactions with brokerage firms which are affiliates of the investment adviser. Brokerage commissions are included in net realized gain (loss) and change in net unrealized appreciation (depreciation) in the Statement of Operations. The commissions paid to these affiliated firms were $510 for the period.
Other. During the period, FMR reimbursed the Fund for certain losses in the amount of $80,334.
7. Committed Line of Credit.
The Fund participates with other funds managed by FMR or an affiliate in a $4.25 billion credit facility (the "line of credit") to be utilized for temporary or emergency purposes to fund shareholder redemptions or for other short-term liquidity purposes. The Fund has agreed to pay commitment fees on its pro-rata portion of the line of credit, which amounted to $1,779 and is reflected in Miscellaneous expenses on the Statement of Operations. During the period, there were no borrowings on this line of credit.
8. Security Lending.
The Fund lends portfolio securities through a lending agent from time to time in order to earn additional income. For equity securities, a lending agent is used and may loan securities to certain qualified borrowers, including Fidelity Capital Markets (FCM), a broker-dealer affiliated with the Fund. On the settlement date of the loan, the Fund receives collateral (in the form of U.S. Treasury obligations, letters of credit and/or cash) against the loaned securities and maintains collateral in an amount not less than 100% of the market value of the loaned securities during the period of the loan. The market value of the loaned securities is determined at the close of business of the Fund and any additional required collateral is delivered to the Fund on the next business day. If the borrower defaults on its obligation to return the securities loaned because of insolvency or other reasons, the Fund may apply collateral received from the borrower against the obligation. The Fund may experience delays and costs in recovering the securities loaned. Any cash collateral received is invested in the Fidelity Securities Lending Cash Central Fund. The value of loaned securities and cash collateral at period end are disclosed on the Fund's Statement of Assets and Liabilities. The value of securities loaned to FCM at period end was $73,568. Security lending income represents the income earned on investing cash collateral, less rebates paid to borrowers and any lending agent fees associated with the loan, plus any premium payments received for lending certain types of securities. Security lending income is presented in the Statement of Operations as a component of income from Fidelity Central Funds. Total security lending income during the period amounted to $663,324, including $3,759 from securities loaned to FCM.
Annual Report
9. Expense Reductions.
Commissions paid to certain brokers with whom FMR, or its affiliates, places trades on behalf of the Fund include an amount in addition to trade execution, which may be rebated back to the Fund to offset certain expenses. This amount totaled $113,128 for the period.
In addition, FMR reimbursed a portion of the Fund's operating expenses during the period in the amount of $29,243.
10. Distributions to Shareholders.
Distributions to shareholders of each class were as follows:
Years ended October 31, | 2013 | 2012 |
From net investment income | | |
Class A | $ 53,369 | $ 98,060 |
Class T | - | 18,440 |
International Small Cap | 4,638,246 | 7,747,338 |
Institutional Class | 77,935 | 152,585 |
Total | $ 4,769,550 | $ 8,016,423 |
From net realized gain | | |
Class A | $ 235,834 | $ 246,964 |
Class T | 146,972 | 172,958 |
Class B | 3,106 | 15,448 |
Class C | 61,233 | 91,928 |
International Small Cap | 11,152,248 | 11,838,630 |
Institutional Class | 155,394 | 211,751 |
Total | $ 11,754,787 | $ 12,577,679 |
11. Share Transactions.
Transactions for each class of shares were as follows:
| Shares | Dollars |
Years ended October 31, | 2013 | 2012 | 2013 | 2012 |
Class A | | | | |
Shares sold | 398,633 | 190,464 | $ 9,321,444 | $ 3,581,689 |
Reinvestment of distributions | 13,843 | 18,159 | 269,801 | 323,949 |
Shares redeemed | (215,812) | (398,912) | (4,750,681) | (7,484,565) |
Net increase (decrease) | 196,664 | (190,289) | $ 4,840,564 | $ (3,578,927) |
Class T | | | | |
Shares sold | 141,247 | 67,193 | $ 3,379,516 | $ 1,245,760 |
Reinvestment of distributions | 7,380 | 10,478 | 143,239 | 185,991 |
Shares redeemed | (104,387) | (336,074) | (2,281,922) | (6,220,818) |
Net increase (decrease) | 44,240 | (258,403) | $ 1,240,833 | $ (4,789,067) |
Annual Report
Notes to Financial Statements - continued
11. Share Transactions - continued
| Shares | Dollars |
Years ended October 31, | 2013 | 2012 | 2013 | 2012 |
Class B | | | | |
Shares sold | 4,525 | 1,171 | $ 108,233 | $ 21,568 |
Reinvestment of distributions | 157 | 825 | 3,023 | 14,430 |
Shares redeemed | (15,050) | (73,396) | (330,538) | (1,354,968) |
Net increase (decrease) | (10,368) | (71,400) | $ (219,282) | $ (1,318,970) |
Class C | | | | |
Shares sold | 275,046 | 95,047 | $ 6,270,694 | $ 1,772,779 |
Reinvestment of distributions | 2,855 | 4,830 | 54,609 | 84,289 |
Shares redeemed | (109,571) | (264,717) | (2,419,306) | (4,745,500) |
Net increase (decrease) | 168,330 | (164,840) | $ 3,905,997 | $ (2,888,432) |
International Small Cap | | | | |
Shares sold | 11,248,438 | 4,700,621 | $ 266,912,412 | $ 88,441,440 |
Reinvestment of distributions | 770,505 | 1,033,828 | 15,163,539 | 18,629,579 |
Shares redeemed | (8,061,607) | (15,631,544) | (180,218,306) | (292,428,231) |
Net increase (decrease) | 3,957,336 | (9,897,095) | $ 101,857,645 | $ (185,357,212) |
Institutional Class | | | | |
Shares sold | 2,333,500 | 199,584 | $ 57,218,863 | $ 3,790,776 |
Reinvestment of distributions | 8,409 | 15,793 | 165,323 | 284,438 |
Shares redeemed | (303,629) | (559,093) | (6,792,002) | (10,329,992) |
Net increase (decrease) | 2,038,280 | (343,716) | $ 50,592,184 | $ (6,254,778) |
12. Other.
The Fund's organizational documents provide former and current trustees and officers with a limited indemnification against liabilities arising in connection with the performance of their duties to the Fund. In the normal course of business, the Fund may also enter into contracts that provide general indemnifications. The Fund's maximum exposure under these arrangements is unknown as this would be dependent on future claims that may be made against the Fund. The risk of material loss from such claims is considered remote.
At the end of the period, FMR or its affiliates were the owners of record of 13% of the total outstanding shares of the Fund.
Annual Report
To the Trustees of Fidelity Investment Trust and Shareholders of Fidelity International Small Cap Fund:
We have audited the accompanying statement of assets and liabilities of Fidelity International Small Cap Fund (the Fund), a fund of Fidelity Investment Trust, including the schedule of investments, as of October 31, 2013, and the related statement of operations for the year then ended, the statement of changes in net assets for each of the two years in the period then ended, and the financial highlights for each of the five years in the period then ended. These financial statements and financial highlights are the responsibility of the Fund's management. Our responsibility is to express an opinion on these financial statements and financial highlights based on our audits.
We conducted our audits in accordance with the standards of the Public Company Accounting Oversight Board (United States). Those standards require that we plan and perform the audit to obtain reasonable assurance about whether the financial statements and financial highlights are free of material misstatement. The Fund is not required to have, nor were we engaged to perform, an audit of its internal control over financial reporting. Our audits included consideration of internal control over financial reporting as a basis for designing audit procedures that are appropriate in the circumstances, but not for the purpose of expressing an opinion on the effectiveness of the Fund's internal control over financial reporting. Accordingly, we express no such opinion. An audit also includes examining, on a test basis, evidence supporting the amounts and disclosures in the financial statements, assessing the accounting principles used and significant estimates made by management, as well as evaluating the overall financial statement presentation. Our procedures included confirmation of securities owned as of October 31, 2013, by correspondence with the custodians and brokers; where replies were not received from brokers, we performed other auditing procedures. We believe that our audits provide a reasonable basis for our opinion.
In our opinion, the financial statements and financial highlights referred to above present fairly, in all material respects, the financial position of Fidelity International Small Cap Fund as of October 31, 2013, the results of its operations for the year then ended, the changes in its net assets for each of the two years in the period then ended, and the financial highlights for each of the five years in the period then ended, in conformity with accounting principles generally accepted in the United States of America.
DELOITTE & TOUCHE LLP
Boston, Massachusetts
December 13, 2013
Annual Report
The Trustees, Member of the Advisory Board, and executive officers of the trust and fund, as applicable, are listed below. The Board of Trustees governs the fund and is responsible for protecting the interests of shareholders. The Trustees are experienced executives who meet periodically throughout the year to oversee the fund's activities, review contractual arrangements with companies that provide services to the fund, oversee management of the risks associated with such activities and contractual arrangements, and review the fund's performance. Except for James C. Curvey, Ned C. Lautenbach, Ronald P. O'Hanley, and William S. Stavropoulos, each of the Trustees oversees 171 funds. Mr. Curvey oversees 394 funds. Mr. Lautenbach, Mr. O'Hanley, and Mr. Stavropoulos each oversees 245 funds.
The Trustees hold office without limit in time except that (a) any Trustee may resign; (b) any Trustee may be removed by written instrument, signed by at least two-thirds of the number of Trustees prior to such removal; (c) any Trustee who requests to be retired or who has become incapacitated by illness or injury may be retired by written instrument signed by a majority of the other Trustees; and (d) any Trustee may be removed at any special meeting of shareholders by a two-thirds vote of the outstanding voting securities of the trust. Each Trustee who is not an interested person of the trust and the fund (as defined in the 1940 Act) (Independent Trustee), shall retire not later than the last day of the calendar year in which his or her 75th birthday occurs. The Independent Trustees may waive this mandatory retirement age policy with respect to individual Trustees. The executive officers and Advisory Board Member hold office without limit in time, except that any officer and Advisory Board Member may resign or may be removed by a vote of a majority of the Trustees at any regular meeting or any special meeting of the Trustees. Except as indicated, each individual has held the office shown or other offices in the same company for the past five years.
Experience, Skills, Attributes, and Qualifications of the Fund's Trustees. The Governance and Nominating Committee has adopted a statement of policy that describes the experience, qualifications, attributes, and skills that are necessary and desirable for potential Independent Trustee candidates (Statement of Policy). The Board believes that each Trustee satisfied at the time he or she was initially elected or appointed a Trustee, and continues to satisfy, the standards contemplated by the Statement of Policy. The Governance and Nominating Committee also engages professional search firms to help identify potential Independent Trustee candidates who have the experience, qualifications, attributes, and skills consistent with the Statement of Policy. From time to time, additional criteria based on the composition and skills of the current Independent Trustees, as well as experience or skills that may be appropriate in light of future changes to board composition, business conditions, and regulatory or other developments, have also been considered by the professional search firms and the Governance and Nominating Committee. In addition, the Board takes into account the Trustees' commitment and participation in Board and committee meetings, as well as their leadership of standing and ad hoc committees throughout their tenure.
Annual Report
In determining that a particular Trustee was and continues to be qualified to serve as a Trustee, the Board has considered a variety of criteria, none of which, in isolation, was controlling. The Board believes that, collectively, the Trustees have balanced and diverse experience, qualifications, attributes, and skills, which allow the Board to operate effectively in governing the fund and protecting the interests of shareholders. Information about the specific experience, skills, attributes, and qualifications of each Trustee, which in each case led to the Board's conclusion that the Trustee should serve (or continue to serve) as a trustee of the fund, is provided below.
Board Structure and Oversight Function. James C. Curvey is an interested person (as defined in the 1940 Act) and currently serves as Chairman. The Trustees have determined that an interested Chairman is appropriate and benefits shareholders because an interested Chairman has a personal and professional stake in the quality and continuity of services provided to the fund. Independent Trustees exercise their informed business judgment to appoint an individual of their choosing to serve as Chairman, regardless of whether the Trustee happens to be independent or a member of management. The Independent Trustees have determined that they can act independently and effectively without having an Independent Trustee serve as Chairman and that a key structural component for assuring that they are in a position to do so is for the Independent Trustees to constitute a substantial majority for the Board. The Independent Trustees also regularly meet in executive session. Ned C. Lautenbach serves as Chairman of the Independent Trustees and as such (i) acts as a liaison between the Independent Trustees and management with respect to matters important to the Independent Trustees and (ii) with management prepares agendas for Board meetings.
Fidelity funds are overseen by different Boards of Trustees. The fund's Board oversees Fidelity's equity and high income funds and another Board oversees Fidelity's investment-grade bond, money market, and asset allocation funds. The asset allocation funds may invest in Fidelity funds overseen by the fund's Board. The use of separate Boards, each with its own committee structure, allows the Trustees of each group of Fidelity funds to focus on the unique issues of the funds they oversee, including common research, investment, and operational issues. On occasion, the separate Boards establish joint committees to address issues of overlapping consequences for the Fidelity funds overseen by each Board.
The Trustees operate using a system of committees to facilitate the timely and efficient consideration of all matters of importance to the Trustees, the fund, and fund shareholders and to facilitate compliance with legal and regulatory requirements and oversight of the fund's activities and associated risks. The Board, acting through its committees, has charged FMR and its affiliates with (i) identifying events or circumstances the occurrence of which could have demonstrably adverse effects on the fund's business and/or reputation; (ii) implementing processes and controls to lessen the possibility that such events or circumstances occur or to mitigate the effects of such events or circumstances if they do occur; and (iii) creating and maintaining a system designed to evaluate continuously business and market conditions in order to facilitate the identification and implementation processes described in (i) and (ii) above. Because the day-to-day operations and activities of the fund are carried out by or through FMR, its affiliates and other service providers, the fund's exposure to risks is mitigated but not eliminated by the processes overseen by the Trustees. While each of the Board's committees has responsibility for overseeing different aspects of the fund's activities, oversight is exercised primarily through the Operations, Audit, and Compliance Committees. In addition, the Independent Trustees have worked with FMR to enhance the Board's oversight of investment and financial risks, legal and regulatory risks, technology risks, and operational risks, including the development of additional risk reporting to the Board. For example, a working group comprised of Independent Trustees and FMR has worked and continues to work to review the Fidelity funds' valuation-related activities, reporting and risk management. Appropriate personnel, including but not limited to the fund's Chief Compliance Officer (CCO), FMR's internal auditor, the independent accountants, the fund's Treasurer and portfolio management personnel, make periodic reports to the Board's committees, as appropriate, including an annual review of FMR's risk management program for the Fidelity funds. The responsibilities of each standing committee, including their oversight responsibilities, are described further under "Standing Committees of the Fund's Trustees."
Annual Report
Trustees and Officers - continued
The fund's Statement of Additional Information (SAI) includes more information about the Trustees. To request a free copy, call Fidelity at 1-877-208-0098.
Interested Trustees*:
Correspondence intended for each Trustee who is an interested person may be sent to Fidelity Investments, 245 Summer Street, Boston, Massachusetts 02210.
Name, Year of Birth; Principal Occupations and Other Relevant Experience+ |
James C. Curvey (1935) |
Year of Election or Appointment: 2007 Trustee Chairman of the Board of Trustees |
| Mr. Curvey also serves as Trustee of other Fidelity funds. Mr. Curvey is a Director of Fidelity Investments Money Management, Inc. (2009-present), Director of Fidelity Research & Analysis Co. (2009-present) and Director of FMR and FMR Co., Inc. (2007-present). Mr. Curvey is also Vice Chairman (2007-present) and Director of FMR LLC. In addition, Mr. Curvey serves as an Overseer for the Boston Symphony Orchestra and a member of the Trustees of Villanova University. Previously, Mr. Curvey was the Vice Chairman (2006-2007) and Director (2000-2007) of FMR Corp. |
Ronald P. O'Hanley (1957) |
Year of Election or Appointment: 2011 Trustee |
| Mr. O'Hanley also serves as Trustee of other Fidelity funds. He is Director of Fidelity SelectCo, LLC (2013-present), FMR Co., Inc. (2010-present), Director of Fidelity Investments Money Management, Inc. (2010-present), Director of Fidelity Research & Analysis Company (2010-present), President of Fidelity Asset Management and Corporate Services and a Member of Fidelity's Executive Committee (2010-present). Previously, Mr. O'Hanley served as President and Chief Executive Officer of BNY Mellon Asset Management (2007-2010). Mr. O'Hanley also served as Vice Chairman of Bank New York Mellon Corp. and a member of that firm's Executive Committee. Prior to the 2007 merger of The Bank of New York and Mellon Financial Corporation, he was Vice Chairman of Mellon Financial Corporation and President and Chief Executive Officer of Mellon Asset Management. He joined Mellon in February 1997. Mr. O'Hanley currently serves as Chairman of the Boston Public Library Foundation Board of Directors and sits on the Board of Directors of Beth Israel Deaconess Medical Center, the Board of Trustees of the Marine Biological Laboratory and the Advisory Board of the Maxwell School of Citizenship and Public Administration at Syracuse University. Mr. O'Hanley also chairs the Council on Asset Management for the Financial Services Roundtable and is a member of the Board of Directors of Institutional Investor's U.S. Institute. |
* Trustees have been determined to be "Interested Trustees" by virtue of, among other things, their affiliation with the trust or various entities under common control with FMR.
+ The information above includes each Trustee's principal occupation during the last five years and other information relating to the experience, attributes, and skills relevant to each Trustee's qualifications to serve as a Trustee, which led to the conclusion that each Trustee should serve as a Trustee for the fund.
Annual Report
Trustees and Officers - continued
Independent Trustees:
Correspondence intended for each Independent Trustee (that is, the Trustees other than the Interested Trustees) may be sent to Fidelity Investments, P.O. Box 55235, Boston, Massachusetts 02205-5235.
Name, Year of Birth; Principal Occupations and Other Relevant Experience+ |
Dennis J. Dirks (1948) |
Year of Election or Appointment: 2005 Trustee |
| Mr. Dirks also serves as Trustee of other Fidelity funds. Prior to his retirement in May 2003, Mr. Dirks was Chief Operating Officer and a member of the Board of The Depository Trust & Clearing Corporation (DTCC). He also served as President, Chief Operating Officer, and Board member of The Depository Trust Company (DTC) and President and Board member of the National Securities Clearing Corporation (NSCC). In addition, Mr. Dirks served as Chief Executive Officer and Board member of the Government Securities Clearing Corporation, Chief Executive Officer and Board member of the Mortgage-Backed Securities Clearing Corporation, as a Trustee and a member of the Finance Committee of Manhattan College (2005-2008), and as a Trustee and a member of the Finance Committee of AHRC of Nassau County (2006-2008). Mr. Dirks is a member of the Independent Directors Council (IDC) Governing Council (2010-present) and Board of Directors for The Brookville Center for Children's Services, Inc. (2009-present). |
Alan J. Lacy (1953) |
Year of Election or Appointment: 2008 Trustee |
| Mr. Lacy also serves as Trustee of other Fidelity funds. Mr. Lacy serves as Senior Adviser (2007-present) of Oak Hill Capital Partners, L.P. (private equity). Mr. Lacy also served as Chief Executive Officer (2000-2005) and Vice Chairman (2005-2006) of Sears Holdings Corporation and Sears, Roebuck and Co. (retail). In addition, Mr. Lacy serves as a member of the Board of Directors of Dave & Buster's Entertainment, Inc. (restaurant and entertainment complexes, 2010-present), Earth Fare, Inc. (retail grocery, 2012-present), The Hillman Companies, Inc. (hardware wholesalers, 2010-present), and Bristol-Myers Squibb Company (global pharmaceuticals, 2008-present). Mr. Lacy is a member of the Board of Trustees of The National Parks Conservation Association (2006-present). Previously, Mr. Lacy served as Chairman of the Board of Trustees of the National Parks Conservation Association (2008-2011) and as a member of the Board of Directors for the Western Union Company (global money transfer, 2006-2011). |
Ned C. Lautenbach (1944) |
Year of Election or Appointment: 2000 Trustee Chairman of the Independent Trustees |
| Mr. Lautenbach also serves as Trustee of other Fidelity funds. Mr. Lautenbach currently serves as the Lead Director of the Eaton Corporation Board of Directors (diversified industrial, 1997-present). Mr. Lautenbach is Chairman of the Board of Directors of the Philharmonic Center for the Arts in Naples, Florida (2012-present) and a member of the Council on Foreign Relations (1994-present). Previously, Mr. Lautenbach was a Partner/Advisory Partner at Clayton, Dubilier & Rice, LLC (private equity investment, 1998-2010), as well as a Director of Sony Corporation (2006-2007). |
Joseph Mauriello (1944) |
Year of Election or Appointment: 2008 Trustee |
| Mr. Mauriello also serves as Trustee of other Fidelity funds. Prior to his retirement in January 2006, Mr. Mauriello served in numerous senior management positions including Deputy Chairman and Chief Operating Officer (2004-2005), and Vice Chairman of Financial Services (2002-2004) of KPMG LLP US (professional services, 1965-2005). Mr. Mauriello currently serves as a member of the Board of Directors of XL Group plc. (global insurance and re-insurance, 2006-present). Previously, Mr. Mauriello served as a Director of the Hamilton Funds of the Bank of New York (2006-2007) and of Arcadia Resources Inc. (health care services and products, 2007-2012). |
Robert W. Selander (1950) |
Year of Election or Appointment: 2011 Trustee |
| Mr. Selander also serves as Trustee of other Fidelity funds. Previously, Mr. Selander served as a Member of the Advisory Board of other Fidelity funds (2011), and Executive Vice Chairman (2010), Chief Executive Officer (2009-2010), and President and Chief Executive Officer (1997-2009) of Mastercard, Inc. |
Cornelia M. Small (1944) |
Year of Election or Appointment: 2005 Trustee |
| Ms. Small also serves as Trustee of other Fidelity funds. Ms. Small is a member of the Board of Directors (2009-present) and Chair of the Investment Committee (2010-present) of the Teagle Foundation. Ms. Small also serves on the Investment Committee of the Berkshire Taconic Community Foundation (2008-present). Previously, Ms. Small served as Chairperson (2002-2008) and a member of the Investment Committee and Chairperson (2008-2012) and a member of the Board of Trustees of Smith College. In addition, Ms. Small served as Chief Investment Officer, Director of Global Equity Investments, and a member of the Board of Directors of Scudder, Stevens & Clark and Scudder Kemper Investments. |
William S. Stavropoulos (1939) |
Year of Election or Appointment: 2001 Trustee Vice Chairman of the Independent Trustees |
| Mr. Stavropoulos also serves as Trustee of other Fidelity funds. Mr. Stavropoulos serves as President and Founder of the Michigan Baseball Foundation, the Great Lakes Loons (2007-present). Mr. Stavropoulos is Chairman Emeritus of the Board of Directors of The Dow Chemical Company, where he previously served in numerous senior management positions, including President, CEO (1995-2000; 2002-2004), Chairman of the Executive Committee (2000-2006), and as a member of the Board of Directors (1990-2006). Currently, Mr. Stavropoulos is Chairman of the Board of Directors of Univar Inc. (global distributor of commodity and specialty chemicals), a Director of Teradata Corporation (data warehousing and technology solutions), and Maersk Inc. (industrial conglomerate), and a member of the Advisory Board for Metalmark Capital LLC (private equity investment, 2005-present). Mr. Stavropoulos is an operating advisor to Clayton, Dubilier & Rice, LLC (private equity investment). In addition, Mr. Stavropoulos is a member of the University of Notre Dame Advisory Council for the College of Science, a Trustee of the Rollin L. Gerstacker Foundation, and a Director of the Naples Philharmonic Center for the Arts. Previously, Mr. Stavropoulos served as a Director of Chemical Financial Corporation (bank holding company, 1993-2012) and Tyco International, Ltd. (multinational manufacturing and services, 2007-2012). |
David M. Thomas (1949) |
Year of Election or Appointment: 2008 Trustee |
| Mr. Thomas also serves as Trustee of other Fidelity funds. Mr. Thomas serves as Non-Executive Chairman of the Board of Directors of Fortune Brands Home and Security (home and security products, 2011-present), and as a member of the Board of Directors of Interpublic Group of Companies, Inc. (marketing communication, 2004-present). Previously, Mr. Thomas served as Executive Chairman (2005-2006) and Chairman and Chief Executive Officer (2000-2005) of IMS Health, Inc. (pharmaceutical and healthcare information solutions), and a Director of Fortune Brands, Inc. (consumer products, 2000-2011). |
+ The information above includes each Trustee's principal occupation during the last five years and other information relating to the experience, attributes, and skills relevant to each Trustee's qualifications to serve as a Trustee, which led to the conclusion that each Trustee should serve as a Trustee for the fund.
Advisory Board Member and Executive Officers:
Correspondence intended for each executive officer and Peter S. Lynch may be sent to Fidelity Investments, 245 Summer Street, Boston, Massachusetts 02210. Executive officers appear below in alphabetical order.
Name, Year of Birth; Principal Occupation |
Peter S. Lynch (1944) |
Year of Election or Appointment: 2003 Member of the Advisory Board |
| Mr. Lynch also serves as Member of the Advisory Board of other Fidelity funds. Mr. Lynch is Vice Chairman and a Director of FMR and FMR Co., Inc. In addition, Mr. Lynch serves as a Trustee of Boston College and as the Chairman of the Inner-City Scholarship Fund. Previously, Mr. Lynch served on the Special Olympics International Board of Directors (1997-2006). |
Elizabeth Paige Baumann (1968) |
Year of Election or Appointment: 2012 Anti-Money Laundering (AML) Officer |
| Ms. Baumann also serves as AML Officer of other funds. She is Chief AML Officer of FMR LLC (2012-present) and is an employee of Fidelity Investments. Previously, Ms. Baumann served as Vice President and Deputy Anti-Money Laundering Officer (2007-2012). |
William C. Coffey (1969) |
Year of Election or Appointment: 2009 Assistant Secretary |
| Mr. Coffey also serves as Assistant Secretary of other funds. He is Senior Vice President and Deputy General Counsel of FMR LLC (2010-present), and is an employee of Fidelity Investments. Previously, Mr. Coffey served as Vice President and Associate General Counsel of FMR LLC (2005-2009). |
Jonathan Davis (1968) |
Year of Election or Appointment: 2010 Assistant Treasurer |
| Mr. Davis also serves as Assistant Treasurer of other funds. Mr. Davis is an employee of Fidelity Investments. Previously, Mr. Davis served as Vice President and Associate General Counsel of FMR LLC (2003-2010). |
Adrien E. Deberghes (1967) |
Year of Election or Appointment: 2008 Deputy Treasurer |
| Mr. Deberghes also serves as an officer of other funds. He is an employee of Fidelity Investments (2008-present). Prior to joining Fidelity Investments, Mr. Deberghes was Senior Vice President of Mutual Fund Administration at State Street Corporation (2007-2008), Senior Director of Mutual Fund Administration at Investors Bank & Trust (2005-2007), and Director of Finance for Dunkin' Brands (2000-2005). |
Stephanie J. Dorsey (1969) |
Year of Election or Appointment: 2010 Assistant Treasurer |
| Ms. Dorsey also serves as an officer of other funds. She is an employee of Fidelity Investments (2008-present) and has served in other fund officer roles. Prior to joining Fidelity Investments, Ms. Dorsey served as Treasurer (2004-2008) of the JPMorgan Mutual Funds and Vice President (2004-2008) of JPMorgan Chase Bank. |
Scott C. Goebel (1968) |
Year of Election or Appointment: 2008 Secretary and Chief Legal Officer (CLO) |
| Mr. Goebel serves as Secretary and CLO of other funds. Mr. Goebel also serves as Secretary of Fidelity Investments Money Management, Inc. (FIMM) (2010-present) and Fidelity Research and Analysis Company (FRAC) (2010-present); General Counsel, Secretary, and Senior Vice President of FMR (2008-present) and FMR Co., Inc. (2008-present); Chief Legal Officer of Fidelity Management & Research (Hong Kong) Limited (2008-present) and Assistant Secretary of Fidelity Management & Research (Japan) Inc. (2008-present), and Fidelity Management & Research (U.K.) Inc. (2008-present). Previously, Mr. Goebel served as Secretary and CLO of other Fidelity funds (2008-2013), Assistant Secretary of FIMM (2008-2010), FRAC (2008-2010), and certain funds (2007-2008); and as Vice President and Secretary of Fidelity Distributors Corporation (FDC) (2005-2007). Mr. Goebel has been employed by FMR LLC or an affiliate since 2001. |
Joseph A. Hanlon (1968) |
Year of Election or Appointment: 2012 Chief Compliance Officer |
| Mr. Hanlon also serves as Chief Compliance Officer of other funds. Mr. Hanlon serves as Compliance Officer of FMR, FMR Co., Inc., Fidelity Investments Money Management, Inc. (FIMM), Fidelity Research and Analysis Company (FRAC), and Fidelity Management & Research (Hong Kong) (2009-present), as Senior Vice President of the Fidelity Asset Management Division (2009-present), and is an employee of Fidelity Investments. Previously, Mr. Hanlon served as Compliance Officer of Fidelity Management & Research (Japan) Inc. (2009-2013), Strategic Advisers, Inc. (2009-2013), and Fidelity Management & Research (U.K.) Inc. (2009-2013). |
Bruce T. Herring (1965) |
Year of Election or Appointment: 2006 Vice President of certain Equity Funds |
| Mr. Herring also serves as Vice President of other funds. He serves as Chief Investment Officer of Fidelity Global Asset Allocation (GAA) (2013-present), Chief Investment Officer and Director of Fidelity Management & Research (U.K.) Inc. (2010-present), Group Chief Investment Officer of FMR, and President of Fidelity Research & Analysis Company (2010-present). Previously, Mr. Herring served as Vice President (2005-2006) and Senior Vice President (2006-2007) of Fidelity Management & Research Company, Vice President of FMR Co., Inc. (2001-2007), and as a portfolio manager for Fidelity U.S. Equity Funds. |
Brian B. Hogan (1964) |
Year of Election or Appointment: 2009 Vice President |
| Mr. Hogan also serves as Vice President of other funds. Mr. Hogan serves as President of FMR's Equity Division (2009-present). Previously, Mr. Hogan served as Senior Vice President, Equity Research of FMR (2006-2009) and as a portfolio manager. |
Chris Maher (1972) |
Year of Election or Appointment: 2013 Assistant Treasurer |
| Mr. Maher serves as Assistant Treasurer of other funds. Mr. Maher is Vice President of Valuation Oversight and is an employee of Fidelity Investments. Previously, Mr. Maher served as Vice President of Asset Management Compliance (2013), Vice President of FMR's Program Management Group (2010-2013), and Vice President of Valuation Oversight (2008-2010). |
Christine Reynolds (1958) |
Year of Election or Appointment: 2008 Chief Financial Officer |
| Ms. Reynolds also serves as Chief Financial Officer of other funds. Ms. Reynolds became President of Fidelity Pricing and Cash Management Services (FPCMS) in August 2008. Ms. Reynolds served as Chief Operating Officer of FPCMS (2007-2008). Previously, Ms. Reynolds served as President, Treasurer, and Anti-Money Laundering officer of the Fidelity funds (2004-2007). |
Kenneth B. Robins (1969) |
Year of Election or Appointment: 2008 President and Treasurer |
| Mr. Robins also serves as an officer of other funds. Mr. Robins serves as Executive Vice President of Fidelity Investments Money Management, Inc. (FIMM) (2013-present) and is an employee of Fidelity Investments (2004-present). Previously, Mr. Robins served in other fund officer roles. |
Gary W. Ryan (1958) |
Year of Election or Appointment: 2005 Assistant Treasurer |
| Mr. Ryan also serves as Assistant Treasurer of other funds. Mr. Ryan is an employee of Fidelity Investments and has served in other fund officer roles. Previously, Mr. Ryan served as Vice President of Fund Reporting in Fidelity Pricing and Cash Management Services (FPCMS) (1999-2005). |
Stephen Sadoski (1971) |
Year of Election or Appointment: 2012 Deputy Treasurer |
| Mr. Sadoski also serves as Deputy Treasurer of other funds. He is an employee of Fidelity Investments (2012-present) and has served in another fund officer role. Prior to joining Fidelity Investments, Mr. Sadoski served as an assistant chief accountant in the Division of Investment Management of the Securities and Exchange Commission (SEC) (2009-2012) and as a senior manager at Deloitte & Touche LLP (1997-2009). |
Stacie M. Smith (1974) |
Year of Election or Appointment: 2013 Deputy Treasurer |
| Ms. Smith also serves as an officer of other funds. She is an employee of Fidelity Investments (2009-present) and has served in other fund officer roles. Prior to joining Fidelity Investments, Ms. Smith served as Senior Audit Manager of Ernst & Young LLP (1996-2009). |
Renee Stagnone (1975) |
Year of Election or Appointment: 2013 Deputy Treasurer |
| Ms. Stagnone also serves as Deputy Treasurer of other funds. Ms. Stagnone is an employee of Fidelity Investments. |
Joseph F. Zambello (1957) |
Year of Election or Appointment: 2011 Deputy Treasurer |
| Mr. Zambello also serves as Deputy Treasurer of other funds. Mr. Zambello is an employee of Fidelity Investments. Previously, Mr. Zambello served as Vice President of FMR's Program Management Group (2009-2011) and Vice President of the Transfer Agent Oversight Group (2005-2009). |
Annual Report
The Board of Trustees of Advisor International Small Cap Fund voted to pay to shareholders of record at the opening of business on record date, the following distributions per share derived from capital gains realized from sales of portfolio securities, and dividends derived from net investment income:
| Pay Date | Record Date | Dividends | Capital Gains |
Class A | 12/09/13 | 12/06/13 | $0.051 | $0.597 |
| | | | |
Class T | 12/09/13 | 12/06/13 | $0.000 | $0.597 |
| | | | |
Class B | 12/09/13 | 12/06/13 | $0.000 | $0.469 |
| | | | |
Class C | 12/09/13 | 12/06/13 | $0.000 | $0.552 |
Class A designates 61%, Class T designates 75%, Class B designates 100%, and Class C designates 100% of the dividends distributed during the fiscal year as amounts which may be taken into account as a dividend for purposes of the maximum rate under section 1(h)(11) of the Internal Revenue Code.
The amounts per share which represent income derived from sources within, and taxes paid to, foreign countries or possessions of the United States are as follows:
| Pay Date | Income | Taxes |
Class A | 12/10/12 | $0.2150 | $0.0142 |
| | | |
Class T | 12/10/12 | $0.1730 | $0.0142 |
| | | |
Class B | 12/10/12 | $0.0480 | $0.0142 |
| | | |
Class C | 12/10/12 | $0.1000 | $0.0142 |
The fund will notify shareholders in January 2014 of amounts for use in preparing 2013 income tax returns.
Annual Report
Board Approval of Investment Advisory Contracts and Management Fees
Fidelity International Small Cap Fund
Each year, the Board of Trustees, including the Independent Trustees (together, the Board), votes on the renewal of the management contract and sub-advisory agreements (together, the Advisory Contracts) for the fund. The Board, assisted by the advice of fund counsel and Independent Trustees' counsel, requests and considers a broad range of information relevant to the renewal of the Advisory Contracts throughout the year.
The Board meets regularly and, at each of its meetings, covers an extensive agenda of topics and materials and considers factors that are relevant to its annual consideration of the renewal of the fund's Advisory Contracts, including the services and support provided to the fund and its shareholders. The Board has established various standing committees, each composed of and chaired by Independent Trustees with varying backgrounds, to which the Board has assigned specific subject matter responsibilities in order to enhance effective decision-making by the Board. The Board, acting directly and through its Committees, requests and receives information concerning the annual consideration of the renewal of the fund's Advisory Contracts. The Board also meets as needed to consider matters specifically related to the Board's annual consideration of the renewal of Advisory Contracts. Members of the Board may also meet with trustees of other Fidelity funds through ad hoc joint committees to discuss certain matters relevant to the Fidelity funds.
At its July 2013 meeting, the Board, including the Independent Trustees, unanimously determined to renew the fund's Advisory Contracts. In reaching its determination, the Board considered all factors it believed relevant, including (i) the nature, extent, and quality of the services to be provided to the fund and its shareholders (including the investment performance of the fund); (ii) the competitiveness of the fund's management fee and total expense ratio relative to peer funds; (iii) the total costs of the services to be provided by and the profits to be realized by Fidelity from its relationship with the fund; (iv) the extent to which economies of scale exist and would be realized as the fund grows; and (v) whether fee levels reflect these economies of scale, if any, for the benefit of fund shareholders.
In considering whether to renew the Advisory Contracts for the fund, the Board reached a determination, with the assistance of fund counsel and Independent Trustees' counsel and through the exercise of its business judgment, that the renewal of the Advisory Contracts was in the best interests of the fund and its shareholders and that the compensation payable under the Advisory Contracts was fair and reasonable. The Board's decision to renew the Advisory Contracts was not based on any single factor, but rather was based on a comprehensive consideration of all the information provided to the Board at its meetings throughout the year. The Board, in reaching its determination to renew the Advisory Contracts, was aware that shareholders in the fund have a broad range of investment choices available to them, including a wide choice among mutual funds offered by Fidelity's competitors, and that the fund's shareholders, who have the opportunity to review and weigh the disclosure provided by the fund in its prospectus and other public disclosures, have chosen to invest in this fund, which is a part of the Fidelity family of funds.
Annual Report
Board Approval of Investment Advisory Contracts and
Management Fees - continued
Nature, Extent, and Quality of Services Provided. The Board considered the staffing within the investment adviser, Fidelity Management & Research Company (FMR), and the sub-advisers (together, the Investment Advisers) as it relates to the fund, including the backgrounds of the fund's investment personnel, and also considered the fund's investment objective, strategies, and related investment philosophy. The Independent Trustees also had discussions with senior management of Fidelity's investment operations and investment groups. The Board considered the structure of the portfolio manager compensation program and whether this structure provides appropriate incentives to act in the best interests of the fund.
Resources Dedicated to Investment Management and Support Services. The Board and the Fund Oversight and Research Committees reviewed the general qualifications and capabilities of the Investment Advisers' investment staff, including its size, education, experience, and resources, as well as the Investment Advisers' approach to recruiting, training, managing, and compensating investment personnel. The Board noted that FMR has continued to increase the resources devoted to non-U.S. offices, including expansion of Fidelity's global investment organization. The Board also noted that Fidelity's analysts have extensive resources, tools and capabilities that allow them to conduct sophisticated quantitative and fundamental analysis, as well as credit analysis of issuers, counterparties and guarantors. Further, the Board believes that Fidelity's investment professionals have sufficient access to global information and data so as to provide competitive investment results over time, and that those professionals also have access to sophisticated tools that permit them to assess portfolio construction and risk and performance attribution characteristics continuously, as well as to transmit new information and research conclusions rapidly around the world. Additionally, in its deliberations, the Board considered the Investment Advisers' trading and risk management capabilities and resources, which are an integral part of the investment management process.
Shareholder and Administrative Services. The Board considered (i) the nature, extent, quality, and cost of advisory, administrative, and shareholder services performed by the Investment Advisers and their affiliates under the Advisory Contracts and under separate agreements covering transfer agency, pricing and bookkeeping, and securities lending services for the fund; (ii) the nature and extent of the supervision of third party service providers, principally custodians and subcustodians; and (iii) the resources devoted to, and the record of compliance with, the fund's compliance policies and procedures. The Board also reviewed the allocation of fund brokerage, including allocations to brokers affiliated with the Investment Advisers, the use of brokerage commissions to pay fund expenses, and the use of "soft" commission dollars to pay for research services.
Annual Report
The Board noted that the growth of fund assets over time across the complex allows Fidelity to reinvest in the development of services designed to enhance the value or convenience of the Fidelity funds as investment vehicles. These services include 24-hour access to account information and market information through telephone representatives and over the Internet, investor education materials and asset allocation tools, and the expanded availability of Fidelity Investor Centers.
Investment in a Large Fund Family. The Board considered the benefits to shareholders of investing in a Fidelity fund, including the benefits of investing in a fund that is part of a large family of funds offering a variety of investment disciplines and providing a large variety of mutual fund investor services. The Board noted that Fidelity had taken, or had made recommendations that resulted in the Fidelity funds taking, a number of actions over the previous year that benefited particular funds, including (i) continuing to dedicate additional resources to investment research and to the support of the senior management team that oversees asset management; (ii) persisting in efforts to enhance Fidelity's global research capabilities; (iii) launching new funds and making other enhancements to meet client needs for global and income-oriented solutions; (iv) continuing to launch dedicated lower cost underlying funds to meet portfolio construction needs related to expanding underlying fund options for Fidelity funds of funds, specifically for the Freedom Fund product lines; (v) rationalizing product lines and gaining increased efficiencies through the mergers of several funds into other funds; (vi) strengthening Fidelity's index fund offerings by reducing investment minimums and adopting or lowering existing expense caps for certain funds and classes; (vii) enhancing Global Asset Allocation product offerings by launching new funds and strategies, including "open architecture" target date funds that utilize affiliated and unaffiliated sub-advisers; (viii) modifying the eligibility criteria for Institutional Class shares of Advisor funds to increase their marketability to a portion of the defined contribution plan market; (ix) creating a new low-cost retirement share class for certain Advisor funds to appeal to large retirement plans; (x) transitioning the management of certain Fidelity commodity funds to Geode Capital Management LLC, a registered commodity pool operator, while retaining administrative responsibilities for the funds; (xi) reorganizing a number of funds; and (xii) taking steps toward establishing a new Fidelity adviser to manage sector-based funds and products.
Investment Performance. The Board considered whether the fund has operated in accordance with its investment objective, as well as its record of compliance with its investment restrictions and its performance history.
The Board took into account discussions with the Investment Advisers about fund investment performance that occur at Board meetings throughout the year. In this regard the Board noted that as part of regularly scheduled fund reviews and other reports to the Board on fund performance, the Board periodically considers annualized return information for the fund, for different time periods, measured against a securities market index ("benchmark index") and a peer group of mutual funds with similar objectives ("peer group"). In its evaluation of fund investment performance, the Board gave particular attention to information indicating changes in performance of certain Fidelity funds for specific time periods and the Investment Advisers' explanations for any overperformance or underperformance.
Annual Report
Board Approval of Investment Advisory Contracts and
Management Fees - continued
In addition to reviewing absolute and relative fund performance, the Independent Trustees periodically consider the appropriateness of fund performance metrics in evaluating the results achieved. In general, the Independent Trustees believe that fund performance should be evaluated based on net performance (after fees and expenses) of both the highest performing and lowest performing classes, where applicable, compared to appropriate benchmark indices, over appropriate time periods which may include full market cycles, and compared to peer groups, as applicable, over the same periods, taking into account relevant factors including the following: general market conditions; issuer-specific information; tactical opportunities for investment; and fund cash flows and other factors.
The Independent Trustees recognize that shareholders evaluate performance on a net basis over their own holding periods, for which one-, three-, and five-year periods are used as a proxy. For this reason, the performance information reviewed by the Board also included net cumulative calendar year total return information for the fund and an appropriate benchmark index and peer group for the most recent one-, three-, and five-year periods, as shown below. Returns are shown compared to the 25th percentile (top of box) and 75th percentile (bottom of box) of the peer universe. Returns of the benchmark index are "net MA," i.e., adjusted for tax withholding rates applicable to U.S.-based mutual funds organized as Massachusetts business trusts.
Annual Report
Fidelity International Small Cap Fund

The Board also considered that the fund's management fee is subject to upward or downward adjustment depending upon whether, and to what extent, the fund's investment performance for the performance period exceeds, or is exceeded by, a securities index, thus leading to a performance adjustment for the same period. The Board noted that the performance adjustment provides FMR with a strong economic incentive to seek to achieve superior performance for the fund's shareholders and helps to more closely align the interests of FMR and the fund's shareholders.
Based on its review, the Board concluded that the nature, extent, and quality of services provided to the fund under the Advisory Contracts should benefit the fund's shareholders.
Competitiveness of Management Fee and Total Expense Ratio. The Board considered the fund's management fee and total expense ratio compared to "mapped groups" of competitive funds and classes. Fidelity creates "mapped groups" by combining similar Lipper investment objective categories that have comparable management fee characteristics. Combining Lipper investment objective categories aids the Board's management fee and total expense ratio comparisons by broadening the competitive group used for comparison and by reducing the number of universes to which various Fidelity funds are compared.
Management Fee. The Board considered two proprietary management fee comparisons for the 12-month periods shown in the chart below. The group of Lipper funds used by the Board for management fee comparisons is referred to below as the "Total Mapped Group." The Total Mapped Group is broader than the Lipper peer group used by the Board for performance comparisons because the Total Mapped Group combines several Lipper investment objective categories while the Lipper peer group does not. The Total Mapped Group comparison focuses on a fund's standing in terms of gross management fees before expense reimbursements or caps, and without giving effect to the fund's performance adjustment, relative to the total universe of funds with comparable investment mandates, regardless of whether their management fee structures also are comparable. Funds with comparable investment mandates offer exposure to similar types of securities. Funds with comparable management fee structures have similar management fee contractual arrangements (e.g., flat rate charged for advisory services, all-inclusive fee rate, etc.). "TMG %" represents the percentage of funds in the Total Mapped Group that had management fees that were lower than the fund's. For example, a TMG % of 19% means that 81% of the funds in the Total Mapped Group had higher management fees than the fund. The "Asset-Size Peer Group" (ASPG) comparison focuses on a fund's standing relative to a subset of non-Fidelity funds within the Total Mapped Group that are similar in size and management fee structure. The ASPG represents at least 15% of the funds in the Total Mapped Group with comparable asset size and management fee structures, subject to a minimum of 50 funds (or all funds in the Total Mapped Group if fewer than 50). Additional information, such as the ASPG quartile in which the fund's management fee ranked and the impact of the fund's performance adjustment, is also included in the chart and considered by the Board.
Annual Report
Board Approval of Investment Advisory Contracts and
Management Fees - continued
Fidelity International Small Cap Fund
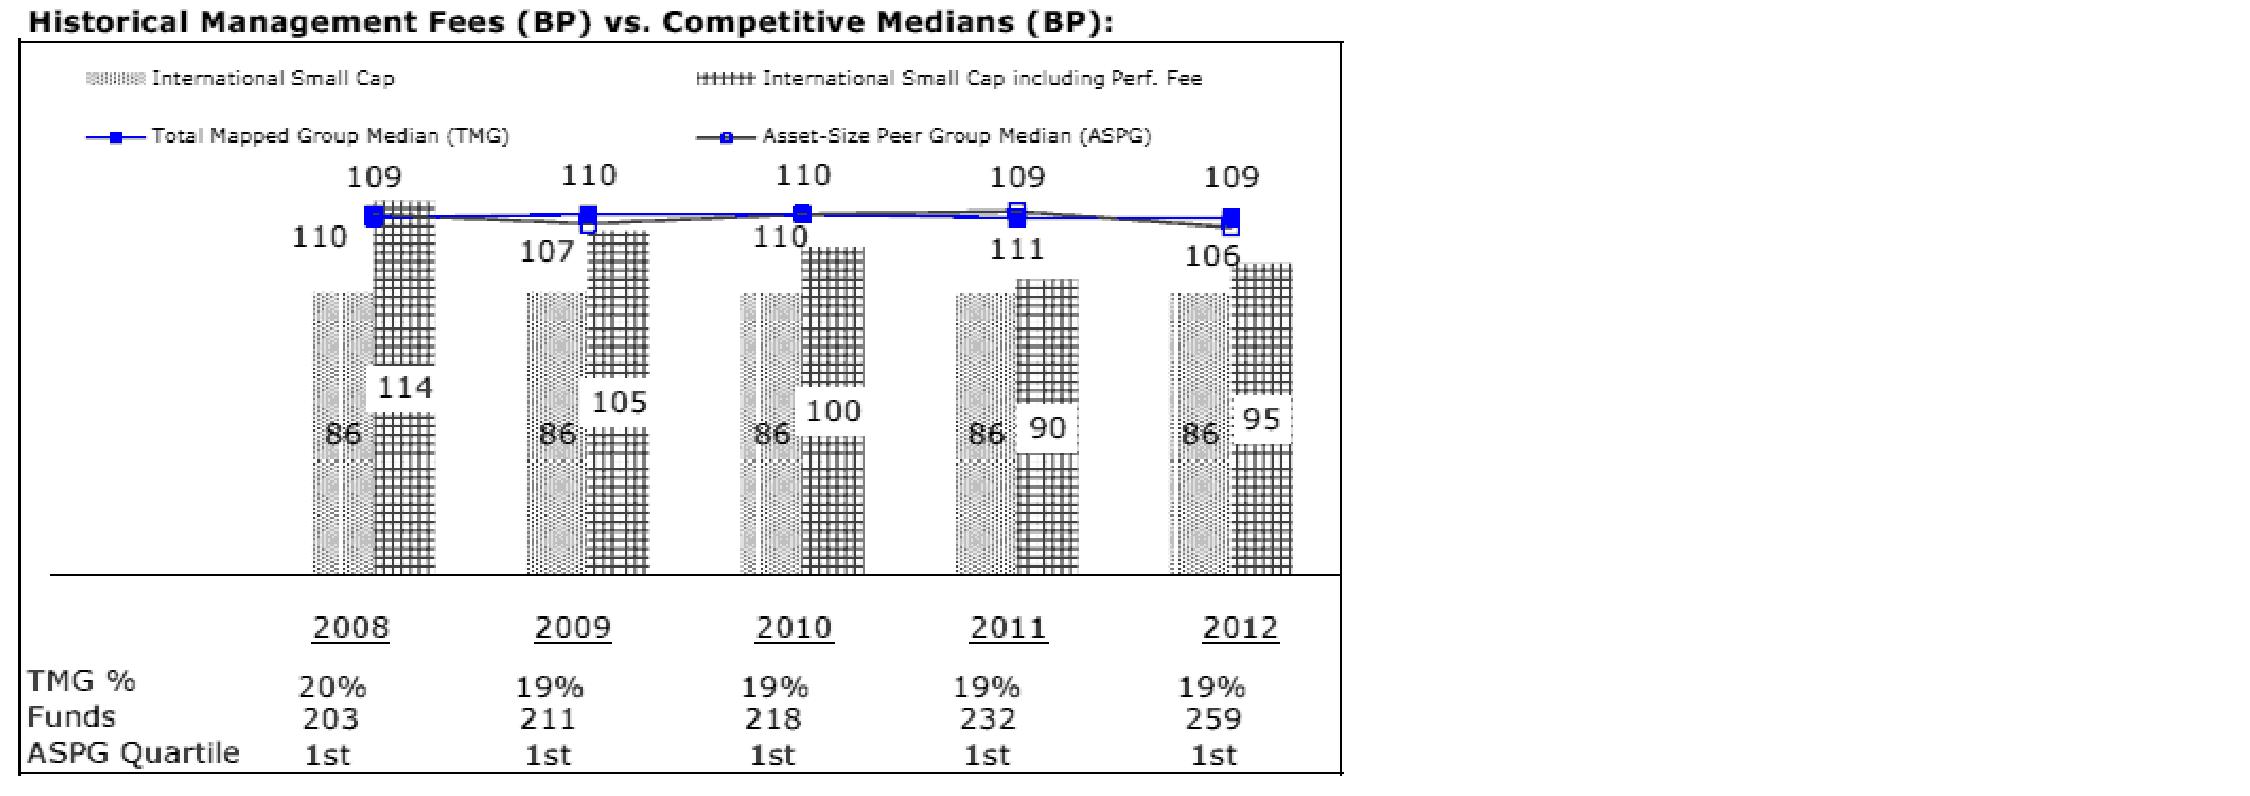
The Board noted that the fund's management fee ranked below the median of its Total Mapped Group and below the median of its ASPG for 2012. The Board also noted the effect of the fund's positive performance adjustment on the fund's management fee ranking.
Annual Report
Based on its review, the Board concluded that the fund's management fee is fair and reasonable in light of the services that the fund receives and the other factors considered.
Total Expense Ratio. In its review of each class's total expense ratio, the Board considered the fund's management fee as well as other fund or class expenses, as applicable, such as transfer agent fees, pricing and bookkeeping fees, fund-paid 12b-1 fees, and custodial, legal, and audit fees. The Board also noted the effects of any waivers and reimbursements on fees and expenses, as well as the impact of the fund's performance adjustment. As part of its review, the Board also considered the current and historical total expense ratios of each class of the fund compared to competitive fund median expenses. Each class of the fund is compared to those funds and classes in the Total Mapped Group (used by the Board for management fee comparisons) that have a similar sales load structure.
The Board noted that the total expense ratio of each of Class A, Class C, Institutional Class, and the retail class ranked below its competitive median for 2012, the total expense ratio of Class B ranked equal to its competitive median for 2012, and the total expense ratio of Class T ranked above its competitive median for 2012. The Board considered that, in general, various factors can affect total expense ratios. The Board noted that the total expense ratio of Class T was above the competitive median primarily because of higher 12b-1 fees on Class T. Class T has a higher 12b-1 fee, but a lower front-end sales charge, than traditionally priced front-end sales charge classes. The Board considered that Class T is primarily sold load-waived in the retirement plan market where its 0.50% 12b-1 fee is comparable to competing no-load, higher 12b-1 fee classes designed specifically for retirement plans. The Board noted that the fund offers multiple classes, each of which has a different sales load and 12b-1 fee structure, and that the multiple structures are intended to offer a range of pricing options for the intermediary market. The Board also noted that the total expense ratios of the classes vary primarily by the level of their 12b-1 fees, although differences in transfer agent fees may also cause expenses to vary from class to class.
Fees Charged to Other Fidelity Clients. The Board also considered Fidelity fee structures and other information with respect to clients of FMR and its affiliates, such as other mutual funds advised or subadvised by FMR or its affiliates, pension plan clients, and other institutional clients. The Board noted the findings of the 2013 ad hoc joint committee (created with the board of other Fidelity funds), which reviewed and compared Fidelity's institutional investment advisory business with its business of providing services to the Fidelity funds, including the differences in services provided, fees charged, and costs incurred, as well as competition in their respective marketplaces.
Annual Report
Board Approval of Investment Advisory Contracts and
Management Fees - continued
Based on its review of total expense ratios and fees charged to other Fidelity clients, the Board concluded that the total expense ratio of each class of the fund was reasonable, although Class T was above the median of the universe presented for comparison, in light of the services that the fund and its shareholders receive and the other factors considered.
Costs of the Services and Profitability. The Board considered the revenues earned and the expenses incurred by Fidelity in conducting the business of developing, marketing, distributing, managing, administering and servicing the fund and servicing the fund's shareholders. The Board also considered the level of Fidelity's profits in respect of all the Fidelity funds.
On an annual basis, FMR presents to the Board Fidelity's profitability for the fund. Fidelity calculates the profitability for each fund, as well as aggregate profitability for groups of Fidelity funds and all Fidelity funds, using a series of detailed revenue and cost allocation methodologies which originate with the books and records of Fidelity on which Fidelity's audited financial statements are based. The Audit Committee of the Board reviews any significant changes from the prior year's methodologies.
PricewaterhouseCoopers LLP (PwC), independent registered public accounting firm and auditor to Fidelity and certain Fidelity funds, has been engaged annually by the Board as part of the Board's assessment of Fidelity's profitability analysis. PwC's engagement includes the review and assessment of the methodologies used by Fidelity in determining the revenues and expenses attributable to Fidelity's mutual fund business, and completion of agreed-upon procedures surrounding the mathematical accuracy of fund profitability and its conformity to allocation methodologies. After considering PwC's reports issued under the engagement and information provided by Fidelity, the Board concluded that while other allocation methods may also be reasonable, Fidelity's profitability methodologies are reasonable in all material respects.
The Board also reviewed Fidelity's non-fund businesses and fall-out benefits related to the mutual fund business as well as cases where Fidelity's affiliates may benefit from or be related to the fund's business.
The Board considered the costs of the services provided by and the profits realized by Fidelity in connection with the operation of the fund and was satisfied that the profitability was not excessive in the circumstances.
Economies of Scale. The Board considered whether there have been economies of scale in respect of the management of the Fidelity funds, whether the Fidelity funds (including the fund) have appropriately benefited from any such economies of scale, and whether there is potential for realization of any further economies of scale. The Board considered the extent to which the fund will benefit from economies of scale through increased services to the fund, through waivers or reimbursements, or through fee or expense reductions. The Board also noted that in 2009, it and the board of other Fidelity funds created an ad hoc committee (the Economies of Scale Committee) to analyze whether FMR attains economies of scale in respect of the management and servicing of the Fidelity funds, whether the Fidelity funds have appropriately benefited from such economies of scale, and whether there is potential for realization of any further economies of scale.
Annual Report
The Board recognized that the fund's management contract incorporates a "group fee" structure, which provides for lower group fee rates as total fund assets under FMR's management increase, and for higher group fee rates as total fund assets under FMR's management decrease. FMR calculates the group fee rates based on a tiered asset "breakpoint" schedule that varies based on asset class. The Board considered that the group fee is designed to deliver the benefits of economies of scale to fund shareholders when total Fidelity fund assets increase, even if assets of any particular fund are unchanged or have declined, because some portion of Fidelity's costs are attributable to services provided to all Fidelity funds, and all funds benefit if those costs can be allocated among more assets. The Board concluded that, given the group fee structure, fund shareholders will benefit from lower management fees as assets under FMR's management increase at the fund complex level, regardless of whether Fidelity achieves any such economies of scale.
The Board concluded, taking into account the analysis of the Economies of Scale Committee, that economies of scale, if any, are being appropriately shared between fund shareholders and Fidelity.
Amendment to Description of Group Fee Rate. At its July 2013 meeting, the Board voted to approve an amendment to the fund's management contract to modify the description of the "group fee rate" effective August 1, 2013. The Board noted that under the prior description in the contract, the group fee rate was based on the average net assets of all registered investment companies with which FMR has management contracts. Under the contract's tiered asset breakpoint schedule, the group fee rate is lower as total fund assets under FMR's management increase, and higher as total fund assets under FMR's management decrease. The Board considered that the prior description would have excluded the assets of 64 Fidelity sector funds from the group fee rate calculation once Fidelity SelectCo, LLC, an affiliate of FMR, assumed management responsibilities for those funds. The Board noted that modifying the description of the group fee rate to continue to include the assets of those 64 funds for purposes of determining group fee rate breakpoints would avoid an immediate adverse impact on the group fee rate for any fund.
Additional Information Requested by the Board. In order to develop fully the factual basis for consideration of the Fidelity funds' Advisory Contracts, the Board requested and received additional information on certain topics, including: (i) fund performance trends and Fidelity's long-term strategies for certain funds; (ii) the potential to further rationalize the Fidelity fund lineup with the possibility of achieving savings for the funds and Fidelity; (iii) the methodology with respect to competitive fund data and peer group classifications; (iv) the arrangements with, and performance of, certain sub-advisers on behalf of the Fidelity funds, as well as certain proposed participating affiliate arrangements; (v) the realization of fall-out benefits in certain Fidelity business units; (vi) Fidelity's group fee structures, including the rationale for the individual fee rates of certain categories of funds and the definition of group assets; (vii) trends regarding industry use of performance fee structures and the performance adjustment methodologies applicable to the Fidelity funds; (viii) additional competitive analysis regarding the total expenses for certain classes; and (ix) fund profitability methodology, including Fidelity's cost allocation methodology, and the impact of certain factors on fund profitability results.
Annual Report
Board Approval of Investment Advisory Contracts and
Management Fees - continued
Based on its evaluation of all of the conclusions noted above, and after considering all factors it believed relevant, the Board ultimately concluded that the advisory fee structures are fair and reasonable, and that the fund's Advisory Contracts should be renewed.
Annual Report
Investment Adviser
Fidelity Management & Research Company
Boston, MA
Investment Sub-Advisers
FMR Co., Inc.
Fidelity Management & Research
(U.K.) Inc.
Fidelity Management & Research
(Hong Kong) Limited
Fidelity Management & Research
(Japan) Inc.
FIL Investment Advisors
FIL Investments (Japan) Limited
FIL Investment Advisors (UK) Limited
General Distributor
Fidelity Distributors Corporation
Smithfield, RI
Transfer and Service Agents
Fidelity Investments Institutional Operations Company, Inc.
Boston, MA
Fidelity Service Company, Inc.
Boston, MA
Custodian
The Bank of New York Mellon
New York, NY
(Fidelity Investment logo)(registered trademark)
AISC-UANN-1213
1.793568.110
(Fidelity Investment logo)(registered trademark)
Fidelity Advisor®
International Small Cap
Fund - Institutional Class
Annual Report
October 31, 2013
(Fidelity Cover Art)
Institutional Class is a class of
Fidelity® International Small Cap Fund
Contents
Performance | 2 | How the fund has done over time. |
Management's Discussion of Fund Performance | 3 | The Portfolio Managers' review of fund performance and strategy. |
Shareholder Expense Example | 3 | An example of shareholder expenses. |
Investment Changes | 4 | A summary of major shifts in the fund's investments over the past six months. |
Investments | 6 | A complete list of the fund's investments with their market values. |
Financial Statements | 20 | Statements of assets and liabilities, operations, and changes in net assets, as well as financial highlights. |
Notes | 30 | Notes to financial statements. |
Report of Independent Registered Public Accounting Firm | 42 | |
Trustees and Officers | 42 | |
Distributions | 49 | |
Board Approval of Investment Advisory Contracts and Management Fees | 49 | |
To view a fund's proxy voting guidelines and proxy voting record for the 12-month period ended June 30, visit http://www.fidelity.com/proxyvotingresults or visit the Securities and Exchange Commission's (SEC) web site at http://www.sec.gov. You may also call 1-877-208-0098 to request a free copy of the proxy voting guidelines.
Standard & Poor's, S&P and S&P 500 are registered service marks of The McGraw-Hill Companies, Inc. and have been licensed for use by Fidelity Distributors Corporation.
Other third-party marks appearing herein are the property of their respective owners.
All other marks appearing herein are registered or unregistered trademarks or service marks of FMR LLC or an affiliated company. © 2013 FMR LLC. All rights reserved.
Annual Report
This report and the financial statements contained herein are submitted for the general information of the shareholders of the fund. This report is not authorized for distribution to prospective investors in the fund unless preceded or accompanied by an effective prospectus.
A fund files its complete schedule of portfolio holdings with the SEC for the first and third quarters of each fiscal year on Form N-Q. Forms N-Q are available on the SEC's web site at http://www.sec.gov. A fund's Forms N-Q may be reviewed and copied at the SEC's Public Reference Room in Washington, DC. Information regarding the operation of the SEC's Public Reference Room may be obtained by calling 1-800-SEC-0330. For a complete list of a fund's portfolio holdings, view the most recent holdings listing, semiannual report, or annual report on Fidelity's web site at http://www.fidelity.com, http://www.advisor.fidelity.com, or http://www.401k.com, as applicable.
NOT FDIC INSURED • MAY LOSE VALUE • NO BANK GUARANTEE
Neither the fund nor Fidelity Distributors Corporation is a bank.
Annual Report
Performance: The Bottom Line
Average annual total return reflects the change in the value of an investment, assuming reinvestment of the class' distributions from dividend income and capital gains (the profits earned upon the sale of securities that have grown in value, if any) and assuming a constant rate of performance each year. The $10,000 table and the fund's returns do not reflect the deduction of taxes that a shareholder would pay on fund distributions or the redemption of fund shares. During periods of reimbursement by Fidelity, a fund's total return will be greater than it would be had the reimbursement not occurred. How a fund did yesterday is no guarantee of how it will do tomorrow.
Average Annual Total Returns
Periods ended October 31, 2013 | Past 1
year | Past 5
years | Past 10
years |
Institutional Class | 36.68% | 19.88% | 11.61% |
$10,000 Over 10 Years
Let's say hypothetically that $10,000 was invested in Fidelity Advisor® International Small Cap Fund - Institutional Class on October 31, 2003. The chart shows how the value of your investment would have changed, and also shows how the MSCI® EAFE® Small Cap Index performed over the same period.
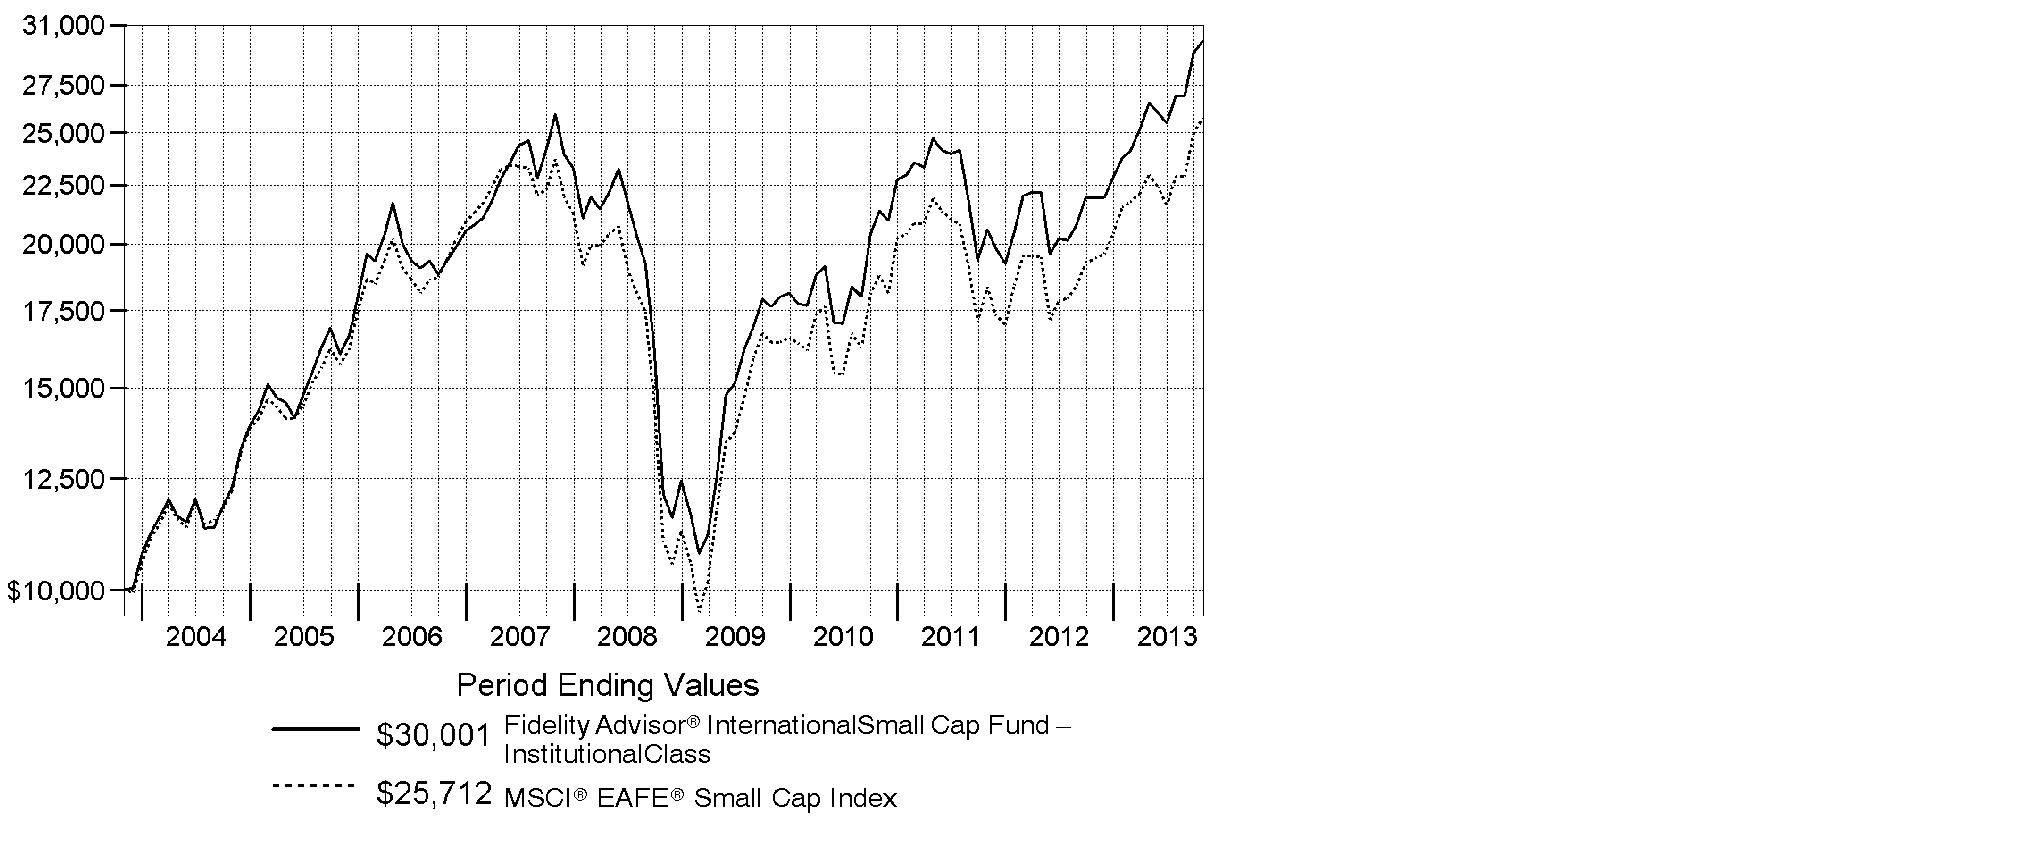
Annual Report
Management's Discussion of Fund Performance
Market Recap: On balance, global equity markets remained upbeat for the 12-month period ending October 31, 2013. The MSCI® ACWI® (All Country World Index) Index gained 23.75% for the period, amid investor preference for higher-risk assets. The period was not without turbulence, however. In the spring and summer, central banks worldwide, especially in the U.S. and China, made clear their intentions to maintain accommodative monetary policies. That stance, combined with modest cyclical improvements around the globe and generally low valuations, underpinned the broad rally in equities. Europe (+32%) shone brightly, with most markets in the region - large and small - registering solid, index-beating gains. Another bright spot was Japan, which, despite a struggling yen and taking a second-half breather, posted a 34% result for the full year. The U.S. - by far the index's biggest constituent - also outperformed the global market with a roughly 28% advance. Meanwhile, Asia-Pacific ex Japan (+14%) lagged, hurt in part by a slowdown in Australia's mining industry as well as currency headwinds. Foreign-exchange and commodity weakness also curbed results in resource-heavy Canada and emerging markets (EM), both of which were up 7%. Country-level EM performance diverged meaningfully for the period, as evidenced by performance in Brazil (-1%), Russia (+12%), India (+1%) and China (+8%).
Comments from Colin Stone, Dale Nicholls and Nicholas Price, Co-Portfolio Managers of Fidelity Advisor® International Small Cap Fund: For the year, the fund's Institutional Class shares returned 36.68%, surpassing the 32.33% gain of the MSCI® EAFE® Small Cap Index. The Japanese and Asia-Pacific ex Japan subportfolios outperformed their respective benchmarks by substantial margins, but the emerging Europe/Middle East/Africa (EMEA) sleeve trailed its benchmark, weighed down by security selection in materials and energy. Versus the index, a non-index stake in Dublin-based mineral sands miner Kenmare Resources detracted from the EMEA subportfolio's results, while one key contributor was U.K. online-only food retailer Ocado Group. In the Asia-Pacific ex Japan subportfolio, one positive was Sino Gas & Energy Holdings, an Australian exploration and production firm developing gas assets in China. On the negative side, relative performance suffered from not owning high-flying casino stock and Hong Kong benchmark component Melco International Development. In the Japanese subportfolio, our results were lifted by Pigeon, Japan's leading manufacturer of baby-care products. A non-index position in video game developer Nintendo worked against us, and I sold it in the first quarter of 2013.
The views expressed above reflect those of the portfolio manager(s) only through the end of the period as stated on the cover of this report and do not necessarily represent the views of Fidelity or any other person in the Fidelity organization. Any such views are subject to change at any time based upon market or other conditions and Fidelity disclaims any responsibility to update such views. These views may not be relied on as investment advice and, because investment decisions for a Fidelity fund are based on numerous factors, may not be relied on as an indication of trading intent on behalf of any Fidelity fund.
Annual Report
Shareholder Expense Example
As a shareholder of the Fund, you incur two types of costs: (1) transaction costs, including sales charges (loads) on purchase payments or redemption proceeds, redemption fees and (2) ongoing costs, including management fees, distribution and/or service (12b-1) fees and other Fund expenses. This Example is intended to help you understand your ongoing costs (in dollars) of investing in the Fund and to compare these costs with the ongoing costs of investing in other mutual funds.
The Example is based on an investment of $1,000 invested at the beginning of the period and held for the entire period (May 1, 2013 to October 31, 2013).
Actual Expenses
The first line of the accompanying table for each class of the Fund provides information about actual account values and actual expenses. You may use the information in this line, together with the amount you invested, to estimate the expenses that you paid over the period. Simply divide your account value by $1,000.00 (for example, an $8,600 account value divided by $1,000.00 = 8.6), then multiply the result by the number in the first line for a class of the Fund under the heading entitled "Expenses Paid During Period" to estimate the expenses you paid on your account during this period. A small balance maintenance fee of $12.00 that is charged once a year may apply for certain accounts with a value of less than $2,000. This fee is not included in the table below. If it was, the estimate of expenses you paid during the period would be higher, and your ending account value lower, by this amount. In addition, the Fund, as a shareholder in the underlying Fidelity Central Funds, will indirectly bear its pro-rata share of the fees and expenses incurred by the underlying Fidelity Central Funds. These fees and expenses are not included in the Fund's annualized expense ratio used to calculate the expense estimate in the table below.
Hypothetical Example for Comparison Purposes
The second line of the accompanying table for each class of the Fund provides information about hypothetical account values and hypothetical expenses based on a Class' actual expense ratio and an assumed rate of return of 5% per year before expenses, which is not the Class' actual return. The hypothetical account values and expenses may not be used to estimate the actual ending account balance or expenses you paid for the period. You may use this information to compare the ongoing costs of investing in the Fund and other funds. To do so, compare this 5% hypothetical example with the 5% hypothetical examples that appear in the shareholder reports of the other funds. A small balance maintenance fee of $12.00 that is charged once a year may apply for certain accounts with a value of less than $2,000. This fee is not included in the table below. If it was, the estimate of expenses you paid during the period would be higher, and your ending account value lower, by this amount. In addition, the Fund, as a shareholder in the underlying Fidelity Central Funds, will indirectly bear its pro-rata share of the fees and expenses incurred by the underlying Fidelity Central Funds. These fees and expenses are not included in the Fund's annualized expense ratio used to calculate the expense estimate in the table below.
Please note that the expenses shown in the table are meant to highlight your ongoing costs only and do not reflect any transaction costs. Therefore, the second line of the table is useful in comparing ongoing costs only, and will not help you determine the relative total costs of owning different funds. In addition, if these transactional costs were included, your costs would have been higher.
Annual Report
Shareholder Expense Example - continued
| Annualized
Expense RatioB | Beginning
Account Value
May 1, 2013 | Ending
Account Value
October 31, 2013 | Expenses Paid
During Period*
May 1, 2013
to October 31, 2013 |
Class A | 1.63% | | | |
Actual | | $ 1,000.00 | $ 1,129.50 | $ 8.75 |
HypotheticalA | | $ 1,000.00 | $ 1,016.99 | $ 8.29 |
Class T | 1.88% | | | |
Actual | | $ 1,000.00 | $ 1,128.00 | $ 10.08 |
HypotheticalA | | $ 1,000.00 | $ 1,015.73 | $ 9.55 |
Class B | 2.37% | | | |
Actual | | $ 1,000.00 | $ 1,125.30 | $ 12.70 |
HypotheticalA | | $ 1,000.00 | $ 1,013.26 | $ 12.03 |
Class C | 2.34% | | | |
Actual | | $ 1,000.00 | $ 1,125.30 | $ 12.54 |
HypotheticalA | | $ 1,000.00 | $ 1,013.41 | $ 11.88 |
International Small Cap | 1.33% | | | |
Actual | | $ 1,000.00 | $ 1,131.00 | $ 7.14 |
HypotheticalA | | $ 1,000.00 | $ 1,018.50 | $ 6.77 |
Institutional Class | 1.21% | | | |
Actual | | $ 1,000.00 | $ 1,131.50 | $ 6.50 |
HypotheticalA | | $ 1,000.00 | $ 1,019.11 | $ 6.16 |
A 5% return per year before expenses
B Annualized expense ratio reflects expenses net of applicable fee waivers.
* Expenses are equal to each Class' annualized expense ratio, multiplied by the average account value over the period, multiplied by 184/365 (to reflect the one-half year period).
Annual Report
Investment Changes (Unaudited)
Geographic Diversification (% of fund's net assets) |
As of October 31, 2013 |
 | Japan 26.4% | |
 | United Kingdom 18.0% | |
 | Germany 9.7% | |
 | United States of America* 5.6% | |
 | France 3.9% | |
 | Cayman Islands 3.4% | |
 | Australia 3.4% | |
 | Ireland 2.7% | |
 | Bermuda 2.6% | |
 | Other 24.3% | |

* Includes Short-Term Investments and Net Other Assets (Liabilities) |
Percentages are based on country or territory of incorporation and are adjusted for the effect of futures contracts, if applicable. |
As of April 30, 2013 |
| Japan 29.9% | |
| United Kingdom 18.9% | |
| Germany 7.6% | |
| Australia 4.7% | |
| United States of America* 4.1% | |
| Cayman Islands 3.4% | |
| France 3.3% | |
| Luxembourg 2.7% | |
| Singapore 2.6% | |
 | Other 22.8% | |

* Includes Short-Term Investments and Net Other Assets (Liabilities) |
Percentages are based on country or territory of incorporation and are adjusted for the effect of futures contracts, if applicable. |
Asset Allocation as of October 31, 2013 |
| % of fund's
net assets | % of fund's net assets
6 months ago |
Stocks | 94.3 | 95.8 |
Bonds | 0.2 | 0.2 |
Short-Term Investments and Net Other Assets (Liabilities) | 5.5 | 4.0 |
Top Ten Stocks as of October 31, 2013 |
| % of fund's
net assets | % of fund's net assets
6 months ago |
Tokyo Tatemono Co. Ltd. (Japan, Real Estate Management & Development) | 1.9 | 1.5 |
Pigeon Corp. (Japan, Household Products) | 1.7 | 2.0 |
Eurofins Scientific SA (Luxembourg, Life Sciences Tools & Services) | 1.4 | 1.4 |
Hokkaido Electric Power Co., Inc. (Japan, Electric Utilities) | 1.4 | 0.0 |
Aareal Bank AG (Germany, Thrifts & Mortgage Finance) | 1.3 | 0.0 |
Playtech Ltd. (Isle of Man, Software) | 1.2 | 1.3 |
Wirecard AG (Germany, IT Services) | 1.2 | 0.9 |
ASOS PLC (United Kingdom, Internet & Catalog Retail) | 1.2 | 1.1 |
Foster Electric Co. Ltd. (Japan, Household Durables) | 1.2 | 0.0 |
Stanley Electric Co. Ltd. (Japan, Auto Components) | 1.2 | 0.7 |
| 13.7 | |
Market Sectors as of October 31, 2013 |
| % of fund's
net assets | % of fund's net assets
6 months ago |
Consumer Discretionary | 22.5 | 23.0 |
Financials | 17.7 | 17.8 |
Industrials | 16.1 | 14.8 |
Information Technology | 14.4 | 16.1 |
Health Care | 8.7 | 8.6 |
Energy | 4.8 | 5.2 |
Materials | 4.7 | 5.4 |
Consumer Staples | 3.2 | 3.8 |
Utilities | 1.9 | 0.3 |
Telecommunication Services | 0.5 | 1.0 |
Annual Report
Investments October 31, 2013
Showing Percentage of Net Assets
Common Stocks - 93.6% |
| Shares | | Value |
Australia - 3.4% |
Acrux Ltd. | 381,062 | | $ 965,231 |
Alkane Resources Ltd. (a) | 911,891 | | 336,131 |
Austal Ltd. (a) | 3,050,012 | | 2,176,453 |
Base Resources Ltd. (a) | 750,579 | | 294,405 |
Beach Energy Ltd. | 1,213,515 | | 1,640,144 |
Berkeley Resources Ltd. (a) | 1,198,037 | | 294,404 |
Boart Longyear Ltd. (d) | 1,678,919 | | 682,337 |
Clinuvel Pharmaceuticals Ltd. (a)(d) | 325,070 | | 476,222 |
Dart Energy Ltd. (a)(d) | 10,057,900 | | 1,330,871 |
Donaco International Ltd. (d) | 2,061,089 | | 1,383,107 |
Goodman Group unit | 202,411 | | 968,022 |
Greencross Ltd. | 154,770 | | 958,140 |
iiNet Ltd. | 133,255 | | 818,649 |
Iluka Resources Ltd. | 80,327 | | 781,987 |
Independence Group NL | 244,610 | | 915,525 |
iProperty Group Ltd. (a) | 601,773 | | 1,035,154 |
Karoon Gas Australia Ltd. (a) | 452,184 | | 1,893,301 |
Maverick Drilling & Exploration Ltd. (a)(d) | 971,087 | | 468,090 |
Nanosonics Ltd. (a) | 1,384,184 | | 1,138,188 |
Navitas Ltd. | 273,638 | | 1,500,048 |
Neon Energy Ltd. (a) | 1,049,972 | | 287,791 |
NewSat Ltd. (a) | 2,252,414 | | 1,021,857 |
Normandy Mt. Leyshon Ltd. (a) | 1,907,227 | | 225,327 |
Prairie Downs Metals Ltd. (a) | 881,954 | | 291,753 |
Prana Biotechnology Ltd. (a)(d) | 2,224,059 | | 1,064,716 |
QRxPharma Ltd. (a)(d) | 249,195 | | 163,691 |
Ramsay Health Care Ltd. | 10,050 | | 368,552 |
SEEK Ltd. | 161,332 | | 1,980,753 |
Sierra Mining Ltd. (a) | 2,406,178 | | 648,147 |
Silver Lake Resources Ltd. (a) | 840,689 | | 611,824 |
Sino Gas & Energy Ltd. (a) | 22,392,147 | | 4,973,525 |
Sirtex Medical Ltd. | 98,794 | | 1,161,587 |
SomnoMed Ltd. (a) | 584,445 | | 684,961 |
Spark Infrastructure Group unit | 1,255,671 | | 2,011,622 |
Starpharma Holdings Ltd. (a) | 869,513 | | 735,529 |
Tiger Resources Ltd. (a) | 1,511,941 | | 564,459 |
Tissue Therapies Ltd. (a) | 2,581,301 | | 609,929 |
Troy Resources NL (d) | 289,032 | | 366,059 |
Vision Group Holdings Ltd. (a) | 1,221,604 | | 837,084 |
TOTAL AUSTRALIA | | 38,665,575 |
Common Stocks - continued |
| Shares | | Value |
Austria - 0.3% |
Ams AG | 30,950 | | $ 3,380,333 |
Bailiwick of Jersey - 1.9% |
Informa PLC | 1,067,014 | | 9,572,207 |
LXB Retail Properties PLC (a) | 1,426,200 | | 2,766,991 |
Regus PLC | 2,817,600 | | 9,265,884 |
TOTAL BAILIWICK OF JERSEY | | 21,605,082 |
Belgium - 0.1% |
EVS Broadcast Equipment SA | 24,123 | | 1,581,970 |
Bermuda - 2.6% |
APT Satellite Holdings Ltd. | 1,573,000 | | 1,710,356 |
Asia Satellite Telecommunications Holdings Ltd. | 271,000 | | 1,052,122 |
Biosensors International Group Ltd. | 1,016,000 | | 768,830 |
China Animal Healthcare Ltd. (a) | 2,129,000 | | 681,016 |
China Singyes Solar Tech Holdings Ltd. | 981,600 | | 1,064,782 |
Digital China Holdings Ltd. (H Shares) | 423,000 | | 555,416 |
Dukang Distillers Holdings Ltd. (a) | 2,072,000 | | 725,584 |
I.T Ltd. | 1,552,000 | | 472,426 |
Imagi International Holdings Ltd. (a) | 27,752,000 | | 332,895 |
Luk Fook Holdings International Ltd. | 612,000 | | 2,186,560 |
Oakley Capital Investments Ltd. (a) | 1,560,300 | | 4,396,887 |
Oriental Watch Holdings Ltd. | 1,540,000 | | 492,609 |
PAX Global Technology Ltd. (a) | 1,769,000 | | 748,397 |
Petra Diamonds Ltd. (a) | 2,255,500 | | 4,050,445 |
REXLot Holdings Ltd. | 10,075,000 | | 883,658 |
STELUX Holdings International | 2,958,000 | | 1,007,239 |
Vostok Nafta Investment Ltd. SDR | 818,000 | | 6,658,822 |
Vtech Holdings Ltd. | 154,900 | | 2,223,703 |
TOTAL BERMUDA | | 30,011,747 |
British Virgin Islands - 0.4% |
Kalahari Energy (a)(g) | 1,451,000 | | 15 |
Mail.Ru Group Ltd.: | | | |
GDR (f) | 112,800 | | 4,160,064 |
GDR (Reg. S) | 12,700 | | 468,376 |
TOTAL BRITISH VIRGIN ISLANDS | | 4,628,455 |
Canada - 0.6% |
Africa Oil Corp. (a) | 81,500 | | 723,819 |
Africa Oil Corp. (Sweden) (a) | 457,500 | | 4,059,575 |
AirSea Lines (a)(g) | 1,893,338 | | 26 |
Asanko Gold, Inc. (a) | 26,400 | | 62,034 |
Common Stocks - continued |
| Shares | | Value |
Canada - continued |
Mood Media Corp. (a) | 136,700 | | $ 86,531 |
Mood Media Corp. (United Kingdom) (a) | 1,139,822 | | 767,588 |
Mountain Province Diamonds, Inc. (a) | 254,200 | | 1,292,150 |
Rock Well Petroleum, Inc. (a)(g) | 770,400 | | 7 |
TOTAL CANADA | | 6,991,730 |
Cayman Islands - 3.4% |
21Vianet Group, Inc. ADR (a) | 42,300 | | 761,400 |
51job, Inc. sponsored ADR (a) | 19,200 | | 1,470,720 |
AirMedia Group, Inc. ADR (a) | 352,100 | | 595,049 |
Airtac International Group | 90,950 | | 658,140 |
AMVIG Holdings Ltd. | 764,000 | | 358,695 |
AutoNavi Holdings Ltd. ADR (a)(d) | 34,300 | | 530,278 |
Bitauto Holdings Ltd. ADR (a) | 120,000 | | 2,941,200 |
Bonjour Holdings Ltd. | 4,332,000 | | 938,702 |
Changshouhua Food Co. Ltd. | 872,000 | | 921,151 |
China Automation Group Ltd. | 1,872,000 | | 393,572 |
China High Precision Automation Group Ltd. | 712,000 | | 27,551 |
China Lilang Ltd. | 724,000 | | 467,850 |
China Lodging Group Ltd. ADR (a) | 26,500 | | 582,470 |
China Medical System Holdings Ltd. | 1,204,000 | | 1,082,404 |
China Metal International Holdings, Inc. | 2,522,000 | | 709,140 |
China Metal Recycling (Holdings) Ltd. (a) | 436,800 | | 1 |
China Outfitters Holdings Ltd. (d) | 1,888,000 | | 311,704 |
CNinsure, Inc. ADR (a) | 78,600 | | 381,210 |
Convenience Retail Asia Ltd. | 700,000 | | 487,553 |
EVA Precision Industrial Holdings Ltd. | 5,134,000 | | 735,037 |
Greatview Aseptic Pack Co. Ltd. | 1,196,000 | | 752,803 |
Haitian International Holdings Ltd. | 338,000 | | 814,374 |
Hop Hing Group Holdings Ltd. | 7,392,000 | | 314,634 |
Hutchison China Meditech Ltd. (a) | 77,117 | | 780,228 |
Integrated Waste Solutions Group Health Ltd. (a) | 2,055,000 | | 145,252 |
Kingdee International Software Group Co. Ltd. (a) | 1,564,400 | | 504,450 |
KongZhong Corp. sponsored ADR (a) | 56,200 | | 463,650 |
Lee's Pharmaceutical Holdings Ltd. | 1,155,000 | | 1,071,127 |
Marwyn Value Investors II Ltd. (a) | 2,130,100 | | 6,497,803 |
Ming Fai International Holdings Ltd. | 9,133,000 | | 1,001,296 |
Perfect World Co. Ltd. sponsored ADR Class B | 31,700 | | 555,701 |
Royale Furniture Holdings Ltd. | 10,111,437 | | 528,200 |
Shenguan Holdings Group Ltd. | 3,154,000 | | 1,407,564 |
SINA Corp. (a) | 6,100 | | 509,716 |
SITC International Holdings Co. Ltd. | 3,686,000 | | 1,559,407 |
Common Stocks - continued |
| Shares | | Value |
Cayman Islands - continued |
Sitoy Group Holdings Ltd. | 727,000 | | $ 398,523 |
SouFun Holdings Ltd. ADR | 51,000 | | 2,714,730 |
Vipshop Holdings Ltd. ADR (a)(d) | 12,600 | | 868,518 |
VST Holdings Ltd. | 2,767,600 | | 546,166 |
WuXi PharmaTech Cayman, Inc. sponsored ADR (a) | 42,300 | | 1,237,275 |
Xinyi Glass Holdings Ltd. | 1,670,000 | | 1,654,276 |
Yip's Chemical Holdings Ltd. | 592,000 | | 497,851 |
TOTAL CAYMAN ISLANDS | | 39,177,371 |
China - 0.1% |
Xinjiang Goldwind Science & Technology Co. Ltd. (H Shares) | 938,000 | | 958,205 |
Denmark - 0.1% |
ALK-Abello A/S | 6,657 | | 632,586 |
Finland - 1.1% |
Amer Group PLC (A Shares) | 274,500 | | 5,642,714 |
Rakentajain Konevuokraamo Oyj (B Shares) | 343,656 | | 6,873,002 |
TOTAL FINLAND | | 12,515,716 |
France - 3.9% |
ALTEN | 165,500 | | 7,498,493 |
Audika SA (a) | 113,900 | | 1,531,013 |
Ipsos SA | 128,172 | | 5,406,103 |
Sartorius Stedim Biotech | 53,000 | | 7,969,653 |
Sopra Group SA | 61,000 | | 5,335,442 |
SR Teleperformance SA | 178,251 | | 9,453,313 |
The Lisi Group | 52,800 | | 8,151,062 |
TOTAL FRANCE | | 45,345,079 |
Germany - 9.7% |
Aareal Bank AG (a) | 394,704 | | 15,179,633 |
AURELIUS AG | 136,500 | | 4,659,268 |
Brenntag AG | 40,600 | | 6,879,556 |
CANCOM AG | 49,600 | | 1,904,500 |
CENTROTEC Sustainable AG | 289,265 | | 7,201,063 |
CompuGROUP Holding AG | 199,511 | | 5,199,658 |
CTS Eventim AG | 199,177 | | 9,722,051 |
Deutz AG (a) | 903,600 | | 8,600,309 |
GFK AG | 195,601 | | 11,433,101 |
Ichor Coal NV (a) | 355,000 | | 1,928,005 |
Lanxess AG | 88,385 | | 6,221,045 |
MTU Aero Engines Holdings AG | 60,089 | | 6,003,902 |
Rational AG | 15,920 | | 4,885,076 |
Common Stocks - continued |
| Shares | | Value |
Germany - continued |
United Internet AG | 200,152 | | $ 7,908,111 |
Wirecard AG | 387,100 | | 14,114,586 |
TOTAL GERMANY | | 111,839,864 |
Hong Kong - 0.8% |
Dah Sing Banking Group Ltd. | 598,800 | | 1,129,170 |
Guotai Junan International Holdings Ltd. | 1,331,000 | | 569,963 |
Magnificent Estates Ltd. | 25,682,000 | | 1,242,197 |
Singamas Container Holdings Ltd. | 5,744,000 | | 1,340,983 |
Sinosoft Tech Group Ltd. | 1,164,000 | | 279,252 |
Techtronic Industries Co. Ltd. | 1,012,500 | | 2,546,595 |
Wing Hang Bank Ltd. | 153,000 | | 2,176,693 |
TOTAL HONG KONG | | 9,284,853 |
India - 0.8% |
Ahluwalia Contracts (India) Ltd. (a) | 230,314 | | 96,986 |
Britannia Industries Ltd. | 46,936 | | 715,609 |
MT Educare Ltd. | 211,299 | | 345,456 |
Page Industries Ltd. | 90,084 | | 6,535,563 |
Shriram City Union Finance Ltd. | 32,081 | | 526,501 |
Thangamayil Jewellery Ltd. | 173,245 | | 478,768 |
WABCO India Ltd. | 14,137 | | 388,238 |
TOTAL INDIA | | 9,087,121 |
Indonesia - 0.5% |
PT Clipan Finance Indonesia Tbk | 13,895,400 | | 517,723 |
PT Clipan Finance Indonesia Tbk warrants 10/7/14 (a) | 2,275,700 | | 6,460 |
PT Global Mediacom Tbk | 1,729,000 | | 292,958 |
PT Mayora Indah Tbk | 410,667 | | 1,067,419 |
PT Media Nusantara Citra Tbk | 5,091,500 | | 1,129,180 |
PT Mitra Adiperkasa Tbk | 801,000 | | 383,711 |
PT MNC Sky Vision Tbk (a) | 2,487,000 | | 512,951 |
PT Nippon Indosari Corpindo Tbk | 881,500 | | 484,832 |
PT Pembangunan Perumahan Persero Tbk | 4,982,500 | | 579,023 |
PT Tiga Pilar Sejahtera Food Tbk | 8,562,500 | | 1,002,656 |
TOTAL INDONESIA | | 5,976,913 |
Ireland - 2.7% |
Glanbia PLC | 168,000 | | 2,354,013 |
Kenmare Resources PLC (a) | 11,445,200 | | 3,734,476 |
Paddy Power PLC (Ireland) | 157,509 | | 12,831,471 |
Common Stocks - continued |
| Shares | | Value |
Ireland - continued |
Smurfit Kappa Group PLC | 287,600 | | $ 6,989,751 |
United Drug PLC (United Kingdom) | 992,400 | | 4,964,588 |
TOTAL IRELAND | | 30,874,299 |
Isle of Man - 2.4% |
Exillon Energy PLC (a) | 1,097,300 | | 4,187,398 |
IBS Group Holding Ltd. GDR (Reg. S) | 336,400 | | 9,086,984 |
Playtech Ltd. | 1,209,747 | | 14,285,952 |
TOTAL ISLE OF MAN | | 27,560,334 |
Israel - 0.1% |
Sarin Technologies Ltd. | 957,750 | | 1,464,921 |
Italy - 2.3% |
Brunello Cucinelli SpA | 123,985 | | 3,871,835 |
Prysmian SpA | 263,900 | | 6,449,584 |
Salvatore Ferragamo Italia SpA | 244,915 | | 8,393,142 |
YOOX SpA (a) | 209,800 | | 7,548,683 |
TOTAL ITALY | | 26,263,244 |
Japan - 26.4% |
Accordia Golf Co. Ltd. | 504,500 | | 5,536,995 |
ACOM Co. Ltd. (a) | 586,600 | | 2,296,933 |
AEON Financial Service Co. Ltd. (d) | 243,800 | | 7,487,160 |
AEON Mall Co. Ltd. | 66,550 | | 1,890,084 |
Amada Co. Ltd. | 610,000 | | 5,247,570 |
CAC Corp. | 47,400 | | 421,311 |
Career Design Center Co. Ltd. | 676 | | 800,696 |
Chugoku Electric Power Co., Inc. | 112,600 | | 1,726,008 |
Creek & River Co. Ltd. | 91,200 | | 392,559 |
Daiwa Industries Ltd. | 42,000 | | 264,291 |
en-japan, Inc. | 113,700 | | 2,539,549 |
Enigmo, Inc. (a)(d) | 48,400 | | 3,444,988 |
Foster Electric Co. Ltd. (d) | 705,400 | | 13,801,537 |
Fuji Corp. | 47,500 | | 783,216 |
Fuji Media Holdings, Inc. | 54,000 | | 1,076,510 |
Fujibo Holdings, Inc. | 464,000 | | 945,493 |
G-Tekt Corp. | 20,500 | | 605,963 |
H.I.S. Co. Ltd. | 92,600 | | 4,994,351 |
Hajime Construction Co. Ltd. (d) | 81,800 | | 5,640,232 |
Heiwa Corp. | 49,200 | | 824,899 |
Higashi Nihon House Co. Ltd. | 508,000 | | 2,715,643 |
Hokkaido Electric Power Co., Inc. (a) | 1,235,300 | | 15,913,286 |
Common Stocks - continued |
| Shares | | Value |
Japan - continued |
Hoshizaki Electric Co. Ltd. | 155,300 | | $ 5,690,961 |
Iida Home Max Co., Ltd. (d) | 107,000 | | 2,454,917 |
Iino Kaiun Kaisha Ltd. | 500,800 | | 3,298,120 |
ISE Chemical Corp. | 56,000 | | 484,012 |
ITC Networks Corp. | 28,700 | | 246,885 |
Iwatsuka Confectionary Co. Ltd. | 16,000 | | 825,210 |
JAFCO Co. Ltd. | 56,600 | | 2,838,507 |
Juki Corp. (a)(d) | 1,588,000 | | 2,998,722 |
Justsystems Corp. (a) | 69,100 | | 665,856 |
K's Denki Corp. | 141,100 | | 4,143,098 |
Kakaku.com, Inc. | 685,200 | | 13,252,683 |
Kanto Natural Gas Development | 72,000 | | 507,631 |
KAWAI Musical Instruments Manufacturing Co. Ltd. (d) | 523,000 | | 986,578 |
Koshidaka Holdings Co. Ltd. | 23,100 | | 813,634 |
Kotobuki Spirits Co. Ltd. | 15,300 | | 200,081 |
Kyushu Electric Power Co., Inc. (a) | 69,400 | | 977,140 |
Leopalace21 Corp. (a) | 1,331,600 | | 9,244,644 |
Mazda Motor Corp. (a) | 1,441,000 | | 6,486,674 |
N Field Co. Ltd. | 15,700 | | 1,744,507 |
Nichias Corp. | 501,000 | | 3,389,511 |
Nihon Nohyaku Co. Ltd. | 374,000 | | 4,482,832 |
Nikkiso Co. Ltd. | 549,000 | | 6,791,930 |
Nippon Koei Co. Ltd. | 70,000 | | 329,304 |
Nippon Seiki Co. Ltd. | 34,000 | | 554,333 |
Nippon Shinyaku Co. Ltd. | 345,000 | | 5,946,976 |
Nippon Yusen KK | 719,000 | | 2,196,902 |
Nitta Corp. | 157,400 | | 3,315,251 |
Nomura Real Estate Holdings, Inc. | 222,300 | | 5,624,508 |
NTT Urban Development Co. | 279,800 | | 3,571,744 |
ORIX Corp. | 679,400 | | 11,767,947 |
Pal Co. Ltd. | 68,700 | | 1,919,793 |
Parco Co. Ltd. | 41,700 | | 428,718 |
Pigeon Corp. | 373,100 | | 19,249,422 |
Pressance Corp. (d) | 23,100 | | 739,680 |
Rakuten, Inc. | 626,900 | | 8,168,282 |
Rohto Pharmaceutical Co. Ltd. | 130,000 | | 1,886,600 |
Sakata INX Corp. | 332,000 | | 3,151,073 |
San-Ai Oil Co. Ltd. | 97,000 | | 418,926 |
Sawada Holdings Co. Ltd. | 259,800 | | 2,439,741 |
Sega Sammy Holdings, Inc. | 248,000 | | 6,357,615 |
Shinkawa Ltd. | 52,000 | | 336,857 |
Shinko Kogyo Co. Ltd. | 268,900 | | 2,215,210 |
Common Stocks - continued |
| Shares | | Value |
Japan - continued |
Shinko Shoji Co. Ltd. | 2,900 | | $ 24,819 |
Shinsei Bank Ltd. | 133,000 | | 311,394 |
Sosei Group Corp. (a) | 113,900 | | 4,904,553 |
Sourcenext Corp. (a)(d) | 83,100 | | 688,377 |
Stanley Electric Co. Ltd. | 584,700 | | 13,600,715 |
Sumitomo Heavy Industries Ltd. | 1,196,000 | | 5,293,423 |
Takeuchi Manufacturing Co. Ltd. | 28,700 | | 605,375 |
Tohoku Electric Power Co., Inc. (a) | 134,200 | | 1,624,383 |
Tokyo Tatemono Co. Ltd. | 2,341,000 | | 21,977,316 |
Tokyu Fudosan Holdings Corp. (a) | 498,000 | | 4,918,312 |
Topcon Corp. | 541,300 | | 8,162,127 |
Toshiba Plant Systems & Services Corp. | 16,000 | | 282,310 |
Toyo Engineering Corp. | 218,000 | | 928,891 |
Uchiyama Holdings Co. Ltd. | 39,200 | | 1,177,753 |
VT Holdings Co. Ltd. | 54,100 | | 728,136 |
Welcia Holdings Co. Ltd. | 14,300 | | 865,000 |
WirelessGate, Inc. (a) | 24,200 | | 741,079 |
Yamaha Motor Co. Ltd. | 207,200 | | 3,173,994 |
Yamaya Corp. | 47,300 | | 681,356 |
TOTAL JAPAN | | 303,181,602 |
Korea (South) - 0.4% |
Daou Technology, Inc. | 133,650 | | 1,832,322 |
Koh Young Technology, Inc. | 23,358 | | 696,593 |
Korea Plant Service & Engineering Co. Ltd. | 7,274 | | 368,744 |
SBS Contents Hub Co. Ltd. | 31,723 | | 443,885 |
Soulbrain Co. Ltd. | 11,656 | | 582,097 |
WeMade Entertainment Co. Ltd. (a) | 9,761 | | 435,036 |
TOTAL KOREA (SOUTH) | | 4,358,677 |
Luxembourg - 2.6% |
AZ Electronic Materials SA | 1,117,200 | | 5,150,041 |
Eurofins Scientific SA | 58,899 | | 16,149,965 |
Grand City Properties SA (a) | 1,009,573 | | 8,106,602 |
TOTAL LUXEMBOURG | | 29,406,608 |
Malaysia - 0.1% |
JobStreet Corp. Bhd | 2,446,200 | | 1,666,190 |
Netherlands - 0.6% |
Yandex NV (a) | 175,600 | | 6,472,616 |
Norway - 1.6% |
Aker Solutions ASA (d) | 511,200 | | 7,067,261 |
Common Stocks - continued |
| Shares | | Value |
Norway - continued |
Norwegian Air Shuttle A/S (a)(d) | 46,500 | | $ 1,912,944 |
Schibsted ASA (B Shares) (d) | 73,100 | | 4,469,709 |
Sevan Drilling ASA (a)(d) | 4,908,300 | | 4,707,905 |
TOTAL NORWAY | | 18,157,819 |
Singapore - 2.3% |
Amtek Engineering Ltd. | 3,304,000 | | 1,276,703 |
Cordlife Group Ltd. | 1,021,000 | | 982,205 |
CSE Global Ltd. | 1,069,000 | | 813,239 |
Goodpack Ltd. | 1,541,000 | | 2,375,636 |
Mapletree Industrial (REIT) | 1,118,722 | | 1,247,327 |
OSIM International Ltd. | 1,092,000 | | 1,854,870 |
Pertama Holdings Ltd. (e) | 23,060,000 | | 12,066,495 |
Petra Foods Ltd. | 370,000 | | 1,057,398 |
Sino Grandness Food Industry Group Ltd. (a) | 3,087,000 | | 1,776,852 |
Venture Corp. Ltd. | 325,000 | | 2,035,502 |
Yoma Strategic Holdings Ltd. | 1,060,000 | | 652,793 |
TOTAL SINGAPORE | | 26,139,020 |
South Africa - 0.5% |
Blue Label Telecoms Ltd. | 6,485,319 | | 6,098,509 |
Sweden - 0.9% |
Avanza Bank Holding AB | 167,100 | | 5,376,556 |
Rezidor Hotel Group AB (a) | 942,170 | | 5,365,093 |
TOTAL SWEDEN | | 10,741,649 |
Switzerland - 2.5% |
Clariant AG (Reg.) | 159,700 | | 2,816,113 |
Julius Baer Group Ltd. | 113,210 | | 5,563,491 |
Meyer Burger Technology AG (a)(d) | 286,600 | | 3,363,961 |
Sika AG (Bearer) | 1,610 | | 5,076,553 |
Temenos Group AG | 75,008 | | 1,913,744 |
VZ Holding AG | 53,370 | | 9,587,601 |
TOTAL SWITZERLAND | | 28,321,463 |
Taiwan - 0.2% |
Merida Industry Co. Ltd. | 85,000 | | 643,961 |
Taiwan Hon Chuan Enterprise Co. Ltd. | 185,000 | | 389,672 |
Tong Hsing Electronics Industries Ltd. | 135,721 | | 716,990 |
TOTAL TAIWAN | | 1,750,623 |
Thailand - 0.2% |
Toyo-Thai Corp. PCL | 2,200,600 | | 2,722,027 |
Common Stocks - continued |
| Shares | | Value |
United Kingdom - 18.0% |
Amerisur Resources PLC (a)(d) | 5,712,324 | | $ 4,030,022 |
ASOS PLC (a) | 152,776 | | 13,889,291 |
Aveva Group PLC | 179,175 | | 7,429,299 |
Bond International Software PLC | 843,266 | | 1,270,967 |
Brammer PLC (d) | 1,302,600 | | 10,108,770 |
Brewin Dolphin Holding PLC | 980,163 | | 4,463,325 |
Cineworld Group PLC | 187,861 | | 1,116,760 |
Close Brothers Group PLC | 347,270 | | 7,043,681 |
Countrywide PLC | 778,100 | | 6,961,639 |
Craneware PLC | 813,500 | | 6,091,389 |
Devro PLC | 103,098 | | 522,867 |
Dicom Group PLC (a) | 1,215,200 | | 7,384,632 |
Foxtons Group PLC | 1,383,300 | | 7,069,822 |
Hunting PLC | 352,500 | | 5,041,571 |
IG Group Holdings PLC | 1,188,002 | | 11,686,208 |
Innovation Group PLC (a)(d) | 9,382,600 | | 4,776,489 |
International Personal Finance PLC | 870,900 | | 8,064,216 |
John Wood Group PLC | 470,700 | | 6,128,330 |
Johnson Matthey PLC | 106,195 | | 5,115,003 |
Keronite PLC (a)(g) | 13,620,267 | | 218 |
Lombard Medical Technologies PLC (a) | 1,260,400 | | 4,132,792 |
Moneysupermarket.com Group PLC | 4,001,600 | | 9,842,398 |
Mothercare PLC (a)(d) | 578,200 | | 3,550,739 |
Ocado Group PLC (a) | 913,800 | | 6,358,911 |
Perform Group PLC (a) | 701,700 | | 6,300,592 |
Petroceltic International PLC (a) | 1,117,274 | | 2,543,841 |
Pureprofile Media PLC (a)(g) | 1,108,572 | | 622,120 |
Regenersis PLC | 1,231,800 | | 5,075,925 |
Rockhopper Exploration PLC (a)(d) | 1,084,100 | | 2,516,111 |
Salamander Energy PLC (a) | 632,400 | | 1,087,504 |
Serco Group PLC | 683,068 | | 6,100,438 |
Silverdell PLC | 12,644,400 | | 1,550,963 |
Sinclair Pharma PLC (a)(d) | 8,403,003 | | 4,311,480 |
Sphere Medical Holding PLC (a) | 817,054 | | 373,368 |
Sthree PLC | 1,060,309 | | 6,111,858 |
Synergy Health PLC | 353,353 | | 5,875,292 |
Ted Baker PLC | 343,975 | | 9,414,609 |
TMO Renewables Ltd. (a)(g) | 1,000,000 | | 64,136 |
Travis Perkins PLC | 189,500 | | 5,639,350 |
Tungsten Corp. PLC | 1,150,600 | | 4,137,126 |
Wolfson Microelectronics PLC (a) | 1,463,200 | | 3,296,263 |
TOTAL UNITED KINGDOM | | 207,100,315 |
Common Stocks - continued |
| Shares | | Value |
United States of America - 0.1% |
CTC Media, Inc. | 4,300 | | $ 54,352 |
GI Dynamics, Inc. CDI (a) | 1,286,187 | | 972,512 |
Mudalla Technology, Inc. (Reg. S) (a) | 996,527 | | 16 |
YOU On Demand Holdings, Inc. (a) | 114,474 | | 203,764 |
YOU On Demand Holdings, Inc. warrants 8/30/17 (a) | 27,500 | | 0 |
TOTAL UNITED STATES OF AMERICA | | 1,230,644 |
TOTAL COMMON STOCKS (Cost $829,518,560) |
1,075,193,160
|
Nonconvertible Preferred Stocks - 0.7% |
| | | |
Brazil - 0.7% |
Alpargatas Sa (PN)
(Cost $7,863,928) | 1,125,920 | |
7,790,269
|
Convertible Bonds - 0.2% |
| Principal Amount | | |
Canada - 0.2% |
Caracal Energy, Inc. 12% 9/30/17 (g)
(Cost $1,400,000) | | $ 1,400,000 | |
1,775,964
|
Money Market Funds - 8.3% |
| Shares | | |
Fidelity Cash Central Fund, 0.09% (b) | 72,010,764 | | 72,010,764 |
Fidelity Securities Lending Cash Central Fund, 0.09% (b)(c) | 23,742,135 | | 23,742,135 |
TOTAL MONEY MARKET FUNDS (Cost $95,752,899) |
95,752,899
|
TOTAL INVESTMENT PORTFOLIO - 102.8% (Cost $934,535,387) | | 1,180,512,292 |
NET OTHER ASSETS (LIABILITIES) - (2.8)% | | (32,073,166) |
NET ASSETS - 100% | $ 1,148,439,126 |
Legend |
(a) Non-income producing |
(b) Affiliated fund that is generally available only to investment companies and other accounts managed by Fidelity Investments. The rate quoted is the annualized seven-day yield of the fund at period end. A complete unaudited listing of the fund's holdings as of its most recent quarter end is available upon request. In addition, each Fidelity Central Fund's financial statements, which are not covered by the Fund's Report of Independent Registered Public Accounting Firm, are available on the SEC's website or upon request. |
(c) Investment made with cash collateral received from securities on loan. |
(d) Security or a portion of the security is on loan at period end. |
(e) Affiliated company |
(f) Security exempt from registration under Rule 144A of the Securities Act of 1933. These securities may be resold in transactions exempt from registration, normally to qualified institutional buyers. At the end of the period, the value of these securities amounted to $4,160,064 or 0.4% of net assets. |
(g) Restricted securities - Investment in securities not registered under the Securities Act of 1933 (excluding 144A issues). At the end of the period, the value of restricted securities (excluding 144A issues) amounted to $2,462,486 or 0.2% of net assets. |
Additional information on each restricted holding is as follows: |
Security | Acquisition Date | Acquisition Cost |
AirSea Lines | 8/4/06 | $ 1,199,182 |
Caracal Energy, Inc. 12% 9/30/17 | 9/12/12 | $ 1,400,000 |
Kalahari Energy | 9/1/06 | $ 1,813,750 |
Keronite PLC | 8/16/06 | $ 1,548,992 |
Pureprofile Media PLC | 5/3/05 - 1/11/06 | $ 1,173,341 |
Rock Well Petroleum, Inc. | 4/13/06 | $ 1,004,171 |
TMO Renewables Ltd. | 10/27/05 | $ 535,065 |
Affiliated Central Funds |
Information regarding fiscal year to date income earned by the Fund from investments in Fidelity Central Funds is as follows: |
Fund | Income earned |
Fidelity Cash Central Fund | $ 46,779 |
Fidelity Securities Lending Cash Central Fund | 663,324 |
Total | $ 710,103 |
Other Affiliated Issuers |
An affiliated company is a company in which the Fund has ownership of at least 5% of the voting securities. Fiscal year to date transactions with companies which are or were affiliates are as follows: |
Affiliate | Value, beginning of period | Purchases | Sales Proceeds | Dividend Income | Value,
end of
period |
Pertama Holdings Ltd. | $ 9,679,226 | $ - | $ - | $ 380,584 | $ 12,066,495 |
Other Information |
Categorizations in the Schedule of Investments are based on country or territory of incorporation. |
The following is a summary of the inputs used, as of October 31, 2013, involving the Fund's assets and liabilities carried at fair value. The inputs or methodology used for valuing securities may not be an indication of the risk associated with investing in those securities. For more information on valuation inputs, and their aggregation into the levels used in the tables below, please refer to the Investment Valuation section in the accompanying Notes to Financial Statements. |
Valuation Inputs at Reporting Date: |
Description | Total | Level 1 | Level 2 | Level 3 |
Investments in Securities: | | | | |
Equities: | | | | |
Consumer Discretionary | $ 260,457,290 | $ 175,431,185 | $ 79,385,857 | $ 5,640,248 |
Consumer Staples | 35,660,497 | 13,839,428 | 21,821,069 | - |
Energy | 55,836,047 | 54,909,468 | 926,557 | 22 |
Financials | 202,565,947 | 125,742,740 | 74,368,290 | 2,454,917 |
Health Care | 96,487,666 | 72,296,566 | 24,126,964 | 64,136 |
Industrials | 185,406,536 | 143,921,432 | 39,788,645 | 1,696,459 |
Information Technology | 162,730,680 | 134,837,106 | 27,243,903 | 649,671 |
Materials | 56,242,264 | 47,559,887 | 8,117,917 | 564,460 |
Telecommunication Services | 5,344,063 | 4,602,984 | 741,079 | - |
Utilities | 22,252,439 | 2,011,622 | 20,240,817 | - |
Corporate Bonds | 1,775,964 | - | 1,775,964 | - |
Money Market Funds | 95,752,899 | 95,752,899 | - | - |
Total Investments in Securities: | $ 1,180,512,292 | $ 870,905,317 | $ 298,537,062 | $ 11,069,913 |
The following is a summary of transfers between Level 1 and Level 2 for the period ended October 31, 2013. Transfers are assumed to have occurred at the beginning of the period, and are primarily attributable to the valuation techniques used for foreign equity securities, as discussed in the accompanying Notes to Financial Statements: |
Transfers | Total |
Level 1 to Level 2 | $ 93,219,288 |
Level 2 to Level 1 | $ 85,883 |
Valuation Inputs at Reporting Date: |
The following is a reconciliation of Investments in Securities for which Level 3 inputs were used in determining value: |
Investments in Securities: | |
Beginning Balance | $ 17,107,640 |
Net Realized Gain (Loss) on Investment Securities | 1,980,820 |
Net Unrealized Gain (Loss) on Investment Securities | (322,938) |
Cost of Purchases | 1,698,025 |
Proceeds of Sales | (7,832,736) |
Amortization/Accretion | - |
Transfers into Level 3 | 9,518,328 |
Transfers out of Level 3 | (11,079,226) |
Ending Balance | $ 11,069,913 |
The change in unrealized gain (loss) for the period attributable to Level 3 securities held at October 31, 2013 | $ 715,199 |
The information used in the above reconciliation represents fiscal year to date activity for any Investments in Securities identified as using Level 3 inputs at either the beginning or the end of the current fiscal period. Transfers into Level 3 were attributable to a lack of observable market data resulting from decreases in market activity, decreases in liquidity, security restructurings or corporate actions. Transfers out of Level 3 were attributable to observable market data becoming available for those securities. Transfers in or out of Level 3 represent the beginning value of any Security or Instrument where a change in the pricing level occurred from the beginning to the end of the period. The cost of purchases and the proceeds of sales may include securities received or delivered through corporate actions or exchanges. Realized and unrealized gains (losses) disclosed in the reconciliation are included in Net Gain (Loss) on the Fund's Statement of Operations. |
See accompanying notes which are an integral part of the financial statements.
Annual Report
Financial Statements
Statement of Assets and Liabilities
| October 31, 2013 |
| | |
Assets | | |
Investment in securities, at value (including securities loaned of $21,984,564) - See accompanying schedule: Unaffiliated issuers (cost $832,370,202) | $ 1,072,692,898 | |
Fidelity Central Funds (cost $95,752,899) | 95,752,899 | |
Other affiliated issuers (cost $6,412,286) | 12,066,495 | |
Total Investments (cost $934,535,387) | | $ 1,180,512,292 |
Cash | | 4,686 |
Foreign currency held at value (cost $22,233) | | 22,233 |
Receivable for investments sold | | 1,202,840 |
Receivable for fund shares sold | | 2,252,442 |
Dividends receivable | | 1,689,783 |
Interest receivable | | 190,702 |
Distributions receivable from Fidelity Central Funds | | 43,612 |
Prepaid expenses | | 3,042 |
Other receivables | | 40,069 |
Total assets | | 1,185,961,701 |
| | |
Liabilities | | |
Payable for investments purchased | $ 11,458,863 | |
Payable for fund shares redeemed | 1,058,399 | |
Accrued management fee | 834,071 | |
Distribution and service plan fees payable | 21,407 | |
Other affiliated payables | 245,715 | |
Other payables and accrued expenses | 161,985 | |
Collateral on securities loaned, at value | 23,742,135 | |
Total liabilities | | 37,522,575 |
| | |
Net Assets | | $ 1,148,439,126 |
Net Assets consist of: | | |
Paid in capital | | $ 940,719,067 |
Undistributed net investment income | | 4,006,124 |
Accumulated undistributed net realized gain (loss) on investments and foreign currency transactions | | (42,239,141) |
Net unrealized appreciation (depreciation) on investments and assets and liabilities in foreign currencies | | 245,953,076 |
Net Assets | | $ 1,148,439,126 |
See accompanying notes which are an integral part of the financial statements.
Annual Report
Financial Statements - continued
Statement of Assets and Liabilities - continued
| October 31, 2013 |
| | |
Calculation of Maximum Offering Price Class A:
Net Asset Value and redemption price per share ($24,020,321 ÷ 912,078 shares) | | $ 26.34 |
| | |
Maximum offering price per share (100/94.25 of $26.34) | | $ 27.95 |
Class T:
Net Asset Value and redemption price per share ($13,530,248 ÷ 516,960 shares) | | $ 26.17 |
| | |
Maximum offering price per share (100/96.50 of $26.17) | | $ 27.12 |
Class B:
Net Asset Value and offering price per share ($794,911 ÷ 30,729 shares)A | | $ 25.87 |
| | |
Class C:
Net Asset Value and offering price per share ($13,426,348 ÷ 522,739 shares)A | | $ 25.68 |
| | |
International Small Cap:
Net Asset Value, offering price and redemption price per share ($1,029,629,175 ÷ 38,611,059 shares) | | $ 26.67 |
| | |
Institutional Class:
Net Asset Value, offering price and redemption price per share ($67,038,123 ÷ 2,513,397 shares) | | $ 26.67 |
A Redemption price per share is equal to net asset value less any applicable contingent deferred sales charge.
See accompanying notes which are an integral part of the financial statements.
Annual Report
Statement of Operations
| Year ended October 31, 2013 |
| | |
Investment Income | | |
Dividends (including $380,584 earned from other affiliated issuers) | | $ 15,849,730 |
Interest | | 168,107 |
Income from Fidelity Central Funds | | 710,103 |
Income before foreign taxes withheld | | 16,727,940 |
Less foreign taxes withheld | | (804,542) |
Total income | | 15,923,398 |
| | |
Expenses | | |
Management fee
Basic fee | $ 7,352,833 | |
Performance adjustment | 929,023 | |
Transfer agent fees | 2,205,642 | |
Distribution and service plan fees | 192,174 | |
Accounting and security lending fees | 417,104 | |
Custodian fees and expenses | 278,409 | |
Independent trustees' compensation | 4,726 | |
Registration fees | 90,493 | |
Audit | 152,551 | |
Legal | 2,053 | |
Miscellaneous | 6,690 | |
Total expenses before reductions | 11,631,698 | |
Expense reductions | (142,371) | 11,489,327 |
Net investment income (loss) | | 4,434,071 |
Realized and Unrealized Gain (Loss) Net realized gain (loss) on: | | |
Investment securities: | | |
Unaffiliated issuers | 66,377,894 | |
Foreign currency transactions | (228,900) | |
Futures contracts | (80,042) | |
Total net realized gain (loss) | | 66,068,952 |
Change in net unrealized appreciation (depreciation) on: Investment securities (net of decrease in deferred foreign taxes of $185,408) | 198,876,160 | |
Assets and liabilities in foreign currencies | (867) | |
Total change in net unrealized appreciation (depreciation) | | 198,875,293 |
Net gain (loss) | | 264,944,245 |
Net increase (decrease) in net assets resulting from operations | | $ 269,378,316 |
See accompanying notes which are an integral part of the financial statements.
Annual Report
Financial Statements - continued
Statement of Changes in Net Assets
| Year ended
October 31,
2013 | Year ended
October 31,
2012 |
Increase (Decrease) in Net Assets | | |
Operations | | |
Net investment income (loss) | $ 4,434,071 | $ 4,511,101 |
Net realized gain (loss) | 66,068,952 | (4,142,955) |
Change in net unrealized appreciation (depreciation) | 198,875,293 | 42,574,576 |
Net increase (decrease) in net assets resulting
from operations | 269,378,316 | 42,942,722 |
Distributions to shareholders from net investment income | (4,769,550) | (8,016,423) |
Distributions to shareholders from net realized gain | (11,754,787) | (12,577,679) |
Total distributions | (16,524,337) | (20,594,102) |
Share transactions - net increase (decrease) | 162,217,941 | (204,187,386) |
Redemption fees | 119,206 | 102,611 |
Total increase (decrease) in net assets | 415,191,126 | (181,736,155) |
| | |
Net Assets | | |
Beginning of period | 733,248,000 | 914,984,155 |
End of period (including undistributed net investment income of $4,006,124 and undistributed net investment income of $4,511,102, respectively) | $ 1,148,439,126 | $ 733,248,000 |
See accompanying notes which are an integral part of the financial statements.
Annual Report
Financial Highlights - Class A
Years ended October 31, | 2013 | 2012 | 2011 | 2010 | 2009 |
Selected Per-Share Data | | | | | |
Net asset value, beginning of period | $ 19.74 | $ 18.97 | $ 20.42 | $ 17.28 | $ 11.91 |
Income from Investment Operations | | | | | |
Net investment income (loss) C | .06 | .06 | .10 | .03 | .06 |
Net realized and unrealized gain (loss) | 6.94 | 1.09 | (.88) | 3.51 | 5.31 |
Total from investment operations | 7.00 | 1.15 | (.78) | 3.54 | 5.37 |
Distributions from net investment income | (.07) | (.11) | (.02) | (.06) | - |
Distributions from net realized gain | (.33) | (.27) | (.66) | (.34) | - |
Total distributions | (.40) | (.38) | (.68) | (.40) | - |
Redemption fees added to paid in capital C | - G | - G | .01 | - G | - G |
Net asset value, end of period | $ 26.34 | $ 19.74 | $ 18.97 | $ 20.42 | $ 17.28 |
Total Return A, B | 36.18% | 6.28% | (4.00)% | 20.85% | 45.09% |
Ratios to Average Net Assets D, F | | | | | |
Expenses before reductions | 1.61% | 1.63% | 1.56% | 1.71% | 1.75% |
Expenses net of fee waivers, if any | 1.61% | 1.63% | 1.55% | 1.65% | 1.65% |
Expenses net of all reductions | 1.60% | 1.60% | 1.54% | 1.63% | 1.62% |
Net investment income (loss) | .25% | .32% | .49% | .16% | .41% |
Supplemental Data | | | | | |
Net assets, end of period (000 omitted) | $ 24,020 | $ 14,125 | $ 17,185 | $ 19,720 | $ 17,590 |
Portfolio turnover rate E | 54% | 68% | 47% | 66% | 81% |
A Total returns would have been lower if certain expenses had not been reduced during the applicable periods shown.
B Total returns do not include the effect of the sales charges.
C Calculated based on average shares outstanding during the period.
D Fees and expenses of any underlying Fidelity Central Funds are not included in the Fund's expense ratio. The Fund indirectly bears its proportionate share of the expenses of any underlying Fidelity Central Funds.
E Amount does not include the portfolio activity of any underlying Fidelity Central Funds.
F Expense ratios reflect operating expenses of the class. Expenses before reductions do not reflect amounts reimbursed by the investment adviser or reductions from brokerage service arrangements or reductions from other expense offset arrangements and do not represent the amount paid by the class during periods when reimbursements or reductions occur. Expenses net of fee waivers reflect expenses after reimbursement by the investment adviser but prior to reductions from brokerage service arrangements or other expense offset arrangements. Expenses net of all reductions represent the net expenses paid by the class.
G Amount represents less than $.01 per share.
See accompanying notes which are an integral part of the financial statements.
Annual Report
Financial Highlights - Class T
Years ended October 31, | 2013 | 2012 | 2011 | 2010 | 2009 |
Selected Per-Share Data | | | | | |
Net asset value, beginning of period | $ 19.59 | $ 18.80 | $ 20.23 | $ 17.14 | $ 11.84 |
Income from Investment Operations | | | | | |
Net investment income (loss) C | - G | .01 | .05 | (.02) | .02 |
Net realized and unrealized gain (loss) | 6.90 | 1.08 | (.86) | 3.47 | 5.28 |
Total from investment operations | 6.90 | 1.09 | (.81) | 3.45 | 5.30 |
Distributions from net investment income | - | (.03) | - | (.02) | - |
Distributions from net realized gain | (.32) | (.27) | (.63) | (.34) | - |
Total distributions | (.32) | (.30) | (.63) | (.36) | - |
Redemption fees added to paid in capital C | - G | - G | .01 | - G | - G |
Net asset value, end of period | $ 26.17 | $ 19.59 | $ 18.80 | $ 20.23 | $ 17.14 |
Total Return A, B | 35.80% | 5.97% | (4.18)% | 20.46% | 44.76% |
Ratios to Average Net Assets D, F | | | | | |
Expenses before reductions | 1.87% | 1.88% | 1.82% | 1.97% | 2.00% |
Expenses net of fee waivers, if any | 1.87% | 1.88% | 1.81% | 1.90% | 1.90% |
Expenses net of all reductions | 1.85% | 1.85% | 1.79% | 1.88% | 1.86% |
Net investment income (loss) | (.01)% | .07% | .24% | (.09)% | .16% |
Supplemental Data | | | | | |
Net assets, end of period (000 omitted) | $ 13,530 | $ 9,262 | $ 13,744 | $ 16,092 | $ 15,760 |
Portfolio turnover rate E | 54% | 68% | 47% | 66% | 81% |
A Total returns would have been lower if certain expenses had not been reduced during the applicable periods shown.
B Total returns do not include the effect of the sales charges.
C Calculated based on average shares outstanding during the period.
D Fees and expenses of any underlying Fidelity Central Funds are not included in the Fund's expense ratio. The Fund indirectly bears its proportionate share of the expenses of any underlying Fidelity Central Funds.
E Amount does not include the portfolio activity of any underlying Fidelity Central Funds.
F Expense ratios reflect operating expenses of the class. Expenses before reductions do not reflect amounts reimbursed by the investment adviser or reductions from brokerage service arrangements or reductions from other expense offset arrangements and do not represent the amount paid by the class during periods when reimbursements or reductions occur. Expenses net of fee waivers reflect expenses after reimbursement by the investment adviser but prior to reductions from brokerage service arrangements or other expense offset arrangements. Expenses net of all reductions represent the net expenses paid by the class.
G Amount represents less than $.01 per share.
See accompanying notes which are an integral part of the financial statements.
Annual Report
Financial Highlights - Class B
Years ended October 31, | 2013 | 2012 | 2011 | 2010 | 2009 |
Selected Per-Share Data | | | | | |
Net asset value, beginning of period | $ 19.22 | $ 18.38 | $ 19.79 | $ 16.78 | $ 11.65 |
Income from Investment Operations | | | | | |
Net investment income (loss) C | (.11) | (.08) | (.05) | (.10) | (.04) |
Net realized and unrealized gain (loss) | 6.84 | 1.07 | (.85) | 3.39 | 5.17 |
Total from investment operations | 6.73 | .99 | (.90) | 3.29 | 5.13 |
Distributions from net realized gain | (.08) | (.15) | (.52) | (.28) | - |
Redemption fees added to paid in capital C | - G | - G | .01 | - G | - G |
Net asset value, end of period | $ 25.87 | $ 19.22 | $ 18.38 | $ 19.79 | $ 16.78 |
Total Return A, B | 35.14% | 5.45% | (4.68)% | 19.90% | 44.03% |
Ratios to Average Net Assets D, F | | | | | |
Expenses before reductions | 2.37% | 2.38% | 2.32% | 2.47% | 2.49% |
Expenses net of fee waivers, if any | 2.36% | 2.38% | 2.30% | 2.40% | 2.40% |
Expenses net of all reductions | 2.35% | 2.35% | 2.29% | 2.38% | 2.36% |
Net investment income (loss) | (.51)% | (.43)% | (.26)% | (.59)% | (.33)% |
Supplemental Data | | | | | |
Net assets, end of period (000 omitted) | $ 795 | $ 790 | $ 2,067 | $ 3,457 | $ 3,601 |
Portfolio turnover rate E | 54% | 68% | 47% | 66% | 81% |
A Total returns would have been lower if certain expenses had not been reduced during the applicable periods shown.
B Total returns do not include the effect of the contingent deferred sales charge.
C Calculated based on average shares outstanding during the period.
D Fees and expenses of any underlying Fidelity Central Funds are not included in the Fund's expense ratio. The Fund indirectly bears its proportionate share of the expenses of any underlying Fidelity Central Funds.
E Amount does not include the portfolio activity of any underlying Fidelity Central Funds.
F Expense ratios reflect operating expenses of the class. Expenses before reductions do not reflect amounts reimbursed by the investment adviser or reductions from brokerage service arrangements or reductions from other expense offset arrangements and do not represent the amount paid by the class during periods when reimbursements or reductions occur. Expenses net of fee waivers reflect expenses after reimbursement by the investment adviser but prior to reductions from brokerage service arrangements or other expense offset arrangements. Expenses net of all reductions represent the net expenses paid by the class.
G Amount represents less than $.01 per share.
See accompanying notes which are an integral part of the financial statements.
Annual Report
Financial Highlights - Class C
Years ended October 31, | 2013 | 2012 | 2011 | 2010 | 2009 |
Selected Per-Share Data | | | | | |
Net asset value, beginning of period | $ 19.18 | $ 18.38 | $ 19.85 | $ 16.85 | $ 11.70 |
Income from Investment Operations | | | | | |
Net investment income (loss) C | (.11) | (.08) | (.04) | (.10) | (.04) |
Net realized and unrealized gain (loss) | 6.79 | 1.07 | (.85) | 3.40 | 5.19 |
Total from investment operations | 6.68 | .99 | (.89) | 3.30 | 5.15 |
Distributions from net realized gain | (.18) | (.19) | (.59) | (.30) | - |
Redemption fees added to paid in capital C | - G | - G | .01 | - G | - G |
Net asset value, end of period | $ 25.68 | $ 19.18 | $ 18.38 | $ 19.85 | $ 16.85 |
Total Return A, B | 35.15% | 5.46% | (4.64)% | 19.86% | 44.02% |
Ratios to Average Net Assets D, F | | | | | |
Expenses before reductions | 2.33% | 2.38% | 2.27% | 2.42% | 2.49% |
Expenses net of fee waivers, if any | 2.33% | 2.38% | 2.26% | 2.40% | 2.40% |
Expenses net of all reductions | 2.32% | 2.35% | 2.24% | 2.37% | 2.36% |
Net investment income (loss) | (.47)% | (.43)% | (.21)% | (.59)% | (.33)% |
Supplemental Data | | | | | |
Net assets, end of period (000 omitted) | $ 13,426 | $ 6,799 | $ 9,545 | $ 13,501 | $ 5,814 |
Portfolio turnover rate E | 54% | 68% | 47% | 66% | 81% |
A Total returns would have been lower if certain expenses had not been reduced during the applicable periods shown.
B Total returns do not include the effect of the contingent deferred sales charge.
C Calculated based on average shares outstanding during the period.
D Fees and expenses of any underlying Fidelity Central Funds are not included in the Fund's expense ratio. The Fund indirectly bears its proportionate share of the expenses of any underlying Fidelity Central Funds.
E Amount does not include the portfolio activity of any underlying Fidelity Central Funds.
F Expense ratios reflect operating expenses of the class. Expenses before reductions do not reflect amounts reimbursed by the investment adviser or reductions from brokerage service arrangements or reductions from other expense offset arrangements and do not represent the amount paid by the class during periods when reimbursements or reductions occur. Expenses net of fee waivers reflect expenses after reimbursement by the investment adviser but prior to reductions from brokerage service arrangements or other expense offset arrangements. Expenses net of all reductions represent the net expenses paid by the class.
G Amount represents less than $.01 per share.
See accompanying notes which are an integral part of the financial statements.
Annual Report
Financial Highlights - International Small Cap
Years ended October 31, | 2013 | 2012 | 2011 | 2010 | 2009 |
Selected Per-Share Data | | | | | |
Net asset value, beginning of period | $ 19.99 | $ 19.23 | $ 20.66 | $ 17.48 | $ 12.03 |
Income from Investment Operations | | | | | |
Net investment income (loss) B | .12 | .11 | .17 | .07 | .08 |
Net realized and unrealized gain (loss) | 7.02 | 1.10 | (.89) | 3.53 | 5.37 |
Total from investment operations | 7.14 | 1.21 | (.72) | 3.60 | 5.45 |
Distributions from net investment income | (.14) | (.18) | (.06) | (.08) | - |
Distributions from net realized gain | (.33) | (.27) | (.66) | (.34) | - |
Total distributions | (.46) G | (.45) | (.72) | (.42) | - |
Redemption fees added to paid in capital B | - F | - F | .01 | - F | - F |
Net asset value, end of period | $ 26.67 | $ 19.99 | $ 19.23 | $ 20.66 | $ 17.48 |
Total Return A | 36.56% | 6.55% | (3.65)% | 21.02% | 45.30% |
Ratios to Average Net Assets C, E | | | | | |
Expenses before reductions | 1.33% | 1.35% | 1.26% | 1.44% | 1.48% |
Expenses net of fee waivers, if any | 1.32% | 1.35% | 1.25% | 1.44% | 1.48% |
Expenses net of all reductions | 1.31% | 1.33% | 1.23% | 1.42% | 1.44% |
Net investment income (loss) | .53% | .59% | .80% | .37% | .58% |
Supplemental Data | | | | | |
Net assets, end of period (000 omitted) | $ 1,029,629 | $ 692,769 | $ 856,692 | $ 808,478 | $ 669,035 |
Portfolio turnover rate D | 54% | 68% | 47% | 66% | 81% |
A Total returns would have been lower if certain expenses had not been reduced during the applicable periods shown.
B Calculated based on average shares outstanding during the period.
C Fees and expenses of any underlying Fidelity Central Funds are not included in the Fund's expense ratio. The Fund indirectly bears its proportionate share of the expenses of any underlying Fidelity Central Funds.
D Amount does not include the portfolio activity of any underlying Fidelity Central Funds.
E Expense ratios reflect operating expenses of the class. Expenses before reductions do not reflect amounts reimbursed by the investment adviser or reductions from brokerage service arrangements or reductions from other expense offset arrangements and do not represent the amount paid by the class during periods when reimbursements or reductions occur. Expenses net of fee waivers reflect expenses after reimbursement by the investment adviser but prior to reductions from brokerage service arrangements or other expense offset arrangements. Expenses net of all reductions represent the net expenses paid by the class.
F Amount represents less than $.01 per share.
G Total distributions of $.46 per share is comprised of distributions from net investment income of $.136 and distributions from net realized gain of $.327 per share.
See accompanying notes which are an integral part of the financial statements.
Annual Report
Financial Highlights - Institutional Class
Years ended October 31, | 2013 | 2012 | 2011 | 2010 | 2009 |
Selected Per-Share Data | | | | | |
Net asset value, beginning of period | $ 20.00 | $ 19.24 | $ 20.66 | $ 17.47 | $ 12.01 |
Income from Investment Operations | | | | | |
Net investment income (loss) B | .16 | .13 | .18 | .09 | .09 |
Net realized and unrealized gain (loss) | 7.00 | 1.10 | (.89) | 3.53 | 5.37 |
Total from investment operations | 7.16 | 1.23 | (.71) | 3.62 | 5.46 |
Distributions from net investment income | (.16) | (.20) | (.06) | (.09) | - |
Distributions from net realized gain | (.33) | (.27) | (.66) | (.34) | - |
Total distributions | (.49) | (.47) | (.72) | (.43) | - |
Redemption fees added to paid in capital B | - F | - F | .01 | - F | - F |
Net asset value, end of period | $ 26.67 | $ 20.00 | $ 19.24 | $ 20.66 | $ 17.47 |
Total Return A | 36.68% | 6.65% | (3.62)% | 21.15% | 45.46% |
Ratios to Average Net Assets C, E | | | | | |
Expenses before reductions | 1.20% | 1.25% | 1.22% | 1.34% | 1.45% |
Expenses net of fee waivers, if any | 1.20% | 1.25% | 1.21% | 1.34% | 1.40% |
Expenses net of all reductions | 1.18% | 1.22% | 1.19% | 1.31% | 1.37% |
Net investment income (loss) | .66% | .70% | .84% | .47% | .66% |
Supplemental Data | | | | | |
Net assets, end of period (000 omitted) | $ 67,038 | $ 9,503 | $ 15,752 | $ 8,231 | $ 2,696 |
Portfolio turnover rate D | 54% | 68% | 47% | 66% | 81% |
A Total returns would have been lower if certain expenses had not been reduced during the applicable periods shown.
B Calculated based on average shares outstanding during the period.
C Fees and expenses of any underlying Fidelity Central Funds are not included in the Fund's expense ratio. The Fund indirectly bears its proportionate share of the expenses of any underlying Fidelity Central Funds.
D Amount does not include the portfolio activity of any underlying Fidelity Central Funds.
E Expense ratios reflect operating expenses of the class. Expenses before reductions do not reflect amounts reimbursed by the investment adviser or reductions from brokerage service arrangements or reductions from other expense offset arrangements and do not represent the amount paid by the class during periods when reimbursements or reductions occur. Expenses net of fee waivers reflect expenses after reimbursement by the investment adviser but prior to reductions from brokerage service arrangements or other expense offset arrangements. Expenses net of all reductions represent the net expenses paid by the class.
F Amount represents less than $.01 per share.
See accompanying notes which are an integral part of the financial statements.
Annual Report
Notes to Financial Statements
For the period ended October 31, 2013
1. Organization.
Fidelity International Small Cap Fund (the Fund) is a fund of Fidelity Investment Trust (the Trust) and is authorized to issue an unlimited number of shares. The Trust is registered under the Investment Company Act of 1940, as amended (the 1940 Act), as an open-end management investment company organized as a Massachusetts business trust. The Fund offers Class A, Class T, Class C, International Small Cap and Institutional Class shares, each of which, along with Class B shares, has equal rights as to assets and voting privileges. Class B shares are closed to new accounts and additional purchases, except for exchanges and reinvestments. Each class has exclusive voting rights with respect to matters that affect that class. Class B shares will automatically convert to Class A shares after a holding period of seven years from the initial date of purchase. The Fund's investments in emerging markets can be subject to social, economic, regulatory, and political uncertainties and can be extremely volatile.
2. Investments in Fidelity Central Funds.
The Fund invests in Fidelity Central Funds, which are open-end investment companies generally available only to other investment companies and accounts managed by Fidelity Management & Research Company (FMR) and its affiliates. The Fund's Schedule of Investments lists each of the Fidelity Central Funds held as of period end, if any, as an investment of the Fund, but does not include the underlying holdings of each Fidelity Central Fund. As an Investing Fund, the Fund indirectly bears its proportionate share of the expenses of the underlying Fidelity Central Funds.
The Money Market Central Funds seek preservation of capital and current income and are managed by Fidelity Investments Money Management, Inc. (FIMM), an affiliate of FMR.
A complete unaudited list of holdings for each Fidelity Central Fund is available upon request or at the Securities and Exchange Commission (the SEC) website at www.sec.gov. In addition, the financial statements of the Fidelity Central Funds, which are not covered by the Fund's Report of Independent Registered Public Accounting Firm, are available on the SEC website or upon request.
3. Significant Accounting Policies.
The financial statements have been prepared in conformity with accounting principles generally accepted in the United States of America (GAAP), which require management to make certain estimates and assumptions at the date of the financial statements. Actual results could differ from those estimates. Subsequent events, if any, through the date that the financial statements were issued have been evaluated in the preparation of
Annual Report
3. Significant Accounting Policies - continued
the financial statements. The following summarizes the significant accounting policies of the Fund:
Investment Valuation. Investments are valued as of 4:00 p.m. Eastern time on the last calendar day of the period. In accordance with valuation policies and procedures approved by the Board of Trustees (the Board), the Fund attempts to obtain prices from one or more third party pricing vendors or brokers to value its investments. When current market prices, quotations or currency exchange rates are not readily available or reliable, investments will be fair valued in good faith by the FMR Fair Value Committee (the Committee), in accordance with procedures adopted by the Board. Factors used in determining fair value vary by investment type and may include market or investment specific events, changes in interest rates and credit quality. The frequency with which these procedures are used cannot be predicted and they may be utilized to a significant extent. The Committee oversees the Fund's valuation policies and procedures and is responsible for approving and reporting to the Board all fair value determinations.
The Fund categorizes the inputs to valuation techniques used to value its investments into a disclosure hierarchy consisting of three levels as shown below:
Level 1 - quoted prices in active markets for identical investments
Level 2 - other significant observable inputs (including quoted prices for similar investments, interest rates, prepayment speeds, etc.)
Level 3 - unobservable inputs (including the Fund's own assumptions based on the best information available)
Valuation techniques used to value the Fund's investments by major category are as follows:
Equity securities, including restricted securities, for which market quotations are readily available, are valued at the last reported sale price or official closing price as reported by a third party pricing vendor on the primary market or exchange on which they are traded and are categorized as Level 1 in the hierarchy. In the event there were no sales during the day or closing prices are not available, securities are valued at the last quoted bid price or may be valued using the last available price and are generally categorized as Level 2 in the hierarchy. For foreign equity securities, when market or security specific events arise, comparisons to the valuation of American Depositary Receipts (ADRs), futures contracts, Exchange-Traded Funds (ETFs) and certain indexes as well as quoted prices for similar securities may be used and would be categorized as Level 2 in the hierarchy. Utilizing these techniques may result in transfers between Level 1 and Level 2. For equity securities, including restricted securities, where observable inputs are limited, assumptions about market activity and risk are used and these securities may be categorized as Level 3 in the hierarchy.
Annual Report
Notes to Financial Statements - continued
3. Significant Accounting Policies - continued
Investment Valuation - continued
Debt securities, including restricted securities, are valued based on evaluated prices received from third party pricing vendors or from brokers who make markets in such securities. For corporate bonds, pricing vendors utilize matrix pricing which considers yield or price of bonds of comparable quality, coupon, maturity and type as well as broker-supplied prices. When independent prices are unavailable or unreliable, debt securities may be valued utilizing pricing methodologies which consider similar factors that would be used by third party pricing vendors. Debt securities are generally categorized as Level 2 in the hierarchy but may be Level 3 depending on the circumstances.
Investments in open-end mutual funds, including the Fidelity Central Funds, are valued at their closing net asset value (NAV) each business day and are categorized as Level 1 in the hierarchy.
Changes in valuation techniques may result in transfers in or out of an assigned level within the disclosure hierarchy. The aggregate value of investments by input level, as of October 31, 2013, including information on transfers between Levels 1 and 2, as well as a roll forward of Level 3 investments, is included at the end of the Fund's Schedule of Investments.
Foreign Currency. The Fund may use foreign currency contracts to facilitate transactions in foreign-denominated securities. Gains and losses from these transactions may arise from changes in the value of the foreign currency or if the counterparties do not perform under the contracts' terms.
Foreign-denominated assets, including investment securities, and liabilities are translated into U.S. dollars at the exchange rates at period end. Purchases and sales of investment securities, income and dividends received and expenses denominated in foreign currencies are translated into U.S. dollars at the exchange rate in effect on the transaction date.
The effects of exchange rate fluctuations on investments are included with the net realized and unrealized gain (loss) on investment securities. Other foreign currency transactions resulting in realized and unrealized gain (loss) are disclosed separately.
Investment Transactions and Income. For financial reporting purposes, the Fund's investment holdings and NAV include trades executed through the end of the last business day of the period. The NAV per share for processing shareholder transactions is calculated as of the close of business of the New York Stock Exchange (NYSE), normally 4:00 p.m. Eastern time and includes trades executed through the end of the prior business day. Gains and losses on securities sold are determined on the basis of identified cost. Dividend income is recorded on the ex-dividend date, except for certain dividends
Annual Report
3. Significant Accounting Policies - continued
Investment Transactions and Income - continued
from foreign securities where the ex-dividend date may have passed, which are recorded as soon as the Fund is informed of the ex-dividend date. Non-cash dividends included in dividend income, if any, are recorded at the fair market value of the securities received. Interest income and distributions from the Fidelity Central Funds are accrued as earned. Interest income includes coupon interest and amortization of premium and accretion of discount on debt securities. Investment income is recorded net of foreign taxes withheld where recovery of such taxes is uncertain.
Class Allocations and Expenses. Investment income, realized and unrealized capital gains and losses, common expenses of the Fund, and certain fund-level expense reductions, if any, are allocated daily on a pro-rata basis to each class based on the relative net assets of each class to the total net assets of the Fund. Each class differs with respect to transfer agent and distribution and service plan fees incurred. Certain expense reductions may also differ by class. For the reporting period, the allocated portion of income and expenses to each class as a percent of its average net assets may vary due to the timing of recording these transactions in relation to fluctuating net assets of the classes. Expenses directly attributable to a fund are charged to that fund. Expenses attributable to more than one fund are allocated among the respective funds on the basis of relative net assets or other appropriate methods. Expense estimates are accrued in the period to which they relate and adjustments are made when actual amounts are known.
Income Tax Information and Distributions to Shareholders. Each year, the Fund intends to qualify as a regulated investment company under Subchapter M of the Internal Revenue Code, including distributing substantially all of its taxable income and realized gains. As a result, no provision for U.S. Federal income taxes is required. As of October 31, 2013, the Fund did not have any unrecognized tax benefits in the financial statements; nor is the Fund aware of any tax positions for which it is reasonably possible that the total amounts of unrecognized tax benefits will significantly change in the next twelve months. The Fund files a U.S. federal tax return, in addition to state and local tax returns as required. The Fund's federal income tax returns are subject to examination by the Internal Revenue Service (IRS) for a period of three fiscal years after they are filed. State and local tax returns may be subject to examination for an additional fiscal year depending on the jurisdiction. Foreign taxes are provided for based on the Fund's understanding of the tax rules and rates that exist in the foreign markets in which it invests.
Distributions are declared and recorded on the ex-dividend date. Income dividends and capital gain distributions are declared separately for each class. Income and capital gain distributions are determined in accordance with income tax regulations, which may
Annual Report
Notes to Financial Statements - continued
3. Significant Accounting Policies - continued
Income Tax Information and Distributions to Shareholders - continued
differ from GAAP. In addition, the Fund claimed a portion of the payment made to redeeming shareholders as a distribution for income tax purposes.
Capital accounts within the financial statements are adjusted for permanent book-tax differences. These adjustments have no impact on net assets or the results of operations. Temporary book-tax differences will reverse in a subsequent period.
Book-tax differences are primarily due to futures transactions, foreign currency transactions, passive foreign investment companies (PFIC), capital loss carryforwards and losses deferred due to wash sales.
The federal tax cost of investment securities and unrealized appreciation (depreciation) as of period end were as follows:
Gross unrealized appreciation | $ 278,457,935 |
Gross unrealized depreciation | (70,365,537) |
Net unrealized appreciation (depreciation) on securities and other investments | $ 208,092,398 |
| |
Tax Cost | $ 972,419,894 |
The tax-based components of distributable earnings as of period end were as follows:
Undistributed ordinary income | $ 30,190,846 |
Capital loss carryforward | $ (30,539,357) |
Net unrealized appreciation (depreciation) | $ 208,068,569 |
Capital loss carryforwards are only available to offset future capital gains of the Fund to the extent provided by regulations and may be limited. Under the Regulated Investment Company Modernization Act of 2010 (the Act), the Fund is permitted to carry forward capital losses incurred in taxable years beginning after December 22, 2010 for an unlimited period and such capital losses are required to be used prior to any losses that expire. The capital loss carryforward information presented below, including any applicable limitation, is estimated as of fiscal period end and is subject to adjustment.
Fiscal year of expiration | |
2017 | $ (30,539,357) |
The tax character of distributions paid was as follows:
| October 31, 2013 | October 31, 2012 |
Ordinary Income | $ 16,524,337 | $ 20,594,102 |
Annual Report
3. Significant Accounting Policies - continued
Short-Term Trading (Redemption) Fees. Shares held by investors in the Fund less than 90 days may have been subject to a redemption fee equal to 2.00% of the net asset value of shares redeemed. All redemption fees, which reduce the proceeds of the shareholder redemption, are retained by the Fund and accounted for as an addition to paid in capital.
Restricted Securities. The Fund may invest in securities that are subject to legal or contractual restrictions on resale. These securities generally may be resold in transactions exempt from registration or to the public if the securities are registered. Disposal of these securities may involve time-consuming negotiations and expense, and prompt sale at an acceptable price may be difficult. Information regarding restricted securities is included at the end of the Fund's Schedule of Investments.
New Accounting Pronouncement. The Financial Accounting Standards Board issued in December 2011, Accounting Standard Update No. 2011-11, Disclosures about Offsetting Assets and Liabilities, and in January 2013, Accounting Standards Update No. 2013-1 Clarifying the Scope of Disclosures about Offsetting Assets and Liabilities. These updates create new disclosure requirements requiring entities to disclose both gross and net information for derivatives and other financial instruments that are either offset in the Statement of Assets and Liabilities or subject to an enforceable master netting arrangement or similar agreement. The disclosure requirements are effective for annual reporting periods beginning on or after January 1, 2013, and interim periods within those annual periods. Management expects that the impact of the updates' adoption will be limited to additional financial statement disclosures as applicable.
4. Derivative Instruments.
Risk Exposures and the Use of Derivative Instruments. The Fund's investment objective allows the Fund to enter into various types of derivative contracts, including futures contracts. Derivatives are investments whose value is primarily derived from underlying assets, indices or reference rates and may be transacted on an exchange or over-the-counter (OTC). Derivatives may involve a future commitment to buy or sell a specified asset based on specified terms, to exchange future cash flows at periodic intervals based on a notional principal amount, or for one party to make one or more payments upon the occurrence of specified events in exchange for periodic payments from the other party.
The Fund used derivatives to increase returns and to manage exposure to certain risks as defined below. The success of any strategy involving derivatives depends on analysis of numerous economic factors, and if the strategies for investment do not work as intended, the Fund may not achieve its objectives.
Annual Report
Notes to Financial Statements - continued
4. Derivative Instruments - continued
Risk Exposures and the Use of Derivative Instruments - continued
The Fund's use of derivatives increased or decreased its exposure to the following risk:
Equity Risk | Equity risk relates to the fluctuations in the value of financial instruments as a result of changes in market prices (other than those arising from interest rate risk or foreign exchange risk), whether caused by factors specific to an individual investment, its issuer, or all factors affecting all instruments traded in a market or market segment. |
The Fund is also exposed to additional risks from investing in derivatives, such as liquidity risk and counterparty credit risk. Liquidity risk is the risk that the Fund will be unable to close out the derivative in the open market in a timely manner. Counterparty credit risk is the risk that the counterparty will not be able to fulfill its obligation to the Fund. Counterparty credit risk related to exchange-traded futures contracts may be mitigated by the protection provided by the exchange on which they trade.
Investing in derivatives may involve greater risks than investing in the underlying assets directly and, to varying degrees, may involve risk of loss in excess of any initial investment and collateral received and amounts recognized in the Statement of Assets and Liabilities. In addition, there may be the risk that the change in value of the derivative contract does not correspond to the change in value of the underlying instrument.
Futures Contracts. A futures contract is an agreement between two parties to buy or sell a specified underlying instrument for a fixed price at a specified future date. The Fund used futures contracts to manage its exposure to the stock market.
Upon entering into a futures contract, a fund is required to deposit either cash or securities (initial margin) with a clearing broker in an amount equal to a certain percentage of the face value of the contract. Futures contracts are marked-to-market daily and subsequent daily payments (variation margin) are made or received by a fund depending on the daily fluctuations in the value of the futures contracts and are recorded as unrealized appreciation or (depreciation). This receivable and/or payable, if any, is included in daily variation margin for derivative instruments in the Statement of Assets and Liabilities. Realized gain or (loss) is recorded upon the expiration or closing of a futures contract.
Any open futures contracts at period end are presented in the Schedule of Investments under the caption "Futures Contracts." The underlying face amount at value reflects each contract's exposure to the underlying instrument or index at period end.
During the period the Fund recognized net realized gain (loss) of $(80,042) related to its investment in futures contracts. This amount is included in the Statement of Operations.
Annual Report
5. Purchases and Sales of Investments.
Purchases and sales of securities, other than short-term securities, aggregated $556,944,991 and $443,858,751, respectively.
6. Fees and Other Transactions with Affiliates.
Management Fee. FMR and its affiliates provide the Fund with investment management related services for which the Fund pays a monthly management fee. The management fee is the sum of an individual fund fee rate that is based on an annual rate of .60% of the Fund's average net assets and an annualized group fee rate that averaged .25% during the period. The group fee rate is based upon the average net assets of all the mutual funds advised by FMR, including any mutual funds previously advised by FMR that are currently advised by Fidelity SelectCo, LLC, an affiliate of FMR. The group fee rate decreases as assets under management increase and increases as assets under management decrease. In addition, the management fee is subject to a performance adjustment (up to a maximum of ± .20% of the Fund's average net assets over a 36 month performance period). The upward or downward adjustment to the management fee is based on the relative investment performance of International Small Cap as compared to an appropriate benchmark index over the same 36 month performance period. For the reporting period, the total annual management fee rate, including the performance adjustment, was .96% of the Fund's average net assets. The performance adjustment included in the management fee rate may be higher or lower than the maximum performance adjustment rate due to the difference between the average net assets for the reporting and performance periods.
Distribution and Service Plan Fees. In accordance with Rule 12b-1 of the 1940 Act, the Fund has adopted separate Distribution and Service Plans for each class of shares. Certain classes pay Fidelity Distributors Corporation (FDC), an affiliate of FMR, separate Distribution and Service Fees, each of which is based on an annual percentage of each class' average net assets. In addition, FDC may pay financial intermediaries for selling shares of the Fund and providing shareholder support services. For the period, the Distribution and Service Fee rates, total fees and amounts retained by FDC were as follows:
| Distribution
Fee | Service
Fee | Total Fees | Retained
by FDC |
Class A | -% | .25% | $ 42,679 | $ 1,371 |
Class T | .25% | .25% | 51,556 | 91 |
Class B | .75% | .25% | 7,500 | 5,677 |
Class C | .75% | .25% | 90,439 | 12,749 |
| | | $ 192,174 | $ 19,888 |
Annual Report
Notes to Financial Statements - continued
6. Fees and Other Transactions with Affiliates - continued
Sales Load. FDC may receive a front-end sales charge of up to 5.75% for selling Class A shares and 3.50% for selling Class T shares, some of which is paid to financial intermediaries for selling shares of the Fund. Depending on the holding period, FDC may receive contingent deferred sales charges levied on Class A, Class T, Class B, and Class C redemptions. The deferred sales charges range from 5.00% to 1.00% for Class B shares, 1.00% for Class C shares, 1.00% for certain purchases of Class A shares and .25% for certain purchases of Class T shares.
For the period, sales charge amounts retained by FDC were as follows:
| Retained
by FDC |
Class A | $ 13,853 |
Class T | 2,743 |
Class B* | 143 |
Class C* | 1,699 |
| $ 18,438 |
* When Class B and Class C shares are initially sold, FDC pays commissions from its own resources to financial intermediaries through which the sales
are made.
Transfer Agent Fees. Fidelity Investments Institutional Operations Company, Inc., (FIIOC), an affiliate of FMR, is the transfer, dividend disbursing and shareholder servicing agent for each class of the Fund. FIIOC receives account fees and asset-based fees that vary according to the account size and type of account of the shareholders of the respective classes of the Fund. FIIOC pays for typesetting, printing and mailing of shareholder reports, except proxy statements.
For the period, transfer agent fees for each class were as follows:
| Amount | % of
Average
Net Assets |
Class A | $ 50,833 | .30 |
Class T | 31,476 | .30 |
Class B | 2,235 | .30 |
Class C | 24,673 | .27 |
International Small Cap | 2,068,757 | .26 |
Institutional Class | 27,668 | .13 |
| $ 2,205,642 | |
Accounting and Security Lending Fees. Fidelity Service Company, Inc. (FSC), an affiliate of FMR, maintains the Fund's accounting records. The accounting fee is based on the level of average net assets for each month. Under a separate contract, FSC administers the security lending program. The security lending fee is based on the number and duration of lending transactions.
Annual Report
6. Fees and Other Transactions with Affiliates - continued
Brokerage Commissions. The Fund placed a portion of its portfolio transactions with brokerage firms which are affiliates of the investment adviser. Brokerage commissions are included in net realized gain (loss) and change in net unrealized appreciation (depreciation) in the Statement of Operations. The commissions paid to these affiliated firms were $510 for the period.
Other. During the period, FMR reimbursed the Fund for certain losses in the amount of $80,334.
7. Committed Line of Credit.
The Fund participates with other funds managed by FMR or an affiliate in a $4.25 billion credit facility (the "line of credit") to be utilized for temporary or emergency purposes to fund shareholder redemptions or for other short-term liquidity purposes. The Fund has agreed to pay commitment fees on its pro-rata portion of the line of credit, which amounted to $1,779 and is reflected in Miscellaneous expenses on the Statement of Operations. During the period, there were no borrowings on this line of credit.
8. Security Lending.
The Fund lends portfolio securities through a lending agent from time to time in order to earn additional income. For equity securities, a lending agent is used and may loan securities to certain qualified borrowers, including Fidelity Capital Markets (FCM), a broker-dealer affiliated with the Fund. On the settlement date of the loan, the Fund receives collateral (in the form of U.S. Treasury obligations, letters of credit and/or cash) against the loaned securities and maintains collateral in an amount not less than 100% of the market value of the loaned securities during the period of the loan. The market value of the loaned securities is determined at the close of business of the Fund and any additional required collateral is delivered to the Fund on the next business day. If the borrower defaults on its obligation to return the securities loaned because of insolvency or other reasons, the Fund may apply collateral received from the borrower against the obligation. The Fund may experience delays and costs in recovering the securities loaned. Any cash collateral received is invested in the Fidelity Securities Lending Cash Central Fund. The value of loaned securities and cash collateral at period end are disclosed on the Fund's Statement of Assets and Liabilities. The value of securities loaned to FCM at period end was $73,568. Security lending income represents the income earned on investing cash collateral, less rebates paid to borrowers and any lending agent fees associated with the loan, plus any premium payments received for lending certain types of securities. Security lending income is presented in the Statement of Operations as a component of income from Fidelity Central Funds. Total security lending income during the period amounted to $663,324, including $3,759 from securities loaned to FCM.
Annual Report
Notes to Financial Statements - continued
9. Expense Reductions.
Commissions paid to certain brokers with whom FMR, or its affiliates, places trades on behalf of the Fund include an amount in addition to trade execution, which may be rebated back to the Fund to offset certain expenses. This amount totaled $113,128 for the period.
In addition, FMR reimbursed a portion of the Fund's operating expenses during the period in the amount of $29,243.
10. Distributions to Shareholders.
Distributions to shareholders of each class were as follows:
Years ended October 31, | 2013 | 2012 |
From net investment income | | |
Class A | $ 53,369 | $ 98,060 |
Class T | - | 18,440 |
International Small Cap | 4,638,246 | 7,747,338 |
Institutional Class | 77,935 | 152,585 |
Total | $ 4,769,550 | $ 8,016,423 |
From net realized gain | | |
Class A | $ 235,834 | $ 246,964 |
Class T | 146,972 | 172,958 |
Class B | 3,106 | 15,448 |
Class C | 61,233 | 91,928 |
International Small Cap | 11,152,248 | 11,838,630 |
Institutional Class | 155,394 | 211,751 |
Total | $ 11,754,787 | $ 12,577,679 |
11. Share Transactions.
Transactions for each class of shares were as follows:
| Shares | Dollars |
Years ended October 31, | 2013 | 2012 | 2013 | 2012 |
Class A | | | | |
Shares sold | 398,633 | 190,464 | $ 9,321,444 | $ 3,581,689 |
Reinvestment of distributions | 13,843 | 18,159 | 269,801 | 323,949 |
Shares redeemed | (215,812) | (398,912) | (4,750,681) | (7,484,565) |
Net increase (decrease) | 196,664 | (190,289) | $ 4,840,564 | $ (3,578,927) |
Class T | | | | |
Shares sold | 141,247 | 67,193 | $ 3,379,516 | $ 1,245,760 |
Reinvestment of distributions | 7,380 | 10,478 | 143,239 | 185,991 |
Shares redeemed | (104,387) | (336,074) | (2,281,922) | (6,220,818) |
Net increase (decrease) | 44,240 | (258,403) | $ 1,240,833 | $ (4,789,067) |
Annual Report
11. Share Transactions - continued
| Shares | Dollars |
Years ended October 31, | 2013 | 2012 | 2013 | 2012 |
Class B | | | | |
Shares sold | 4,525 | 1,171 | $ 108,233 | $ 21,568 |
Reinvestment of distributions | 157 | 825 | 3,023 | 14,430 |
Shares redeemed | (15,050) | (73,396) | (330,538) | (1,354,968) |
Net increase (decrease) | (10,368) | (71,400) | $ (219,282) | $ (1,318,970) |
Class C | | | | |
Shares sold | 275,046 | 95,047 | $ 6,270,694 | $ 1,772,779 |
Reinvestment of distributions | 2,855 | 4,830 | 54,609 | 84,289 |
Shares redeemed | (109,571) | (264,717) | (2,419,306) | (4,745,500) |
Net increase (decrease) | 168,330 | (164,840) | $ 3,905,997 | $ (2,888,432) |
International Small Cap | | | | |
Shares sold | 11,248,438 | 4,700,621 | $ 266,912,412 | $ 88,441,440 |
Reinvestment of distributions | 770,505 | 1,033,828 | 15,163,539 | 18,629,579 |
Shares redeemed | (8,061,607) | (15,631,544) | (180,218,306) | (292,428,231) |
Net increase (decrease) | 3,957,336 | (9,897,095) | $ 101,857,645 | $ (185,357,212) |
Institutional Class | | | | |
Shares sold | 2,333,500 | 199,584 | $ 57,218,863 | $ 3,790,776 |
Reinvestment of distributions | 8,409 | 15,793 | 165,323 | 284,438 |
Shares redeemed | (303,629) | (559,093) | (6,792,002) | (10,329,992) |
Net increase (decrease) | 2,038,280 | (343,716) | $ 50,592,184 | $ (6,254,778) |
12. Other.
The Fund's organizational documents provide former and current trustees and officers with a limited indemnification against liabilities arising in connection with the performance of their duties to the Fund. In the normal course of business, the Fund may also enter into contracts that provide general indemnifications. The Fund's maximum exposure under these arrangements is unknown as this would be dependent on future claims that may be made against the Fund. The risk of material loss from such claims is considered remote.
At the end of the period, FMR or its affiliates were the owners of record of 13% of the total outstanding shares of the Fund.
Annual Report
Report of Independent Registered Public Accounting Firm
To the Trustees of Fidelity Investment Trust and Shareholders of Fidelity International Small Cap Fund:
We have audited the accompanying statement of assets and liabilities of Fidelity International Small Cap Fund (the Fund), a fund of Fidelity Investment Trust, including the schedule of investments, as of October 31, 2013, and the related statement of operations for the year then ended, the statement of changes in net assets for each of the two years in the period then ended, and the financial highlights for each of the five years in the period then ended. These financial statements and financial highlights are the responsibility of the Fund's management. Our responsibility is to express an opinion on these financial statements and financial highlights based on our audits.
We conducted our audits in accordance with the standards of the Public Company Accounting Oversight Board (United States). Those standards require that we plan and perform the audit to obtain reasonable assurance about whether the financial statements and financial highlights are free of material misstatement. The Fund is not required to have, nor were we engaged to perform, an audit of its internal control over financial reporting. Our audits included consideration of internal control over financial reporting as a basis for designing audit procedures that are appropriate in the circumstances, but not for the purpose of expressing an opinion on the effectiveness of the Fund's internal control over financial reporting. Accordingly, we express no such opinion. An audit also includes examining, on a test basis, evidence supporting the amounts and disclosures in the financial statements, assessing the accounting principles used and significant estimates made by management, as well as evaluating the overall financial statement presentation. Our procedures included confirmation of securities owned as of October 31, 2013, by correspondence with the custodians and brokers; where replies were not received from brokers, we performed other auditing procedures. We believe that our audits provide a reasonable basis for our opinion.
In our opinion, the financial statements and financial highlights referred to above present fairly, in all material respects, the financial position of Fidelity International Small Cap Fund as of October 31, 2013, the results of its operations for the year then ended, the changes in its net assets for each of the two years in the period then ended, and the financial highlights for each of the five years in the period then ended, in conformity with accounting principles generally accepted in the United States of America.
DELOITTE & TOUCHE LLP
Boston, Massachusetts
December 13, 2013
Annual Report
Trustees and Officers
The Trustees, Member of the Advisory Board, and executive officers of the trust and fund, as applicable, are listed below. The Board of Trustees governs the fund and is responsible for protecting the interests of shareholders. The Trustees are experienced executives who meet periodically throughout the year to oversee the fund's activities, review contractual arrangements with companies that provide services to the fund, oversee management of the risks associated with such activities and contractual arrangements, and review the fund's performance. Except for James C. Curvey, Ned C. Lautenbach, Ronald P. O'Hanley, and William S. Stavropoulos, each of the Trustees oversees 171 funds. Mr. Curvey oversees 394 funds. Mr. Lautenbach, Mr. O'Hanley, and Mr. Stavropoulos each oversees 245 funds.
The Trustees hold office without limit in time except that (a) any Trustee may resign; (b) any Trustee may be removed by written instrument, signed by at least two-thirds of the number of Trustees prior to such removal; (c) any Trustee who requests to be retired or who has become incapacitated by illness or injury may be retired by written instrument signed by a majority of the other Trustees; and (d) any Trustee may be removed at any special meeting of shareholders by a two-thirds vote of the outstanding voting securities of the trust. Each Trustee who is not an interested person of the trust and the fund (as defined in the 1940 Act) (Independent Trustee), shall retire not later than the last day of the calendar year in which his or her 75th birthday occurs. The Independent Trustees may waive this mandatory retirement age policy with respect to individual Trustees. The executive officers and Advisory Board Member hold office without limit in time, except that any officer and Advisory Board Member may resign or may be removed by a vote of a majority of the Trustees at any regular meeting or any special meeting of the Trustees. Except as indicated, each individual has held the office shown or other offices in the same company for the past five years.
Experience, Skills, Attributes, and Qualifications of the Fund's Trustees. The Governance and Nominating Committee has adopted a statement of policy that describes the experience, qualifications, attributes, and skills that are necessary and desirable for potential Independent Trustee candidates (Statement of Policy). The Board believes that each Trustee satisfied at the time he or she was initially elected or appointed a Trustee, and continues to satisfy, the standards contemplated by the Statement of Policy. The Governance and Nominating Committee also engages professional search firms to help identify potential Independent Trustee candidates who have the experience, qualifications, attributes, and skills consistent with the Statement of Policy. From time to time, additional criteria based on the composition and skills of the current Independent Trustees, as well as experience or skills that may be appropriate in light of future changes to board composition, business conditions, and regulatory or other developments, have also been considered by the professional search firms and the Governance and Nominating Committee. In addition, the Board takes into account the Trustees' commitment and participation in Board and committee meetings, as well as their leadership of standing and ad hoc committees throughout their tenure.
Annual Report
Trustees and Officers - continued
In determining that a particular Trustee was and continues to be qualified to serve as a Trustee, the Board has considered a variety of criteria, none of which, in isolation, was controlling. The Board believes that, collectively, the Trustees have balanced and diverse experience, qualifications, attributes, and skills, which allow the Board to operate effectively in governing the fund and protecting the interests of shareholders. Information about the specific experience, skills, attributes, and qualifications of each Trustee, which in each case led to the Board's conclusion that the Trustee should serve (or continue to serve) as a trustee of the fund, is provided below.
Board Structure and Oversight Function. James C. Curvey is an interested person (as defined in the 1940 Act) and currently serves as Chairman. The Trustees have determined that an interested Chairman is appropriate and benefits shareholders because an interested Chairman has a personal and professional stake in the quality and continuity of services provided to the fund. Independent Trustees exercise their informed business judgment to appoint an individual of their choosing to serve as Chairman, regardless of whether the Trustee happens to be independent or a member of management. The Independent Trustees have determined that they can act independently and effectively without having an Independent Trustee serve as Chairman and that a key structural component for assuring that they are in a position to do so is for the Independent Trustees to constitute a substantial majority for the Board. The Independent Trustees also regularly meet in executive session. Ned C. Lautenbach serves as Chairman of the Independent Trustees and as such (i) acts as a liaison between the Independent Trustees and management with respect to matters important to the Independent Trustees and (ii) with management prepares agendas for Board meetings.
Fidelity funds are overseen by different Boards of Trustees. The fund's Board oversees Fidelity's equity and high income funds and another Board oversees Fidelity's investment-grade bond, money market, and asset allocation funds. The asset allocation funds may invest in Fidelity funds overseen by the fund's Board. The use of separate Boards, each with its own committee structure, allows the Trustees of each group of Fidelity funds to focus on the unique issues of the funds they oversee, including common research, investment, and operational issues. On occasion, the separate Boards establish joint committees to address issues of overlapping consequences for the Fidelity funds overseen by each Board.
The Trustees operate using a system of committees to facilitate the timely and efficient consideration of all matters of importance to the Trustees, the fund, and fund shareholders and to facilitate compliance with legal and regulatory requirements and oversight of the fund's activities and associated risks. The Board, acting through its committees, has charged FMR and its affiliates with (i) identifying events or circumstances the occurrence of which could have demonstrably adverse effects on the fund's business and/or reputation; (ii) implementing processes and controls to lessen the possibility that such events or circumstances occur or to mitigate the effects of such events or circumstances if they do occur; and (iii) creating and maintaining a system designed to evaluate continuously business and market conditions in order to facilitate the identification and implementation processes described in (i) and (ii) above. Because the day-to-day operations and activities of the fund are carried out by or through FMR, its affiliates and other service providers, the fund's exposure to risks is mitigated but not eliminated by the processes overseen by the Trustees. While each of the Board's committees has responsibility for overseeing different aspects of the fund's activities, oversight is exercised primarily through the Operations, Audit, and Compliance Committees. In addition, the Independent Trustees have worked with FMR to enhance the Board's oversight of investment and financial risks, legal and regulatory risks, technology risks, and operational risks, including the development of additional risk reporting to the Board. For example, a working group comprised of Independent Trustees and FMR has worked and continues to work to review the Fidelity funds' valuation-related activities, reporting and risk management. Appropriate personnel, including but not limited to the fund's Chief Compliance Officer (CCO), FMR's internal auditor, the independent accountants, the fund's Treasurer and portfolio management personnel, make periodic reports to the Board's committees, as appropriate, including an annual review of FMR's risk management program for the Fidelity funds. The responsibilities of each standing committee, including their oversight responsibilities, are described further under "Standing Committees of the Fund's Trustees."
Annual Report
The fund's Statement of Additional Information (SAI) includes more information about the Trustees. To request a free copy, call Fidelity at 1-877-208-0098.
Interested Trustees*:
Correspondence intended for each Trustee who is an interested person may be sent to Fidelity Investments, 245 Summer Street, Boston, Massachusetts 02210.
Name, Year of Birth; Principal Occupations and Other Relevant Experience+ |
James C. Curvey (1935) |
Year of Election or Appointment: 2007 Trustee Chairman of the Board of Trustees |
| Mr. Curvey also serves as Trustee of other Fidelity funds. Mr. Curvey is a Director of Fidelity Investments Money Management, Inc. (2009-present), Director of Fidelity Research & Analysis Co. (2009-present) and Director of FMR and FMR Co., Inc. (2007-present). Mr. Curvey is also Vice Chairman (2007-present) and Director of FMR LLC. In addition, Mr. Curvey serves as an Overseer for the Boston Symphony Orchestra and a member of the Trustees of Villanova University. Previously, Mr. Curvey was the Vice Chairman (2006-2007) and Director (2000-2007) of FMR Corp. |
Ronald P. O'Hanley (1957) |
Year of Election or Appointment: 2011 Trustee |
| Mr. O'Hanley also serves as Trustee of other Fidelity funds. He is Director of Fidelity SelectCo, LLC (2013-present), FMR Co., Inc. (2010-present), Director of Fidelity Investments Money Management, Inc. (2010-present), Director of Fidelity Research & Analysis Company (2010-present), President of Fidelity Asset Management and Corporate Services and a Member of Fidelity's Executive Committee (2010-present). Previously, Mr. O'Hanley served as President and Chief Executive Officer of BNY Mellon Asset Management (2007-2010). Mr. O'Hanley also served as Vice Chairman of Bank New York Mellon Corp. and a member of that firm's Executive Committee. Prior to the 2007 merger of The Bank of New York and Mellon Financial Corporation, he was Vice Chairman of Mellon Financial Corporation and President and Chief Executive Officer of Mellon Asset Management. He joined Mellon in February 1997. Mr. O'Hanley currently serves as Chairman of the Boston Public Library Foundation Board of Directors and sits on the Board of Directors of Beth Israel Deaconess Medical Center, the Board of Trustees of the Marine Biological Laboratory and the Advisory Board of the Maxwell School of Citizenship and Public Administration at Syracuse University. Mr. O'Hanley also chairs the Council on Asset Management for the Financial Services Roundtable and is a member of the Board of Directors of Institutional Investor's U.S. Institute. |
* Trustees have been determined to be "Interested Trustees" by virtue of, among other things, their affiliation with the trust or various entities under common control with FMR.
+ The information above includes each Trustee's principal occupation during the last five years and other information relating to the experience, attributes, and skills relevant to each Trustee's qualifications to serve as a Trustee, which led to the conclusion that each Trustee should serve as a Trustee for the fund.
Annual Report
Independent Trustees:
Correspondence intended for each Independent Trustee (that is, the Trustees other than the Interested Trustees) may be sent to Fidelity Investments, P.O. Box 55235, Boston, Massachusetts 02205-5235.
Name, Year of Birth; Principal Occupations and Other Relevant Experience+ |
Dennis J. Dirks (1948) |
Year of Election or Appointment: 2005 Trustee |
| Mr. Dirks also serves as Trustee of other Fidelity funds. Prior to his retirement in May 2003, Mr. Dirks was Chief Operating Officer and a member of the Board of The Depository Trust & Clearing Corporation (DTCC). He also served as President, Chief Operating Officer, and Board member of The Depository Trust Company (DTC) and President and Board member of the National Securities Clearing Corporation (NSCC). In addition, Mr. Dirks served as Chief Executive Officer and Board member of the Government Securities Clearing Corporation, Chief Executive Officer and Board member of the Mortgage-Backed Securities Clearing Corporation, as a Trustee and a member of the Finance Committee of Manhattan College (2005-2008), and as a Trustee and a member of the Finance Committee of AHRC of Nassau County (2006-2008). Mr. Dirks is a member of the Independent Directors Council (IDC) Governing Council (2010-present) and Board of Directors for The Brookville Center for Children's Services, Inc. (2009-present). |
Alan J. Lacy (1953) |
Year of Election or Appointment: 2008 Trustee |
| Mr. Lacy also serves as Trustee of other Fidelity funds. Mr. Lacy serves as Senior Adviser (2007-present) of Oak Hill Capital Partners, L.P. (private equity). Mr. Lacy also served as Chief Executive Officer (2000-2005) and Vice Chairman (2005-2006) of Sears Holdings Corporation and Sears, Roebuck and Co. (retail). In addition, Mr. Lacy serves as a member of the Board of Directors of Dave & Buster's Entertainment, Inc. (restaurant and entertainment complexes, 2010-present), Earth Fare, Inc. (retail grocery, 2012-present), The Hillman Companies, Inc. (hardware wholesalers, 2010-present), and Bristol-Myers Squibb Company (global pharmaceuticals, 2008-present). Mr. Lacy is a member of the Board of Trustees of The National Parks Conservation Association (2006-present). Previously, Mr. Lacy served as Chairman of the Board of Trustees of the National Parks Conservation Association (2008-2011) and as a member of the Board of Directors for the Western Union Company (global money transfer, 2006-2011). |
Ned C. Lautenbach (1944) |
Year of Election or Appointment: 2000 Trustee Chairman of the Independent Trustees |
| Mr. Lautenbach also serves as Trustee of other Fidelity funds. Mr. Lautenbach currently serves as the Lead Director of the Eaton Corporation Board of Directors (diversified industrial, 1997-present). Mr. Lautenbach is Chairman of the Board of Directors of the Philharmonic Center for the Arts in Naples, Florida (2012-present) and a member of the Council on Foreign Relations (1994-present). Previously, Mr. Lautenbach was a Partner/Advisory Partner at Clayton, Dubilier & Rice, LLC (private equity investment, 1998-2010), as well as a Director of Sony Corporation (2006-2007). |
Joseph Mauriello (1944) |
Year of Election or Appointment: 2008 Trustee |
| Mr. Mauriello also serves as Trustee of other Fidelity funds. Prior to his retirement in January 2006, Mr. Mauriello served in numerous senior management positions including Deputy Chairman and Chief Operating Officer (2004-2005), and Vice Chairman of Financial Services (2002-2004) of KPMG LLP US (professional services, 1965-2005). Mr. Mauriello currently serves as a member of the Board of Directors of XL Group plc. (global insurance and re-insurance, 2006-present). Previously, Mr. Mauriello served as a Director of the Hamilton Funds of the Bank of New York (2006-2007) and of Arcadia Resources Inc. (health care services and products, 2007-2012). |
Robert W. Selander (1950) |
Year of Election or Appointment: 2011 Trustee |
| Mr. Selander also serves as Trustee of other Fidelity funds. Previously, Mr. Selander served as a Member of the Advisory Board of other Fidelity funds (2011), and Executive Vice Chairman (2010), Chief Executive Officer (2009-2010), and President and Chief Executive Officer (1997-2009) of Mastercard, Inc. |
Cornelia M. Small (1944) |
Year of Election or Appointment: 2005 Trustee |
| Ms. Small also serves as Trustee of other Fidelity funds. Ms. Small is a member of the Board of Directors (2009-present) and Chair of the Investment Committee (2010-present) of the Teagle Foundation. Ms. Small also serves on the Investment Committee of the Berkshire Taconic Community Foundation (2008-present). Previously, Ms. Small served as Chairperson (2002-2008) and a member of the Investment Committee and Chairperson (2008-2012) and a member of the Board of Trustees of Smith College. In addition, Ms. Small served as Chief Investment Officer, Director of Global Equity Investments, and a member of the Board of Directors of Scudder, Stevens & Clark and Scudder Kemper Investments. |
William S. Stavropoulos (1939) |
Year of Election or Appointment: 2001 Trustee Vice Chairman of the Independent Trustees |
| Mr. Stavropoulos also serves as Trustee of other Fidelity funds. Mr. Stavropoulos serves as President and Founder of the Michigan Baseball Foundation, the Great Lakes Loons (2007-present). Mr. Stavropoulos is Chairman Emeritus of the Board of Directors of The Dow Chemical Company, where he previously served in numerous senior management positions, including President, CEO (1995-2000; 2002-2004), Chairman of the Executive Committee (2000-2006), and as a member of the Board of Directors (1990-2006). Currently, Mr. Stavropoulos is Chairman of the Board of Directors of Univar Inc. (global distributor of commodity and specialty chemicals), a Director of Teradata Corporation (data warehousing and technology solutions), and Maersk Inc. (industrial conglomerate), and a member of the Advisory Board for Metalmark Capital LLC (private equity investment, 2005-present). Mr. Stavropoulos is an operating advisor to Clayton, Dubilier & Rice, LLC (private equity investment). In addition, Mr. Stavropoulos is a member of the University of Notre Dame Advisory Council for the College of Science, a Trustee of the Rollin L. Gerstacker Foundation, and a Director of the Naples Philharmonic Center for the Arts. Previously, Mr. Stavropoulos served as a Director of Chemical Financial Corporation (bank holding company, 1993-2012) and Tyco International, Ltd. (multinational manufacturing and services, 2007-2012). |
David M. Thomas (1949) |
Year of Election or Appointment: 2008 Trustee |
| Mr. Thomas also serves as Trustee of other Fidelity funds. Mr. Thomas serves as Non-Executive Chairman of the Board of Directors of Fortune Brands Home and Security (home and security products, 2011-present), and as a member of the Board of Directors of Interpublic Group of Companies, Inc. (marketing communication, 2004-present). Previously, Mr. Thomas served as Executive Chairman (2005-2006) and Chairman and Chief Executive Officer (2000-2005) of IMS Health, Inc. (pharmaceutical and healthcare information solutions), and a Director of Fortune Brands, Inc. (consumer products, 2000-2011). |
+ The information above includes each Trustee's principal occupation during the last five years and other information relating to the experience, attributes, and skills relevant to each Trustee's qualifications to serve as a Trustee, which led to the conclusion that each Trustee should serve as a Trustee for the fund.
Advisory Board Member and Executive Officers:
Correspondence intended for each executive officer and Peter S. Lynch may be sent to Fidelity Investments, 245 Summer Street, Boston, Massachusetts 02210. Executive officers appear below in alphabetical order.
Name, Year of Birth; Principal Occupation |
Peter S. Lynch (1944) |
Year of Election or Appointment: 2003 Member of the Advisory Board |
| Mr. Lynch also serves as Member of the Advisory Board of other Fidelity funds. Mr. Lynch is Vice Chairman and a Director of FMR and FMR Co., Inc. In addition, Mr. Lynch serves as a Trustee of Boston College and as the Chairman of the Inner-City Scholarship Fund. Previously, Mr. Lynch served on the Special Olympics International Board of Directors (1997-2006). |
Elizabeth Paige Baumann (1968) |
Year of Election or Appointment: 2012 Anti-Money Laundering (AML) Officer |
| Ms. Baumann also serves as AML Officer of other funds. She is Chief AML Officer of FMR LLC (2012-present) and is an employee of Fidelity Investments. Previously, Ms. Baumann served as Vice President and Deputy Anti-Money Laundering Officer (2007-2012). |
William C. Coffey (1969) |
Year of Election or Appointment: 2009 Assistant Secretary |
| Mr. Coffey also serves as Assistant Secretary of other funds. He is Senior Vice President and Deputy General Counsel of FMR LLC (2010-present), and is an employee of Fidelity Investments. Previously, Mr. Coffey served as Vice President and Associate General Counsel of FMR LLC (2005-2009). |
Jonathan Davis (1968) |
Year of Election or Appointment: 2010 Assistant Treasurer |
| Mr. Davis also serves as Assistant Treasurer of other funds. Mr. Davis is an employee of Fidelity Investments. Previously, Mr. Davis served as Vice President and Associate General Counsel of FMR LLC (2003-2010). |
Adrien E. Deberghes (1967) |
Year of Election or Appointment: 2008 Deputy Treasurer |
| Mr. Deberghes also serves as an officer of other funds. He is an employee of Fidelity Investments (2008-present). Prior to joining Fidelity Investments, Mr. Deberghes was Senior Vice President of Mutual Fund Administration at State Street Corporation (2007-2008), Senior Director of Mutual Fund Administration at Investors Bank & Trust (2005-2007), and Director of Finance for Dunkin' Brands (2000-2005). |
Stephanie J. Dorsey (1969) |
Year of Election or Appointment: 2010 Assistant Treasurer |
| Ms. Dorsey also serves as an officer of other funds. She is an employee of Fidelity Investments (2008-present) and has served in other fund officer roles. Prior to joining Fidelity Investments, Ms. Dorsey served as Treasurer (2004-2008) of the JPMorgan Mutual Funds and Vice President (2004-2008) of JPMorgan Chase Bank. |
Scott C. Goebel (1968) |
Year of Election or Appointment: 2008 Secretary and Chief Legal Officer (CLO) |
| Mr. Goebel serves as Secretary and CLO of other funds. Mr. Goebel also serves as Secretary of Fidelity Investments Money Management, Inc. (FIMM) (2010-present) and Fidelity Research and Analysis Company (FRAC) (2010-present); General Counsel, Secretary, and Senior Vice President of FMR (2008-present) and FMR Co., Inc. (2008-present); Chief Legal Officer of Fidelity Management & Research (Hong Kong) Limited (2008-present) and Assistant Secretary of Fidelity Management & Research (Japan) Inc. (2008-present), and Fidelity Management & Research (U.K.) Inc. (2008-present). Previously, Mr. Goebel served as Secretary and CLO of other Fidelity funds (2008-2013), Assistant Secretary of FIMM (2008-2010), FRAC (2008-2010), and certain funds (2007-2008); and as Vice President and Secretary of Fidelity Distributors Corporation (FDC) (2005-2007). Mr. Goebel has been employed by FMR LLC or an affiliate since 2001. |
Joseph A. Hanlon (1968) |
Year of Election or Appointment: 2012 Chief Compliance Officer |
| Mr. Hanlon also serves as Chief Compliance Officer of other funds. Mr. Hanlon serves as Compliance Officer of FMR, FMR Co., Inc., Fidelity Investments Money Management, Inc. (FIMM), Fidelity Research and Analysis Company (FRAC), and Fidelity Management & Research (Hong Kong) (2009-present), as Senior Vice President of the Fidelity Asset Management Division (2009-present), and is an employee of Fidelity Investments. Previously, Mr. Hanlon served as Compliance Officer of Fidelity Management & Research (Japan) Inc. (2009-2013), Strategic Advisers, Inc. (2009-2013), and Fidelity Management & Research (U.K.) Inc. (2009-2013). |
Bruce T. Herring (1965) |
Year of Election or Appointment: 2006 Vice President of certain Equity Funds |
| Mr. Herring also serves as Vice President of other funds. He serves as Chief Investment Officer of Fidelity Global Asset Allocation (GAA) (2013-present), Chief Investment Officer and Director of Fidelity Management & Research (U.K.) Inc. (2010-present), Group Chief Investment Officer of FMR, and President of Fidelity Research & Analysis Company (2010-present). Previously, Mr. Herring served as Vice President (2005-2006) and Senior Vice President (2006-2007) of Fidelity Management & Research Company, Vice President of FMR Co., Inc. (2001-2007), and as a portfolio manager for Fidelity U.S. Equity Funds. |
Brian B. Hogan (1964) |
Year of Election or Appointment: 2009 Vice President |
| Mr. Hogan also serves as Vice President of other funds. Mr. Hogan serves as President of FMR's Equity Division (2009-present). Previously, Mr. Hogan served as Senior Vice President, Equity Research of FMR (2006-2009) and as a portfolio manager. |
Chris Maher (1972) |
Year of Election or Appointment: 2013 Assistant Treasurer |
| Mr. Maher serves as Assistant Treasurer of other funds. Mr. Maher is Vice President of Valuation Oversight and is an employee of Fidelity Investments. Previously, Mr. Maher served as Vice President of Asset Management Compliance (2013), Vice President of FMR's Program Management Group (2010-2013), and Vice President of Valuation Oversight (2008-2010). |
Christine Reynolds (1958) |
Year of Election or Appointment: 2008 Chief Financial Officer |
| Ms. Reynolds also serves as Chief Financial Officer of other funds. Ms. Reynolds became President of Fidelity Pricing and Cash Management Services (FPCMS) in August 2008. Ms. Reynolds served as Chief Operating Officer of FPCMS (2007-2008). Previously, Ms. Reynolds served as President, Treasurer, and Anti-Money Laundering officer of the Fidelity funds (2004-2007). |
Kenneth B. Robins (1969) |
Year of Election or Appointment: 2008 President and Treasurer |
| Mr. Robins also serves as an officer of other funds. Mr. Robins serves as Executive Vice President of Fidelity Investments Money Management, Inc. (FIMM) (2013-present) and is an employee of Fidelity Investments (2004-present). Previously, Mr. Robins served in other fund officer roles. |
Gary W. Ryan (1958) |
Year of Election or Appointment: 2005 Assistant Treasurer |
| Mr. Ryan also serves as Assistant Treasurer of other funds. Mr. Ryan is an employee of Fidelity Investments and has served in other fund officer roles. Previously, Mr. Ryan served as Vice President of Fund Reporting in Fidelity Pricing and Cash Management Services (FPCMS) (1999-2005). |
Stephen Sadoski (1971) |
Year of Election or Appointment: 2012 Deputy Treasurer |
| Mr. Sadoski also serves as Deputy Treasurer of other funds. He is an employee of Fidelity Investments (2012-present) and has served in another fund officer role. Prior to joining Fidelity Investments, Mr. Sadoski served as an assistant chief accountant in the Division of Investment Management of the Securities and Exchange Commission (SEC) (2009-2012) and as a senior manager at Deloitte & Touche LLP (1997-2009). |
Stacie M. Smith (1974) |
Year of Election or Appointment: 2013 Deputy Treasurer |
| Ms. Smith also serves as an officer of other funds. She is an employee of Fidelity Investments (2009-present) and has served in other fund officer roles. Prior to joining Fidelity Investments, Ms. Smith served as Senior Audit Manager of Ernst & Young LLP (1996-2009). |
Renee Stagnone (1975) |
Year of Election or Appointment: 2013 Deputy Treasurer |
| Ms. Stagnone also serves as Deputy Treasurer of other funds. Ms. Stagnone is an employee of Fidelity Investments. |
Joseph F. Zambello (1957) |
Year of Election or Appointment: 2011 Deputy Treasurer |
| Mr. Zambello also serves as Deputy Treasurer of other funds. Mr. Zambello is an employee of Fidelity Investments. Previously, Mr. Zambello served as Vice President of FMR's Program Management Group (2009-2011) and Vice President of the Transfer Agent Oversight Group (2005-2009). |
Annual Report
Distributions (Unaudited)
The Board of Trustees of Advisor International Small Cap Fund voted to pay to shareholders of record at the opening of business on record date, the following distributions per share derived from capital gains realized from sales of portfolio securities, and dividends derived from net investment income:
| Pay Date | Record Date | Dividends | Capital Gains |
Institutional Class | 12/09/13 | 12/06/13 | $0.128 | $0.597 |
Institutional Class designates 50% of the dividend distributed during the fiscal year as amounts which may be taken into account as a dividend for purposes of the maximum rate under section 1(h)(11) of the Internal Revenue Code.
The amounts per share which represent income derived from sources within, and taxes paid to, foreign countries or possessions of the United States are as follows:
| Pay Date | Income | Taxes |
Institutional Class | 12/10/12 | $0.2610 | $0.0142 |
The fund will notify shareholders in January 2014 of amounts for use in preparing 2013 income tax returns.
Annual Report
Board Approval of Investment Advisory Contracts and Management Fees
Fidelity International Small Cap Fund
Each year, the Board of Trustees, including the Independent Trustees (together, the Board), votes on the renewal of the management contract and sub-advisory agreements (together, the Advisory Contracts) for the fund. The Board, assisted by the advice of fund counsel and Independent Trustees' counsel, requests and considers a broad range of information relevant to the renewal of the Advisory Contracts throughout the year.
The Board meets regularly and, at each of its meetings, covers an extensive agenda of topics and materials and considers factors that are relevant to its annual consideration of the renewal of the fund's Advisory Contracts, including the services and support provided to the fund and its shareholders. The Board has established various standing committees, each composed of and chaired by Independent Trustees with varying backgrounds, to which the Board has assigned specific subject matter responsibilities in order to enhance effective decision-making by the Board. The Board, acting directly and through its Committees, requests and receives information concerning the annual consideration of the renewal of the fund's Advisory Contracts. The Board also meets as needed to consider matters specifically related to the Board's annual consideration of the renewal of Advisory Contracts. Members of the Board may also meet with trustees of other Fidelity funds through ad hoc joint committees to discuss certain matters relevant to the Fidelity funds.
At its July 2013 meeting, the Board, including the Independent Trustees, unanimously determined to renew the fund's Advisory Contracts. In reaching its determination, the Board considered all factors it believed relevant, including (i) the nature, extent, and quality of the services to be provided to the fund and its shareholders (including the investment performance of the fund); (ii) the competitiveness of the fund's management fee and total expense ratio relative to peer funds; (iii) the total costs of the services to be provided by and the profits to be realized by Fidelity from its relationship with the fund; (iv) the extent to which economies of scale exist and would be realized as the fund grows; and (v) whether fee levels reflect these economies of scale, if any, for the benefit of fund shareholders.
In considering whether to renew the Advisory Contracts for the fund, the Board reached a determination, with the assistance of fund counsel and Independent Trustees' counsel and through the exercise of its business judgment, that the renewal of the Advisory Contracts was in the best interests of the fund and its shareholders and that the compensation payable under the Advisory Contracts was fair and reasonable. The Board's decision to renew the Advisory Contracts was not based on any single factor, but rather was based on a comprehensive consideration of all the information provided to the Board at its meetings throughout the year. The Board, in reaching its determination to renew the Advisory Contracts, was aware that shareholders in the fund have a broad range of investment choices available to them, including a wide choice among mutual funds offered by Fidelity's competitors, and that the fund's shareholders, who have the opportunity to review and weigh the disclosure provided by the fund in its prospectus and other public disclosures, have chosen to invest in this fund, which is a part of the Fidelity family of funds.
Annual Report
Nature, Extent, and Quality of Services Provided. The Board considered the staffing within the investment adviser, Fidelity Management & Research Company (FMR), and the sub-advisers (together, the Investment Advisers) as it relates to the fund, including the backgrounds of the fund's investment personnel, and also considered the fund's investment objective, strategies, and related investment philosophy. The Independent Trustees also had discussions with senior management of Fidelity's investment operations and investment groups. The Board considered the structure of the portfolio manager compensation program and whether this structure provides appropriate incentives to act in the best interests of the fund.
Resources Dedicated to Investment Management and Support Services. The Board and the Fund Oversight and Research Committees reviewed the general qualifications and capabilities of the Investment Advisers' investment staff, including its size, education, experience, and resources, as well as the Investment Advisers' approach to recruiting, training, managing, and compensating investment personnel. The Board noted that FMR has continued to increase the resources devoted to non-U.S. offices, including expansion of Fidelity's global investment organization. The Board also noted that Fidelity's analysts have extensive resources, tools and capabilities that allow them to conduct sophisticated quantitative and fundamental analysis, as well as credit analysis of issuers, counterparties and guarantors. Further, the Board believes that Fidelity's investment professionals have sufficient access to global information and data so as to provide competitive investment results over time, and that those professionals also have access to sophisticated tools that permit them to assess portfolio construction and risk and performance attribution characteristics continuously, as well as to transmit new information and research conclusions rapidly around the world. Additionally, in its deliberations, the Board considered the Investment Advisers' trading and risk management capabilities and resources, which are an integral part of the investment management process.
Shareholder and Administrative Services. The Board considered (i) the nature, extent, quality, and cost of advisory, administrative, and shareholder services performed by the Investment Advisers and their affiliates under the Advisory Contracts and under separate agreements covering transfer agency, pricing and bookkeeping, and securities lending services for the fund; (ii) the nature and extent of the supervision of third party service providers, principally custodians and subcustodians; and (iii) the resources devoted to, and the record of compliance with, the fund's compliance policies and procedures. The Board also reviewed the allocation of fund brokerage, including allocations to brokers affiliated with the Investment Advisers, the use of brokerage commissions to pay fund expenses, and the use of "soft" commission dollars to pay for research services.
Annual Report
Board Approval of Investment Advisory Contracts and
Management Fees - continued
The Board noted that the growth of fund assets over time across the complex allows Fidelity to reinvest in the development of services designed to enhance the value or convenience of the Fidelity funds as investment vehicles. These services include 24-hour access to account information and market information through telephone representatives and over the Internet, investor education materials and asset allocation tools, and the expanded availability of Fidelity Investor Centers.
Investment in a Large Fund Family. The Board considered the benefits to shareholders of investing in a Fidelity fund, including the benefits of investing in a fund that is part of a large family of funds offering a variety of investment disciplines and providing a large variety of mutual fund investor services. The Board noted that Fidelity had taken, or had made recommendations that resulted in the Fidelity funds taking, a number of actions over the previous year that benefited particular funds, including (i) continuing to dedicate additional resources to investment research and to the support of the senior management team that oversees asset management; (ii) persisting in efforts to enhance Fidelity's global research capabilities; (iii) launching new funds and making other enhancements to meet client needs for global and income-oriented solutions; (iv) continuing to launch dedicated lower cost underlying funds to meet portfolio construction needs related to expanding underlying fund options for Fidelity funds of funds, specifically for the Freedom Fund product lines; (v) rationalizing product lines and gaining increased efficiencies through the mergers of several funds into other funds; (vi) strengthening Fidelity's index fund offerings by reducing investment minimums and adopting or lowering existing expense caps for certain funds and classes; (vii) enhancing Global Asset Allocation product offerings by launching new funds and strategies, including "open architecture" target date funds that utilize affiliated and unaffiliated sub-advisers; (viii) modifying the eligibility criteria for Institutional Class shares of Advisor funds to increase their marketability to a portion of the defined contribution plan market; (ix) creating a new low-cost retirement share class for certain Advisor funds to appeal to large retirement plans; (x) transitioning the management of certain Fidelity commodity funds to Geode Capital Management LLC, a registered commodity pool operator, while retaining administrative responsibilities for the funds; (xi) reorganizing a number of funds; and (xii) taking steps toward establishing a new Fidelity adviser to manage sector-based funds and products.
Investment Performance. The Board considered whether the fund has operated in accordance with its investment objective, as well as its record of compliance with its investment restrictions and its performance history.
The Board took into account discussions with the Investment Advisers about fund investment performance that occur at Board meetings throughout the year. In this regard the Board noted that as part of regularly scheduled fund reviews and other reports to the Board on fund performance, the Board periodically considers annualized return information for the fund, for different time periods, measured against a securities market index ("benchmark index") and a peer group of mutual funds with similar objectives ("peer group"). In its evaluation of fund investment performance, the Board gave particular attention to information indicating changes in performance of certain Fidelity funds for specific time periods and the Investment Advisers' explanations for any overperformance or underperformance.
Annual Report
In addition to reviewing absolute and relative fund performance, the Independent Trustees periodically consider the appropriateness of fund performance metrics in evaluating the results achieved. In general, the Independent Trustees believe that fund performance should be evaluated based on net performance (after fees and expenses) of both the highest performing and lowest performing classes, where applicable, compared to appropriate benchmark indices, over appropriate time periods which may include full market cycles, and compared to peer groups, as applicable, over the same periods, taking into account relevant factors including the following: general market conditions; issuer-specific information; tactical opportunities for investment; and fund cash flows and other factors.
The Independent Trustees recognize that shareholders evaluate performance on a net basis over their own holding periods, for which one-, three-, and five-year periods are used as a proxy. For this reason, the performance information reviewed by the Board also included net cumulative calendar year total return information for the fund and an appropriate benchmark index and peer group for the most recent one-, three-, and five-year periods, as shown below. Returns are shown compared to the 25th percentile (top of box) and 75th percentile (bottom of box) of the peer universe. Returns of the benchmark index are "net MA," i.e., adjusted for tax withholding rates applicable to U.S.-based mutual funds organized as Massachusetts business trusts.
Annual Report
Board Approval of Investment Advisory Contracts and
Management Fees - continued
Fidelity International Small Cap Fund

The Board also considered that the fund's management fee is subject to upward or downward adjustment depending upon whether, and to what extent, the fund's investment performance for the performance period exceeds, or is exceeded by, a securities index, thus leading to a performance adjustment for the same period. The Board noted that the performance adjustment provides FMR with a strong economic incentive to seek to achieve superior performance for the fund's shareholders and helps to more closely align the interests of FMR and the fund's shareholders.
Based on its review, the Board concluded that the nature, extent, and quality of services provided to the fund under the Advisory Contracts should benefit the fund's shareholders.
Competitiveness of Management Fee and Total Expense Ratio. The Board considered the fund's management fee and total expense ratio compared to "mapped groups" of competitive funds and classes. Fidelity creates "mapped groups" by combining similar Lipper investment objective categories that have comparable management fee characteristics. Combining Lipper investment objective categories aids the Board's management fee and total expense ratio comparisons by broadening the competitive group used for comparison and by reducing the number of universes to which various Fidelity funds are compared.
Management Fee. The Board considered two proprietary management fee comparisons for the 12-month periods shown in the chart below. The group of Lipper funds used by the Board for management fee comparisons is referred to below as the "Total Mapped Group." The Total Mapped Group is broader than the Lipper peer group used by the Board for performance comparisons because the Total Mapped Group combines several Lipper investment objective categories while the Lipper peer group does not. The Total Mapped Group comparison focuses on a fund's standing in terms of gross management fees before expense reimbursements or caps, and without giving effect to the fund's performance adjustment, relative to the total universe of funds with comparable investment mandates, regardless of whether their management fee structures also are comparable. Funds with comparable investment mandates offer exposure to similar types of securities. Funds with comparable management fee structures have similar management fee contractual arrangements (e.g., flat rate charged for advisory services, all-inclusive fee rate, etc.). "TMG %" represents the percentage of funds in the Total Mapped Group that had management fees that were lower than the fund's. For example, a TMG % of 19% means that 81% of the funds in the Total Mapped Group had higher management fees than the fund. The "Asset-Size Peer Group" (ASPG) comparison focuses on a fund's standing relative to a subset of non-Fidelity funds within the Total Mapped Group that are similar in size and management fee structure. The ASPG represents at least 15% of the funds in the Total Mapped Group with comparable asset size and management fee structures, subject to a minimum of 50 funds (or all funds in the Total Mapped Group if fewer than 50). Additional information, such as the ASPG quartile in which the fund's management fee ranked and the impact of the fund's performance adjustment, is also included in the chart and considered by the Board.
Annual Report
Fidelity International Small Cap Fund

The Board noted that the fund's management fee ranked below the median of its Total Mapped Group and below the median of its ASPG for 2012. The Board also noted the effect of the fund's positive performance adjustment on the fund's management fee ranking.
Annual Report
Board Approval of Investment Advisory Contracts and
Management Fees - continued
Based on its review, the Board concluded that the fund's management fee is fair and reasonable in light of the services that the fund receives and the other factors considered.
Total Expense Ratio. In its review of each class's total expense ratio, the Board considered the fund's management fee as well as other fund or class expenses, as applicable, such as transfer agent fees, pricing and bookkeeping fees, fund-paid 12b-1 fees, and custodial, legal, and audit fees. The Board also noted the effects of any waivers and reimbursements on fees and expenses, as well as the impact of the fund's performance adjustment. As part of its review, the Board also considered the current and historical total expense ratios of each class of the fund compared to competitive fund median expenses. Each class of the fund is compared to those funds and classes in the Total Mapped Group (used by the Board for management fee comparisons) that have a similar sales load structure.
The Board noted that the total expense ratio of each of Class A, Class C, Institutional Class, and the retail class ranked below its competitive median for 2012, the total expense ratio of Class B ranked equal to its competitive median for 2012, and the total expense ratio of Class T ranked above its competitive median for 2012. The Board considered that, in general, various factors can affect total expense ratios. The Board noted that the total expense ratio of Class T was above the competitive median primarily because of higher 12b-1 fees on Class T. Class T has a higher 12b-1 fee, but a lower front-end sales charge, than traditionally priced front-end sales charge classes. The Board considered that Class T is primarily sold load-waived in the retirement plan market where its 0.50% 12b-1 fee is comparable to competing no-load, higher 12b-1 fee classes designed specifically for retirement plans. The Board noted that the fund offers multiple classes, each of which has a different sales load and 12b-1 fee structure, and that the multiple structures are intended to offer a range of pricing options for the intermediary market. The Board also noted that the total expense ratios of the classes vary primarily by the level of their 12b-1 fees, although differences in transfer agent fees may also cause expenses to vary from class to class.
Fees Charged to Other Fidelity Clients. The Board also considered Fidelity fee structures and other information with respect to clients of FMR and its affiliates, such as other mutual funds advised or subadvised by FMR or its affiliates, pension plan clients, and other institutional clients. The Board noted the findings of the 2013 ad hoc joint committee (created with the board of other Fidelity funds), which reviewed and compared Fidelity's institutional investment advisory business with its business of providing services to the Fidelity funds, including the differences in services provided, fees charged, and costs incurred, as well as competition in their respective marketplaces.
Annual Report
Based on its review of total expense ratios and fees charged to other Fidelity clients, the Board concluded that the total expense ratio of each class of the fund was reasonable, although Class T was above the median of the universe presented for comparison, in light of the services that the fund and its shareholders receive and the other factors considered.
Costs of the Services and Profitability. The Board considered the revenues earned and the expenses incurred by Fidelity in conducting the business of developing, marketing, distributing, managing, administering and servicing the fund and servicing the fund's shareholders. The Board also considered the level of Fidelity's profits in respect of all the Fidelity funds.
On an annual basis, FMR presents to the Board Fidelity's profitability for the fund. Fidelity calculates the profitability for each fund, as well as aggregate profitability for groups of Fidelity funds and all Fidelity funds, using a series of detailed revenue and cost allocation methodologies which originate with the books and records of Fidelity on which Fidelity's audited financial statements are based. The Audit Committee of the Board reviews any significant changes from the prior year's methodologies.
PricewaterhouseCoopers LLP (PwC), independent registered public accounting firm and auditor to Fidelity and certain Fidelity funds, has been engaged annually by the Board as part of the Board's assessment of Fidelity's profitability analysis. PwC's engagement includes the review and assessment of the methodologies used by Fidelity in determining the revenues and expenses attributable to Fidelity's mutual fund business, and completion of agreed-upon procedures surrounding the mathematical accuracy of fund profitability and its conformity to allocation methodologies. After considering PwC's reports issued under the engagement and information provided by Fidelity, the Board concluded that while other allocation methods may also be reasonable, Fidelity's profitability methodologies are reasonable in all material respects.
The Board also reviewed Fidelity's non-fund businesses and fall-out benefits related to the mutual fund business as well as cases where Fidelity's affiliates may benefit from or be related to the fund's business.
The Board considered the costs of the services provided by and the profits realized by Fidelity in connection with the operation of the fund and was satisfied that the profitability was not excessive in the circumstances.
Economies of Scale. The Board considered whether there have been economies of scale in respect of the management of the Fidelity funds, whether the Fidelity funds (including the fund) have appropriately benefited from any such economies of scale, and whether there is potential for realization of any further economies of scale. The Board considered the extent to which the fund will benefit from economies of scale through increased services to the fund, through waivers or reimbursements, or through fee or expense reductions. The Board also noted that in 2009, it and the board of other Fidelity funds created an ad hoc committee (the Economies of Scale Committee) to analyze whether FMR attains economies of scale in respect of the management and servicing of the Fidelity funds, whether the Fidelity funds have appropriately benefited from such economies of scale, and whether there is potential for realization of any further economies of scale.
Annual Report
Board Approval of Investment Advisory Contracts and
Management Fees - continued
The Board recognized that the fund's management contract incorporates a "group fee" structure, which provides for lower group fee rates as total fund assets under FMR's management increase, and for higher group fee rates as total fund assets under FMR's management decrease. FMR calculates the group fee rates based on a tiered asset "breakpoint" schedule that varies based on asset class. The Board considered that the group fee is designed to deliver the benefits of economies of scale to fund shareholders when total Fidelity fund assets increase, even if assets of any particular fund are unchanged or have declined, because some portion of Fidelity's costs are attributable to services provided to all Fidelity funds, and all funds benefit if those costs can be allocated among more assets. The Board concluded that, given the group fee structure, fund shareholders will benefit from lower management fees as assets under FMR's management increase at the fund complex level, regardless of whether Fidelity achieves any such economies of scale.
The Board concluded, taking into account the analysis of the Economies of Scale Committee, that economies of scale, if any, are being appropriately shared between fund shareholders and Fidelity.
Amendment to Description of Group Fee Rate. At its July 2013 meeting, the Board voted to approve an amendment to the fund's management contract to modify the description of the "group fee rate" effective August 1, 2013. The Board noted that under the prior description in the contract, the group fee rate was based on the average net assets of all registered investment companies with which FMR has management contracts. Under the contract's tiered asset breakpoint schedule, the group fee rate is lower as total fund assets under FMR's management increase, and higher as total fund assets under FMR's management decrease. The Board considered that the prior description would have excluded the assets of 64 Fidelity sector funds from the group fee rate calculation once Fidelity SelectCo, LLC, an affiliate of FMR, assumed management responsibilities for those funds. The Board noted that modifying the description of the group fee rate to continue to include the assets of those 64 funds for purposes of determining group fee rate breakpoints would avoid an immediate adverse impact on the group fee rate for any fund.
Additional Information Requested by the Board. In order to develop fully the factual basis for consideration of the Fidelity funds' Advisory Contracts, the Board requested and received additional information on certain topics, including: (i) fund performance trends and Fidelity's long-term strategies for certain funds; (ii) the potential to further rationalize the Fidelity fund lineup with the possibility of achieving savings for the funds and Fidelity; (iii) the methodology with respect to competitive fund data and peer group classifications; (iv) the arrangements with, and performance of, certain sub-advisers on behalf of the Fidelity funds, as well as certain proposed participating affiliate arrangements; (v) the realization of fall-out benefits in certain Fidelity business units; (vi) Fidelity's group fee structures, including the rationale for the individual fee rates of certain categories of funds and the definition of group assets; (vii) trends regarding industry use of performance fee structures and the performance adjustment methodologies applicable to the Fidelity funds; (viii) additional competitive analysis regarding the total expenses for certain classes; and (ix) fund profitability methodology, including Fidelity's cost allocation methodology, and the impact of certain factors on fund profitability results.
Annual Report
Based on its evaluation of all of the conclusions noted above, and after considering all factors it believed relevant, the Board ultimately concluded that the advisory fee structures are fair and reasonable, and that the fund's Advisory Contracts should be renewed.
Annual Report
Investment Adviser
Fidelity Management & Research Company
Boston, MA
Investment Sub-Advisers
FMR Co., Inc.
Fidelity Management & Research
(U.K.) Inc.
Fidelity Management & Research
(Hong Kong) Limited
Fidelity Management & Research
(Japan) Inc.
FIL Investment Advisors
FIL Investments (Japan) Limited
FIL Investment Advisors (UK) Limited
General Distributor
Fidelity Distributors Corporation
Smithfield, RI
Transfer and Service Agents
Fidelity Investments Institutional Operations Company, Inc.
Boston, MA
Fidelity Service Company, Inc.
Boston, MA
Custodian
The Bank of New York Mellon
New York, NY
(Fidelity Investment logo)(registered trademark)
AISCI-UANN-1213
1.793572.110
Fidelity®
International Small Cap Opportunities
Fund
Annual Report
October 31, 2013
(Fidelity Cover Art)
Contents
Performance | (Click Here) | How the fund has done over time. |
Management's Discussion of Fund Performance | (Click Here) | The Portfolio Manager's review of fund performance and strategy. |
Shareholder Expense Example | (Click Here) | An example of shareholder expenses. |
Investment Changes | (Click Here) | A summary of major shifts in the fund's investments over the past six months. |
Investments | (Click Here) | A complete list of the fund's investments with their market values. |
Financial Statements | (Click Here) | Statements of assets and liabilities, operations, and changes in net assets, as well as financial highlights. |
Notes | (Click Here) | Notes to the financial statements. |
Report of Independent Registered Public Accounting Firm | (Click Here) | |
Trustees and Officers | (Click Here) | |
Distributions | (Click Here) | |
Board Approval of Investment Advisory Contracts and Management Fees | (Click Here) | |
To view a fund's proxy voting guidelines and proxy voting record for the 12-month period ended June 30, visit http://www.fidelity.com/proxyvotingresults or visit the Securities and Exchange Commission's (SEC) web site at http://www.sec.gov. You may also call 1-800-544-8544 to request a free copy of the proxy voting guidelines.
Standard & Poor's, S&P and S&P 500 are registered service marks of The McGraw-Hill Companies, Inc. and have been licensed for use by Fidelity Distributors Corporation.
Other third-party marks appearing herein are the property of their respective owners.
All other marks appearing herein are registered or unregistered trademarks or service marks of FMR LLC or an affiliated company. © 2013 FMR LLC. All rights reserved.
Annual Report
This report and the financial statements contained herein are submitted for the general information of the shareholders of the fund. This report is not authorized for distribution to prospective investors in the fund unless preceded or accompanied by an effective prospectus.
A fund files its complete schedule of portfolio holdings with the SEC for the first and third quarters of each fiscal year on Form N-Q. Forms N-Q are available on the SEC's web site at http://www.sec.gov. A fund's Forms N-Q may be reviewed and copied at the SEC's Public Reference Room in Washington, DC. Information regarding the operation of the SEC's Public Reference Room may be obtained by calling 1-800-SEC-0330. For a complete list of a fund's portfolio holdings, view the most recent holdings listing, semiannual report, or annual report on Fidelity's web site at http://www.fidelity.com, http://www.advisor.fidelity.com, or http://www.401k.com, as applicable.
NOT FDIC INSURED • MAY LOSE VALUE • NO BANK GUARANTEE
Neither the fund nor Fidelity Distributors Corporation is a bank.
Annual Report
Average annual total return reflects the change in the value of an investment, assuming reinvestment of the class' distributions from dividend income and capital gains (the profits earned upon the sale of securities that have grown in value, if any) and assuming a constant rate of performance each year. The $10,000 table and the fund's returns do not reflect the deduction of taxes that a shareholder would pay on fund distributions or the redemption of fund shares. During periods of reimbursement by Fidelity, a fund's total return will be greater than it would be had the reimbursement not occurred. How a fund did yesterday is no guarantee of how it will do tomorrow.
Average Annual Total Returns
Periods ended October 31, 2013 | Past 1
year | Past 5
years | Life of fund A |
Fidelity® International Small Cap Opportunities Fund | 28.24% | 18.61% | 6.35% |
A From August 2, 2005
$10,000 Over Life of Fund
Let's say hypothetically that $10,000 was invested in Fidelity® International Small Cap Opportunities Fund, a class of the fund, on August 2, 2005, when the fund started. The chart shows how the value of your investment would have changed, and also shows how the MSCI® EAFE® Small Cap Index performed over the same period.
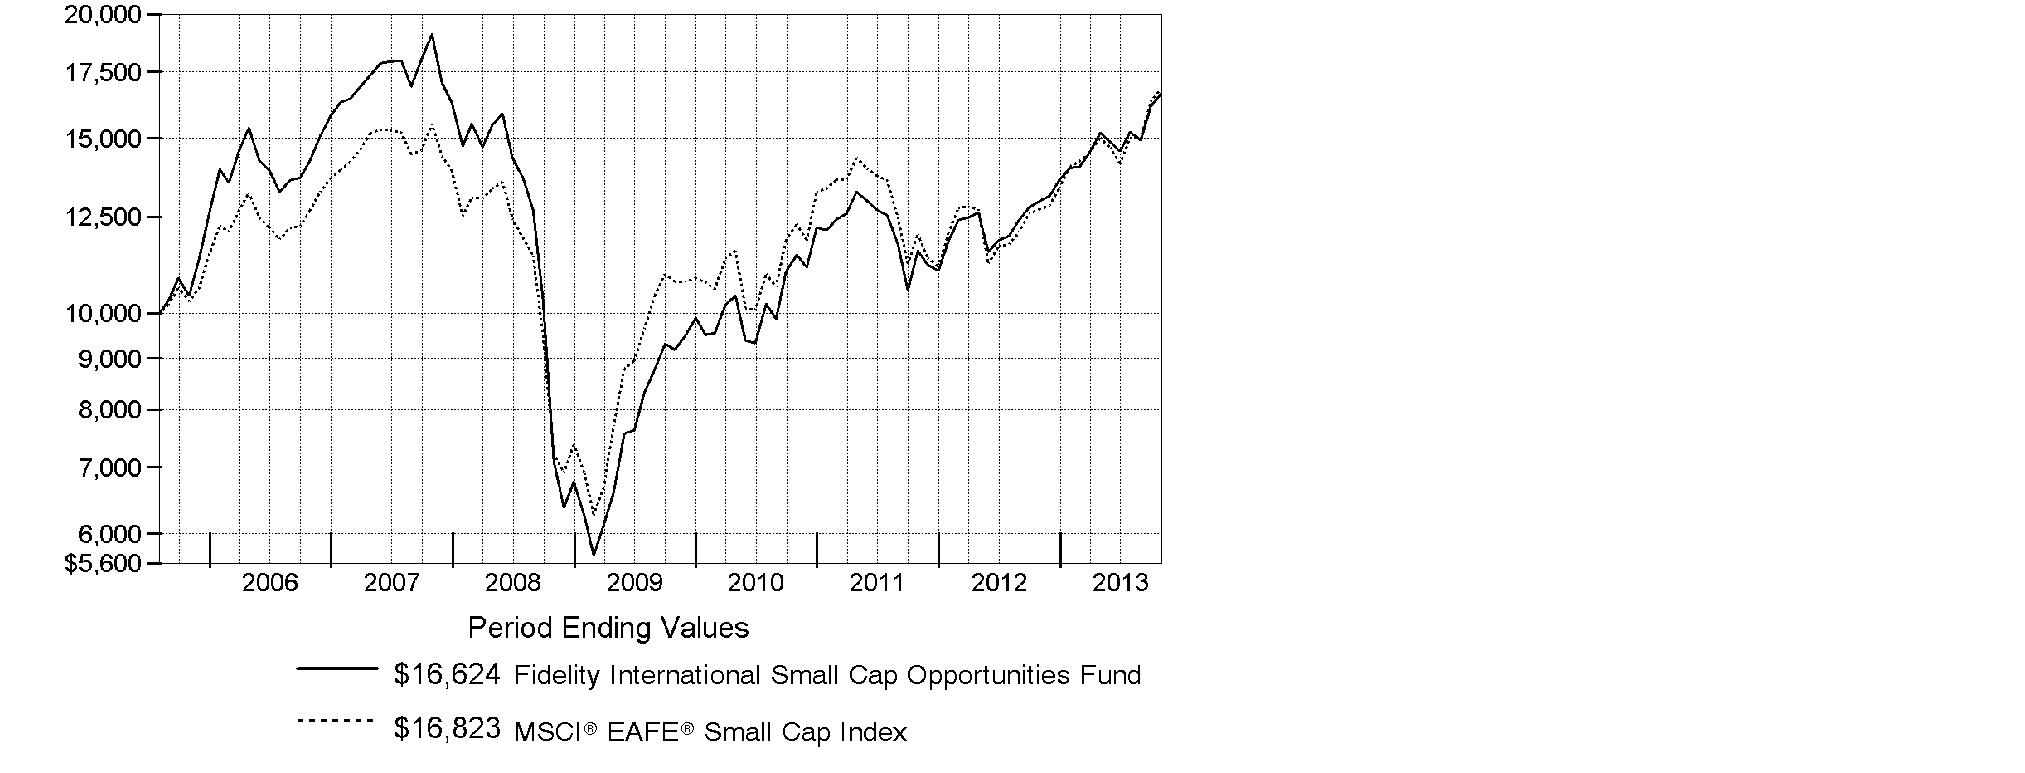
Annual Report
Market Recap: On balance, global equity markets remained upbeat for the 12-month period ending October 31, 2013. The MSCI® ACWI® (All Country World Index) Index gained 23.75% for the period, amid investor preference for higher-risk assets. The period was not without turbulence, however. In the spring and summer, central banks worldwide, especially in the U.S. and China, made clear their intentions to maintain accommodative monetary policies. That stance, combined with modest cyclical improvements around the globe and generally low valuations, underpinned the broad rally in equities. Europe (+32%) shone brightly, with most markets in the region - large and small - registering solid, index-beating gains. Another bright spot was Japan, which, despite a struggling yen and taking a second-half breather, posted a 34% result for the full year. The U.S. - by far the index's biggest constituent - also outperformed the global market with a roughly 28% advance. Meanwhile, Asia-Pacific ex Japan (+14%) lagged, hurt in part by a slowdown in Australia's mining industry as well as currency headwinds. Foreign-exchange and commodity weakness also curbed results in resource-heavy Canada and emerging markets (EM), both of which were up 7%. Country-level EM performance diverged meaningfully for the period, as evidenced by performance in Brazil (-1%), Russia (+12%), India (+1%) and China (+8%).
Comments from Jed Weiss, Portfolio Manager of Fidelity® International Small Cap Opportunities Fund: For the year, the fund's Retail Class shares gained 28.24%, trailing the 32.33% increase in the MSCI® EAFE® Small Cap Index. Europe was a detractor, as poor stock picking in the region weighed on the fund's result. The fund also had a moderate cash position, which hurt performance in an up market. Further, stock picking in Canada was a negative, with out-of-index mining-related companies Eldorado Gold, Copper Mountain Mining and Agnico Eagle Mines hurting results. I ultimately sold all three stocks, none of which were in the benchmark. Emerging markets, especially South African drug store chain Clicks Group, posed an additional challenge. On the positive side, the fund was significantly helped by a large underweighting in the Asia-Pacific ex Japan region, especially Australia, which included a large number of poor-performing mining companies that I chose to avoid. The fund's out-of-benchmark U.S. holdings also helped. The vast majority of these investments were in companies that do all or most of their business abroad but that happen to be domiciled stateside. Of final note, stock picking in Japan proved very helpful in relative terms, with investment bank Nihon M&A Center producing an outsized contribution.
The views expressed above reflect those of the portfolio manager(s) only through the end of the period as stated on the cover of this report and do not necessarily represent the views of Fidelity or any other person in the Fidelity organization. Any such views are subject to change at any time based upon market or other conditions and Fidelity disclaims any responsibility to update such views. These views may not be relied on as investment advice and, because investment decisions for a Fidelity fund are based on numerous factors, may not be relied on as an indication of trading intent on behalf of any Fidelity fund.
Annual Report
Shareholder Expense Example
As a shareholder of the Fund, you incur two types of costs: (1) transaction costs, including sales charges (loads) on purchase payments or redemption proceeds, redemption fees and (2) ongoing costs, including management fees, distribution and/or service (12b-1) fees and other Fund expenses. This Example is intended to help you understand your ongoing costs (in dollars) of investing in the Fund and to compare these costs with the ongoing costs of investing in other mutual funds.
The Example is based on an investment of $1,000 invested at the beginning of the period and held for the entire period (May 1, 2013 to October 31, 2013).
Actual Expenses
The first line of the accompanying table for each class of the Fund provides information about actual account values and actual expenses. You may use the information in this line, together with the amount you invested, to estimate the expenses that you paid over the period. Simply divide your account value by $1,000.00 (for example, an $8,600 account value divided by $1,000.00 = 8.6), then multiply the result by the number in the first line for a class of the Fund under the heading entitled "Expenses Paid During Period" to estimate the expenses you paid on your account during this period. A small balance maintenance fee of $12.00 that is charged once a year may apply for certain accounts with a value of less than $2,000. This fee is not included in the table below. If it was, the estimate of expenses you paid during the period would be higher, and your ending account value lower, by this amount. In addition, the Fund, as a shareholder in the underlying Fidelity Central Funds, will indirectly bear its pro-rata share of the fees and expenses incurred by the underlying Fidelity Central Funds. These fees and expenses are not included in the Fund's annualized expense ratio used to calculate the expense estimate in the table below.
Hypothetical Example for Comparison Purposes
The second line of the accompanying table for each class of the Fund provides information about hypothetical account values and hypothetical expenses based on a Class' actual expense ratio and an assumed rate of return of 5% per year before expenses, which is not the Class' actual return. The hypothetical account values and expenses may not be used to estimate the actual ending account balance or expenses you paid for the period. You may use this information to compare the ongoing costs of investing in the Fund and other funds. To do so, compare this 5% hypothetical example with the 5% hypothetical examples that appear in the shareholder reports of the other funds. A small balance maintenance fee of $12.00 that is charged once a year may apply for certain accounts with a value of less than $2,000. This fee is not included in the table below. If it was, the estimate of expenses you paid during the period would be higher, and your ending account value lower, by this amount. In addition, the Fund, as a shareholder in the underlying Fidelity Central Funds, will indirectly bear its pro-rata share of the fees and expenses incurred by the underlying Fidelity Central Funds. These fees and expenses are not included in the Fund's annualized expense ratio used to calculate the expense estimate in the table below.
Please note that the expenses shown in the table are meant to highlight your ongoing costs only and do not reflect any transaction costs. Therefore, the second line of the table is useful in comparing ongoing costs only, and will not help you determine the relative total costs of owning different funds. In addition, if these transactional costs were included, your costs would have been higher.
Annual Report
Shareholder Expense Example - continued
| Annualized
Expense Ratio B | Beginning
Account Value
May 1, 2013 | Ending
Account Value
October 31, 2013 | Expenses Paid
During Period*
May 1, 2013
to October 31, 2013 |
Class A | 1.65% | | | |
Actual | | $ 1,000.00 | $ 1,093.50 | $ 8.71 |
Hypothetical A | | $ 1,000.00 | $ 1,016.89 | $ 8.39 |
Class T | 1.90% | | | |
Actual | | $ 1,000.00 | $ 1,091.80 | $ 10.02 |
Hypothetical A | | $ 1,000.00 | $ 1,015.63 | $ 9.65 |
Class B | 2.40% | | | |
Actual | | $ 1,000.00 | $ 1,089.20 | $ 12.64 |
Hypothetical A | | $ 1,000.00 | $ 1,013.11 | $ 12.18 |
Class C | 2.40% | | | |
Actual | | $ 1,000.00 | $ 1,089.40 | $ 12.64 |
Hypothetical A | | $ 1,000.00 | $ 1,013.11 | $ 12.18 |
International Small Cap Opportunities | 1.39% | | | |
Actual | | $ 1,000.00 | $ 1,095.10 | $ 7.34 |
Hypothetical A | | $ 1,000.00 | $ 1,018.20 | $ 7.07 |
Institutional Class | 1.36% | | | |
Actual | | $ 1,000.00 | $ 1,095.00 | $ 7.18 |
Hypothetical A | | $ 1,000.00 | $ 1,018.35 | $ 6.92 |
A 5% return per year before expenses
B Annualized expense ratio reflects expenses net of applicable fee waivers.
* Expenses are equal to each Class' annualized expense ratio, multiplied by the average account value over the period, multiplied by 184/365 (to reflect the one-half year period).
Annual Report
Investment Changes (Unaudited)
Geographic Diversification (% of fund's net assets) |
As of October 31, 2013 |
 | Japan 26.1% | |
 | United Kingdom 19.3% | |
 | United States of America* 14.6% | |
 | Germany 5.1% | |
 | Italy 3.5% | |
 | Netherlands 3.5% | |
 | France 2.4% | |
 | Sweden 2.1% | |
 | Ireland 2.0% | |
 | Other 21.4% | |

Percentages are based on country or territory of incorporation and are adjusted for the effect of futures contracts, if applicable. |
* Includes Short-Term Investments and Net Other Assets (Liabilities). |
As of April 30, 2013 |
| Japan 24.9% | |
| United Kingdom 17.9% | |
| United States of America* 16.9% | |
| Germany 4.0% | |
| Turkey 3.7% | |
| Netherlands 3.0% | |
| Italy 2.6% | |
| France 2.6% | |
| Sweden 2.4% | |
| Other 22.0% | |

Percentages are based on country or territory of incorporation and are adjusted for the effect of futures contracts, if applicable. |
* Includes Short-Term Investments and Net Other Assets (Liabilities). |
Asset Allocation as of October 31, 2013 |
| % of fund's
net assets | % of fund's net assets
6 months ago |
Stocks | 97.6 | 95.6 |
Short-Term Investments and Net Other Assets (Liabilities) | 2.4 | 4.4 |
Top Ten Stocks as of October 31, 2013 |
| % of fund's
net assets | % of fund's net assets
6 months ago |
USS Co. Ltd. (Japan, Specialty Retail) | 2.3 | 2.1 |
PriceSmart, Inc. (United States of America, Food & Staples Retailing) | 1.9 | 2.0 |
Aalberts Industries NV (Netherlands, Machinery) | 1.6 | 1.1 |
Spirax-Sarco Engineering PLC (United Kingdom, Machinery) | 1.5 | 1.4 |
CTS Eventim AG (Germany, Media) | 1.4 | 1.2 |
Interpump Group SpA (Italy, Machinery) | 1.4 | 1.1 |
Azimut Holding SpA (Italy, Capital Markets) | 1.4 | 1.0 |
Intrum Justitia AB (Sweden, Commercial Services & Supplies) | 1.4 | 1.4 |
Unite Group PLC (United Kingdom, Real Estate Management & Development) | 1.3 | 1.2 |
Spectris PLC (United Kingdom, Electronic Equipment & Components) | 1.3 | 1.0 |
| 15.5 | |
Market Sectors as of October 31, 2013 |
| % of fund's
net assets | % of fund's net assets
6 months ago |
Industrials | 24.1 | 23.7 |
Consumer Discretionary | 18.5 | 19.3 |
Financials | 18.5 | 16.7 |
Consumer Staples | 10.4 | 10.6 |
Materials | 9.8 | 9.4 |
Information Technology | 7.0 | 7.2 |
Health Care | 6.0 | 5.2 |
Energy | 3.3 | 3.5 |
Annual Report
Investments October 31, 2013
Showing Percentage of Net Assets
Common Stocks - 96.8% |
| Shares | | Value |
Australia - 1.6% |
Imdex Ltd. | 1,328,443 | | $ 904,016 |
Ramsay Health Care Ltd. | 79,365 | | 2,910,459 |
RCG Corp. Ltd. | 2,789,963 | | 1,951,331 |
Sydney Airport unit | 790,959 | | 3,132,339 |
TOTAL AUSTRALIA | | 8,898,145 |
Austria - 1.7% |
Andritz AG | 104,700 | | 6,449,637 |
Zumtobel AG | 164,181 | | 2,934,699 |
TOTAL AUSTRIA | | 9,384,336 |
Bailiwick of Jersey - 1.2% |
Informa PLC | 779,140 | | 6,989,683 |
Belgium - 1.9% |
Gimv NV | 71,688 | | 3,630,573 |
KBC Ancora (a) | 137,238 | | 4,470,174 |
Umicore SA | 56,570 | | 2,698,646 |
TOTAL BELGIUM | | 10,799,393 |
Bermuda - 0.4% |
Lazard Ltd. Class A | 58,699 | | 2,268,716 |
Brazil - 0.2% |
Arezzo Industria e Comercio SA | 84,300 | | 1,260,624 |
British Virgin Islands - 0.3% |
Gem Diamonds Ltd. (a) | 636,898 | | 1,628,818 |
Canada - 1.6% |
Pason Systems, Inc. | 243,700 | | 5,064,959 |
ShawCor Ltd. Class A | 62,500 | | 2,627,320 |
TAG Oil Ltd. (a)(e) | 289,400 | | 1,176,863 |
TOTAL CANADA | | 8,869,142 |
Denmark - 1.4% |
Jyske Bank A/S (Reg.) (a) | 66,327 | | 3,744,232 |
Spar Nord Bank A/S (a) | 457,069 | | 4,077,073 |
TOTAL DENMARK | | 7,821,305 |
Finland - 1.5% |
Nokian Tyres PLC | 92,000 | | 4,655,508 |
Tikkurila Oyj | 148,220 | | 3,841,781 |
TOTAL FINLAND | | 8,497,289 |
Common Stocks - continued |
| Shares | | Value |
France - 2.4% |
Laurent-Perrier Group SA | 27,463 | | $ 2,565,780 |
Remy Cointreau SA | 30,773 | | 3,036,719 |
Saft Groupe SA | 89,475 | | 2,840,312 |
Vetoquinol SA | 55,184 | | 2,196,833 |
Virbac SA | 15,500 | | 3,117,835 |
TOTAL FRANCE | | 13,757,479 |
Germany - 4.5% |
alstria office REIT-AG | 200,000 | | 2,535,734 |
Bilfinger Berger AG | 49,266 | | 5,469,670 |
CompuGROUP Holding AG (d) | 178,878 | | 4,661,920 |
CTS Eventim AG | 167,545 | | 8,178,058 |
Fielmann AG | 39,837 | | 4,456,908 |
TOTAL GERMANY | | 25,302,290 |
Greece - 0.7% |
Titan Cement Co. SA (Reg.) (a) | 138,880 | | 3,790,143 |
India - 0.6% |
Jyothy Laboratories Ltd. (a) | 1,106,018 | | 3,325,736 |
Ireland - 2.0% |
FBD Holdings PLC | 219,528 | | 4,739,220 |
James Hardie Industries PLC: | | | |
CDI | 151,916 | | 1,569,367 |
sponsored ADR | 100,715 | | 5,245,237 |
TOTAL IRELAND | | 11,553,824 |
Israel - 1.2% |
Azrieli Group | 96,005 | | 3,087,406 |
Ituran Location & Control Ltd. | 97,286 | | 1,780,334 |
Strauss Group Ltd. | 96,744 | | 1,708,675 |
TOTAL ISRAEL | | 6,576,415 |
Italy - 3.5% |
Azimut Holding SpA | 308,873 | | 7,846,456 |
Beni Stabili SpA SIIQ | 5,953,083 | | 4,089,896 |
Interpump Group SpA | 711,143 | | 7,917,546 |
TOTAL ITALY | | 19,853,898 |
Japan - 26.1% |
Air Water, Inc. | 101,000 | | 1,443,722 |
Anicom Holdings, Inc. (a)(d) | 56,400 | | 668,360 |
Aozora Bank Ltd. | 1,875,000 | | 5,450,690 |
Common Stocks - continued |
| Shares | | Value |
Japan - continued |
ARNEST ONE Corp. (d) | 90,000 | | $ 2,467,609 |
Artnature, Inc. | 74,200 | | 1,583,730 |
Asahi Co. Ltd. | 148,100 | | 2,510,464 |
Autobacs Seven Co. Ltd. | 275,800 | | 4,021,296 |
Azbil Corp. | 174,800 | | 4,211,741 |
Coca-Cola Central Japan Co. Ltd. | 139,000 | | 2,461,779 |
Cosmos Pharmaceutical Corp. | 29,100 | | 3,545,271 |
Daikokutenbussan Co. Ltd. | 168,700 | | 5,062,340 |
FCC Co. Ltd. | 267,800 | | 6,117,869 |
GCA Savvian Group Corp. | 155,600 | | 1,715,286 |
Glory Ltd. | 74,200 | | 1,839,930 |
Goldcrest Co. Ltd. | 244,630 | | 6,544,798 |
Hajime Construction Co. Ltd. | 16,300 | | 1,123,909 |
Harmonic Drive Systems, Inc. | 121,400 | | 2,613,511 |
Iwatsuka Confectionary Co. Ltd. | 48,400 | | 2,496,259 |
Kamigumi Co. Ltd. | 217,000 | | 1,887,545 |
Kobayashi Pharmaceutical Co. Ltd. | 59,900 | | 3,353,863 |
Kyoto Kimono Yuzen Co. Ltd. | 83,300 | | 875,376 |
Lasertec Corp. (a) | 199,800 | | 2,064,120 |
Meiko Network Japan Co. Ltd. | 112,600 | | 1,299,874 |
Miraial Co. Ltd. | 69,800 | | 1,132,218 |
Nabtesco Corp. | 124,900 | | 3,048,499 |
Nagaileben Co. Ltd. | 205,900 | | 3,397,806 |
Nihon M&A Center, Inc. | 82,700 | | 6,378,286 |
Nihon Parkerizing Co. Ltd. | 267,000 | | 5,215,861 |
Nippon Seiki Co. Ltd. | 218,000 | | 3,554,253 |
Nippon Thompson Co. Ltd. | 47,000 | | 255,804 |
NS Tool Co. Ltd. | 17,800 | | 303,184 |
Obic Co. Ltd. | 144,900 | | 4,550,248 |
OSG Corp. | 394,200 | | 6,376,834 |
San-Ai Oil Co. Ltd. | 32,000 | | 138,202 |
Seven Bank Ltd. | 1,860,000 | | 6,583,016 |
SHO-BOND Holdings Co. Ltd. | 134,400 | | 6,293,595 |
Shoei Co. Ltd. | 233,800 | | 2,196,588 |
Software Service, Inc. | 43,100 | | 1,620,489 |
Techno Medica Co. Ltd. | 65,900 | | 1,435,105 |
The Nippon Synthetic Chemical Industry Co. Ltd. | 472,000 | | 4,550,686 |
Tocalo Co. Ltd. | 112,400 | | 1,840,264 |
Tsutsumi Jewelry Co. Ltd. | 81,000 | | 1,973,613 |
USS Co. Ltd. | 868,600 | | 12,720,209 |
Common Stocks - continued |
| Shares | | Value |
Japan - continued |
Workman Co. Ltd. | 43,400 | | $ 1,700,821 |
Yamato Kogyo Co. Ltd. | 182,500 | | 6,764,217 |
TOTAL JAPAN | | 147,389,140 |
Korea (South) - 1.0% |
Coway Co. Ltd. | 95,705 | | 5,464,835 |
Mexico - 0.4% |
Consorcio ARA S.A.B. de CV (a) | 5,696,218 | | 2,226,577 |
Netherlands - 3.5% |
Aalberts Industries NV | 291,901 | | 8,735,082 |
ASM International NV (depositary receipt) | 75,900 | | 2,506,218 |
Heijmans NV (Certificaten Van Aandelen) | 319,533 | | 4,251,256 |
VastNed Retail NV | 90,134 | | 4,167,632 |
TOTAL NETHERLANDS | | 19,660,188 |
Philippines - 0.4% |
Jollibee Food Corp. | 566,420 | | 2,325,186 |
Portugal - 0.4% |
Jeronimo Martins SGPS SA | 128,900 | | 2,381,940 |
South Africa - 1.6% |
Clicks Group Ltd. | 957,241 | | 5,964,430 |
Nampak Ltd. | 997,000 | | 3,297,263 |
TOTAL SOUTH AFRICA | | 9,261,693 |
Spain - 1.1% |
Grifols SA | 54,232 | | 2,224,100 |
Prosegur Compania de Seguridad SA (Reg.) | 717,890 | | 4,269,252 |
TOTAL SPAIN | | 6,493,352 |
Sweden - 2.1% |
Fagerhult AB | 137,487 | | 4,222,176 |
Intrum Justitia AB | 286,334 | | 7,622,258 |
TOTAL SWEDEN | | 11,844,434 |
Switzerland - 0.4% |
Zehnder Group AG | 42,336 | | 1,994,670 |
Turkey - 1.6% |
Albaraka Turk Katilim Bankasi A/S (a) | 3,932,046 | | 3,506,095 |
Coca-Cola Icecek A/S | 198,362 | | 5,688,779 |
TOTAL TURKEY | | 9,194,874 |
Common Stocks - continued |
| Shares | | Value |
United Kingdom - 19.3% |
Babcock International Group PLC | 219,700 | | $ 4,491,404 |
Bellway PLC | 258,872 | | 6,242,733 |
Berendsen PLC | 281,163 | | 4,375,177 |
Britvic PLC | 462,271 | | 4,632,533 |
Dechra Pharmaceuticals PLC | 342,500 | | 3,789,235 |
Derwent London PLC | 89,210 | | 3,581,704 |
Elementis PLC | 1,272,510 | | 5,286,528 |
Fenner PLC | 389,762 | | 2,499,778 |
Great Portland Estates PLC | 660,789 | | 6,070,987 |
H&T Group PLC | 214,353 | | 567,094 |
Hilton Food Group PLC | 142,800 | | 979,972 |
InterContinental Hotel Group PLC ADR | 130,126 | | 3,819,198 |
Johnson Matthey PLC | 89,175 | | 4,295,215 |
Meggitt PLC | 563,614 | | 5,173,675 |
Persimmon PLC | 191,863 | | 3,891,559 |
Rotork PLC | 153,400 | | 7,041,879 |
Serco Group PLC | 641,797 | | 5,731,849 |
Shaftesbury PLC | 564,273 | | 5,374,247 |
Spectris PLC | 196,078 | | 7,268,731 |
Spirax-Sarco Engineering PLC | 176,521 | | 8,258,925 |
Ted Baker PLC | 92,300 | | 2,526,255 |
Ultra Electronics Holdings PLC | 191,958 | | 5,952,571 |
Unite Group PLC | 1,160,870 | | 7,370,902 |
TOTAL UNITED KINGDOM | | 109,222,151 |
United States of America - 12.2% |
ANSYS, Inc. (a) | 16,285 | | 1,424,123 |
Autoliv, Inc. | 58,300 | | 5,202,109 |
BPZ Energy, Inc. (a)(d) | 549,267 | | 1,104,027 |
Broadridge Financial Solutions, Inc. | 44,505 | | 1,564,796 |
Dril-Quip, Inc. (a) | 38,395 | | 4,508,341 |
Evercore Partners, Inc. Class A | 85,700 | | 4,325,279 |
Greenhill & Co., Inc. | 55,195 | | 2,831,504 |
Kansas City Southern | 17,904 | | 2,175,694 |
Kennedy-Wilson Holdings, Inc. | 193,329 | | 3,874,313 |
Martin Marietta Materials, Inc. | 41,720 | | 4,092,315 |
Mohawk Industries, Inc. (a) | 37,700 | | 4,992,234 |
Oceaneering International, Inc. | 46,102 | | 3,959,240 |
PriceSmart, Inc. | 95,971 | | 10,920,540 |
ResMed, Inc. (d) | 99,100 | | 5,127,434 |
Common Stocks - continued |
| Shares | | Value |
United States of America - continued |
Solera Holdings, Inc. | 114,956 | | $ 6,462,826 |
SS&C Technologies Holdings, Inc. (a) | 163,958 | | 6,443,549 |
TOTAL UNITED STATES OF AMERICA | | 69,008,324 |
TOTAL COMMON STOCKS (Cost $404,246,204) |
547,044,600
|
Nonconvertible Preferred Stocks - 0.8% |
| | | |
Brazil - 0.2% |
Banco ABC Brasil SA | 222,389 | | 1,368,960 |
Germany - 0.6% |
Sartorius AG (non-vtg.) | 32,579 | | 3,436,993 |
TOTAL NONCONVERTIBLE PREFERRED STOCKS (Cost $5,148,060) |
4,805,953
|
Money Market Funds - 4.5% |
| | | |
Fidelity Cash Central Fund, 0.09% (b) | 18,051,128 | | 18,051,128 |
Fidelity Securities Lending Cash Central Fund, 0.09% (b)(c) | 7,174,591 | | 7,174,591 |
TOTAL MONEY MARKET FUNDS (Cost $25,225,719) |
25,225,719
|
TOTAL INVESTMENT PORTFOLIO - 102.1% (Cost $434,619,983) | | 577,076,272 |
NET OTHER ASSETS (LIABILITIES) - (2.1)% | | (12,118,320) |
NET ASSETS - 100% | $ 564,957,952 |
Legend |
(a) Non-income producing |
(b) Affiliated fund that is generally available only to investment companies and other accounts managed by Fidelity Investments. The rate quoted is the annualized seven-day yield of the fund at period end. A complete unaudited listing of the fund's holdings as of its most recent quarter end is available upon request. In addition, each Fidelity Central Fund's financial statements, which are not covered by the Fund's Report of Independent Registered Public Accounting Firm, are available on the SEC's website or upon request. |
(c) Investment made with cash collateral received from securities on loan. |
(d) Security or a portion of the security is on loan at period end. |
(e) Security or a portion of the security purchased on a delayed delivery or when-issued basis. |
Affiliated Central Funds |
Information regarding fiscal year to date income earned by the Fund from investments in Fidelity Central Funds is as follows: |
Fund | Income earned |
Fidelity Cash Central Fund | $ 23,340 |
Fidelity Securities Lending Cash Central Fund | 158,525 |
Total | $ 181,865 |
Other Information |
Categorizations in the Schedule of Investments are based on country or territory of incorporation. |
The following is a summary of the inputs used, as of October 31, 2013, involving the Fund's assets and liabilities carried at fair value. The inputs or methodology used for valuing securities may not be an indication of the risk associated with investing in those securities. For more information on valuation inputs, and their aggregation into the levels used in the tables below, please refer to the Investment Valuation section in the accompanying Notes to Financial Statements. |
Valuation Inputs at Reporting Date: |
Description | Total | Level 1 | Level 2 | Level 3 |
Investments in Securities: | | | | |
Equities: | | | | |
Consumer Discretionary | $ 104,744,679 | $ 64,182,798 | $ 36,970,363 | $ 3,591,518 |
Consumer Staples | 59,708,346 | 41,205,104 | 18,503,242 | - |
Energy | 18,578,952 | 18,440,750 | 138,202 | - |
Financials | 104,490,347 | 83,528,197 | 20,962,150 | - |
Health Care | 33,918,209 | 27,464,809 | 6,453,400 | - |
Industrials | 136,377,301 | 105,539,849 | 30,837,452 | - |
Information Technology | 39,408,904 | 27,450,577 | 11,958,327 | - |
Materials | 54,623,815 | 36,649,329 | 17,974,486 | - |
Money Market Funds | 25,225,719 | 25,225,719 | - | - |
Total Investments in Securities: | $ 577,076,272 | $ 429,687,132 | $ 143,797,622 | $ 3,591,518 |
The following is a summary of transfers between Level 1 and Level 2 for the period ended October 31, 2013. Transfers are assumed to have occurred at the beginning of the period, and are primarily attributable to the valuation techniques used for foreign equity securities, as discussed in the accompanying Notes to Financial Statements: |
Transfers | Total |
Level 1 to Level 2 | $ 76,627,921 |
Level 2 to Level 1 | $ 0 |
See accompanying notes which are an integral part of the financial statements.
Annual Report
Statement of Assets and Liabilities
| October 31, 2013 |
| | |
Assets | | |
Investment in securities, at value (including securities loaned of $6,987,440) - See accompanying schedule: Unaffiliated issuers (cost $409,394,264) | $ 551,850,553 | |
Fidelity Central Funds (cost $25,225,719) | 25,225,719 | |
Total Investments (cost $434,619,983) | | $ 577,076,272 |
Receivable for investments sold | | 4,506,670 |
Receivable for fund shares sold | | 507,688 |
Dividends receivable | | 1,303,342 |
Distributions receivable from Fidelity Central Funds | | 9,452 |
Prepaid expenses | | 1,697 |
Other receivables | | 7,965 |
Total assets | | 583,413,086 |
| | |
Liabilities | | |
Payable for investments purchased
Regular delivery | $ 9,748,207 | |
Delayed delivery | 121,976 | |
Payable for fund shares redeemed | 696,646 | |
Accrued management fee | 466,893 | |
Distribution and service plan fees payable | 16,120 | |
Other affiliated payables | 129,994 | |
Other payables and accrued expenses | 100,707 | |
Collateral on securities loaned, at value | 7,174,591 | |
Total liabilities | | 18,455,134 |
| | |
Net Assets | | $ 564,957,952 |
Net Assets consist of: | | |
Paid in capital | | $ 731,355,395 |
Undistributed net investment income | | 3,595,468 |
Accumulated undistributed net realized gain (loss) on investments and foreign currency transactions | | (312,444,762) |
Net unrealized appreciation (depreciation) on investments and assets and liabilities in foreign currencies | | 142,451,851 |
Net Assets | | $ 564,957,952 |
See accompanying notes which are an integral part of the financial statements.
Annual Report
Statement of Assets and Liabilities - continued
| October 31, 2013 |
| | |
Calculation of Maximum Offering Price Class A:
Net Asset Value and redemption price per share ($22,051,924 ÷ 1,611,668 shares) | | $ 13.68 |
| | |
Maximum offering price per share (100/94.25 of $13.68) | | $ 14.51 |
Class T:
Net Asset Value and redemption price per share ($9,634,442 ÷ 710,451 shares) | | $ 13.56 |
| | |
Maximum offering price per share (100/96.50 of $13.56) | | $ 14.05 |
Class B:
Net Asset Value and offering price per share ($1,410,258 ÷ 105,955 shares)A | | $ 13.31 |
| | |
Class C:
Net Asset Value and offering price per share ($8,070,406 ÷ 607,758 shares)A | | $ 13.28 |
| | |
| | |
International Small Cap Opportunities:
Net Asset Value, offering price and redemption price per share ($518,121,061 ÷ 37,496,899 shares) | | $ 13.82 |
| | |
Institutional Class:
Net Asset Value, offering price and redemption price per share ($5,669,861 ÷ 409,848 shares) | | $ 13.83 |
A Redemption price per share is equal to net asset value less any applicable contingent deferred sales charge.
See accompanying notes which are an integral part of the financial statements.
Annual Report
Financial Statements - continued
Statement of Operations
| Year ended October 31, 2013 |
| | |
Investment Income | | |
Dividends | | $ 10,512,209 |
Income from Fidelity Central Funds | | 181,865 |
Income before foreign taxes withheld | | 10,694,074 |
Less foreign taxes withheld | | (769,601) |
Total income | | 9,924,473 |
| | |
Expenses | | |
Management fee
Basic fee | $ 3,787,691 | |
Performance adjustment | 774,974 | |
Transfer agent fees | 1,108,282 | |
Distribution and service plan fees | 181,823 | |
Accounting and security lending fees | 230,791 | |
Custodian fees and expenses | 134,829 | |
Independent trustees' compensation | 2,439 | |
Registration fees | 95,153 | |
Audit | 68,957 | |
Legal | 1,172 | |
Miscellaneous | 3,054 | |
Total expenses before reductions | 6,389,165 | |
Expense reductions | (68,959) | 6,320,206 |
Net investment income (loss) | | 3,604,267 |
Realized and Unrealized Gain (Loss) Net realized gain (loss) on: | | |
Investment securities: | | |
Unaffiliated issuers | 37,160,055 | |
Foreign currency transactions | (43,323) | |
Total net realized gain (loss) | | 37,116,732 |
Change in net unrealized appreciation (depreciation) on: Investment securities | 71,930,920 | |
Assets and liabilities in foreign currencies | 14,737 | |
Total change in net unrealized appreciation (depreciation) | | 71,945,657 |
Net gain (loss) | | 109,062,389 |
Net increase (decrease) in net assets resulting from operations | | $ 112,666,656 |
See accompanying notes which are an integral part of the financial statements.
Annual Report
Statement of Changes in Net Assets
| Year ended
October 31,
2013 | Year ended
October 31,
2012 |
Increase (Decrease) in Net Assets | | |
Operations | | |
Net investment income (loss) | $ 3,604,267 | $ 3,779,313 |
Net realized gain (loss) | 37,116,732 | 21,361,280 |
Change in net unrealized appreciation (depreciation) | 71,945,657 | 17,236,425 |
Net increase (decrease) in net assets resulting
from operations | 112,666,656 | 42,377,018 |
Distributions to shareholders from net investment income | (3,311,096) | (4,886,680) |
Distributions to shareholders from net realized gain | (171,255) | (369,319) |
Total distributions | (3,482,351) | (5,255,999) |
Share transactions - net increase (decrease) | 81,271,586 | (28,976,326) |
Redemption fees | 56,441 | 64,463 |
Total increase (decrease) in net assets | 190,512,332 | 8,209,156 |
| | |
Net Assets | | |
Beginning of period | 374,445,620 | 366,236,464 |
End of period (including undistributed net investment income of $3,595,468 and undistributed net investment income of $3,302,296, respectively) | $ 564,957,952 | $ 374,445,620 |
See accompanying notes which are an integral part of the financial statements.
Annual Report
Financial Highlights - Class A
Years ended October 31, | 2013 | 2012 | 2011 | 2010 | 2009 |
Selected Per-Share Data | | | | | |
Net asset value, beginning of period | $ 10.78 | $ 9.75 | $ 9.82 | $ 8.07 | $ 6.24 |
Income from Investment Operations | | | | | |
Net investment income (loss) C | .07 | .08 | .15 F | .06 | .06 |
Net realized and unrealized gain (loss) | 2.91 | 1.07 | (.07) | 1.85 | 1.77 |
Total from investment operations | 2.98 | 1.15 | .08 | 1.91 | 1.83 |
Distributions from net investment income | (.08) | (.11) | (.11) | (.07) | - |
Distributions from net realized gain | (.01) | (.01) | (.04) | (.09) | - |
Total distributions | (.08) I | (.12) | (.15) | (.16) | - |
Redemption fees added to paid in capital C, H | - | - | - | - | - |
Net asset value, end of period | $ 13.68 | $ 10.78 | $ 9.75 | $ 9.82 | $ 8.07 |
Total Return A, B | 27.85% | 12.00% | .81% | 24.05% | 29.33% |
Ratios to Average Net Assets D, G | | | | | |
Expenses before reductions | 1.70% | 1.75% | 1.34% | 1.16% | .94% |
Expenses net of fee waivers, if any | 1.65% | 1.65% | 1.33% | 1.16% | .94% |
Expenses net of all reductions | 1.64% | 1.64% | 1.32% | 1.15% | .89% |
Net investment income (loss) | .59% | .85% | 1.44% F | .74% | 1.00% |
Supplemental Data | | | | | |
Net assets, end of period (000 omitted) | $ 22,052 | $ 18,194 | $ 18,686 | $ 20,228 | $ 18,883 |
Portfolio turnover rate E | 31% | 28% | 24% | 49% | 174% |
A Total returns would have been lower if certain expenses had not been reduced during the applicable periods shown.
B Total returns do not include the effect of the sales charges.
C Calculated based on average shares outstanding during the period.
D Fees and expenses of any underlying Fidelity Central Funds are not included in the Fund's expense ratio. The Fund indirectly bears its proportionate share of the expenses of any underlying Fidelity Central Funds.
E Amount does not include the portfolio activity of any underlying Fidelity Central Funds.
F Investment income per share reflects a large, non-recurring dividend which amounted to $.06 per share. Excluding this non-recurring dividend, the ratio of net investment income (loss) to average net assets would have been .80%.
G Expense ratios reflect operating expenses of the class. Expenses before reductions do not reflect amounts reimbursed by the investment adviser or reductions from brokerage service arrangements or reductions from other expense offset arrangements and do not represent the amount paid by the class during periods when reimbursements or reductions occur. Expenses net of fee waivers reflect expenses after reimbursement by the investment adviser but prior to reductions from brokerage service arrangements or other expense offset arrangements. Expenses net of all reductions represent the net expenses paid by the class.
H Amount represents less than $.01 per share.
I Total distributions of $.08 per share is comprised of distributions from net investment income of $.077 and distributions from net realized gain of $.005 per share.
See accompanying notes which are an integral part of the financial statements.
Annual Report
Financial Highlights - Class T
Years ended October 31, | 2013 | 2012 | 2011 | 2010 | 2009 |
Selected Per-Share Data | | | | | |
Net asset value, beginning of period | $ 10.69 | $ 9.66 | $ 9.72 | $ 8.00 | $ 6.20 |
Income from Investment Operations | | | | | |
Net investment income (loss) C | .04 | .06 | .12 F | .04 | .05 |
Net realized and unrealized gain (loss) | 2.89 | 1.06 | (.06) | 1.83 | 1.75 |
Total from investment operations | 2.93 | 1.12 | .06 | 1.87 | 1.80 |
Distributions from net investment income | (.05) | (.08) | (.08) | (.06) | - |
Distributions from net realized gain | (.01) | (.01) | (.04) | (.09) | - |
Total distributions | (.06) | (.09) | (.12) | (.15) | - |
Redemption fees added to paid in capital C, H | - | - | - | - | - |
Net asset value, end of period | $ 13.56 | $ 10.69 | $ 9.66 | $ 9.72 | $ 8.00 |
Total Return A, B | 27.53% | 11.72% | .60% | 23.65% | 29.03% |
Ratios to Average Net Assets D, G | | | | | |
Expenses before reductions | 1.96% | 2.02% | 1.60% | 1.43% | 1.20% |
Expenses net of fee waivers, if any | 1.90% | 1.90% | 1.60% | 1.43% | 1.20% |
Expenses net of all reductions | 1.89% | 1.89% | 1.59% | 1.41% | 1.15% |
Net investment income (loss) | .34% | .60% | 1.17% F | .48% | .74% |
Supplemental Data | | | | | |
Net assets, end of period (000 omitted) | $ 9,634 | $ 8,169 | $ 8,701 | $ 11,202 | $ 11,915 |
Portfolio turnover rate E | 31% | 28% | 24% | 49% | 174% |
A Total returns would have been lower if certain expenses had not been reduced during the applicable periods shown.
B Total returns do not include the effect of the sales charges.
C Calculated based on average shares outstanding during the period.
D Fees and expenses of any underlying Fidelity Central Funds are not included in the Fund's expense ratio. The Fund indirectly bears its proportionate share of the expenses of any underlying Fidelity Central Funds.
E Amount does not include the portfolio activity of any underlying Fidelity Central Funds.
F Investment income per share reflects a large, non-recurring dividend which amounted to $.06 per share. Excluding this non-recurring dividend, the ratio of net investment income (loss) to average net assets would have been .54%.
G Expense ratios reflect operating expenses of the class. Expenses before reductions do not reflect amounts reimbursed by the investment adviser or reductions from brokerage service arrangements or reductions from other expense offset arrangements and do not represent the amount paid by the class during periods when reimbursements or reductions occur. Expenses net of fee waivers reflect expenses after reimbursement by the investment adviser but prior to reductions from brokerage service arrangements or other expense offset arrangements. Expenses net of all reductions represent the net expenses paid by the class.
H Amount represents less than $.01 per share.
See accompanying notes which are an integral part of the financial statements.
Annual Report
Financial Highlights - Class B
Years ended October 31, | 2013 | 2012 | 2011 | 2010 | 2009 |
Selected Per-Share Data | | | | | |
Net asset value, beginning of period | $ 10.50 | $ 9.48 | $ 9.54 | $ 7.87 | $ 6.12 |
Income from Investment Operations | | | | | |
Net investment income (loss) C | (.02) | .01 | .07 F | - H | .02 |
Net realized and unrealized gain (loss) | 2.84 | 1.05 | (.06) | 1.79 | 1.73 |
Total from investment operations | 2.82 | 1.06 | .01 | 1.79 | 1.75 |
Distributions from net investment income | - H | (.03) | (.06) | (.03) | - |
Distributions from net realized gain | (.01) | (.01) | (.02) | (.09) | - |
Total distributions | (.01) | (.04) | (.07) I | (.12) | - |
Redemption fees added to paid in capital C, H | - | - | - | - | - |
Net asset value, end of period | $ 13.31 | $ 10.50 | $ 9.48 | $ 9.54 | $ 7.87 |
Total Return A, B | 26.86% | 11.21% | .10% | 23.03% | 28.59% |
Ratios to Average Net Assets D, G | | | | | |
Expenses before reductions | 2.46% | 2.50% | 2.09% | 1.91% | 1.69% |
Expenses net of fee waivers, if any | 2.40% | 2.40% | 2.09% | 1.91% | 1.69% |
Expenses net of all reductions | 2.39% | 2.39% | 2.07% | 1.90% | 1.64% |
Net investment income (loss) | (.16)% | .10% | .68% F | (.01)% | .25% |
Supplemental Data | | | | | |
Net assets, end of period (000 omitted) | $ 1,410 | $ 1,966 | $ 2,293 | $ 2,902 | $ 2,799 |
Portfolio turnover rate E | 31% | 28% | 24% | 49% | 174% |
A Total returns would have been lower if certain expenses had not been reduced during the applicable periods shown.
B Total returns do not include the effect of the contingent deferred sales charge.
C Calculated based on average shares outstanding during the period.
D Fees and expenses of any underlying Fidelity Central Funds are not included in the Fund's expense ratio. The Fund indirectly bears its proportionate share of the expenses of any underlying Fidelity Central Funds.
E Amount does not include the portfolio activity of any underlying Fidelity Central Funds.
F Investment income per share reflects a large, non-recurring dividend which amounted to $.06 per share. Excluding this non-recurring dividend, the ratio of net investment income (loss) to average net assets would have been .05%.
G Expense ratios reflect operating expenses of the class. Expenses before reductions do not reflect amounts reimbursed by the investment adviser or reductions from brokerage service arrangements or reductions from other expense offset arrangements and do not represent the amount paid by the class during periods when reimbursements or reductions occur. Expenses net of fee waivers reflect expenses after reimbursement by the investment adviser but prior to reductions from brokerage service arrangements or other expense offset arrangements. Expenses net of all reductions represent the net expenses paid by the class.
H Amount represents less than $.01 per share.
I Total distributions of $.07 per share is comprised of distributions from net investment income of $.058 and distributions from net realized gain of $.015 per share.
See accompanying notes which are an integral part of the financial statements.
Annual Report
Financial Highlights - Class C
Years ended October 31, | 2013 | 2012 | 2011 | 2010 | 2009 |
Selected Per-Share Data | | | | | |
Net asset value, beginning of period | $ 10.48 | $ 9.47 | $ 9.53 | $ 7.86 | $ 6.11 |
Income from Investment Operations | | | | | |
Net investment income (loss) C | (.02) | .01 | .07 F | - H | .02 |
Net realized and unrealized gain (loss) | 2.84 | 1.04 | (.06) | 1.79 | 1.73 |
Total from investment operations | 2.82 | 1.05 | .01 | 1.79 | 1.75 |
Distributions from net investment income | (.01) | (.03) | (.06) | (.03) | - |
Distributions from net realized gain | (.01) | (.01) | (.02) | (.09) | - |
Total distributions | (.02) | (.04) | (.07) I | (.12) | - |
Redemption fees added to paid in capital C, H | - | - | - | - | - |
Net asset value, end of period | $ 13.28 | $ 10.48 | $ 9.47 | $ 9.53 | $ 7.86 |
Total Return A, B | 26.91% | 11.13% | .10% | 23.06% | 28.64% |
Ratios to Average Net Assets D, G | | | | | |
Expenses before reductions | 2.45% | 2.50% | 2.09% | 1.91% | 1.68% |
Expenses net of fee waivers, if any | 2.40% | 2.40% | 2.09% | 1.91% | 1.68% |
Expenses net of all reductions | 2.39% | 2.39% | 2.07% | 1.90% | 1.63% |
Net investment income (loss) | (.16)% | .10% | .68% F | (.01)% | .26% |
Supplemental Data | | | | | |
Net assets, end of period (000 omitted) | $ 8,070 | $ 6,608 | $ 6,900 | $ 8,936 | $ 8,543 |
Portfolio turnover rate E | 31% | 28% | 24% | 49% | 174% |
A Total returns would have been lower if certain expenses had not been reduced during the applicable periods shown.
B Total returns do not include the effect of the contingent deferred sales charge.
C Calculated based on average shares outstanding during the period.
D Fees and expenses of any underlying Fidelity Central Funds are not included in the Fund's expense ratio. The Fund indirectly bears its proportionate share of the expenses of any underlying Fidelity Central Funds.
E Amount does not include the portfolio activity of any underlying Fidelity Central Funds.
F Investment income per share reflects a large, non-recurring dividend which amounted to $.06 per share. Excluding this non-recurring dividend, the ratio of net investment income (loss) to average net assets would have been .05%.
G Expense ratios reflect operating expenses of the class. Expenses before reductions do not reflect amounts reimbursed by the investment adviser or reductions from brokerage service arrangements or reductions from other expense offset arrangements and do not represent the amount paid by the class during periods when reimbursements or reductions occur. Expenses net of fee waivers reflect expenses after reimbursement by the investment adviser but prior to reductions from brokerage service arrangements or other expense offset arrangements. Expenses net of all reductions represent the net expenses paid by the class.
H Amount represents less than $.01 per share.
I Total distributions of $.07 per share is comprised of distributions from net investment income of $.058 and distributions from net realized gain of $.015 per share.
See accompanying notes which are an integral part of the financial statements.
Annual Report
Financial Highlights - International Small Cap Opportunities
Years ended October 31, | 2013 | 2012 | 2011 | 2010 | 2009 |
Selected Per-Share Data | | | | | |
Net asset value, beginning of period | $ 10.88 | $ 9.85 | $ 9.92 | $ 8.14 | $ 6.28 |
Income from Investment Operations | | | | | |
Net investment income (loss) B | .10 | .11 | .17 E | .09 | .08 |
Net realized and unrealized gain (loss) | 2.95 | 1.07 | (.06) | 1.87 | 1.78 |
Total from investment operations | 3.05 | 1.18 | .11 | 1.96 | 1.86 |
Distributions from net investment income | (.10) | (.14) | (.14) | (.09) | - G |
Distributions from net realized gain | (.01) | (.01) | (.04) | (.09) | - |
Total distributions | (.11) | (.15) | (.18) | (.18) | - G |
Redemption fees added to paid in capital B, G | - | - | - | - | - |
Net asset value, end of period | $ 13.82 | $ 10.88 | $ 9.85 | $ 9.92 | $ 8.14 |
Total Return A | 28.24% | 12.21% | 1.10% | 24.43% | 29.68% |
Ratios to Average Net Assets C, F | | | | | |
Expenses before reductions | 1.39% | 1.47% | 1.08% | .91% | .68% |
Expenses net of fee waivers, if any | 1.39% | 1.40% | 1.08% | .91% | .68% |
Expenses net of all reductions | 1.38% | 1.39% | 1.06% | .89% | .64% |
Net investment income (loss) | .85% | 1.10% | 1.69% E | 1.00% | 1.25% |
Supplemental Data | | | | | |
Net assets, end of period (000 omitted) | $ 518,121 | $ 334,918 | $ 328,262 | $ 398,331 | $ 329,128 |
Portfolio turnover rate D | 31% | 28% | 24% | 49% | 174% |
A Total returns would have been lower if certain expenses had not been reduced during the applicable periods shown.
B Calculated based on average shares outstanding during the period.
C Fees and expenses of any underlying Fidelity Central Funds are not included in the Fund's expense ratio. The Fund indirectly bears its proportionate share of the expenses of any underlying Fidelity Central Funds.
D Amount does not include the portfolio activity of any underlying Fidelity Central Funds.
E Investment income per share reflects a large, non-recurring dividend which amounted to $.07 per share. Excluding this non-recurring dividend, the ratio of net investment income (loss) to average net assets would have been 1.06%.
F Expense ratios reflect operating expenses of the class. Expenses before reductions do not reflect amounts reimbursed by the investment adviser or reductions from brokerage service arrangements or reductions from other expense offset arrangements and do not represent the amount paid by the class during periods when reimbursements or reductions occur. Expenses net of fee waivers reflect expenses after reimbursement by the investment adviser but prior to reductions from brokerage service arrangements or other expense offset arrangements. Expenses net of all reductions represent the net expenses paid by the class.
G Amount represents less than $.01 per share.
See accompanying notes which are an integral part of the financial statements.
Annual Report
Financial Highlights - Institutional Class
Years ended October 31, | 2013 | 2012 | 2011 | 2010 | 2009 |
Selected Per-Share Data | | | | | |
Net asset value, beginning of period | $ 10.90 | $ 9.86 | $ 9.93 | $ 8.14 | $ 6.27 |
Income from Investment Operations | | | | | |
Net investment income (loss) B | .11 | .11 | .18 E | .09 | .08 |
Net realized and unrealized gain (loss) | 2.93 | 1.08 | (.06) | 1.86 | 1.79 |
Total from investment operations | 3.04 | 1.19 | .12 | 1.95 | 1.87 |
Distributions from net investment income | (.10) | (.14) | (.15) | (.07) | - G |
Distributions from net realized gain | (.01) | (.01) | (.04) | (.09) | - |
Total distributions | (.11) | (.15) | (.19) | (.16) | - G |
Redemption fees added to paid in capital B, G | - | - | - | - | - |
Net asset value, end of period | $ 13.83 | $ 10.90 | $ 9.86 | $ 9.93 | $ 8.14 |
Total Return A | 28.11% | 12.32% | 1.13% | 24.33% | 29.87% |
Ratios to Average Net Assets C, F | | | | | |
Expenses before reductions | 1.38% | 1.44% | 1.03% | .90% | .68% |
Expenses net of fee waivers, if any | 1.37% | 1.40% | 1.03% | .90% | .68% |
Expenses net of all reductions | 1.37% | 1.39% | 1.02% | .88% | .64% |
Net investment income (loss) | .87% | 1.10% | 1.74% E | 1.01% | 1.25% |
Supplemental Data | | | | | |
Net assets, end of period (000 omitted) | $ 5,670 | $ 4,591 | $ 1,395 | $ 2,418 | $ 2,022 |
Portfolio turnover rate D | 31% | 28% | 24% | 49% | 174% |
A Total returns would have been lower if certain expenses had not been reduced during the applicable periods shown.
B Calculated based on average shares outstanding during the period.
C Fees and expenses of any underlying Fidelity Central Funds are not included in the Fund's expense ratio. The Fund indirectly bears its proportionate share of the expenses of any underlying Fidelity Central Funds.
D Amount does not include the portfolio activity of any underlying Fidelity Central Funds.
E Investment income per share reflects a large, non-recurring dividend which amounted to $.07 per share. Excluding this non-recurring dividend, the ratio of net investment income (loss) to average net assets would have been 1.11%.
F Expense ratios reflect operating expenses of the class. Expenses before reductions do not reflect amounts reimbursed by the investment adviser or reductions from brokerage service arrangements or reductions from other expense offset arrangements and do not represent the amount paid by the class during periods when reimbursements or reductions occur. Expenses net of fee waivers reflect expenses after reimbursement by the investment adviser but prior to reductions from brokerage service arrangements or other expense offset arrangements. Expenses net of all reductions represent the net expenses paid by the class.
G Amount represents less than $.01 per share.
See accompanying notes which are an integral part of the financial statements.
Annual Report
Notes to Financial Statements
For the period ended October 31, 2013
1. Organization.
Fidelity International Small Cap Opportunities Fund (the Fund) is a fund of Fidelity Investment Trust (the Trust) and is authorized to issue an unlimited number of shares. The Trust is registered under the Investment Company Act of 1940, as amended (the 1940 Act), as an open-end management investment company organized as a Massachusetts business trust. The Fund offers Class A, Class T, Class C, International Small Cap Opportunities and Institutional Class shares, each of which, along with Class B shares, has equal rights as to assets and voting privileges. Class B shares are closed to new accounts and additional purchases, except for exchanges and reinvestments. Each class has exclusive voting rights with respect to matters that affect that class. Class B shares will automatically convert to Class A shares after a holding period of seven years from the initial date of purchase.
2. Investments in Fidelity Central Funds.
The Fund invests in Fidelity Central Funds, which are open-end investment companies generally available only to other investment companies and accounts managed by Fidelity Management & Research Company (FMR) and its affiliates. The Fund's Schedule of Investments lists each of the Fidelity Central Funds held as of period end, if any, as an investment of the Fund, but does not include the underlying holdings of each Fidelity Central Fund. As an Investing Fund, the Fund indirectly bears its proportionate share of the expenses of the underlying Fidelity Central Funds.
The Money Market Central Funds seek preservation of capital and current income and are managed by Fidelity Investments Money Management, Inc. (FIMM), an affiliate of FMR.
A complete unaudited list of holdings for each Fidelity Central Fund is available upon request or at the Securities and Exchange Commission (the SEC) website at www.sec.gov. In addition, the financial statements of the Fidelity Central Funds, which are not covered by the Fund's Report of Independent Registered Public Accounting Firm, are available on the SEC website or upon request.
3. Significant Accounting Policies.
The financial statements have been prepared in conformity with accounting principles generally accepted in the United States of America (GAAP), which require management to make certain estimates and assumptions at the date of the financial statements. Actual results could differ from those estimates. Subsequent events, if any, through the date that the financial statements were issued have been evaluated in the preparation of
Annual Report
Notes to Financial Statements - continued
3. Significant Accounting Policies - continued
the financial statements. The following summarizes the significant accounting policies of the Fund:
Investment Valuation. Investments are valued as of 4:00 p.m. Eastern time on the last calendar day of the period. In accordance with valuation policies and procedures approved by the Board of Trustees (the Board), the Fund attempts to obtain prices from one or more third party pricing vendors or brokers to value its investments. When current market prices, quotations or currency exchange rates are not readily available or reliable, investments will be fair valued in good faith by the FMR Fair Value Committee (the Committee), in accordance with procedures adopted by the Board. Factors used in determining fair value vary by investment type and may include market or investment specific events. The frequency with which these procedures are used cannot be predicted and they may be utilized to a significant extent. The Committee oversees the Fund's valuation policies and procedures and is responsible for approving and reporting to the Board all fair value determinations.
The Fund categorizes the inputs to valuation techniques used to value its investments into a disclosure hierarchy consisting of three levels as shown below:
Level 1 - quoted prices in active markets for identical investments
Level 2 - other significant observable inputs (including quoted prices for similar investments, interest rates, prepayment speeds, etc.)
Level 3 - unobservable inputs (including the Fund's own assumptions based on the best information available)
Valuation techniques used to value the Fund's investments by major category are as follows:
Equity securities, including restricted securities, for which market quotations are readily available, are valued at the last reported sale price or official closing price as reported by a third party pricing vendor on the primary market or exchange on which they are traded and are categorized as Level 1 in the hierarchy. In the event there were no sales during the day or closing prices are not available, securities are valued at the last quoted bid price or may be valued using the last available price and are generally categorized as Level 2 in the hierarchy. For foreign equity securities, when market or security specific events arise, comparisons to the valuation of American Depositary Receipts (ADRs), futures contracts, Exchange-Traded Funds (ETFs) and certain indexes as well as quoted prices for similar securities may be used and would be categorized as Level 2 in the hierarchy. Utilizing these techniques may result in transfers between Level 1 and Level 2. For equity securities, including restricted securities, where observable inputs are
Annual Report
3. Significant Accounting Policies - continued
Investment Valuation - continued
limited, assumptions about market activity and risk are used and these securities may be categorized as Level 3 in the hierarchy.
Investments in open-end mutual funds, including the Fidelity Central Funds, are valued at their closing net asset value (NAV) each business day and are categorized as Level 1 in the hierarchy.
Changes in valuation techniques may result in transfers in or out of an assigned level within the disclosure hierarchy. The aggregate value of investments by input level, as of October 31, 2013, including information on transfers between Levels 1 and 2 is included at the end of the Fund's Schedule of Investments.
Foreign Currency. The Fund may use foreign currency contracts to facilitate transactions in foreign-denominated securities. Gains and losses from these transactions may arise from changes in the value of the foreign currency or if the counterparties do not perform under the contracts' terms.
Foreign-denominated assets, including investment securities, and liabilities are translated into U.S. dollars at the exchange rates at period end. Purchases and sales of investment securities, income and dividends received and expenses denominated in foreign currencies are translated into U.S. dollars at the exchange rate in effect on the transaction date.
The effects of exchange rate fluctuations on investments are included with the net realized and unrealized gain (loss) on investment securities. Other foreign currency transactions resulting in realized and unrealized gain (loss) are disclosed separately.
Investment Transactions and Income. For financial reporting purposes, the Fund's investment holdings and NAV include trades executed through the end of the last business day of the period. The NAV per share for processing shareholder transactions is calculated as of the close of business of the New York Stock Exchange (NYSE), normally 4:00 p.m. Eastern time and includes trades executed through the end of the prior business day. Gains and losses on securities sold are determined on the basis of identified cost and may include proceeds received from litigation. Dividend income is recorded on the ex-dividend date, except for certain dividends from foreign securities where the ex-dividend date may have passed, which are recorded as soon as the Fund is informed of the ex-dividend date. Non-cash dividends included in dividend income, if any, are recorded at the fair market value of the securities received. Distributions received on securities that represent a return of capital or capital gain are recorded as a reduction of cost of investments and/or as a realized gain. Subsequent to ex-dividend date the Fund determines the components of these distributions, based upon receipt of tax filings or
Annual Report
Notes to Financial Statements - continued
3. Significant Accounting Policies - continued
Investment Transactions and Income - continued
other correspondence relating to the underlying investment. Interest income and distributions from the Fidelity Central Funds are accrued as earned. Investment income is recorded net of foreign taxes withheld where recovery of such taxes is uncertain.
Class Allocations and Expenses. Investment income, realized and unrealized capital gains and losses, common expenses of the Fund, and certain fund-level expense reductions, if any, are allocated daily on a pro-rata basis to each class based on the relative net assets of each class to the total net assets of the Fund. Each class differs with respect to transfer agent and distribution and service plan fees incurred. Certain expense reductions may also differ by class. For the reporting period, the allocated portion of income and expenses to each class as a percent of its average net assets may vary due to the timing of recording these transactions in relation to fluctuating net assets of the classes. Expenses directly attributable to a fund are charged to that fund. Expenses attributable to more than one fund are allocated among the respective funds on the basis of relative net assets or other appropriate methods. Expense estimates are accrued in the period to which they relate and adjustments are made when actual amounts are known.
Income Tax Information and Distributions to Shareholders. Each year, the Fund intends to qualify as a regulated investment company under Subchapter M of the Internal Revenue Code, including distributing substantially all of its taxable income and realized gains. As a result, no provision for U.S. Federal income taxes is required. As of October 31, 2013, the Fund did not have any unrecognized tax benefits in the financial statements; nor is the Fund aware of any tax positions for which it is reasonably possible that the total amounts of unrecognized tax benefits will significantly change in the next twelve months. The Fund files a U.S. federal tax return, in addition to state and local tax returns as required. The Fund's federal income tax returns are subject to examination by the Internal Revenue Service (IRS) for a period of three fiscal years after they are filed. State and local tax returns may be subject to examination for an additional fiscal year depending on the jurisdiction. Foreign taxes are provided for based on the Fund's understanding of the tax rules and rates that exist in the foreign markets in which it invests.
Distributions are declared and recorded on the ex-dividend date. Income dividends and capital gain distributions are declared separately for each class. Income and capital gain distributions are determined in accordance with income tax regulations, which may differ from GAAP.
Capital accounts within the financial statements are adjusted for permanent book-tax differences. These adjustments have no impact on net assets or the results of operations. Temporary book-tax differences will reverse in a subsequent period.
Annual Report
3. Significant Accounting Policies - continued
Income Tax Information and Distributions to Shareholders - continued
Book-tax differences are primarily due to foreign currency transactions, passive foreign investment companies (PFIC), partnerships, capital loss carryforwards and losses deferred due to wash sales.
The federal tax cost of investment securities and unrealized appreciation (depreciation) as of period end were as follows:
Gross unrealized appreciation | $ 146,329,234 |
Gross unrealized depreciation | (9,406,877) |
Net unrealized appreciation (depreciation) on securities and other investments | $ 136,922,357 |
| |
Tax Cost | $ 440,153,915 |
The tax-based components of distributable earnings as of period end were as follows:
Undistributed ordinary income | $ 6,738,514 |
Capital loss carryforward | $ (310,053,876) |
Net unrealized appreciation (depreciation) | $ 136,917,919 |
Capital loss carryforwards are only available to offset future capital gains of the Fund to the extent provided by regulations and may be limited. Under the Regulated Investment Company Modernization Act of 2010 (the Act), the Fund is permitted to carry forward capital losses incurred in taxable years beginning after December 22, 2010 for an unlimited period and such capital losses are required to be used prior to any losses that expire. The capital loss carryforward information presented below, including any applicable limitation, is estimated as of fiscal period end and is subject to adjustment.
Fiscal year of expiration | |
2017 | $ (310,053,876) |
The tax character of distributions paid was as follows:
| October 31, 2013 | October 31, 2012 |
Ordinary Income | $ 3,482,351 | $ 5,255,999 |
Short-Term Trading (Redemption) Fees. Shares held by investors in the Fund less than 90 days may have been subject to a redemption fee equal to 2.00% of the net asset value of shares redeemed. All redemption fees, which reduce the proceeds of the shareholder redemption, are retained by the Fund and accounted for as an addition to paid in capital.
Annual Report
Notes to Financial Statements - continued
3. Significant Accounting Policies - continued
Delayed Delivery Transactions and When-Issued Securities. During the period, the Fund transacted in securities on a delayed delivery or when-issued basis. Payment and delivery may take place after the customary settlement period for that security. The price of the underlying securities and the date when the securities will be delivered and paid for are fixed at the time the transaction is negotiated. The securities purchased on a delayed delivery or when-issued basis are identified as such in the Fund's Schedule of Investments. With respect to purchase commitments, the Fund identifies securities as segregated in its records with a value at least equal to the amount of the commitment. Losses may arise due to changes in the value of the underlying securities or if the counterparty does not perform under the contract's terms, or if the issuer does not issue the securities due to political, economic, or other factors.
4. Purchases and Sales of Investments.
Purchases and sales of securities, other than short-term securities, aggregated $214,172,612 and $131,095,474, respectively.
5. Fees and Other Transactions with Affiliates.
Management Fee. FMR and its affiliates provide the Fund with investment management related services for which the Fund pays a monthly management fee. The management fee is the sum of an individual fund fee rate that is based on an annual rate of .60% of the Fund's average net assets and an annualized group fee rate that averaged .25% during the period. The group fee rate is based upon the average net assets of all the mutual funds advised by FMR, including any mutual funds previously advised by FMR that are currently advised by Fidelity SelectCo, LLC, an affiliate of FMR. The group fee rate decreases as assets under management increase and increases as assets under management decrease. In addition, the management fee is subject to a performance adjustment (up to a maximum of ± .20% of the Fund's average net assets over a 36 month performance period). The upward or downward adjustment to the management fee is based on the relative investment performance of International Small Cap Opportunities as compared to an appropriate benchmark index over the same 36 month performance period. For the reporting period, the total annual management fee rate, including the performance adjustment, was 1.03% of the Fund's average net assets. The performance adjustment included in the management fee rate may be higher or lower than the maximum performance adjustment rate due to the difference between the average net assets for the reporting and performance periods.
Distribution and Service Plan Fees. In accordance with Rule 12b-1 of the 1940 Act, the Fund has adopted separate Distribution and Service Plans for each class of shares. Certain classes pay Fidelity Distributors Corporation (FDC), an affiliate of FMR,
Annual Report
5. Fees and Other Transactions with Affiliates - continued
Distribution and Service Plan Fees - continued
separate Distribution and Service Fees, each of which is based on an annual percentage of each class' average net assets. In addition, FDC may pay financial intermediaries for selling shares of the Fund and providing shareholder support services. For the period, the Distribution and Service Fee rates, total fees and amounts retained by FDC were as follows:
| Distribution
Fee | Service
Fee | Total Fees | Retained
by FDC |
Class A | -% | .25% | $ 50,175 | $ 829 |
Class T | .25% | .25% | 44,164 | 211 |
Class B | .75% | .25% | 16,241 | 12,254 |
Class C | .75% | .25% | 71,243 | 5,808 |
| | | $ 181,823 | $ 19,102 |
Sales Load. FDC may receive a front-end sales charge of up to 5.75% for selling Class A shares and 3.50% for selling Class T shares, some of which is paid to financial intermediaries for selling shares of the Fund. Depending on the holding period, FDC may receive contingent deferred sales charges levied on Class A, Class T, Class B and Class C redemptions. The deferred sales charges range from 5.00% to 1.00% for Class B shares, 1.00% for Class C shares, 1.00% for certain purchases of Class A shares and .25% for certain purchases of Class T shares.
For the period, sales charge amounts retained by FDC were as follows:
| Retained
by FDC |
Class A | $ 5,751 |
Class T | 1,958 |
Class B* | 1,016 |
Class C* | 325 |
| $ 9,050 |
* When Class B and Class C shares are initially sold, FDC pays commissions from its own resources to financial intermediaries through which the sales
are made.
Transfer Agent Fees. Fidelity Investments Institutional Operations Company, Inc., (FIIOC), an affiliate of FMR, is the transfer, dividend disbursing and shareholder servicing agent for each class of the Fund. FIIOC receives account fees and asset-based fees that vary according to the account size and type of account of the shareholders of the respective classes of the Fund. FIIOC receives no fees for providing transfer agency services to Class F. FIIOC pays for typesetting, printing and mailing of shareholder reports, except proxy statements.
Annual Report
Notes to Financial Statements - continued
5. Fees and Other Transactions with Affiliates - continued
Transfer Agent Fees - continued
For the period, transfer agent fees for each class were as follows:
| Amount | % of
Average
Net Assets |
Class A | $ 60,229 | .30 |
Class T | 27,487 | .31 |
Class B | 4,868 | .30 |
Class C | 21,409 | .30 |
International Small Cap Opportunities | 983,422 | .24 |
Institutional Class | 10,867 | .23 |
| $ 1,108,282 | |
Accounting and Security Lending Fees. Fidelity Service Company, Inc. (FSC), an affiliate of FMR, maintains the Fund's accounting records. The accounting fee is based on the level of average net assets for each month. Under a separate contract, FSC administers the security lending program. The security lending fee is based on the number and duration of lending transactions.
Brokerage Commissions. The Fund placed a portion of its portfolio transactions with brokerage firms which are affiliates of the investment adviser. Brokerage commissions are included in net realized gain (loss) and change in net unrealized appreciation (depreciation) in the Statement of Operations. The commissions paid to these affiliated firms were $887 for the period.
6. Committed Line of Credit.
The Fund participates with other funds managed by FMR or an affiliate in a $4.25 billion credit facility (the "line of credit") to be utilized for temporary or emergency purposes to fund shareholder redemptions or for other short-term liquidity purposes. The Fund has agreed to pay commitment fees on its pro-rata portion of the line of credit, which amounted to $920 and is reflected in Miscellaneous expenses on the Statement of Operations. During the period, there were no borrowings on this line of credit.
7. Security Lending.
The Fund lends portfolio securities through a lending agent from time to time in order to earn additional income. For equity securities, a lending agent is used and may loan securities to certain qualified borrowers, including Fidelity Capital Markets (FCM), a broker-dealer affiliated with the Fund. On the settlement date of the loan, the Fund receives collateral (in the form of U.S. Treasury obligations, letters of credit and/or cash) against the loaned securities and maintains collateral in an amount not less than 100% of
Annual Report
7. Security Lending - continued
the market value of the loaned securities during the period of the loan. The market value of the loaned securities is determined at the close of business of the Fund and any additional required collateral is delivered to the Fund on the next business day. If the borrower defaults on its obligation to return the securities loaned because of insolvency or other reasons, the Fund may apply collateral received from the borrower against the obligation. The Fund may experience delays and costs in recovering the securities loaned. Any cash collateral received is invested in the Fidelity Securities Lending Cash Central Fund. The value of loaned securities and cash collateral at period end are disclosed on the Fund's Statement of Assets and Liabilities. At period end, there were no security loans outstanding with FCM. Security lending income represents the income earned on investing cash collateral, less rebates paid to borrowers and any lending agent fees associated with the loan, plus any premium payments received for lending certain types of securities. Security lending income is presented in the Statement of Operations as a component of income from Fidelity Central Funds. Total security lending income during the period amounted to $158,525, including $587 from securities loaned to FCM.
8. Expense Reductions.
FMR voluntarily agreed to reimburse each class to the extent annual operating expenses exceeded certain levels of average net assets as noted in the table below. Some expenses, for example interest expense, including commitment fees, are excluded from this reimbursement.
The following classes were in reimbursement during the period:
| Expense
Limitations | Reimbursement |
Class A | 1.65% | $ 10,041 |
Class T | 1.90% | 5,407 |
Class B | 2.40% | 1,003 |
Class C | 2.40% | 3,591 |
| | $ 20,042 |
In addition, FMR reimbursed a portion of the Fund's operating expenses during the period in the amount of $9,498.
Commissions paid to certain brokers with whom FMR, or its affiliates, places trades on behalf of the Fund include an amount in addition to trade execution, which may be rebated back to the Fund to offset certain expenses. This amount totaled $39,394 for the period. In addition, through arrangements with the Fund's custodian, credits realized as a result of uninvested cash balances were used to reduce the Fund's expenses. During the period, these credits reduced the Fund's custody expenses by $25.
Annual Report
Notes to Financial Statements - continued
9. Distributions to Shareholders.
Distributions to shareholders of each class were as follows:
Years ended October 31, | 2013 | 2012 |
From net investment income | | |
Class A | $ 127,604 | $ 208,264 |
Class T | 40,329 | 69,950 |
Class B | 540 | 6,357 |
Class C | 6,860 | 20,258 |
International Small Cap Opportunities | 3,098,688 | 4,562,121 |
Institutional Class | 37,075 | 19,730 |
Total | $ 3,311,096 | $ 4,886,680 |
From net realized gain | | |
Class A | $ 8,286 | $ 18,763 |
Class T | 3,734 | 8,968 |
Class B | 900 | 2,355 |
Class C | 3,118 | 7,235 |
International Small Cap Opportunities | 153,400 | 330,589 |
Institutional Class | 1,817 | 1,409 |
Total | $ 171,255 | $ 369,319 |
10. Share Transactions.
Transactions for each class of shares were as follows:
| Shares | Dollars |
Years ended October 31, | 2013 | 2012 | 2013 | 2012 |
Class A | | | | |
Shares sold | 373,515 | 245,367 | $ 4,517,568 | $ 2,443,449 |
Reinvestment of distributions | 10,878 | 21,375 | 119,442 | 198,575 |
Shares redeemed | (460,010) | (495,775) | (5,504,745) | (4,923,741) |
Net increase (decrease) | (75,617) | (229,033) | $ (867,735) | $ (2,281,717) |
Class T | | | | |
Shares sold | 94,833 | 101,299 | $ 1,133,727 | $ 986,575 |
Reinvestment of distributions | 3,872 | 8,148 | 42,245 | 75,201 |
Shares redeemed | (152,245) | (246,162) | (1,813,542) | (2,450,796) |
Net increase (decrease) | (53,540) | (136,715) | $ (637,570) | $ (1,389,020) |
Class B | | | | |
Shares sold | 2,465 | 3,884 | $ 28,055 | $ 38,597 |
Reinvestment of distributions | 123 | 862 | 1,326 | 7,845 |
Shares redeemed | (83,897) | (59,335) | (970,172) | (579,917) |
Net increase (decrease) | (81,309) | (54,589) | $ (940,791) | $ (533,475) |
Class C | | | | |
Shares sold | 106,942 | 69,065 | $ 1,277,851 | $ 669,794 |
Reinvestment of distributions | 870 | 2,800 | 9,335 | 25,455 |
Shares redeemed | (130,535) | (170,268) | (1,517,604) | (1,664,901) |
Net increase (decrease) | (22,723) | (98,403) | $ (230,418) | $ (969,652) |
Annual Report
10. Share Transactions - continued
| Shares | Dollars |
Years ended October 31, | 2013 | 2012 | 2013 | 2012 |
International Small Cap Opportunities | | | | |
Shares sold | 13,306,080 | 5,283,408 | $ 163,920,015 | $ 53,067,911 |
Reinvestment of distributions | 279,367 | 495,697 | 3,092,593 | 4,634,765 |
Shares redeemed | (6,858,430) | (8,350,807) | (83,019,406) | (84,356,251) |
Net increase (decrease) | 6,727,017 | (2,571,702) | $ 83,993,202 | $ (26,653,575) |
Institutional Class | | | | |
Shares sold | 107,232 | 348,073 | $ 1,308,852 | $ 3,541,043 |
Reinvestment of distributions | 3,187 | 1,709 | 35,307 | 15,997 |
Shares redeemed | (121,854) | (70,045) | (1,389,261) | (705,927) |
Net increase (decrease) | (11,435) | 279,737 | $ (45,102) | $ 2,851,113 |
11. Other.
The Fund's organizational documents provide former and current trustees and officers with a limited indemnification against liabilities arising in connection with the performance of their duties to the Fund. In the normal course of business, the Fund may also enter into contracts that provide general indemnifications. The Fund's maximum exposure under these arrangements is unknown as this would be dependent on future claims that may be made against the Fund. The risk of material loss from such claims is considered remote.
Annual Report
To the Trustees of Fidelity Investment Trust and Shareholders of Fidelity International Small Cap Opportunities Fund:
We have audited the accompanying statement of assets and liabilities of Fidelity International Small Cap Opportunities Fund (the Fund), a fund of Fidelity Investment Trust, including the schedule of investments, as of October 31, 2013, and the related statement of operations for the year then ended, the statement of changes in net assets for each of the two years in the period then ended, and the financial highlights for each of the five years in the period then ended. These financial statements and financial highlights are the responsibility of the Fund's management. Our responsibility is to express an opinion on these financial statements and financial highlights based on our audits.
We conducted our audits in accordance with the standards of the Public Company Accounting Oversight Board (United States). Those standards require that we plan and perform the audit to obtain reasonable assurance about whether the financial statements and financial highlights are free of material misstatement. The Fund is not required to have, nor were we engaged to perform, an audit of its internal control over financial reporting. Our audits included consideration of internal control over financial reporting as a basis for designing audit procedures that are appropriate in the circumstances, but not for the purpose of expressing an opinion on the effectiveness of the Fund's internal control over financial reporting. Accordingly, we express no such opinion. An audit also includes examining, on a test basis, evidence supporting the amounts and disclosures in the financial statements, assessing the accounting principles used and significant estimates made by management, as well as evaluating the overall financial statement presentation. Our procedures included confirmation of securities owned as of October 31, 2013, by correspondence with the custodians and brokers; where replies were not received from brokers, we performed other auditing procedures. We believe that our audits provide a reasonable basis for our opinion.
In our opinion, the financial statements and financial highlights referred to above present fairly, in all material respects, the financial position of Fidelity International Small Cap Opportunities Fund as of October 31, 2013, the results of its operations for the year then ended, the changes in its net assets for each of the two years in the period then ended, and the financial highlights for each of the five years in the period then ended, in conformity with accounting principles generally accepted in the United States of America.
DELOITTE & TOUCHE LLP
Boston, Massachusetts
December 12, 2013
Annual Report
The Trustees, Member of the Advisory Board, and executive officers of the trust and fund, as applicable, are listed below. The Board of Trustees governs the fund and is responsible for protecting the interests of shareholders. The Trustees are experienced executives who meet periodically throughout the year to oversee the fund's activities, review contractual arrangements with companies that provide services to the fund, oversee management of the risks associated with such activities and contractual arrangements, and review the fund's performance. Except for James C. Curvey, Ned C. Lautenbach, Ronald P. O'Hanley, and William S. Stavropoulos, each of the Trustees oversees 171 funds. Mr. Curvey oversees 394 funds. Mr. Lautenbach, Mr. O'Hanley, and Mr. Stavropoulos each oversees 245 funds.
The Trustees hold office without limit in time except that (a) any Trustee may resign; (b) any Trustee may be removed by written instrument, signed by at least two-thirds of the number of Trustees prior to such removal; (c) any Trustee who requests to be retired or who has become incapacitated by illness or injury may be retired by written instrument signed by a majority of the other Trustees; and (d) any Trustee may be removed at any special meeting of shareholders by a two-thirds vote of the outstanding voting securities of the trust. Each Trustee who is not an interested person of the trust and the fund (as defined in the 1940 Act) (Independent Trustee), shall retire not later than the last day of the calendar year in which his or her 75th birthday occurs. The Independent Trustees may waive this mandatory retirement age policy with respect to individual Trustees. The executive officers and Advisory Board Member hold office without limit in time, except that any officer and Advisory Board Member may resign or may be removed by a vote of a majority of the Trustees at any regular meeting or any special meeting of the Trustees. Except as indicated, each individual has held the office shown or other offices in the same company for the past five years.
Experience, Skills, Attributes, and Qualifications of the Fund's Trustees. The Governance and Nominating Committee has adopted a statement of policy that describes the experience, qualifications, attributes, and skills that are necessary and desirable for potential Independent Trustee candidates (Statement of Policy). The Board believes that each Trustee satisfied at the time he or she was initially elected or appointed a Trustee, and continues to satisfy, the standards contemplated by the Statement of Policy. The Governance and Nominating Committee also engages professional search firms to help identify potential Independent Trustee candidates who have the experience, qualifications, attributes, and skills consistent with the Statement of Policy. From time to time, additional criteria based on the composition and skills of the current Independent Trustees, as well as experience or skills that may be appropriate in light of future changes to board composition, business conditions, and regulatory or other developments, have also been considered by the professional search firms and the Governance and Nominating Committee. In addition, the Board takes into account the Trustees' commitment and participation in Board and committee meetings, as well as their leadership of standing and ad hoc committees throughout their tenure.
Annual Report
In determining that a particular Trustee was and continues to be qualified to serve as a Trustee, the Board has considered a variety of criteria, none of which, in isolation, was controlling. The Board believes that, collectively, the Trustees have balanced and diverse experience, qualifications, attributes, and skills, which allow the Board to operate effectively in governing the fund and protecting the interests of shareholders. Information about the specific experience, skills, attributes, and qualifications of each Trustee, which in each case led to the Board's conclusion that the Trustee should serve (or continue to serve) as a trustee of the fund, is provided below.
Board Structure and Oversight Function. James C. Curvey is an interested person (as defined in the 1940 Act) and currently serves as Chairman. The Trustees have determined that an interested Chairman is appropriate and benefits shareholders because an interested Chairman has a personal and professional stake in the quality and continuity of services provided to the fund. Independent Trustees exercise their informed business judgment to appoint an individual of their choosing to serve as Chairman, regardless of whether the Trustee happens to be independent or a member of management. The Independent Trustees have determined that they can act independently and effectively without having an Independent Trustee serve as Chairman and that a key structural component for assuring that they are in a position to do so is for the Independent Trustees to constitute a substantial majority for the Board. The Independent Trustees also regularly meet in executive session. Ned C. Lautenbach serves as Chairman of the Independent Trustees and as such (i) acts as a liaison between the Independent Trustees and management with respect to matters important to the Independent Trustees and (ii) with management prepares agendas for Board meetings.
Fidelity funds are overseen by different Boards of Trustees. The fund's Board oversees Fidelity's equity and high income funds and another Board oversees Fidelity's investment-grade bond, money market, and asset allocation funds. The asset allocation funds may invest in Fidelity funds overseen by the fund's Board. The use of separate Boards, each with its own committee structure, allows the Trustees of each group of Fidelity funds to focus on the unique issues of the funds they oversee, including common research, investment, and operational issues. On occasion, the separate Boards establish joint committees to address issues of overlapping consequences for the Fidelity funds overseen by each Board.
The Trustees operate using a system of committees to facilitate the timely and efficient consideration of all matters of importance to the Trustees, the fund, and fund shareholders and to facilitate compliance with legal and regulatory requirements and oversight of the fund's activities and associated risks. The Board, acting through its committees, has charged FMR and its affiliates with (i) identifying events or circumstances the occurrence of which could have demonstrably adverse effects on the fund's business and/or reputation; (ii) implementing processes and controls to lessen the possibility that such events or circumstances occur or to mitigate the effects of such events or circumstances if they do occur; and (iii) creating and maintaining a system designed to evaluate continuously business and market conditions in order to facilitate the identification and implementation processes described in (i) and (ii) above. Because the day-to-day operations and activities of the fund are carried out by or through FMR, its affiliates and other service providers, the fund's exposure to risks is mitigated but not eliminated by the processes overseen by the Trustees. While each of the Board's committees has responsibility for overseeing different aspects of the fund's activities, oversight is exercised primarily through the Operations, Audit, and Compliance Committees. In addition, the Independent Trustees have worked with FMR to enhance the Board's oversight of investment and financial risks, legal and regulatory risks, technology risks, and operational risks, including the development of additional risk reporting to the Board. For example, a working group comprised of Independent Trustees and FMR has worked and continues to work to review the Fidelity funds' valuation-related activities, reporting and risk management. Appropriate personnel, including but not limited to the fund's Chief Compliance Officer (CCO), FMR's internal auditor, the independent accountants, the fund's Treasurer and portfolio management personnel, make periodic reports to the Board's committees, as appropriate, including an annual review of FMR's risk management program for the Fidelity funds. The responsibilities of each standing committee, including their oversight responsibilities, are described further under "Standing Committees of the Fund's Trustees."
Annual Report
Trustees and Officers - continued
The fund's Statement of Additional Information (SAI) includes more information about the Trustees. To request a free copy, call Fidelity at 1-800-544-8544.
Interested Trustees*:
Correspondence intended for each Trustee who is an interested person may be sent to Fidelity Investments, 245 Summer Street, Boston, Massachusetts 02210.
Name, Year of Birth; Principal Occupations and Other Relevant Experience+ |
James C. Curvey (1935) |
Year of Election or Appointment: 2007 Trustee Chairman of the Board of Trustees |
| Mr. Curvey also serves as Trustee of other Fidelity funds. Mr. Curvey is a Director of Fidelity Investments Money Management, Inc. (2009-present), Director of Fidelity Research & Analysis Co. (2009-present) and Director of FMR and FMR Co., Inc. (2007-present). Mr. Curvey is also Vice Chairman (2007-present) and Director of FMR LLC. In addition, Mr. Curvey serves as an Overseer for the Boston Symphony Orchestra and a member of the Trustees of Villanova University. Previously, Mr. Curvey was the Vice Chairman (2006-2007) and Director (2000-2007) of FMR Corp. |
Ronald P. O'Hanley (1957) |
Year of Election or Appointment: 2011 Trustee |
| Mr. O'Hanley also serves as Trustee of other Fidelity funds. He is Director of Fidelity SelectCo, LLC (2013-present), FMR Co., Inc. (2010-present), Director of Fidelity Investments Money Management, Inc. (2010-present), Director of Fidelity Research & Analysis Company (2010-present), President of Fidelity Asset Management and Corporate Services and a Member of Fidelity's Executive Committee (2010-present). Previously, Mr. O'Hanley served as President and Chief Executive Officer of BNY Mellon Asset Management (2007-2010). Mr. O'Hanley also served as Vice Chairman of Bank New York Mellon Corp. and a member of that firm's Executive Committee. Prior to the 2007 merger of The Bank of New York and Mellon Financial Corporation, he was Vice Chairman of Mellon Financial Corporation and President and Chief Executive Officer of Mellon Asset Management. He joined Mellon in February 1997. Mr. O'Hanley currently serves as Chairman of the Boston Public Library Foundation Board of Directors and sits on the Board of Directors of Beth Israel Deaconess Medical Center, the Board of Trustees of the Marine Biological Laboratory and the Advisory Board of the Maxwell School of Citizenship and Public Administration at Syracuse University. Mr. O'Hanley also chairs the Council on Asset Management for the Financial Services Roundtable and is a member of the Board of Directors of Institutional Investor's U.S. Institute. |
* Trustees have been determined to be "Interested Trustees" by virtue of, among other things, their affiliation with the trust or various entities under common control with FMR.
+ The information above includes each Trustee's principal occupation during the last five years and other information relating to the experience, attributes, and skills relevant to each Trustee's qualifications to serve as a Trustee, which led to the conclusion that each Trustee should serve as a Trustee for the fund.
Annual Report
Trustees and Officers - continued
Independent Trustees:
Correspondence intended for each Independent Trustee (that is, the Trustees other than the Interested Trustees) may be sent to Fidelity Investments, P.O. Box 55235, Boston, Massachusetts 02205-5235.
Name, Year of Birth; Principal Occupations and Other Relevant Experience+ |
Dennis J. Dirks (1948) |
Year of Election or Appointment: 2005 Trustee |
| Mr. Dirks also serves as Trustee of other Fidelity funds. Prior to his retirement in May 2003, Mr. Dirks was Chief Operating Officer and a member of the Board of The Depository Trust & Clearing Corporation (DTCC). He also served as President, Chief Operating Officer, and Board member of The Depository Trust Company (DTC) and President and Board member of the National Securities Clearing Corporation (NSCC). In addition, Mr. Dirks served as Chief Executive Officer and Board member of the Government Securities Clearing Corporation, Chief Executive Officer and Board member of the Mortgage-Backed Securities Clearing Corporation, as a Trustee and a member of the Finance Committee of Manhattan College (2005-2008), and as a Trustee and a member of the Finance Committee of AHRC of Nassau County (2006-2008). Mr. Dirks is a member of the Independent Directors Council (IDC) Governing Council (2010-present) and Board of Directors for The Brookville Center for Children's Services, Inc. (2009-present). |
Alan J. Lacy (1953) |
Year of Election or Appointment: 2008 Trustee |
| Mr. Lacy also serves as Trustee of other Fidelity funds. Mr. Lacy serves as Senior Adviser (2007-present) of Oak Hill Capital Partners, L.P. (private equity). Mr. Lacy also served as Chief Executive Officer (2000-2005) and Vice Chairman (2005-2006) of Sears Holdings Corporation and Sears, Roebuck and Co. (retail). In addition, Mr. Lacy serves as a member of the Board of Directors of Dave & Buster's Entertainment, Inc. (restaurant and entertainment complexes, 2010-present), Earth Fare, Inc. (retail grocery, 2012-present), The Hillman Companies, Inc. (hardware wholesalers, 2010-present), and Bristol-Myers Squibb Company (global pharmaceuticals, 2008-present). Mr. Lacy is a member of the Board of Trustees of The National Parks Conservation Association (2006-present). Previously, Mr. Lacy served as Chairman of the Board of Trustees of the National Parks Conservation Association (2008-2011) and as a member of the Board of Directors for the Western Union Company (global money transfer, 2006-2011). |
Ned C. Lautenbach (1944) |
Year of Election or Appointment: 2000 Trustee Chairman of the Independent Trustees |
| Mr. Lautenbach also serves as Trustee of other Fidelity funds. Mr. Lautenbach currently serves as the Lead Director of the Eaton Corporation Board of Directors (diversified industrial, 1997-present). Mr. Lautenbach is Chairman of the Board of Directors of the Philharmonic Center for the Arts in Naples, Florida (2012-present) and a member of the Council on Foreign Relations (1994-present). Previously, Mr. Lautenbach was a Partner/Advisory Partner at Clayton, Dubilier & Rice, LLC (private equity investment, 1998-2010), as well as a Director of Sony Corporation (2006-2007). |
Joseph Mauriello (1944) |
Year of Election or Appointment: 2008 Trustee |
| Mr. Mauriello also serves as Trustee of other Fidelity funds. Prior to his retirement in January 2006, Mr. Mauriello served in numerous senior management positions including Deputy Chairman and Chief Operating Officer (2004-2005), and Vice Chairman of Financial Services (2002-2004) of KPMG LLP US (professional services, 1965-2005). Mr. Mauriello currently serves as a member of the Board of Directors of XL Group plc. (global insurance and re-insurance, 2006-present). Previously, Mr. Mauriello served as a Director of the Hamilton Funds of the Bank of New York (2006-2007) and of Arcadia Resources Inc. (health care services and products, 2007-2012). |
Robert W. Selander (1950) |
Year of Election or Appointment: 2011 Trustee |
| Mr. Selander also serves as Trustee of other Fidelity funds. Previously, Mr. Selander served as a Member of the Advisory Board of other Fidelity funds (2011), and Executive Vice Chairman (2010), Chief Executive Officer (2009-2010), and President and Chief Executive Officer (1997-2009) of Mastercard, Inc. |
Cornelia M. Small (1944) |
Year of Election or Appointment: 2005 Trustee |
| Ms. Small also serves as Trustee of other Fidelity funds. Ms. Small is a member of the Board of Directors (2009-present) and Chair of the Investment Committee (2010-present) of the Teagle Foundation. Ms. Small also serves on the Investment Committee of the Berkshire Taconic Community Foundation (2008-present). Previously, Ms. Small served as Chairperson (2002-2008) and a member of the Investment Committee and Chairperson (2008-2012) and a member of the Board of Trustees of Smith College. In addition, Ms. Small served as Chief Investment Officer, Director of Global Equity Investments, and a member of the Board of Directors of Scudder, Stevens & Clark and Scudder Kemper Investments. |
William S. Stavropoulos (1939) |
Year of Election or Appointment: 2001 Trustee Vice Chairman of the Independent Trustees |
| Mr. Stavropoulos also serves as Trustee of other Fidelity funds. Mr. Stavropoulos serves as President and Founder of the Michigan Baseball Foundation, the Great Lakes Loons (2007-present). Mr. Stavropoulos is Chairman Emeritus of the Board of Directors of The Dow Chemical Company, where he previously served in numerous senior management positions, including President, CEO (1995-2000; 2002-2004), Chairman of the Executive Committee (2000-2006), and as a member of the Board of Directors (1990-2006). Currently, Mr. Stavropoulos is Chairman of the Board of Directors of Univar Inc. (global distributor of commodity and specialty chemicals), a Director of Teradata Corporation (data warehousing and technology solutions), and Maersk Inc. (industrial conglomerate), and a member of the Advisory Board for Metalmark Capital LLC (private equity investment, 2005-present). Mr. Stavropoulos is an operating advisor to Clayton, Dubilier & Rice, LLC (private equity investment). In addition, Mr. Stavropoulos is a member of the University of Notre Dame Advisory Council for the College of Science, a Trustee of the Rollin L. Gerstacker Foundation, and a Director of the Naples Philharmonic Center for the Arts. Previously, Mr. Stavropoulos served as a Director of Chemical Financial Corporation (bank holding company, 1993-2012) and Tyco International, Ltd. (multinational manufacturing and services, 2007-2012). |
David M. Thomas (1949) |
Year of Election or Appointment: 2008 Trustee |
| Mr. Thomas also serves as Trustee of other Fidelity funds. Mr. Thomas serves as Non-Executive Chairman of the Board of Directors of Fortune Brands Home and Security (home and security products, 2011-present), and as a member of the Board of Directors of Interpublic Group of Companies, Inc. (marketing communication, 2004-present). Previously, Mr. Thomas served as Executive Chairman (2005-2006) and Chairman and Chief Executive Officer (2000-2005) of IMS Health, Inc. (pharmaceutical and healthcare information solutions), and a Director of Fortune Brands, Inc. (consumer products, 2000-2011). |
+ The information above includes each Trustee's principal occupation during the last five years and other information relating to the experience, attributes, and skills relevant to each Trustee's qualifications to serve as a Trustee, which led to the conclusion that each Trustee should serve as a Trustee for the fund.
Advisory Board Member and Executive Officers:
Correspondence intended for each executive officer and Peter S. Lynch may be sent to Fidelity Investments, 245 Summer Street, Boston, Massachusetts 02210. Executive officers appear below in alphabetical order.
Name, Year of Birth; Principal Occupation |
Peter S. Lynch (1944) |
Year of Election or Appointment: 2003 Member of the Advisory Board |
| Mr. Lynch also serves as Member of the Advisory Board of other Fidelity funds. Mr. Lynch is Vice Chairman and a Director of FMR and FMR Co., Inc. In addition, Mr. Lynch serves as a Trustee of Boston College and as the Chairman of the Inner-City Scholarship Fund. Previously, Mr. Lynch served on the Special Olympics International Board of Directors (1997-2006). |
Elizabeth Paige Baumann (1968) |
Year of Election or Appointment: 2012 Anti-Money Laundering (AML) Officer |
| Ms. Baumann also serves as AML Officer of other funds. She is Chief AML Officer of FMR LLC (2012-present) and is an employee of Fidelity Investments. Previously, Ms. Baumann served as Vice President and Deputy Anti-Money Laundering Officer (2007-2012). |
William C. Coffey (1969) |
Year of Election or Appointment: 2009 Assistant Secretary |
| Mr. Coffey also serves as Assistant Secretary of other funds. He is Senior Vice President and Deputy General Counsel of FMR LLC (2010-present), and is an employee of Fidelity Investments. Previously, Mr. Coffey served as Vice President and Associate General Counsel of FMR LLC (2005-2009). |
Jonathan Davis (1968) |
Year of Election or Appointment: 2010 Assistant Treasurer |
| Mr. Davis also serves as Assistant Treasurer of other funds. Mr. Davis is an employee of Fidelity Investments. Previously, Mr. Davis served as Vice President and Associate General Counsel of FMR LLC (2003-2010). |
Adrien E. Deberghes (1967) |
Year of Election or Appointment: 2008 Deputy Treasurer |
| Mr. Deberghes also serves as an officer of other funds. He is an employee of Fidelity Investments (2008-present). Prior to joining Fidelity Investments, Mr. Deberghes was Senior Vice President of Mutual Fund Administration at State Street Corporation (2007-2008), Senior Director of Mutual Fund Administration at Investors Bank & Trust (2005-2007), and Director of Finance for Dunkin' Brands (2000-2005). |
Stephanie J. Dorsey (1969) |
Year of Election or Appointment: 2010 Assistant Treasurer |
| Ms. Dorsey also serves as an officer of other funds. She is an employee of Fidelity Investments (2008-present) and has served in other fund officer roles. Prior to joining Fidelity Investments, Ms. Dorsey served as Treasurer (2004-2008) of the JPMorgan Mutual Funds and Vice President (2004-2008) of JPMorgan Chase Bank. |
Scott C. Goebel (1968) |
Year of Election or Appointment: 2008 Secretary and Chief Legal Officer (CLO) |
| Mr. Goebel serves as Secretary and CLO of other funds. Mr. Goebel also serves as Secretary of Fidelity Investments Money Management, Inc. (FIMM) (2010-present) and Fidelity Research and Analysis Company (FRAC) (2010-present); General Counsel, Secretary, and Senior Vice President of FMR (2008-present) and FMR Co., Inc. (2008-present); Chief Legal Officer of Fidelity Management & Research (Hong Kong) Limited (2008-present) and Assistant Secretary of Fidelity Management & Research (Japan) Inc. (2008-present), and Fidelity Management & Research (U.K.) Inc. (2008-present). Previously, Mr. Goebel served as Secretary and CLO of other Fidelity funds (2008-2013), Assistant Secretary of FIMM (2008-2010), FRAC (2008-2010), and certain funds (2007-2008); and as Vice President and Secretary of Fidelity Distributors Corporation (FDC) (2005-2007). Mr. Goebel has been employed by FMR LLC or an affiliate since 2001. |
Joseph A. Hanlon (1968) |
Year of Election or Appointment: 2012 Chief Compliance Officer |
| Mr. Hanlon also serves as Chief Compliance Officer of other funds. Mr. Hanlon serves as Compliance Officer of FMR, FMR Co., Inc., Fidelity Investments Money Management, Inc. (FIMM), Fidelity Research and Analysis Company (FRAC), and Fidelity Management & Research (Hong Kong) (2009-present), as Senior Vice President of the Fidelity Asset Management Division (2009-present), and is an employee of Fidelity Investments. Previously, Mr. Hanlon served as Compliance Officer of Fidelity Management & Research (Japan) Inc. (2009-2013), Strategic Advisers, Inc. (2009-2013), and Fidelity Management & Research (U.K.) Inc. (2009-2013). |
Bruce T. Herring (1965) |
Year of Election or Appointment: 2006 Vice President of certain Equity Funds |
| Mr. Herring also serves as Vice President of other funds. He serves as Chief Investment Officer of Fidelity Global Asset Allocation (GAA) (2013-present), Chief Investment Officer and Director of Fidelity Management & Research (U.K.) Inc. (2010-present), Group Chief Investment Officer of FMR, and President of Fidelity Research & Analysis Company (2010-present). Previously, Mr. Herring served as Vice President (2005-2006) and Senior Vice President (2006-2007) of Fidelity Management & Research Company, Vice President of FMR Co., Inc. (2001-2007), and as a portfolio manager for Fidelity U.S. Equity Funds. |
Brian B. Hogan (1964) |
Year of Election or Appointment: 2009 Vice President |
| Mr. Hogan also serves as Vice President of other funds. Mr. Hogan serves as President of FMR's Equity Division (2009-present). Previously, Mr. Hogan served as Senior Vice President, Equity Research of FMR (2006-2009) and as a portfolio manager. |
Chris Maher (1972) |
Year of Election or Appointment: 2013 Assistant Treasurer |
| Mr. Maher serves as Assistant Treasurer of other funds. Mr. Maher is Vice President of Valuation Oversight and is an employee of Fidelity Investments. Previously, Mr. Maher served as Vice President of Asset Management Compliance (2013), Vice President of FMR's Program Management Group (2010-2013), and Vice President of Valuation Oversight (2008-2010). |
Christine Reynolds (1958) |
Year of Election or Appointment: 2008 Chief Financial Officer |
| Ms. Reynolds also serves as Chief Financial Officer of other funds. Ms. Reynolds became President of Fidelity Pricing and Cash Management Services (FPCMS) in August 2008. Ms. Reynolds served as Chief Operating Officer of FPCMS (2007-2008). Previously, Ms. Reynolds served as President, Treasurer, and Anti-Money Laundering officer of the Fidelity funds (2004-2007). |
Kenneth B. Robins (1969) |
Year of Election or Appointment: 2008 President and Treasurer |
| Mr. Robins also serves as an officer of other funds. Mr. Robins serves as Executive Vice President of Fidelity Investments Money Management, Inc. (FIMM) (2013-present) and is an employee of Fidelity Investments (2004-present). Previously, Mr. Robins served in other fund officer roles. |
Gary W. Ryan (1958) |
Year of Election or Appointment: 2005 Assistant Treasurer |
| Mr. Ryan also serves as Assistant Treasurer of other funds. Mr. Ryan is an employee of Fidelity Investments and has served in other fund officer roles. Previously, Mr. Ryan served as Vice President of Fund Reporting in Fidelity Pricing and Cash Management Services (FPCMS) (1999-2005). |
Stephen Sadoski (1971) |
Year of Election or Appointment: 2012 Deputy Treasurer |
| Mr. Sadoski also serves as Deputy Treasurer of other funds. He is an employee of Fidelity Investments (2012-present) and has served in another fund officer role. Prior to joining Fidelity Investments, Mr. Sadoski served as an assistant chief accountant in the Division of Investment Management of the Securities and Exchange Commission (SEC) (2009-2012) and as a senior manager at Deloitte & Touche LLP (1997-2009). |
Stacie M. Smith (1974) |
Year of Election or Appointment: 2013 Deputy Treasurer |
| Ms. Smith also serves as an officer of other funds. She is an employee of Fidelity Investments (2009-present) and has served in other fund officer roles. Prior to joining Fidelity Investments, Ms. Smith served as Senior Audit Manager of Ernst & Young LLP (1996-2009). |
Renee Stagnone (1975) |
Year of Election or Appointment: 2013 Deputy Treasurer |
| Ms. Stagnone also serves as Deputy Treasurer of other funds. Ms. Stagnone is an employee of Fidelity Investments. |
Joseph F. Zambello (1957) |
Year of Election or Appointment: 2011 Deputy Treasurer |
| Mr. Zambello also serves as Deputy Treasurer of other funds. Mr. Zambello is an employee of Fidelity Investments. Previously, Mr. Zambello served as Vice President of FMR's Program Management Group (2009-2011) and Vice President of the Transfer Agent Oversight Group (2005-2009). |
Annual Report
The Board of Trustees of International Small Cap Opportunities Fund voted to pay to shareholders of record at the opening of business on record date, the following distributions per share derived from capital gains realized from sales of portfolio securities, and dividends derived from net investment income:
| Pay Date | Record Date | Dividends | Capital Gains |
International Small Cap
Opportunities | 12/09/13 | 12/06/13 | $0.091 | $0.079 |
International Small Cap Opportunities designates 10% of the dividends distributed in December 2012 during the fiscal year as qualifying for the dividends-received deduction for corporate shareholders.
International Small Cap Opportunities designates 100% of the dividends distributed in December 2012during the fiscal year as amounts which may be taken into account as a dividends for purposes of the maximum rate under section 1(h) (11) of the Internal Revenue Code.
The amounts per share which represent income derived from sources within, and taxes paid to, foreign countries or possessions of the United States are as follows:
| Pay Date | Income | Taxes |
International Small Cap Opportunities | 12/10/2012 | 0.120 | 0.0136 |
The fund will notify shareholders in January 2014 of amounts for use in preparing 2013 income tax returns.
Annual Report
Board Approval of Investment Advisory Contracts and Management Fees
Fidelity International Small Cap Opportunities Fund
Each year, the Board of Trustees, including the Independent Trustees (together, the Board), votes on the renewal of the management contract and sub-advisory agreements (together, the Advisory Contracts) for the fund. The Board, assisted by the advice of fund counsel and Independent Trustees' counsel, requests and considers a broad range of information relevant to the renewal of the Advisory Contracts throughout the year.
The Board meets regularly and, at each of its meetings, covers an extensive agenda of topics and materials and considers factors that are relevant to its annual consideration of the renewal of the fund's Advisory Contracts, including the services and support provided to the fund and its shareholders. The Board has established various standing committees, each composed of and chaired by Independent Trustees with varying backgrounds, to which the Board has assigned specific subject matter responsibilities in order to enhance effective decision-making by the Board. The Board, acting directly and through its Committees, requests and receives information concerning the annual consideration of the renewal of the fund's Advisory Contracts. The Board also meets as needed to consider matters specifically related to the Board's annual consideration of the renewal of Advisory Contracts. Members of the Board may also meet with trustees of other Fidelity funds through ad hoc joint committees to discuss certain matters relevant to the Fidelity funds.
At its July 2013 meeting, the Board, including the Independent Trustees, unanimously determined to renew the fund's Advisory Contracts. In reaching its determination, the Board considered all factors it believed relevant, including (i) the nature, extent, and quality of the services to be provided to the fund and its shareholders (including the investment performance of the fund); (ii) the competitiveness of the fund's management fee and total expense ratio relative to peer funds; (iii) the total costs of the services to be provided by and the profits to be realized by Fidelity from its relationship with the fund; (iv) the extent to which economies of scale exist and would be realized as the fund grows; and (v) whether fee levels reflect these economies of scale, if any, for the benefit of fund shareholders.
In considering whether to renew the Advisory Contracts for the fund, the Board reached a determination, with the assistance of fund counsel and Independent Trustees' counsel and through the exercise of its business judgment, that the renewal of the Advisory Contracts was in the best interests of the fund and its shareholders and that the compensation payable under the Advisory Contracts was fair and reasonable. The Board's decision to renew the Advisory Contracts was not based on any single factor, but rather was based on a comprehensive consideration of all the information provided to the Board at its meetings throughout the year. The Board, in reaching its determination to renew the Advisory Contracts, was aware that shareholders in the fund have a broad range of investment choices available to them, including a wide choice among mutual funds offered by Fidelity's competitors, and that the fund's shareholders, who have the opportunity to review and weigh the disclosure provided by the fund in its prospectus and other public disclosures, have chosen to invest in this fund, which is a part of the Fidelity family of funds.
Annual Report
Board Approval of Investment Advisory Contracts and
Management Fees - continued
Nature, Extent, and Quality of Services Provided. The Board considered the staffing within the investment adviser, Fidelity Management & Research Company (FMR), and the sub-advisers (together, the Investment Advisers) as it relates to the fund, including the backgrounds of the fund's investment personnel, and also considered the fund's investment objective, strategies, and related investment philosophy. The Independent Trustees also had discussions with senior management of Fidelity's investment operations and investment groups. The Board considered the structure of the portfolio manager compensation program and whether this structure provides appropriate incentives to act in the best interests of the fund.
Resources Dedicated to Investment Management and Support Services. The Board and the Fund Oversight and Research Committees reviewed the general qualifications and capabilities of the Investment Advisers' investment staff, including its size, education, experience, and resources, as well as the Investment Advisers' approach to recruiting, training, managing, and compensating investment personnel. The Board noted that FMR has continued to increase the resources devoted to non-U.S. offices, including expansion of Fidelity's global investment organization. The Board also noted that Fidelity's analysts have extensive resources, tools and capabilities that allow them to conduct sophisticated quantitative and fundamental analysis, as well as credit analysis of issuers, counterparties and guarantors. Further, the Board believes that Fidelity's investment professionals have sufficient access to global information and data so as to provide competitive investment results over time, and that those professionals also have access to sophisticated tools that permit them to assess portfolio construction and risk and performance attribution characteristics continuously, as well as to transmit new information and research conclusions rapidly around the world. Additionally, in its deliberations, the Board considered the Investment Advisers' trading and risk management capabilities and resources, which are an integral part of the investment management process.
Shareholder and Administrative Services. The Board considered (i) the nature, extent, quality, and cost of advisory, administrative, and shareholder services performed by the Investment Advisers and their affiliates under the Advisory Contracts and under separate agreements covering transfer agency, pricing and bookkeeping, and securities lending services for the fund; (ii) the nature and extent of the supervision of third party service providers, principally custodians and subcustodians; and (iii) the resources devoted to, and the record of compliance with, the fund's compliance policies and procedures. The Board also reviewed the allocation of fund brokerage, including allocations to brokers affiliated with the Investment Advisers, the use of brokerage commissions to pay fund expenses, and the use of "soft" commission dollars to pay for research services.
Annual Report
The Board noted that the growth of fund assets over time across the complex allows Fidelity to reinvest in the development of services designed to enhance the value or convenience of the Fidelity funds as investment vehicles. These services include 24-hour access to account information and market information through telephone representatives and over the Internet, investor education materials and asset allocation tools, and the expanded availability of Fidelity Investor Centers.
Investment in a Large Fund Family. The Board considered the benefits to shareholders of investing in a Fidelity fund, including the benefits of investing in a fund that is part of a large family of funds offering a variety of investment disciplines and providing a large variety of mutual fund investor services. The Board noted that Fidelity had taken, or had made recommendations that resulted in the Fidelity funds taking, a number of actions over the previous year that benefited particular funds, including (i) continuing to dedicate additional resources to investment research and to the support of the senior management team that oversees asset management; (ii) persisting in efforts to enhance Fidelity's global research capabilities; (iii) launching new funds and making other enhancements to meet client needs for global and income-oriented solutions; (iv) continuing to launch dedicated lower cost underlying funds to meet portfolio construction needs related to expanding underlying fund options for Fidelity funds of funds, specifically for the Freedom Fund product lines; (v) rationalizing product lines and gaining increased efficiencies through the mergers of several funds into other funds; (vi) strengthening Fidelity's index fund offerings by reducing investment minimums and adopting or lowering existing expense caps for certain funds and classes; (vii) enhancing Global Asset Allocation product offerings by launching new funds and strategies, including "open architecture" target date funds that utilize affiliated and unaffiliated sub-advisers; (viii) modifying the eligibility criteria for Institutional Class shares of Advisor funds to increase their marketability to a portion of the defined contribution plan market; (ix) creating a new low-cost retirement share class for certain Advisor funds to appeal to large retirement plans; (x) transitioning the management of certain Fidelity commodity funds to Geode Capital Management LLC, a registered commodity pool operator, while retaining administrative responsibilities for the funds; (xi) reorganizing a number of funds; and (xii) taking steps toward establishing a new Fidelity adviser to manage sector-based funds and products.
Investment Performance. The Board considered whether the fund has operated in accordance with its investment objective, as well as its record of compliance with its investment restrictions and its performance history.
The Board took into account discussions with the Investment Advisers about fund investment performance that occur at Board meetings throughout the year. In this regard the Board noted that as part of regularly scheduled fund reviews and other reports to the Board on fund performance, the Board periodically considers annualized return information for the fund, for different time periods, measured against a securities market index ("benchmark index") and a peer group of mutual funds with similar objectives ("peer group"). In its evaluation of fund investment performance, the Board gave particular attention to information indicating changes in performance of certain Fidelity funds for specific time periods and the Investment Advisers' explanations for any overperformance or underperformance.
Annual Report
Board Approval of Investment Advisory Contracts and
Management Fees - continued
In addition to reviewing absolute and relative fund performance, the Independent Trustees periodically consider the appropriateness of fund performance metrics in evaluating the results achieved. In general, the Independent Trustees believe that fund performance should be evaluated based on net performance (after fees and expenses) of both the highest performing and lowest performing classes, where applicable, compared to appropriate benchmark indices, over appropriate time periods which may include full market cycles, and compared to peer groups, as applicable, over the same periods, taking into account relevant factors including the following: general market conditions; issuer-specific information; tactical opportunities for investment; and fund cash flows and other factors.
The Independent Trustees recognize that shareholders evaluate performance on a net basis over their own holding periods, for which one-, three-, and five-year periods are used as a proxy. For this reason, the performance information reviewed by the Board also included net cumulative calendar year total return information for the fund and an appropriate benchmark index and peer group for the most recent one-, three-, and five-year periods, as shown below. Returns are shown compared to the 25th percentile (top of box) and 75th percentile (bottom of box) of the peer universe. Returns of the benchmark index are "net MA," i.e., adjusted for tax withholding rates applicable to U.S.-based mutual funds organized as Massachusetts business trusts.
Annual Report
Fidelity International Small Cap Opportunities Fund

The Board also considered that the fund's management fee is subject to upward or downward adjustment depending upon whether, and to what extent, the fund's investment performance for the performance period exceeds, or is exceeded by, a securities index, thus leading to a performance adjustment for the same period. The Board noted that the performance adjustment provides FMR with a strong economic incentive to seek to achieve superior performance for the fund's shareholders and helps to more closely align the interests of FMR and the fund's shareholders.
Based on its review, the Board concluded that the nature, extent, and quality of services provided to the fund under the Advisory Contracts should benefit the fund's shareholders.
Competitiveness of Management Fee and Total Expense Ratio. The Board considered the fund's management fee and total expense ratio compared to "mapped groups" of competitive funds and classes. Fidelity creates "mapped groups" by combining similar Lipper investment objective categories that have comparable management fee characteristics. Combining Lipper investment objective categories aids the Board's management fee and total expense ratio comparisons by broadening the competitive group used for comparison and by reducing the number of universes to which various Fidelity funds are compared.
Management Fee. The Board considered two proprietary management fee comparisons for the 12-month periods shown in the chart below. The group of Lipper funds used by the Board for management fee comparisons is referred to below as the "Total Mapped Group." The Total Mapped Group is broader than the Lipper peer group used by the Board for performance comparisons because the Total Mapped Group combines several Lipper investment objective categories while the Lipper peer group does not. The Total Mapped Group comparison focuses on a fund's standing in terms of gross management fees before expense reimbursements or caps, and without giving effect to the fund's performance adjustment, relative to the total universe of funds with comparable investment mandates, regardless of whether their management fee structures also are comparable. Funds with comparable investment mandates offer exposure to similar types of securities. Funds with comparable management fee structures have similar management fee contractual arrangements (e.g., flat rate charged for advisory services, all-inclusive fee rate, etc.). "TMG %" represents the percentage of funds in the Total Mapped Group that had management fees that were lower than the fund's. For example, a TMG % of 19% means that 81% of the funds in the Total Mapped Group had higher management fees than the fund. The "Asset-Size Peer Group" (ASPG) comparison focuses on a fund's standing relative to a subset of non-Fidelity funds within the Total Mapped Group that are similar in size and management fee structure. The ASPG represents at least 15% of the funds in the Total Mapped Group with comparable asset size and management fee structures, subject to a minimum of 50 funds (or all funds in the Total Mapped Group if fewer than 50). Additional information, such as the ASPG quartile in which the fund's management fee ranked and the impact of the fund's performance adjustment, is also included in the chart and considered by the Board.
Annual Report
Board Approval of Investment Advisory Contracts and
Management Fees - continued
Fidelity International Small Cap Opportunities Fund

The Board noted that the fund's management fee ranked below the median of its Total Mapped Group and below the median of its ASPG for 2012. The Board also noted the effect of the fund's positive performance adjustment on the fund's management fee ranking.
Annual Report
Based on its review, the Board concluded that the fund's management fee is fair and reasonable in light of the services that the fund receives and the other factors considered.
Total Expense Ratio. In its review of each class's total expense ratio, the Board considered the fund's management fee as well as other fund or class expenses, as applicable, such as transfer agent fees, pricing and bookkeeping fees, fund-paid 12b-1 fees, and custodial, legal, and audit fees. The Board also noted the effects of any waivers and reimbursements on fees and expenses, as well as the impact of the fund's performance adjustment. As part of its review, the Board also considered the current and historical total expense ratios of each class of the fund compared to competitive fund median expenses. Each class of the fund is compared to those funds and classes in the Total Mapped Group (used by the Board for management fee comparisons) that have a similar sales load structure.
The Board noted that the total expense ratio of each of Class A and the retail class ranked below its competitive median for 2012 and the total expense ratio of each of Class T, Class B, Class C, and Institutional Class ranked above its competitive median for 2012. The Board considered that, in general, various factors can affect total expense ratios. The Board noted that the total expense ratio of Class T was above the competitive median primarily because of higher 12b-1 fees on Class T. Class T has a higher 12b-1 fee, but a lower front-end sales charge, than traditionally priced front-end sales charge classes. The Board considered that Class T is primarily sold load-waived in the retirement plan market where its 0.50% 12b-1 fee is comparable to competing no-load, higher 12b-1 fee classes designed specifically for retirement plans. The Board noted that the fund offers multiple classes, each of which has a different sales load and 12b-1 fee structure, and that the multiple structures are intended to offer a range of pricing options for the intermediary market. The Board also noted that the total expense ratios of the classes vary primarily by the level of their 12b-1 fees, although differences in transfer agent fees may also cause expenses to vary from class to class.
Fees Charged to Other Fidelity Clients. The Board also considered Fidelity fee structures and other information with respect to clients of FMR and its affiliates, such as other mutual funds advised or subadvised by FMR or its affiliates, pension plan clients, and other institutional clients. The Board noted the findings of the 2013 ad hoc joint committee (created with the board of other Fidelity funds), which reviewed and compared Fidelity's institutional investment advisory business with its business of providing services to the Fidelity funds, including the differences in services provided, fees charged, and costs incurred, as well as competition in their respective marketplaces.
Annual Report
Board Approval of Investment Advisory Contracts and
Management Fees - continued
Based on its review of total expense ratios and fees charged to other Fidelity clients, the Board concluded that the total expense ratio of each class of the fund was reasonable, although in some cases above the median of the universe presented for comparison, in light of the services that the fund and its shareholders receive and the other factors considered.
Costs of the Services and Profitability. The Board considered the revenues earned and the expenses incurred by Fidelity in conducting the business of developing, marketing, distributing, managing, administering and servicing the fund and servicing the fund's shareholders. The Board also considered the level of Fidelity's profits in respect of all the Fidelity funds.
On an annual basis, FMR presents to the Board Fidelity's profitability for the fund. Fidelity calculates the profitability for each fund, as well as aggregate profitability for groups of Fidelity funds and all Fidelity funds, using a series of detailed revenue and cost allocation methodologies which originate with the books and records of Fidelity on which Fidelity's audited financial statements are based. The Audit Committee of the Board reviews any significant changes from the prior year's methodologies.
PricewaterhouseCoopers LLP (PwC), independent registered public accounting firm and auditor to Fidelity and certain Fidelity funds, has been engaged annually by the Board as part of the Board's assessment of Fidelity's profitability analysis. PwC's engagement includes the review and assessment of the methodologies used by Fidelity in determining the revenues and expenses attributable to Fidelity's mutual fund business, and completion of agreed-upon procedures surrounding the mathematical accuracy of fund profitability and its conformity to allocation methodologies. After considering PwC's reports issued under the engagement and information provided by Fidelity, the Board concluded that while other allocation methods may also be reasonable, Fidelity's profitability methodologies are reasonable in all material respects.
The Board also reviewed Fidelity's non-fund businesses and fall-out benefits related to the mutual fund business as well as cases where Fidelity's affiliates may benefit from or be related to the fund's business.
The Board considered the costs of the services provided by and the profits realized by Fidelity in connection with the operation of the fund and was satisfied that the profitability was not excessive in the circumstances.
Economies of Scale. The Board considered whether there have been economies of scale in respect of the management of the Fidelity funds, whether the Fidelity funds (including the fund) have appropriately benefited from any such economies of scale, and whether there is potential for realization of any further economies of scale. The Board considered the extent to which the fund will benefit from economies of scale through increased services to the fund, through waivers or reimbursements, or through fee or expense reductions. The Board also noted that in 2009, it and the board of other Fidelity funds created an ad hoc committee (the Economies of Scale Committee) to analyze whether FMR attains economies of scale in respect of the management and servicing of the Fidelity funds, whether the Fidelity funds have appropriately benefited from such economies of scale, and whether there is potential for realization of any further economies of scale.
Annual Report
The Board recognized that the fund's management contract incorporates a "group fee" structure, which provides for lower group fee rates as total fund assets under FMR's management increase, and for higher group fee rates as total fund assets under FMR's management decrease. FMR calculates the group fee rates based on a tiered asset "breakpoint" schedule that varies based on asset class. The Board considered that the group fee is designed to deliver the benefits of economies of scale to fund shareholders when total Fidelity fund assets increase, even if assets of any particular fund are unchanged or have declined, because some portion of Fidelity's costs are attributable to services provided to all Fidelity funds, and all funds benefit if those costs can be allocated among more assets. The Board concluded that, given the group fee structure, fund shareholders will benefit from lower management fees as assets under FMR's management increase at the fund complex level, regardless of whether Fidelity achieves any such economies of scale.
The Board concluded, taking into account the analysis of the Economies of Scale Committee, that economies of scale, if any, are being appropriately shared between fund shareholders and Fidelity.
Amendment to Description of Group Fee Rate. At its July 2013 meeting, the Board voted to approve an amendment to the fund's management contract to modify the description of the "group fee rate" effective August 1, 2013. The Board noted that under the prior description in the contract, the group fee rate was based on the average net assets of all registered investment companies with which FMR has management contracts. Under the contract's tiered asset breakpoint schedule, the group fee rate is lower as total fund assets under FMR's management increase, and higher as total fund assets under FMR's management decrease. The Board considered that the prior description would have excluded the assets of 64 Fidelity sector funds from the group fee rate calculation once Fidelity SelectCo, LLC, an affiliate of FMR, assumed management responsibilities for those funds. The Board noted that modifying the description of the group fee rate to continue to include the assets of those 64 funds for purposes of determining group fee rate breakpoints would avoid an immediate adverse impact on the group fee rate for any fund.
Additional Information Requested by the Board. In order to develop fully the factual basis for consideration of the Fidelity funds' Advisory Contracts, the Board requested and received additional information on certain topics, including: (i) fund performance trends and Fidelity's long-term strategies for certain funds; (ii) the potential to further rationalize the Fidelity fund lineup with the possibility of achieving savings for the funds and Fidelity; (iii) the methodology with respect to competitive fund data and peer group classifications; (iv) the arrangements with, and performance of, certain sub-advisers on behalf of the Fidelity funds, as well as certain proposed participating affiliate arrangements; (v) the realization of fall-out benefits in certain Fidelity business units; (vi) Fidelity's group fee structures, including the rationale for the individual fee rates of certain categories of funds and the definition of group assets; (vii) trends regarding industry use of performance fee structures and the performance adjustment methodologies applicable to the Fidelity funds; (viii) additional competitive analysis regarding the total expenses for certain classes; and (ix) fund profitability methodology, including Fidelity's cost allocation methodology, and the impact of certain factors on fund profitability results.
Annual Report
Board Approval of Investment Advisory Contracts and
Management Fees - continued
Based on its evaluation of all of the conclusions noted above, and after considering all factors it believed relevant, the Board ultimately concluded that the advisory fee structures are fair and reasonable, and that the fund's Advisory Contracts should be renewed.
Annual Report
Investment Adviser
Fidelity Management & Research Company
Boston, MA
Investment Sub-Advisers
FMR Co., Inc.
Fidelity Management & Research
(Hong Kong) Limited
Fidelity Management & Research
(Japan) Inc.
Fidelity Management & Research
(U.K.) Inc.
FIL Investments (Japan) Limited
FIL Investment Advisors
FIL Investment Advisors (U.K.) Limited
General Distributor
Fidelity Distributors Corporation
Smithfield, RI
Transfer and Service Agents
Fidelity Investments Institutional
Operations Company, Inc.
Boston, MA
Fidelity Service Company, Inc.
Boston, MA
Custodian
The Northern Trust Company
Chicago, IL
The Fidelity Telephone Connection
Mutual Fund 24-Hour Service
Exchanges/Redemptions
and Account Assistance 1-800-544-6666
Product Information 1-800-544-6666
Retirement Accounts 1-800-544-4774
(8 a.m. - 9 p.m.)
TDD Service 1-800-544-0118
for the deaf and hearing impaired
(9 a.m. - 9 p.m. Eastern time)
Fidelity Automated Service
Telephone (FAST®)
1-800-544-5555
Automated line for quickest service
(Fidelity Investment logo)(registered trademark)
Corporate Headquarters
245 Summer St., Boston, MA 02210
www.fidelity.com
ILS-UANN-1213
1.815061.109
(Fidelity Investment logo)(registered trademark)
Fidelity Advisor®
International Small Cap Opportunities
Fund - Class A, Class T, Class B
and Class C
Annual Report
October 31, 2013
(Fidelity Cover Art)
Class A, Class T, Class B
and Class C are classes of
Fidelity® International
Small Cap Opportunities Fund
Contents
Performance | (Click Here) | How the fund has done over time. |
Management's Discussion of Fund Performance | (Click Here) | The Portfolio Manager's review of fund performance and strategy. |
Shareholder Expense Example | (Click Here) | An example of shareholder expenses. |
Investment Changes | (Click Here) | A summary of major shifts in the fund's investments over the past six months. |
Investments | (Click Here) | A complete list of the fund's investments with their market values. |
Financial Statements | (Click Here) | Statements of assets and liabilities, operations, and changes in net assets, as well as financial highlights. |
Notes | (Click Here) | Notes to the financial statements. |
Report of Independent Registered Public Accounting Firm | (Click Here) | |
Trustees and Officers | (Click Here) | |
Distributions | (Click Here) | |
Board Approval of Investment Advisory Contracts and Management Fees | (Click Here) | |
To view a fund's proxy voting guidelines and proxy voting record for the 12-month period ended June 30, visit http://www.fidelity.com/proxyvotingresults or visit the Securities and Exchange Commission's (SEC) web site at http://www.sec.gov. You may also call 1-877-208-0098 to request a free copy of the proxy voting guidelines.
Standard & Poor's, S&P and S&P 500 are registered service marks of The McGraw-Hill Companies, Inc. and have been licensed for use by Fidelity Distributors Corporation.
Other third-party marks appearing herein are the property of their respective owners.
All other marks appearing herein are registered or unregistered trademarks or service marks of FMR LLC or an affiliated company. © 2013 FMR LLC. All rights reserved.
Annual Report
This report and the financial statements contained herein are submitted for the general information of the shareholders of the fund. This report is not authorized for distribution to prospective investors in the fund unless preceded or accompanied by an effective prospectus.
A fund files its complete schedule of portfolio holdings with the SEC for the first and third quarters of each fiscal year on Form N-Q. Forms N-Q are available on the SEC's web site at http://www.sec.gov. A fund's Forms N-Q may be reviewed and copied at the SEC's Public Reference Room in Washington, DC. Information regarding the operation of the SEC's Public Reference Room may be obtained by calling 1-800-SEC-0330. For a complete list of a fund's portfolio holdings, view the most recent holdings listing, semiannual report, or annual report on Fidelity's web site at http://www.fidelity.com, http://www.advisor.fidelity.com, or http://www.401k.com, as applicable.
NOT FDIC INSURED • MAY LOSE VALUE • NO BANK GUARANTEE
Neither the fund nor Fidelity Distributors Corporation is a bank.
Annual Report
Average annual total return reflects the change in the value of an investment, assuming reinvestment of the class' distributions from dividend income and capital gains (the profits earned upon the sale of securities that have grown in value, if any) and assuming a constant rate of performance each year. The $10,000 table and the fund's returns do not reflect the deduction of taxes that a shareholder would pay on fund distributions or the redemption of fund shares. During periods of reimbursement by Fidelity, a fund's total return will be greater than it would be had the reimbursement not occurred. How a fund did yesterday is no guarantee of how it will do tomorrow. Returns reflect the conversion of Class B shares to Class A shares after a maximum of seven years.
Average Annual Total Returns
Periods ended October 31, 2013 | Past 1
year | Past 5
years | Life of
fundA |
Class A (incl. 5.75% sales charge) | 20.50% | 16.90% | 5.32% |
Class T (incl. 3.50% sales charge) | 23.07% | 17.15% | 5.34% |
Class B (incl. contingent deferred sales charge) B | 21.86% | 17.23% | 5.38% |
Class C (incl. contingent deferred sales charge) C | 25.91% | 17.45% | 5.27% |
A From August 2, 2005.
B Class B shares' contingent deferred sales charges included in the past one year, past five years, and life of fund total return figures are 5%, 2%, and 0%, respectively.
C Class C shares' contingent deferred sales charge included in the past one year, past five years, and life of fund total return figures are 1%, 0%, and 0%, respectively.
Annual Report
$10,000 Over Life of Fund
Let's say hypothetically that $10,000 was invested in Fidelity Advisor® International Small Cap Opportunities Fund - Class A on August 2, 2005, when the fund started, and the current 5.75% sales charge was paid. The chart shows how the value of your investment would have changed, and also shows how the MSCI® EAFE® Small Cap Index performed over the same period.
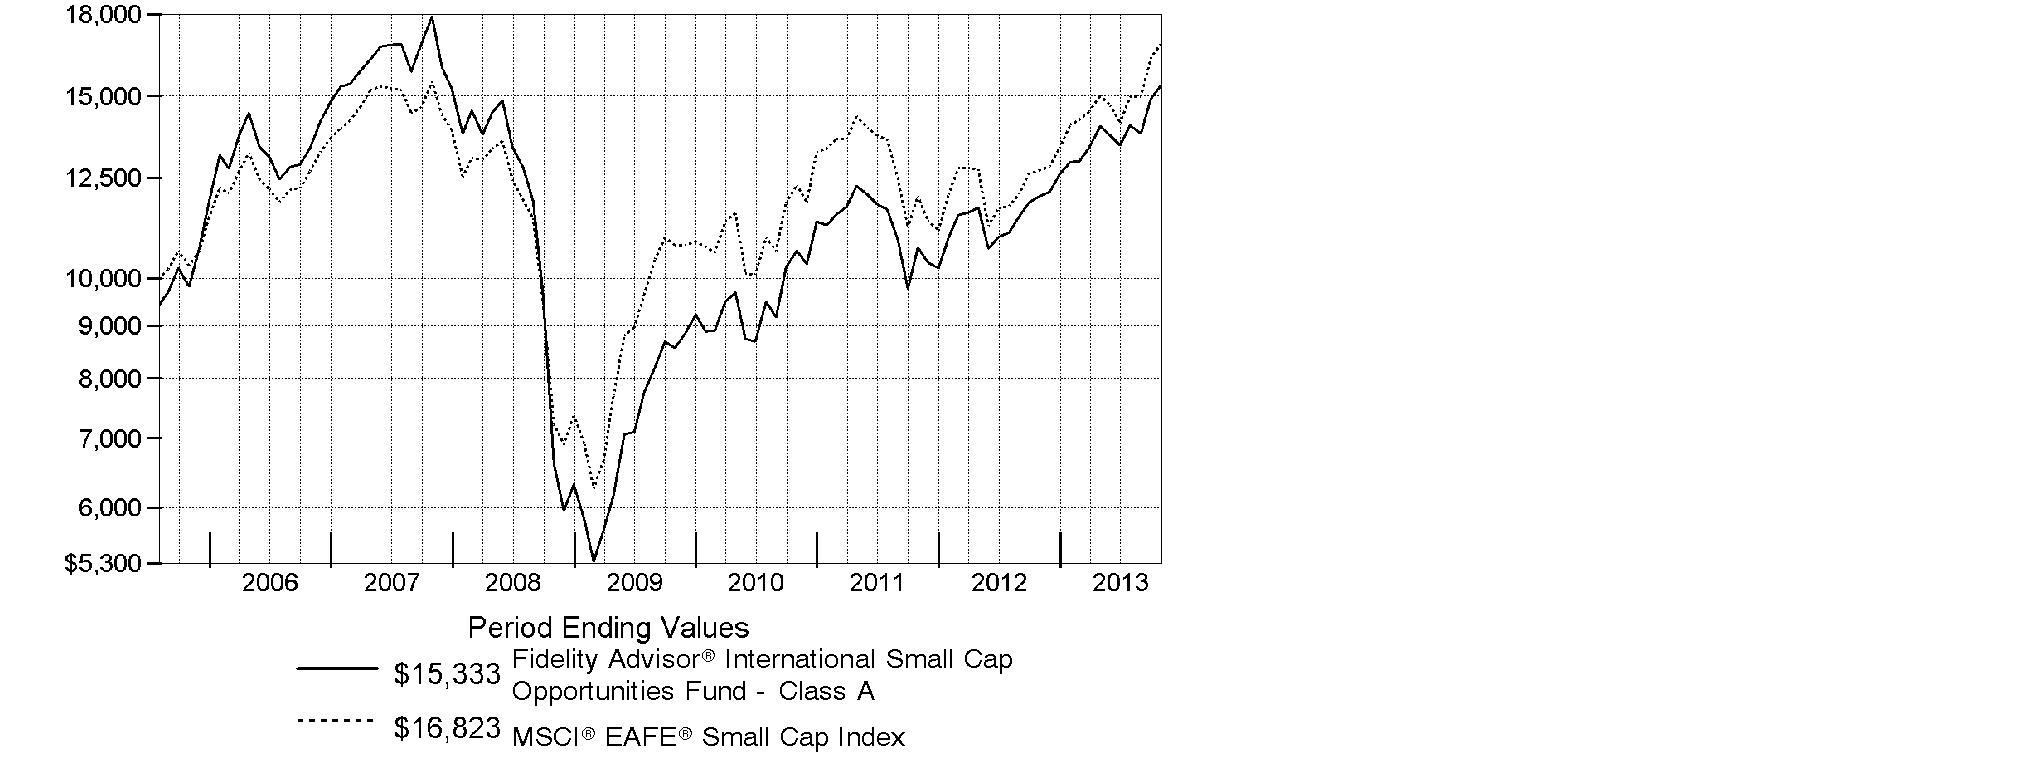
Annual Report
Market Recap: On balance, global equity markets remained upbeat for the 12-month period ending October 31, 2013. The MSCI® ACWI® (All Country World Index) Index gained 23.75% for the period, amid investor preference for higher-risk assets. The period was not without turbulence, however. In the spring and summer, central banks worldwide, especially in the U.S. and China, made clear their intentions to maintain accommodative monetary policies. That stance, combined with modest cyclical improvements around the globe and generally low valuations, underpinned the broad rally in equities. Europe (+32%) shone brightly, with most markets in the region - large and small - registering solid, index-beating gains. Another bright spot was Japan, which, despite a struggling yen and taking a second-half breather, posted a 34% result for the full year. The U.S. - by far the index's biggest constituent - also outperformed the global market with a roughly 28% advance. Meanwhile, Asia-Pacific ex Japan (+14%) lagged, hurt in part by a slowdown in Australia's mining industry as well as currency headwinds. Foreign-exchange and commodity weakness also curbed results in resource-heavy Canada and emerging markets (EM), both of which were up 7%. Country-level EM performance diverged meaningfully for the period, as evidenced by performance in Brazil (-1%), Russia (+12%), India (+1%) and China (+8%).
Comments from Jed Weiss, Portfolio Manager of Fidelity Advisor® International Small Cap Opportunities Fund: For the year, the fund's Class A, Class T, Class B and Class C shares returned 27.85%, 27.53%, 26.86% and 26.91%, respectively (excluding sales charges), trailing the 32.33% increase in the MSCI® EAFE® Small Cap Index. Europe was a detractor, as poor stock picking in the region weighed on the fund's result. The fund also had a moderate cash position, which hurt performance in an up market. Further, stock picking in Canada was a negative, with mining-related companies Eldorado Gold, Copper Mountain Mining and Agnico Eagle Mines hurting results. I ultimately sold all three stocks, none of which were in the benchmark. Emerging markets, especially South African drug store chain Clicks Group, posed an additional challenge. On the positive side, the fund was significantly helped by a large underweighting in the Asia-Pacific ex Japan region, especially Australia, which included a large number of poor-performing mining companies that I chose to avoid. The fund's out-of-benchmark U.S. holdings also helped. The vast majority of these investments were in companies that do all or most of their business abroad but that happen to be domiciled stateside. Of final note, stock picking in Japan proved very helpful in relative terms, with investment bank Nihon M&A Center producing an outsized contribution.
The views expressed above reflect those of the portfolio manager(s) only through the end of the period as stated on the cover of this report and do not necessarily represent the views of Fidelity or any other person in the Fidelity organization. Any such views are subject to change at any time based upon market or other conditions and Fidelity disclaims any responsibility to update such views. These views may not be relied on as investment advice and, because investment decisions for a Fidelity fund are based on numerous factors, may not be relied on as an indication of trading intent on behalf of any Fidelity fund.
Annual Report
Shareholder Expense Example
As a shareholder of the Fund, you incur two types of costs: (1) transaction costs, including sales charges (loads) on purchase payments or redemption proceeds, redemption fees and (2) ongoing costs, including management fees, distribution and/or service (12b-1) fees and other Fund expenses. This Example is intended to help you understand your ongoing costs (in dollars) of investing in the Fund and to compare these costs with the ongoing costs of investing in other mutual funds.
The Example is based on an investment of $1,000 invested at the beginning of the period and held for the entire period (May 1, 2013 to October 31, 2013).
Actual Expenses
The first line of the accompanying table for each class of the Fund provides information about actual account values and actual expenses. You may use the information in this line, together with the amount you invested, to estimate the expenses that you paid over the period. Simply divide your account value by $1,000.00 (for example, an $8,600 account value divided by $1,000.00 = 8.6), then multiply the result by the number in the first line for a class of the Fund under the heading entitled "Expenses Paid During Period" to estimate the expenses you paid on your account during this period. A small balance maintenance fee of $12.00 that is charged once a year may apply for certain accounts with a value of less than $2,000. This fee is not included in the table below. If it was, the estimate of expenses you paid during the period would be higher, and your ending account value lower, by this amount. In addition, the Fund, as a shareholder in the underlying Fidelity Central Funds, will indirectly bear its pro-rata share of the fees and expenses incurred by the underlying Fidelity Central Funds. These fees and expenses are not included in the Fund's annualized expense ratio used to calculate the expense estimate in the table below.
Hypothetical Example for Comparison Purposes
The second line of the accompanying table for each class of the Fund provides information about hypothetical account values and hypothetical expenses based on a Class' actual expense ratio and an assumed rate of return of 5% per year before expenses, which is not the Class' actual return. The hypothetical account values and expenses may not be used to estimate the actual ending account balance or expenses you paid for the period. You may use this information to compare the ongoing costs of investing in the Fund and other funds. To do so, compare this 5% hypothetical example with the 5% hypothetical examples that appear in the shareholder reports of the other funds. A small balance maintenance fee of $12.00 that is charged once a year may apply for certain accounts with a value of less than $2,000. This fee is not included in the table below. If it was, the estimate of expenses you paid during the period would be higher, and your ending account value lower, by this amount. In addition, the Fund, as a shareholder in the underlying Fidelity Central Funds, will indirectly bear its pro-rata share of the fees and expenses incurred by the underlying Fidelity Central Funds. These fees and expenses are not included in the Fund's annualized expense ratio used to calculate the expense estimate in the table below.
Please note that the expenses shown in the table are meant to highlight your ongoing costs only and do not reflect any transaction costs. Therefore, the second line of the table is useful in comparing ongoing costs only, and will not help you determine the relative total costs of owning different funds. In addition, if these transactional costs were included, your costs would have been higher.
Annual Report
| Annualized
Expense Ratio B | Beginning
Account Value
May 1, 2013 | Ending
Account Value
October 31, 2013 | Expenses Paid
During Period*
May 1, 2013
to October 31, 2013 |
Class A | 1.65% | | | |
Actual | | $ 1,000.00 | $ 1,093.50 | $ 8.71 |
Hypothetical A | | $ 1,000.00 | $ 1,016.89 | $ 8.39 |
Class T | 1.90% | | | |
Actual | | $ 1,000.00 | $ 1,091.80 | $ 10.02 |
Hypothetical A | | $ 1,000.00 | $ 1,015.63 | $ 9.65 |
Class B | 2.40% | | | |
Actual | | $ 1,000.00 | $ 1,089.20 | $ 12.64 |
Hypothetical A | | $ 1,000.00 | $ 1,013.11 | $ 12.18 |
Class C | 2.40% | | | |
Actual | | $ 1,000.00 | $ 1,089.40 | $ 12.64 |
Hypothetical A | | $ 1,000.00 | $ 1,013.11 | $ 12.18 |
International Small Cap Opportunities | 1.39% | | | |
Actual | | $ 1,000.00 | $ 1,095.10 | $ 7.34 |
Hypothetical A | | $ 1,000.00 | $ 1,018.20 | $ 7.07 |
Institutional Class | 1.36% | | | |
Actual | | $ 1,000.00 | $ 1,095.00 | $ 7.18 |
Hypothetical A | | $ 1,000.00 | $ 1,018.35 | $ 6.92 |
A 5% return per year before expenses
B Annualized expense ratio reflects expenses net of applicable fee waivers.
* Expenses are equal to each Class' annualized expense ratio, multiplied by the average account value over the period, multiplied by 184/365 (to reflect the one-half year period).
Annual Report
Investment Changes (Unaudited)
Geographic Diversification (% of fund's net assets) |
As of October 31, 2013 |
 | Japan 26.1% | |
 | United Kingdom 19.3% | |
 | United States of America* 14.6% | |
 | Germany 5.1% | |
 | Italy 3.5% | |
 | Netherlands 3.5% | |
 | France 2.4% | |
 | Sweden 2.1% | |
 | Ireland 2.0% | |
 | Other 21.4% | |

Percentages are based on country or territory of incorporation and are adjusted for the effect of futures contracts, if applicable. |
* Includes Short-Term Investments and Net Other Assets (Liabilities). |
As of April 30, 2013 |
| Japan 24.9% | |
| United Kingdom 17.9% | |
| United States of America* 16.9% | |
| Germany 4.0% | |
| Turkey 3.7% | |
| Netherlands 3.0% | |
| Italy 2.6% | |
| France 2.6% | |
| Sweden 2.4% | |
| Other 22.0% | |

Percentages are based on country or territory of incorporation and are adjusted for the effect of futures contracts, if applicable. |
* Includes Short-Term Investments and Net Other Assets (Liabilities). |
Asset Allocation as of October 31, 2013 |
| % of fund's
net assets | % of fund's net assets
6 months ago |
Stocks | 97.6 | 95.6 |
Short-Term Investments and Net Other Assets (Liabilities) | 2.4 | 4.4 |
Top Ten Stocks as of October 31, 2013 |
| % of fund's
net assets | % of fund's net assets
6 months ago |
USS Co. Ltd. (Japan, Specialty Retail) | 2.3 | 2.1 |
PriceSmart, Inc. (United States of America, Food & Staples Retailing) | 1.9 | 2.0 |
Aalberts Industries NV (Netherlands, Machinery) | 1.6 | 1.1 |
Spirax-Sarco Engineering PLC (United Kingdom, Machinery) | 1.5 | 1.4 |
CTS Eventim AG (Germany, Media) | 1.4 | 1.2 |
Interpump Group SpA (Italy, Machinery) | 1.4 | 1.1 |
Azimut Holding SpA (Italy, Capital Markets) | 1.4 | 1.0 |
Intrum Justitia AB (Sweden, Commercial Services & Supplies) | 1.4 | 1.4 |
Unite Group PLC (United Kingdom, Real Estate Management & Development) | 1.3 | 1.2 |
Spectris PLC (United Kingdom, Electronic Equipment & Components) | 1.3 | 1.0 |
| 15.5 | |
Market Sectors as of October 31, 2013 |
| % of fund's
net assets | % of fund's net assets
6 months ago |
Industrials | 24.1 | 23.7 |
Consumer Discretionary | 18.5 | 19.3 |
Financials | 18.5 | 16.7 |
Consumer Staples | 10.4 | 10.6 |
Materials | 9.8 | 9.4 |
Information Technology | 7.0 | 7.2 |
Health Care | 6.0 | 5.2 |
Energy | 3.3 | 3.5 |
Annual Report
Investments October 31, 2013
Showing Percentage of Net Assets
Common Stocks - 96.8% |
| Shares | | Value |
Australia - 1.6% |
Imdex Ltd. | 1,328,443 | | $ 904,016 |
Ramsay Health Care Ltd. | 79,365 | | 2,910,459 |
RCG Corp. Ltd. | 2,789,963 | | 1,951,331 |
Sydney Airport unit | 790,959 | | 3,132,339 |
TOTAL AUSTRALIA | | 8,898,145 |
Austria - 1.7% |
Andritz AG | 104,700 | | 6,449,637 |
Zumtobel AG | 164,181 | | 2,934,699 |
TOTAL AUSTRIA | | 9,384,336 |
Bailiwick of Jersey - 1.2% |
Informa PLC | 779,140 | | 6,989,683 |
Belgium - 1.9% |
Gimv NV | 71,688 | | 3,630,573 |
KBC Ancora (a) | 137,238 | | 4,470,174 |
Umicore SA | 56,570 | | 2,698,646 |
TOTAL BELGIUM | | 10,799,393 |
Bermuda - 0.4% |
Lazard Ltd. Class A | 58,699 | | 2,268,716 |
Brazil - 0.2% |
Arezzo Industria e Comercio SA | 84,300 | | 1,260,624 |
British Virgin Islands - 0.3% |
Gem Diamonds Ltd. (a) | 636,898 | | 1,628,818 |
Canada - 1.6% |
Pason Systems, Inc. | 243,700 | | 5,064,959 |
ShawCor Ltd. Class A | 62,500 | | 2,627,320 |
TAG Oil Ltd. (a)(e) | 289,400 | | 1,176,863 |
TOTAL CANADA | | 8,869,142 |
Denmark - 1.4% |
Jyske Bank A/S (Reg.) (a) | 66,327 | | 3,744,232 |
Spar Nord Bank A/S (a) | 457,069 | | 4,077,073 |
TOTAL DENMARK | | 7,821,305 |
Finland - 1.5% |
Nokian Tyres PLC | 92,000 | | 4,655,508 |
Tikkurila Oyj | 148,220 | | 3,841,781 |
TOTAL FINLAND | | 8,497,289 |
Common Stocks - continued |
| Shares | | Value |
France - 2.4% |
Laurent-Perrier Group SA | 27,463 | | $ 2,565,780 |
Remy Cointreau SA | 30,773 | | 3,036,719 |
Saft Groupe SA | 89,475 | | 2,840,312 |
Vetoquinol SA | 55,184 | | 2,196,833 |
Virbac SA | 15,500 | | 3,117,835 |
TOTAL FRANCE | | 13,757,479 |
Germany - 4.5% |
alstria office REIT-AG | 200,000 | | 2,535,734 |
Bilfinger Berger AG | 49,266 | | 5,469,670 |
CompuGROUP Holding AG (d) | 178,878 | | 4,661,920 |
CTS Eventim AG | 167,545 | | 8,178,058 |
Fielmann AG | 39,837 | | 4,456,908 |
TOTAL GERMANY | | 25,302,290 |
Greece - 0.7% |
Titan Cement Co. SA (Reg.) (a) | 138,880 | | 3,790,143 |
India - 0.6% |
Jyothy Laboratories Ltd. (a) | 1,106,018 | | 3,325,736 |
Ireland - 2.0% |
FBD Holdings PLC | 219,528 | | 4,739,220 |
James Hardie Industries PLC: | | | |
CDI | 151,916 | | 1,569,367 |
sponsored ADR | 100,715 | | 5,245,237 |
TOTAL IRELAND | | 11,553,824 |
Israel - 1.2% |
Azrieli Group | 96,005 | | 3,087,406 |
Ituran Location & Control Ltd. | 97,286 | | 1,780,334 |
Strauss Group Ltd. | 96,744 | | 1,708,675 |
TOTAL ISRAEL | | 6,576,415 |
Italy - 3.5% |
Azimut Holding SpA | 308,873 | | 7,846,456 |
Beni Stabili SpA SIIQ | 5,953,083 | | 4,089,896 |
Interpump Group SpA | 711,143 | | 7,917,546 |
TOTAL ITALY | | 19,853,898 |
Japan - 26.1% |
Air Water, Inc. | 101,000 | | 1,443,722 |
Anicom Holdings, Inc. (a)(d) | 56,400 | | 668,360 |
Aozora Bank Ltd. | 1,875,000 | | 5,450,690 |
Common Stocks - continued |
| Shares | | Value |
Japan - continued |
ARNEST ONE Corp. (d) | 90,000 | | $ 2,467,609 |
Artnature, Inc. | 74,200 | | 1,583,730 |
Asahi Co. Ltd. | 148,100 | | 2,510,464 |
Autobacs Seven Co. Ltd. | 275,800 | | 4,021,296 |
Azbil Corp. | 174,800 | | 4,211,741 |
Coca-Cola Central Japan Co. Ltd. | 139,000 | | 2,461,779 |
Cosmos Pharmaceutical Corp. | 29,100 | | 3,545,271 |
Daikokutenbussan Co. Ltd. | 168,700 | | 5,062,340 |
FCC Co. Ltd. | 267,800 | | 6,117,869 |
GCA Savvian Group Corp. | 155,600 | | 1,715,286 |
Glory Ltd. | 74,200 | | 1,839,930 |
Goldcrest Co. Ltd. | 244,630 | | 6,544,798 |
Hajime Construction Co. Ltd. | 16,300 | | 1,123,909 |
Harmonic Drive Systems, Inc. | 121,400 | | 2,613,511 |
Iwatsuka Confectionary Co. Ltd. | 48,400 | | 2,496,259 |
Kamigumi Co. Ltd. | 217,000 | | 1,887,545 |
Kobayashi Pharmaceutical Co. Ltd. | 59,900 | | 3,353,863 |
Kyoto Kimono Yuzen Co. Ltd. | 83,300 | | 875,376 |
Lasertec Corp. (a) | 199,800 | | 2,064,120 |
Meiko Network Japan Co. Ltd. | 112,600 | | 1,299,874 |
Miraial Co. Ltd. | 69,800 | | 1,132,218 |
Nabtesco Corp. | 124,900 | | 3,048,499 |
Nagaileben Co. Ltd. | 205,900 | | 3,397,806 |
Nihon M&A Center, Inc. | 82,700 | | 6,378,286 |
Nihon Parkerizing Co. Ltd. | 267,000 | | 5,215,861 |
Nippon Seiki Co. Ltd. | 218,000 | | 3,554,253 |
Nippon Thompson Co. Ltd. | 47,000 | | 255,804 |
NS Tool Co. Ltd. | 17,800 | | 303,184 |
Obic Co. Ltd. | 144,900 | | 4,550,248 |
OSG Corp. | 394,200 | | 6,376,834 |
San-Ai Oil Co. Ltd. | 32,000 | | 138,202 |
Seven Bank Ltd. | 1,860,000 | | 6,583,016 |
SHO-BOND Holdings Co. Ltd. | 134,400 | | 6,293,595 |
Shoei Co. Ltd. | 233,800 | | 2,196,588 |
Software Service, Inc. | 43,100 | | 1,620,489 |
Techno Medica Co. Ltd. | 65,900 | | 1,435,105 |
The Nippon Synthetic Chemical Industry Co. Ltd. | 472,000 | | 4,550,686 |
Tocalo Co. Ltd. | 112,400 | | 1,840,264 |
Tsutsumi Jewelry Co. Ltd. | 81,000 | | 1,973,613 |
USS Co. Ltd. | 868,600 | | 12,720,209 |
Common Stocks - continued |
| Shares | | Value |
Japan - continued |
Workman Co. Ltd. | 43,400 | | $ 1,700,821 |
Yamato Kogyo Co. Ltd. | 182,500 | | 6,764,217 |
TOTAL JAPAN | | 147,389,140 |
Korea (South) - 1.0% |
Coway Co. Ltd. | 95,705 | | 5,464,835 |
Mexico - 0.4% |
Consorcio ARA S.A.B. de CV (a) | 5,696,218 | | 2,226,577 |
Netherlands - 3.5% |
Aalberts Industries NV | 291,901 | | 8,735,082 |
ASM International NV (depositary receipt) | 75,900 | | 2,506,218 |
Heijmans NV (Certificaten Van Aandelen) | 319,533 | | 4,251,256 |
VastNed Retail NV | 90,134 | | 4,167,632 |
TOTAL NETHERLANDS | | 19,660,188 |
Philippines - 0.4% |
Jollibee Food Corp. | 566,420 | | 2,325,186 |
Portugal - 0.4% |
Jeronimo Martins SGPS SA | 128,900 | | 2,381,940 |
South Africa - 1.6% |
Clicks Group Ltd. | 957,241 | | 5,964,430 |
Nampak Ltd. | 997,000 | | 3,297,263 |
TOTAL SOUTH AFRICA | | 9,261,693 |
Spain - 1.1% |
Grifols SA | 54,232 | | 2,224,100 |
Prosegur Compania de Seguridad SA (Reg.) | 717,890 | | 4,269,252 |
TOTAL SPAIN | | 6,493,352 |
Sweden - 2.1% |
Fagerhult AB | 137,487 | | 4,222,176 |
Intrum Justitia AB | 286,334 | | 7,622,258 |
TOTAL SWEDEN | | 11,844,434 |
Switzerland - 0.4% |
Zehnder Group AG | 42,336 | | 1,994,670 |
Turkey - 1.6% |
Albaraka Turk Katilim Bankasi A/S (a) | 3,932,046 | | 3,506,095 |
Coca-Cola Icecek A/S | 198,362 | | 5,688,779 |
TOTAL TURKEY | | 9,194,874 |
Common Stocks - continued |
| Shares | | Value |
United Kingdom - 19.3% |
Babcock International Group PLC | 219,700 | | $ 4,491,404 |
Bellway PLC | 258,872 | | 6,242,733 |
Berendsen PLC | 281,163 | | 4,375,177 |
Britvic PLC | 462,271 | | 4,632,533 |
Dechra Pharmaceuticals PLC | 342,500 | | 3,789,235 |
Derwent London PLC | 89,210 | | 3,581,704 |
Elementis PLC | 1,272,510 | | 5,286,528 |
Fenner PLC | 389,762 | | 2,499,778 |
Great Portland Estates PLC | 660,789 | | 6,070,987 |
H&T Group PLC | 214,353 | | 567,094 |
Hilton Food Group PLC | 142,800 | | 979,972 |
InterContinental Hotel Group PLC ADR | 130,126 | | 3,819,198 |
Johnson Matthey PLC | 89,175 | | 4,295,215 |
Meggitt PLC | 563,614 | | 5,173,675 |
Persimmon PLC | 191,863 | | 3,891,559 |
Rotork PLC | 153,400 | | 7,041,879 |
Serco Group PLC | 641,797 | | 5,731,849 |
Shaftesbury PLC | 564,273 | | 5,374,247 |
Spectris PLC | 196,078 | | 7,268,731 |
Spirax-Sarco Engineering PLC | 176,521 | | 8,258,925 |
Ted Baker PLC | 92,300 | | 2,526,255 |
Ultra Electronics Holdings PLC | 191,958 | | 5,952,571 |
Unite Group PLC | 1,160,870 | | 7,370,902 |
TOTAL UNITED KINGDOM | | 109,222,151 |
United States of America - 12.2% |
ANSYS, Inc. (a) | 16,285 | | 1,424,123 |
Autoliv, Inc. | 58,300 | | 5,202,109 |
BPZ Energy, Inc. (a)(d) | 549,267 | | 1,104,027 |
Broadridge Financial Solutions, Inc. | 44,505 | | 1,564,796 |
Dril-Quip, Inc. (a) | 38,395 | | 4,508,341 |
Evercore Partners, Inc. Class A | 85,700 | | 4,325,279 |
Greenhill & Co., Inc. | 55,195 | | 2,831,504 |
Kansas City Southern | 17,904 | | 2,175,694 |
Kennedy-Wilson Holdings, Inc. | 193,329 | | 3,874,313 |
Martin Marietta Materials, Inc. | 41,720 | | 4,092,315 |
Mohawk Industries, Inc. (a) | 37,700 | | 4,992,234 |
Oceaneering International, Inc. | 46,102 | | 3,959,240 |
PriceSmart, Inc. | 95,971 | | 10,920,540 |
ResMed, Inc. (d) | 99,100 | | 5,127,434 |
Common Stocks - continued |
| Shares | | Value |
United States of America - continued |
Solera Holdings, Inc. | 114,956 | | $ 6,462,826 |
SS&C Technologies Holdings, Inc. (a) | 163,958 | | 6,443,549 |
TOTAL UNITED STATES OF AMERICA | | 69,008,324 |
TOTAL COMMON STOCKS (Cost $404,246,204) |
547,044,600
|
Nonconvertible Preferred Stocks - 0.8% |
| | | |
Brazil - 0.2% |
Banco ABC Brasil SA | 222,389 | | 1,368,960 |
Germany - 0.6% |
Sartorius AG (non-vtg.) | 32,579 | | 3,436,993 |
TOTAL NONCONVERTIBLE PREFERRED STOCKS (Cost $5,148,060) |
4,805,953
|
Money Market Funds - 4.5% |
| | | |
Fidelity Cash Central Fund, 0.09% (b) | 18,051,128 | | 18,051,128 |
Fidelity Securities Lending Cash Central Fund, 0.09% (b)(c) | 7,174,591 | | 7,174,591 |
TOTAL MONEY MARKET FUNDS (Cost $25,225,719) |
25,225,719
|
TOTAL INVESTMENT PORTFOLIO - 102.1% (Cost $434,619,983) | | 577,076,272 |
NET OTHER ASSETS (LIABILITIES) - (2.1)% | | (12,118,320) |
NET ASSETS - 100% | $ 564,957,952 |
Legend |
(a) Non-income producing |
(b) Affiliated fund that is generally available only to investment companies and other accounts managed by Fidelity Investments. The rate quoted is the annualized seven-day yield of the fund at period end. A complete unaudited listing of the fund's holdings as of its most recent quarter end is available upon request. In addition, each Fidelity Central Fund's financial statements, which are not covered by the Fund's Report of Independent Registered Public Accounting Firm, are available on the SEC's website or upon request. |
(c) Investment made with cash collateral received from securities on loan. |
(d) Security or a portion of the security is on loan at period end. |
(e) Security or a portion of the security purchased on a delayed delivery or when-issued basis. |
Affiliated Central Funds |
Information regarding fiscal year to date income earned by the Fund from investments in Fidelity Central Funds is as follows: |
Fund | Income earned |
Fidelity Cash Central Fund | $ 23,340 |
Fidelity Securities Lending Cash Central Fund | 158,525 |
Total | $ 181,865 |
Other Information |
Categorizations in the Schedule of Investments are based on country or territory of incorporation. |
The following is a summary of the inputs used, as of October 31, 2013, involving the Fund's assets and liabilities carried at fair value. The inputs or methodology used for valuing securities may not be an indication of the risk associated with investing in those securities. For more information on valuation inputs, and their aggregation into the levels used in the tables below, please refer to the Investment Valuation section in the accompanying Notes to Financial Statements. |
Valuation Inputs at Reporting Date: |
Description | Total | Level 1 | Level 2 | Level 3 |
Investments in Securities: | | | | |
Equities: | | | | |
Consumer Discretionary | $ 104,744,679 | $ 64,182,798 | $ 36,970,363 | $ 3,591,518 |
Consumer Staples | 59,708,346 | 41,205,104 | 18,503,242 | - |
Energy | 18,578,952 | 18,440,750 | 138,202 | - |
Financials | 104,490,347 | 83,528,197 | 20,962,150 | - |
Health Care | 33,918,209 | 27,464,809 | 6,453,400 | - |
Industrials | 136,377,301 | 105,539,849 | 30,837,452 | - |
Information Technology | 39,408,904 | 27,450,577 | 11,958,327 | - |
Materials | 54,623,815 | 36,649,329 | 17,974,486 | - |
Money Market Funds | 25,225,719 | 25,225,719 | - | - |
Total Investments in Securities: | $ 577,076,272 | $ 429,687,132 | $ 143,797,622 | $ 3,591,518 |
The following is a summary of transfers between Level 1 and Level 2 for the period ended October 31, 2013. Transfers are assumed to have occurred at the beginning of the period, and are primarily attributable to the valuation techniques used for foreign equity securities, as discussed in the accompanying Notes to Financial Statements: |
Transfers | Total |
Level 1 to Level 2 | $ 76,627,921 |
Level 2 to Level 1 | $ 0 |
See accompanying notes which are an integral part of the financial statements.
Annual Report
Statement of Assets and Liabilities
| October 31, 2013 |
| | |
Assets | | |
Investment in securities, at value (including securities loaned of $6,987,440) - See accompanying schedule: Unaffiliated issuers (cost $409,394,264) | $ 551,850,553 | |
Fidelity Central Funds (cost $25,225,719) | 25,225,719 | |
Total Investments (cost $434,619,983) | | $ 577,076,272 |
Receivable for investments sold | | 4,506,670 |
Receivable for fund shares sold | | 507,688 |
Dividends receivable | | 1,303,342 |
Distributions receivable from Fidelity Central Funds | | 9,452 |
Prepaid expenses | | 1,697 |
Other receivables | | 7,965 |
Total assets | | 583,413,086 |
| | |
Liabilities | | |
Payable for investments purchased
Regular delivery | $ 9,748,207 | |
Delayed delivery | 121,976 | |
Payable for fund shares redeemed | 696,646 | |
Accrued management fee | 466,893 | |
Distribution and service plan fees payable | 16,120 | |
Other affiliated payables | 129,994 | |
Other payables and accrued expenses | 100,707 | |
Collateral on securities loaned, at value | 7,174,591 | |
Total liabilities | | 18,455,134 |
| | |
Net Assets | | $ 564,957,952 |
Net Assets consist of: | | |
Paid in capital | | $ 731,355,395 |
Undistributed net investment income | | 3,595,468 |
Accumulated undistributed net realized gain (loss) on investments and foreign currency transactions | | (312,444,762) |
Net unrealized appreciation (depreciation) on investments and assets and liabilities in foreign currencies | | 142,451,851 |
Net Assets | | $ 564,957,952 |
See accompanying notes which are an integral part of the financial statements.
Annual Report
Financial Statements - continued
Statement of Assets and Liabilities - continued
| October 31, 2013 |
| | |
Calculation of Maximum Offering Price Class A:
Net Asset Value and redemption price per share ($22,051,924 ÷ 1,611,668 shares) | | $ 13.68 |
| | |
Maximum offering price per share (100/94.25 of $13.68) | | $ 14.51 |
Class T:
Net Asset Value and redemption price per share ($9,634,442 ÷ 710,451 shares) | | $ 13.56 |
| | |
Maximum offering price per share (100/96.50 of $13.56) | | $ 14.05 |
Class B:
Net Asset Value and offering price per share ($1,410,258 ÷ 105,955 shares)A | | $ 13.31 |
| | |
Class C:
Net Asset Value and offering price per share ($8,070,406 ÷ 607,758 shares)A | | $ 13.28 |
| | |
| | |
International Small Cap Opportunities:
Net Asset Value, offering price and redemption price per share ($518,121,061 ÷ 37,496,899 shares) | | $ 13.82 |
| | |
Institutional Class:
Net Asset Value, offering price and redemption price per share ($5,669,861 ÷ 409,848 shares) | | $ 13.83 |
A Redemption price per share is equal to net asset value less any applicable contingent deferred sales charge.
See accompanying notes which are an integral part of the financial statements.
Annual Report
Statement of Operations
| Year ended October 31, 2013 |
| | |
Investment Income | | |
Dividends | | $ 10,512,209 |
Income from Fidelity Central Funds | | 181,865 |
Income before foreign taxes withheld | | 10,694,074 |
Less foreign taxes withheld | | (769,601) |
Total income | | 9,924,473 |
| | |
Expenses | | |
Management fee
Basic fee | $ 3,787,691 | |
Performance adjustment | 774,974 | |
Transfer agent fees | 1,108,282 | |
Distribution and service plan fees | 181,823 | |
Accounting and security lending fees | 230,791 | |
Custodian fees and expenses | 134,829 | |
Independent trustees' compensation | 2,439 | |
Registration fees | 95,153 | |
Audit | 68,957 | |
Legal | 1,172 | |
Miscellaneous | 3,054 | |
Total expenses before reductions | 6,389,165 | |
Expense reductions | (68,959) | 6,320,206 |
Net investment income (loss) | | 3,604,267 |
Realized and Unrealized Gain (Loss) Net realized gain (loss) on: | | |
Investment securities: | | |
Unaffiliated issuers | 37,160,055 | |
Foreign currency transactions | (43,323) | |
Total net realized gain (loss) | | 37,116,732 |
Change in net unrealized appreciation (depreciation) on: Investment securities | 71,930,920 | |
Assets and liabilities in foreign currencies | 14,737 | |
Total change in net unrealized appreciation (depreciation) | | 71,945,657 |
Net gain (loss) | | 109,062,389 |
Net increase (decrease) in net assets resulting from operations | | $ 112,666,656 |
See accompanying notes which are an integral part of the financial statements.
Annual Report
Financial Statements - continued
Statement of Changes in Net Assets
| Year ended
October 31,
2013 | Year ended
October 31,
2012 |
Increase (Decrease) in Net Assets | | |
Operations | | |
Net investment income (loss) | $ 3,604,267 | $ 3,779,313 |
Net realized gain (loss) | 37,116,732 | 21,361,280 |
Change in net unrealized appreciation (depreciation) | 71,945,657 | 17,236,425 |
Net increase (decrease) in net assets resulting
from operations | 112,666,656 | 42,377,018 |
Distributions to shareholders from net investment income | (3,311,096) | (4,886,680) |
Distributions to shareholders from net realized gain | (171,255) | (369,319) |
Total distributions | (3,482,351) | (5,255,999) |
Share transactions - net increase (decrease) | 81,271,586 | (28,976,326) |
Redemption fees | 56,441 | 64,463 |
Total increase (decrease) in net assets | 190,512,332 | 8,209,156 |
| | |
Net Assets | | |
Beginning of period | 374,445,620 | 366,236,464 |
End of period (including undistributed net investment income of $3,595,468 and undistributed net investment income of $3,302,296, respectively) | $ 564,957,952 | $ 374,445,620 |
See accompanying notes which are an integral part of the financial statements.
Annual Report
Financial Highlights - Class A
Years ended October 31, | 2013 | 2012 | 2011 | 2010 | 2009 |
Selected Per-Share Data | | | | | |
Net asset value, beginning of period | $ 10.78 | $ 9.75 | $ 9.82 | $ 8.07 | $ 6.24 |
Income from Investment Operations | | | | | |
Net investment income (loss) C | .07 | .08 | .15 F | .06 | .06 |
Net realized and unrealized gain (loss) | 2.91 | 1.07 | (.07) | 1.85 | 1.77 |
Total from investment operations | 2.98 | 1.15 | .08 | 1.91 | 1.83 |
Distributions from net investment income | (.08) | (.11) | (.11) | (.07) | - |
Distributions from net realized gain | (.01) | (.01) | (.04) | (.09) | - |
Total distributions | (.08) I | (.12) | (.15) | (.16) | - |
Redemption fees added to paid in capital C, H | - | - | - | - | - |
Net asset value, end of period | $ 13.68 | $ 10.78 | $ 9.75 | $ 9.82 | $ 8.07 |
Total Return A, B | 27.85% | 12.00% | .81% | 24.05% | 29.33% |
Ratios to Average Net Assets D, G | | | | | |
Expenses before reductions | 1.70% | 1.75% | 1.34% | 1.16% | .94% |
Expenses net of fee waivers, if any | 1.65% | 1.65% | 1.33% | 1.16% | .94% |
Expenses net of all reductions | 1.64% | 1.64% | 1.32% | 1.15% | .89% |
Net investment income (loss) | .59% | .85% | 1.44% F | .74% | 1.00% |
Supplemental Data | | | | | |
Net assets, end of period (000 omitted) | $ 22,052 | $ 18,194 | $ 18,686 | $ 20,228 | $ 18,883 |
Portfolio turnover rate E | 31% | 28% | 24% | 49% | 174% |
A Total returns would have been lower if certain expenses had not been reduced during the applicable periods shown.
B Total returns do not include the effect of the sales charges.
C Calculated based on average shares outstanding during the period.
D Fees and expenses of any underlying Fidelity Central Funds are not included in the Fund's expense ratio. The Fund indirectly bears its proportionate share of the expenses of any underlying Fidelity Central Funds.
E Amount does not include the portfolio activity of any underlying Fidelity Central Funds.
F Investment income per share reflects a large, non-recurring dividend which amounted to $.06 per share. Excluding this non-recurring dividend, the ratio of net investment income (loss) to average net assets would have been .80%.
G Expense ratios reflect operating expenses of the class. Expenses before reductions do not reflect amounts reimbursed by the investment adviser or reductions from brokerage service arrangements or reductions from other expense offset arrangements and do not represent the amount paid by the class during periods when reimbursements or reductions occur. Expenses net of fee waivers reflect expenses after reimbursement by the investment adviser but prior to reductions from brokerage service arrangements or other expense offset arrangements. Expenses net of all reductions represent the net expenses paid by the class.
H Amount represents less than $.01 per share.
I Total distributions of $.08 per share is comprised of distributions from net investment income of $.077 and distributions from net realized gain of $.005 per share.
See accompanying notes which are an integral part of the financial statements.
Annual Report
Financial Highlights - Class T
Years ended October 31, | 2013 | 2012 | 2011 | 2010 | 2009 |
Selected Per-Share Data | | | | | |
Net asset value, beginning of period | $ 10.69 | $ 9.66 | $ 9.72 | $ 8.00 | $ 6.20 |
Income from Investment Operations | | | | | |
Net investment income (loss) C | .04 | .06 | .12 F | .04 | .05 |
Net realized and unrealized gain (loss) | 2.89 | 1.06 | (.06) | 1.83 | 1.75 |
Total from investment operations | 2.93 | 1.12 | .06 | 1.87 | 1.80 |
Distributions from net investment income | (.05) | (.08) | (.08) | (.06) | - |
Distributions from net realized gain | (.01) | (.01) | (.04) | (.09) | - |
Total distributions | (.06) | (.09) | (.12) | (.15) | - |
Redemption fees added to paid in capital C, H | - | - | - | - | - |
Net asset value, end of period | $ 13.56 | $ 10.69 | $ 9.66 | $ 9.72 | $ 8.00 |
Total Return A, B | 27.53% | 11.72% | .60% | 23.65% | 29.03% |
Ratios to Average Net Assets D, G | | | | | |
Expenses before reductions | 1.96% | 2.02% | 1.60% | 1.43% | 1.20% |
Expenses net of fee waivers, if any | 1.90% | 1.90% | 1.60% | 1.43% | 1.20% |
Expenses net of all reductions | 1.89% | 1.89% | 1.59% | 1.41% | 1.15% |
Net investment income (loss) | .34% | .60% | 1.17% F | .48% | .74% |
Supplemental Data | | | | | |
Net assets, end of period (000 omitted) | $ 9,634 | $ 8,169 | $ 8,701 | $ 11,202 | $ 11,915 |
Portfolio turnover rate E | 31% | 28% | 24% | 49% | 174% |
A Total returns would have been lower if certain expenses had not been reduced during the applicable periods shown.
B Total returns do not include the effect of the sales charges.
C Calculated based on average shares outstanding during the period.
D Fees and expenses of any underlying Fidelity Central Funds are not included in the Fund's expense ratio. The Fund indirectly bears its proportionate share of the expenses of any underlying Fidelity Central Funds.
E Amount does not include the portfolio activity of any underlying Fidelity Central Funds.
F Investment income per share reflects a large, non-recurring dividend which amounted to $.06 per share. Excluding this non-recurring dividend, the ratio of net investment income (loss) to average net assets would have been .54%.
G Expense ratios reflect operating expenses of the class. Expenses before reductions do not reflect amounts reimbursed by the investment adviser or reductions from brokerage service arrangements or reductions from other expense offset arrangements and do not represent the amount paid by the class during periods when reimbursements or reductions occur. Expenses net of fee waivers reflect expenses after reimbursement by the investment adviser but prior to reductions from brokerage service arrangements or other expense offset arrangements. Expenses net of all reductions represent the net expenses paid by the class.
H Amount represents less than $.01 per share.
See accompanying notes which are an integral part of the financial statements.
Annual Report
Financial Highlights - Class B
Years ended October 31, | 2013 | 2012 | 2011 | 2010 | 2009 |
Selected Per-Share Data | | | | | |
Net asset value, beginning of period | $ 10.50 | $ 9.48 | $ 9.54 | $ 7.87 | $ 6.12 |
Income from Investment Operations | | | | | |
Net investment income (loss) C | (.02) | .01 | .07 F | - H | .02 |
Net realized and unrealized gain (loss) | 2.84 | 1.05 | (.06) | 1.79 | 1.73 |
Total from investment operations | 2.82 | 1.06 | .01 | 1.79 | 1.75 |
Distributions from net investment income | - H | (.03) | (.06) | (.03) | - |
Distributions from net realized gain | (.01) | (.01) | (.02) | (.09) | - |
Total distributions | (.01) | (.04) | (.07) I | (.12) | - |
Redemption fees added to paid in capital C, H | - | - | - | - | - |
Net asset value, end of period | $ 13.31 | $ 10.50 | $ 9.48 | $ 9.54 | $ 7.87 |
Total Return A, B | 26.86% | 11.21% | .10% | 23.03% | 28.59% |
Ratios to Average Net Assets D, G | | | | | |
Expenses before reductions | 2.46% | 2.50% | 2.09% | 1.91% | 1.69% |
Expenses net of fee waivers, if any | 2.40% | 2.40% | 2.09% | 1.91% | 1.69% |
Expenses net of all reductions | 2.39% | 2.39% | 2.07% | 1.90% | 1.64% |
Net investment income (loss) | (.16)% | .10% | .68% F | (.01)% | .25% |
Supplemental Data | | | | | |
Net assets, end of period (000 omitted) | $ 1,410 | $ 1,966 | $ 2,293 | $ 2,902 | $ 2,799 |
Portfolio turnover rate E | 31% | 28% | 24% | 49% | 174% |
A Total returns would have been lower if certain expenses had not been reduced during the applicable periods shown.
B Total returns do not include the effect of the contingent deferred sales charge.
C Calculated based on average shares outstanding during the period.
D Fees and expenses of any underlying Fidelity Central Funds are not included in the Fund's expense ratio. The Fund indirectly bears its proportionate share of the expenses of any underlying Fidelity Central Funds.
E Amount does not include the portfolio activity of any underlying Fidelity Central Funds.
F Investment income per share reflects a large, non-recurring dividend which amounted to $.06 per share. Excluding this non-recurring dividend, the ratio of net investment income (loss) to average net assets would have been .05%.
G Expense ratios reflect operating expenses of the class. Expenses before reductions do not reflect amounts reimbursed by the investment adviser or reductions from brokerage service arrangements or reductions from other expense offset arrangements and do not represent the amount paid by the class during periods when reimbursements or reductions occur. Expenses net of fee waivers reflect expenses after reimbursement by the investment adviser but prior to reductions from brokerage service arrangements or other expense offset arrangements. Expenses net of all reductions represent the net expenses paid by the class.
H Amount represents less than $.01 per share.
I Total distributions of $.07 per share is comprised of distributions from net investment income of $.058 and distributions from net realized gain of $.015 per share.
See accompanying notes which are an integral part of the financial statements.
Annual Report
Financial Highlights - Class C
Years ended October 31, | 2013 | 2012 | 2011 | 2010 | 2009 |
Selected Per-Share Data | | | | | |
Net asset value, beginning of period | $ 10.48 | $ 9.47 | $ 9.53 | $ 7.86 | $ 6.11 |
Income from Investment Operations | | | | | |
Net investment income (loss) C | (.02) | .01 | .07 F | - H | .02 |
Net realized and unrealized gain (loss) | 2.84 | 1.04 | (.06) | 1.79 | 1.73 |
Total from investment operations | 2.82 | 1.05 | .01 | 1.79 | 1.75 |
Distributions from net investment income | (.01) | (.03) | (.06) | (.03) | - |
Distributions from net realized gain | (.01) | (.01) | (.02) | (.09) | - |
Total distributions | (.02) | (.04) | (.07) I | (.12) | - |
Redemption fees added to paid in capital C, H | - | - | - | - | - |
Net asset value, end of period | $ 13.28 | $ 10.48 | $ 9.47 | $ 9.53 | $ 7.86 |
Total Return A, B | 26.91% | 11.13% | .10% | 23.06% | 28.64% |
Ratios to Average Net Assets D, G | | | | | |
Expenses before reductions | 2.45% | 2.50% | 2.09% | 1.91% | 1.68% |
Expenses net of fee waivers, if any | 2.40% | 2.40% | 2.09% | 1.91% | 1.68% |
Expenses net of all reductions | 2.39% | 2.39% | 2.07% | 1.90% | 1.63% |
Net investment income (loss) | (.16)% | .10% | .68% F | (.01)% | .26% |
Supplemental Data | | | | | |
Net assets, end of period (000 omitted) | $ 8,070 | $ 6,608 | $ 6,900 | $ 8,936 | $ 8,543 |
Portfolio turnover rate E | 31% | 28% | 24% | 49% | 174% |
A Total returns would have been lower if certain expenses had not been reduced during the applicable periods shown.
B Total returns do not include the effect of the contingent deferred sales charge.
C Calculated based on average shares outstanding during the period.
D Fees and expenses of any underlying Fidelity Central Funds are not included in the Fund's expense ratio. The Fund indirectly bears its proportionate share of the expenses of any underlying Fidelity Central Funds.
E Amount does not include the portfolio activity of any underlying Fidelity Central Funds.
F Investment income per share reflects a large, non-recurring dividend which amounted to $.06 per share. Excluding this non-recurring dividend, the ratio of net investment income (loss) to average net assets would have been .05%.
G Expense ratios reflect operating expenses of the class. Expenses before reductions do not reflect amounts reimbursed by the investment adviser or reductions from brokerage service arrangements or reductions from other expense offset arrangements and do not represent the amount paid by the class during periods when reimbursements or reductions occur. Expenses net of fee waivers reflect expenses after reimbursement by the investment adviser but prior to reductions from brokerage service arrangements or other expense offset arrangements. Expenses net of all reductions represent the net expenses paid by the class.
H Amount represents less than $.01 per share.
I Total distributions of $.07 per share is comprised of distributions from net investment income of $.058 and distributions from net realized gain of $.015 per share.
See accompanying notes which are an integral part of the financial statements.
Annual Report
Financial Highlights - International Small Cap Opportunities
Years ended October 31, | 2013 | 2012 | 2011 | 2010 | 2009 |
Selected Per-Share Data | | | | | |
Net asset value, beginning of period | $ 10.88 | $ 9.85 | $ 9.92 | $ 8.14 | $ 6.28 |
Income from Investment Operations | | | | | |
Net investment income (loss) B | .10 | .11 | .17 E | .09 | .08 |
Net realized and unrealized gain (loss) | 2.95 | 1.07 | (.06) | 1.87 | 1.78 |
Total from investment operations | 3.05 | 1.18 | .11 | 1.96 | 1.86 |
Distributions from net investment income | (.10) | (.14) | (.14) | (.09) | - G |
Distributions from net realized gain | (.01) | (.01) | (.04) | (.09) | - |
Total distributions | (.11) | (.15) | (.18) | (.18) | - G |
Redemption fees added to paid in capital B, G | - | - | - | - | - |
Net asset value, end of period | $ 13.82 | $ 10.88 | $ 9.85 | $ 9.92 | $ 8.14 |
Total Return A | 28.24% | 12.21% | 1.10% | 24.43% | 29.68% |
Ratios to Average Net Assets C, F | | | | | |
Expenses before reductions | 1.39% | 1.47% | 1.08% | .91% | .68% |
Expenses net of fee waivers, if any | 1.39% | 1.40% | 1.08% | .91% | .68% |
Expenses net of all reductions | 1.38% | 1.39% | 1.06% | .89% | .64% |
Net investment income (loss) | .85% | 1.10% | 1.69% E | 1.00% | 1.25% |
Supplemental Data | | | | | |
Net assets, end of period (000 omitted) | $ 518,121 | $ 334,918 | $ 328,262 | $ 398,331 | $ 329,128 |
Portfolio turnover rate D | 31% | 28% | 24% | 49% | 174% |
A Total returns would have been lower if certain expenses had not been reduced during the applicable periods shown.
B Calculated based on average shares outstanding during the period.
C Fees and expenses of any underlying Fidelity Central Funds are not included in the Fund's expense ratio. The Fund indirectly bears its proportionate share of the expenses of any underlying Fidelity Central Funds.
D Amount does not include the portfolio activity of any underlying Fidelity Central Funds.
E Investment income per share reflects a large, non-recurring dividend which amounted to $.07 per share. Excluding this non-recurring dividend, the ratio of net investment income (loss) to average net assets would have been 1.06%.
F Expense ratios reflect operating expenses of the class. Expenses before reductions do not reflect amounts reimbursed by the investment adviser or reductions from brokerage service arrangements or reductions from other expense offset arrangements and do not represent the amount paid by the class during periods when reimbursements or reductions occur. Expenses net of fee waivers reflect expenses after reimbursement by the investment adviser but prior to reductions from brokerage service arrangements or other expense offset arrangements. Expenses net of all reductions represent the net expenses paid by the class.
G Amount represents less than $.01 per share.
See accompanying notes which are an integral part of the financial statements.
Annual Report
Financial Highlights - Institutional Class
Years ended October 31, | 2013 | 2012 | 2011 | 2010 | 2009 |
Selected Per-Share Data | | | | | |
Net asset value, beginning of period | $ 10.90 | $ 9.86 | $ 9.93 | $ 8.14 | $ 6.27 |
Income from Investment Operations | | | | | |
Net investment income (loss) B | .11 | .11 | .18 E | .09 | .08 |
Net realized and unrealized gain (loss) | 2.93 | 1.08 | (.06) | 1.86 | 1.79 |
Total from investment operations | 3.04 | 1.19 | .12 | 1.95 | 1.87 |
Distributions from net investment income | (.10) | (.14) | (.15) | (.07) | - G |
Distributions from net realized gain | (.01) | (.01) | (.04) | (.09) | - |
Total distributions | (.11) | (.15) | (.19) | (.16) | - G |
Redemption fees added to paid in capital B, G | - | - | - | - | - |
Net asset value, end of period | $ 13.83 | $ 10.90 | $ 9.86 | $ 9.93 | $ 8.14 |
Total Return A | 28.11% | 12.32% | 1.13% | 24.33% | 29.87% |
Ratios to Average Net Assets C, F | | | | | |
Expenses before reductions | 1.38% | 1.44% | 1.03% | .90% | .68% |
Expenses net of fee waivers, if any | 1.37% | 1.40% | 1.03% | .90% | .68% |
Expenses net of all reductions | 1.37% | 1.39% | 1.02% | .88% | .64% |
Net investment income (loss) | .87% | 1.10% | 1.74% E | 1.01% | 1.25% |
Supplemental Data | | | | | |
Net assets, end of period (000 omitted) | $ 5,670 | $ 4,591 | $ 1,395 | $ 2,418 | $ 2,022 |
Portfolio turnover rate D | 31% | 28% | 24% | 49% | 174% |
A Total returns would have been lower if certain expenses had not been reduced during the applicable periods shown.
B Calculated based on average shares outstanding during the period.
C Fees and expenses of any underlying Fidelity Central Funds are not included in the Fund's expense ratio. The Fund indirectly bears its proportionate share of the expenses of any underlying Fidelity Central Funds.
D Amount does not include the portfolio activity of any underlying Fidelity Central Funds.
E Investment income per share reflects a large, non-recurring dividend which amounted to $.07 per share. Excluding this non-recurring dividend, the ratio of net investment income (loss) to average net assets would have been 1.11%.
F Expense ratios reflect operating expenses of the class. Expenses before reductions do not reflect amounts reimbursed by the investment adviser or reductions from brokerage service arrangements or reductions from other expense offset arrangements and do not represent the amount paid by the class during periods when reimbursements or reductions occur. Expenses net of fee waivers reflect expenses after reimbursement by the investment adviser but prior to reductions from brokerage service arrangements or other expense offset arrangements. Expenses net of all reductions represent the net expenses paid by the class.
G Amount represents less than $.01 per share.
See accompanying notes which are an integral part of the financial statements.
Annual Report
Notes to Financial Statements
For the period ended October 31, 2013
1. Organization.
Fidelity International Small Cap Opportunities Fund (the Fund) is a fund of Fidelity Investment Trust (the Trust) and is authorized to issue an unlimited number of shares. The Trust is registered under the Investment Company Act of 1940, as amended (the 1940 Act), as an open-end management investment company organized as a Massachusetts business trust. The Fund offers Class A, Class T, Class C, International Small Cap Opportunities and Institutional Class shares, each of which, along with Class B shares, has equal rights as to assets and voting privileges. Class B shares are closed to new accounts and additional purchases, except for exchanges and reinvestments. Each class has exclusive voting rights with respect to matters that affect that class. Class B shares will automatically convert to Class A shares after a holding period of seven years from the initial date of purchase.
2. Investments in Fidelity Central Funds.
The Fund invests in Fidelity Central Funds, which are open-end investment companies generally available only to other investment companies and accounts managed by Fidelity Management & Research Company (FMR) and its affiliates. The Fund's Schedule of Investments lists each of the Fidelity Central Funds held as of period end, if any, as an investment of the Fund, but does not include the underlying holdings of each Fidelity Central Fund. As an Investing Fund, the Fund indirectly bears its proportionate share of the expenses of the underlying Fidelity Central Funds.
The Money Market Central Funds seek preservation of capital and current income and are managed by Fidelity Investments Money Management, Inc. (FIMM), an affiliate of FMR.
A complete unaudited list of holdings for each Fidelity Central Fund is available upon request or at the Securities and Exchange Commission (the SEC) website at www.sec.gov. In addition, the financial statements of the Fidelity Central Funds, which are not covered by the Fund's Report of Independent Registered Public Accounting Firm, are available on the SEC website or upon request.
3. Significant Accounting Policies.
The financial statements have been prepared in conformity with accounting principles generally accepted in the United States of America (GAAP), which require management to make certain estimates and assumptions at the date of the financial statements. Actual results could differ from those estimates. Subsequent events, if any, through the date that the financial statements were issued have been evaluated in the preparation of
Annual Report
Notes to Financial Statements - continued
3. Significant Accounting Policies - continued
the financial statements. The following summarizes the significant accounting policies of the Fund:
Investment Valuation. Investments are valued as of 4:00 p.m. Eastern time on the last calendar day of the period. In accordance with valuation policies and procedures approved by the Board of Trustees (the Board), the Fund attempts to obtain prices from one or more third party pricing vendors or brokers to value its investments. When current market prices, quotations or currency exchange rates are not readily available or reliable, investments will be fair valued in good faith by the FMR Fair Value Committee (the Committee), in accordance with procedures adopted by the Board. Factors used in determining fair value vary by investment type and may include market or investment specific events. The frequency with which these procedures are used cannot be predicted and they may be utilized to a significant extent. The Committee oversees the Fund's valuation policies and procedures and is responsible for approving and reporting to the Board all fair value determinations.
The Fund categorizes the inputs to valuation techniques used to value its investments into a disclosure hierarchy consisting of three levels as shown below:
Level 1 - quoted prices in active markets for identical investments
Level 2 - other significant observable inputs (including quoted prices for similar investments, interest rates, prepayment speeds, etc.)
Level 3 - unobservable inputs (including the Fund's own assumptions based on the best information available)
Valuation techniques used to value the Fund's investments by major category are as follows:
Equity securities, including restricted securities, for which market quotations are readily available, are valued at the last reported sale price or official closing price as reported by a third party pricing vendor on the primary market or exchange on which they are traded and are categorized as Level 1 in the hierarchy. In the event there were no sales during the day or closing prices are not available, securities are valued at the last quoted bid price or may be valued using the last available price and are generally categorized as Level 2 in the hierarchy. For foreign equity securities, when market or security specific events arise, comparisons to the valuation of American Depositary Receipts (ADRs), futures contracts, Exchange-Traded Funds (ETFs) and certain indexes as well as quoted prices for similar securities may be used and would be categorized as Level 2 in the hierarchy. Utilizing these techniques may result in transfers between Level 1 and Level 2. For equity securities, including restricted securities, where observable inputs are
Annual Report
3. Significant Accounting Policies - continued
Investment Valuation - continued
limited, assumptions about market activity and risk are used and these securities may be categorized as Level 3 in the hierarchy.
Investments in open-end mutual funds, including the Fidelity Central Funds, are valued at their closing net asset value (NAV) each business day and are categorized as Level 1 in the hierarchy.
Changes in valuation techniques may result in transfers in or out of an assigned level within the disclosure hierarchy. The aggregate value of investments by input level, as of October 31, 2013, including information on transfers between Levels 1 and 2 is included at the end of the Fund's Schedule of Investments.
Foreign Currency. The Fund may use foreign currency contracts to facilitate transactions in foreign-denominated securities. Gains and losses from these transactions may arise from changes in the value of the foreign currency or if the counterparties do not perform under the contracts' terms.
Foreign-denominated assets, including investment securities, and liabilities are translated into U.S. dollars at the exchange rates at period end. Purchases and sales of investment securities, income and dividends received and expenses denominated in foreign currencies are translated into U.S. dollars at the exchange rate in effect on the transaction date.
The effects of exchange rate fluctuations on investments are included with the net realized and unrealized gain (loss) on investment securities. Other foreign currency transactions resulting in realized and unrealized gain (loss) are disclosed separately.
Investment Transactions and Income. For financial reporting purposes, the Fund's investment holdings and NAV include trades executed through the end of the last business day of the period. The NAV per share for processing shareholder transactions is calculated as of the close of business of the New York Stock Exchange (NYSE), normally 4:00 p.m. Eastern time and includes trades executed through the end of the prior business day. Gains and losses on securities sold are determined on the basis of identified cost and may include proceeds received from litigation. Dividend income is recorded on the ex-dividend date, except for certain dividends from foreign securities where the ex-dividend date may have passed, which are recorded as soon as the Fund is informed of the ex-dividend date. Non-cash dividends included in dividend income, if any, are recorded at the fair market value of the securities received. Distributions received on securities that represent a return of capital or capital gain are recorded as a reduction of cost of investments and/or as a realized gain. Subsequent to ex-dividend date the Fund determines the components of these distributions, based upon receipt of tax filings or
Annual Report
Notes to Financial Statements - continued
3. Significant Accounting Policies - continued
Investment Transactions and Income - continued
other correspondence relating to the underlying investment. Interest income and distributions from the Fidelity Central Funds are accrued as earned. Investment income is recorded net of foreign taxes withheld where recovery of such taxes is uncertain.
Class Allocations and Expenses. Investment income, realized and unrealized capital gains and losses, common expenses of the Fund, and certain fund-level expense reductions, if any, are allocated daily on a pro-rata basis to each class based on the relative net assets of each class to the total net assets of the Fund. Each class differs with respect to transfer agent and distribution and service plan fees incurred. Certain expense reductions may also differ by class. For the reporting period, the allocated portion of income and expenses to each class as a percent of its average net assets may vary due to the timing of recording these transactions in relation to fluctuating net assets of the classes. Expenses directly attributable to a fund are charged to that fund. Expenses attributable to more than one fund are allocated among the respective funds on the basis of relative net assets or other appropriate methods. Expense estimates are accrued in the period to which they relate and adjustments are made when actual amounts are known.
Income Tax Information and Distributions to Shareholders. Each year, the Fund intends to qualify as a regulated investment company under Subchapter M of the Internal Revenue Code, including distributing substantially all of its taxable income and realized gains. As a result, no provision for U.S. Federal income taxes is required. As of October 31, 2013, the Fund did not have any unrecognized tax benefits in the financial statements; nor is the Fund aware of any tax positions for which it is reasonably possible that the total amounts of unrecognized tax benefits will significantly change in the next twelve months. The Fund files a U.S. federal tax return, in addition to state and local tax returns as required. The Fund's federal income tax returns are subject to examination by the Internal Revenue Service (IRS) for a period of three fiscal years after they are filed. State and local tax returns may be subject to examination for an additional fiscal year depending on the jurisdiction. Foreign taxes are provided for based on the Fund's understanding of the tax rules and rates that exist in the foreign markets in which it invests.
Distributions are declared and recorded on the ex-dividend date. Income dividends and capital gain distributions are declared separately for each class. Income and capital gain distributions are determined in accordance with income tax regulations, which may differ from GAAP.
Capital accounts within the financial statements are adjusted for permanent book-tax differences. These adjustments have no impact on net assets or the results of operations. Temporary book-tax differences will reverse in a subsequent period.
Annual Report
3. Significant Accounting Policies - continued
Income Tax Information and Distributions to Shareholders - continued
Book-tax differences are primarily due to foreign currency transactions, passive foreign investment companies (PFIC), partnerships, capital loss carryforwards and losses deferred due to wash sales.
The federal tax cost of investment securities and unrealized appreciation (depreciation) as of period end were as follows:
Gross unrealized appreciation | $ 146,329,234 |
Gross unrealized depreciation | (9,406,877) |
Net unrealized appreciation (depreciation) on securities and other investments | $ 136,922,357 |
| |
Tax Cost | $ 440,153,915 |
The tax-based components of distributable earnings as of period end were as follows:
Undistributed ordinary income | $ 6,738,514 |
Capital loss carryforward | $ (310,053,876) |
Net unrealized appreciation (depreciation) | $ 136,917,919 |
Capital loss carryforwards are only available to offset future capital gains of the Fund to the extent provided by regulations and may be limited. Under the Regulated Investment Company Modernization Act of 2010 (the Act), the Fund is permitted to carry forward capital losses incurred in taxable years beginning after December 22, 2010 for an unlimited period and such capital losses are required to be used prior to any losses that expire. The capital loss carryforward information presented below, including any applicable limitation, is estimated as of fiscal period end and is subject to adjustment.
Fiscal year of expiration | |
2017 | $ (310,053,876) |
The tax character of distributions paid was as follows:
| October 31, 2013 | October 31, 2012 |
Ordinary Income | $ 3,482,351 | $ 5,255,999 |
Short-Term Trading (Redemption) Fees. Shares held by investors in the Fund less than 90 days may have been subject to a redemption fee equal to 2.00% of the net asset value of shares redeemed. All redemption fees, which reduce the proceeds of the shareholder redemption, are retained by the Fund and accounted for as an addition to paid in capital.
Annual Report
Notes to Financial Statements - continued
3. Significant Accounting Policies - continued
Delayed Delivery Transactions and When-Issued Securities. During the period, the Fund transacted in securities on a delayed delivery or when-issued basis. Payment and delivery may take place after the customary settlement period for that security. The price of the underlying securities and the date when the securities will be delivered and paid for are fixed at the time the transaction is negotiated. The securities purchased on a delayed delivery or when-issued basis are identified as such in the Fund's Schedule of Investments. With respect to purchase commitments, the Fund identifies securities as segregated in its records with a value at least equal to the amount of the commitment. Losses may arise due to changes in the value of the underlying securities or if the counterparty does not perform under the contract's terms, or if the issuer does not issue the securities due to political, economic, or other factors.
4. Purchases and Sales of Investments.
Purchases and sales of securities, other than short-term securities, aggregated $214,172,612 and $131,095,474, respectively.
5. Fees and Other Transactions with Affiliates.
Management Fee. FMR and its affiliates provide the Fund with investment management related services for which the Fund pays a monthly management fee. The management fee is the sum of an individual fund fee rate that is based on an annual rate of .60% of the Fund's average net assets and an annualized group fee rate that averaged .25% during the period. The group fee rate is based upon the average net assets of all the mutual funds advised by FMR, including any mutual funds previously advised by FMR that are currently advised by Fidelity SelectCo, LLC, an affiliate of FMR. The group fee rate decreases as assets under management increase and increases as assets under management decrease. In addition, the management fee is subject to a performance adjustment (up to a maximum of ± .20% of the Fund's average net assets over a 36 month performance period). The upward or downward adjustment to the management fee is based on the relative investment performance of International Small Cap Opportunities as compared to an appropriate benchmark index over the same 36 month performance period. For the reporting period, the total annual management fee rate, including the performance adjustment, was 1.03% of the Fund's average net assets. The performance adjustment included in the management fee rate may be higher or lower than the maximum performance adjustment rate due to the difference between the average net assets for the reporting and performance periods.
Distribution and Service Plan Fees. In accordance with Rule 12b-1 of the 1940 Act, the Fund has adopted separate Distribution and Service Plans for each class of shares. Certain classes pay Fidelity Distributors Corporation (FDC), an affiliate of FMR,
Annual Report
5. Fees and Other Transactions with Affiliates - continued
Distribution and Service Plan Fees - continued
separate Distribution and Service Fees, each of which is based on an annual percentage of each class' average net assets. In addition, FDC may pay financial intermediaries for selling shares of the Fund and providing shareholder support services. For the period, the Distribution and Service Fee rates, total fees and amounts retained by FDC were as follows:
| Distribution
Fee | Service
Fee | Total Fees | Retained
by FDC |
Class A | -% | .25% | $ 50,175 | $ 829 |
Class T | .25% | .25% | 44,164 | 211 |
Class B | .75% | .25% | 16,241 | 12,254 |
Class C | .75% | .25% | 71,243 | 5,808 |
| | | $ 181,823 | $ 19,102 |
Sales Load. FDC may receive a front-end sales charge of up to 5.75% for selling Class A shares and 3.50% for selling Class T shares, some of which is paid to financial intermediaries for selling shares of the Fund. Depending on the holding period, FDC may receive contingent deferred sales charges levied on Class A, Class T, Class B and Class C redemptions. The deferred sales charges range from 5.00% to 1.00% for Class B shares, 1.00% for Class C shares, 1.00% for certain purchases of Class A shares and .25% for certain purchases of Class T shares.
For the period, sales charge amounts retained by FDC were as follows:
| Retained
by FDC |
Class A | $ 5,751 |
Class T | 1,958 |
Class B* | 1,016 |
Class C* | 325 |
| $ 9,050 |
* When Class B and Class C shares are initially sold, FDC pays commissions from its own resources to financial intermediaries through which the sales
are made.
Transfer Agent Fees. Fidelity Investments Institutional Operations Company, Inc., (FIIOC), an affiliate of FMR, is the transfer, dividend disbursing and shareholder servicing agent for each class of the Fund. FIIOC receives account fees and asset-based fees that vary according to the account size and type of account of the shareholders of the respective classes of the Fund. FIIOC receives no fees for providing transfer agency services to Class F. FIIOC pays for typesetting, printing and mailing of shareholder reports, except proxy statements.
Annual Report
Notes to Financial Statements - continued
5. Fees and Other Transactions with Affiliates - continued
Transfer Agent Fees - continued
For the period, transfer agent fees for each class were as follows:
| Amount | % of
Average
Net Assets |
Class A | $ 60,229 | .30 |
Class T | 27,487 | .31 |
Class B | 4,868 | .30 |
Class C | 21,409 | .30 |
International Small Cap Opportunities | 983,422 | .24 |
Institutional Class | 10,867 | .23 |
| $ 1,108,282 | |
Accounting and Security Lending Fees. Fidelity Service Company, Inc. (FSC), an affiliate of FMR, maintains the Fund's accounting records. The accounting fee is based on the level of average net assets for each month. Under a separate contract, FSC administers the security lending program. The security lending fee is based on the number and duration of lending transactions.
Brokerage Commissions. The Fund placed a portion of its portfolio transactions with brokerage firms which are affiliates of the investment adviser. Brokerage commissions are included in net realized gain (loss) and change in net unrealized appreciation (depreciation) in the Statement of Operations. The commissions paid to these affiliated firms were $887 for the period.
6. Committed Line of Credit.
The Fund participates with other funds managed by FMR or an affiliate in a $4.25 billion credit facility (the "line of credit") to be utilized for temporary or emergency purposes to fund shareholder redemptions or for other short-term liquidity purposes. The Fund has agreed to pay commitment fees on its pro-rata portion of the line of credit, which amounted to $920 and is reflected in Miscellaneous expenses on the Statement of Operations. During the period, there were no borrowings on this line of credit.
7. Security Lending.
The Fund lends portfolio securities through a lending agent from time to time in order to earn additional income. For equity securities, a lending agent is used and may loan securities to certain qualified borrowers, including Fidelity Capital Markets (FCM), a broker-dealer affiliated with the Fund. On the settlement date of the loan, the Fund receives collateral (in the form of U.S. Treasury obligations, letters of credit and/or cash) against the loaned securities and maintains collateral in an amount not less than 100% of
Annual Report
7. Security Lending - continued
the market value of the loaned securities during the period of the loan. The market value of the loaned securities is determined at the close of business of the Fund and any additional required collateral is delivered to the Fund on the next business day. If the borrower defaults on its obligation to return the securities loaned because of insolvency or other reasons, the Fund may apply collateral received from the borrower against the obligation. The Fund may experience delays and costs in recovering the securities loaned. Any cash collateral received is invested in the Fidelity Securities Lending Cash Central Fund. The value of loaned securities and cash collateral at period end are disclosed on the Fund's Statement of Assets and Liabilities. At period end, there were no security loans outstanding with FCM. Security lending income represents the income earned on investing cash collateral, less rebates paid to borrowers and any lending agent fees associated with the loan, plus any premium payments received for lending certain types of securities. Security lending income is presented in the Statement of Operations as a component of income from Fidelity Central Funds. Total security lending income during the period amounted to $158,525, including $587 from securities loaned to FCM.
8. Expense Reductions.
FMR voluntarily agreed to reimburse each class to the extent annual operating expenses exceeded certain levels of average net assets as noted in the table below. Some expenses, for example interest expense, including commitment fees, are excluded from this reimbursement.
The following classes were in reimbursement during the period:
| Expense
Limitations | Reimbursement |
Class A | 1.65% | $ 10,041 |
Class T | 1.90% | 5,407 |
Class B | 2.40% | 1,003 |
Class C | 2.40% | 3,591 |
| | $ 20,042 |
In addition, FMR reimbursed a portion of the Fund's operating expenses during the period in the amount of $9,498.
Commissions paid to certain brokers with whom FMR, or its affiliates, places trades on behalf of the Fund include an amount in addition to trade execution, which may be rebated back to the Fund to offset certain expenses. This amount totaled $39,394 for the period. In addition, through arrangements with the Fund's custodian, credits realized as a result of uninvested cash balances were used to reduce the Fund's expenses. During the period, these credits reduced the Fund's custody expenses by $25.
Annual Report
Notes to Financial Statements - continued
9. Distributions to Shareholders.
Distributions to shareholders of each class were as follows:
Years ended October 31, | 2013 | 2012 |
From net investment income | | |
Class A | $ 127,604 | $ 208,264 |
Class T | 40,329 | 69,950 |
Class B | 540 | 6,357 |
Class C | 6,860 | 20,258 |
International Small Cap Opportunities | 3,098,688 | 4,562,121 |
Institutional Class | 37,075 | 19,730 |
Total | $ 3,311,096 | $ 4,886,680 |
From net realized gain | | |
Class A | $ 8,286 | $ 18,763 |
Class T | 3,734 | 8,968 |
Class B | 900 | 2,355 |
Class C | 3,118 | 7,235 |
International Small Cap Opportunities | 153,400 | 330,589 |
Institutional Class | 1,817 | 1,409 |
Total | $ 171,255 | $ 369,319 |
10. Share Transactions.
Transactions for each class of shares were as follows:
| Shares | Dollars |
Years ended October 31, | 2013 | 2012 | 2013 | 2012 |
Class A | | | | |
Shares sold | 373,515 | 245,367 | $ 4,517,568 | $ 2,443,449 |
Reinvestment of distributions | 10,878 | 21,375 | 119,442 | 198,575 |
Shares redeemed | (460,010) | (495,775) | (5,504,745) | (4,923,741) |
Net increase (decrease) | (75,617) | (229,033) | $ (867,735) | $ (2,281,717) |
Class T | | | | |
Shares sold | 94,833 | 101,299 | $ 1,133,727 | $ 986,575 |
Reinvestment of distributions | 3,872 | 8,148 | 42,245 | 75,201 |
Shares redeemed | (152,245) | (246,162) | (1,813,542) | (2,450,796) |
Net increase (decrease) | (53,540) | (136,715) | $ (637,570) | $ (1,389,020) |
Class B | | | | |
Shares sold | 2,465 | 3,884 | $ 28,055 | $ 38,597 |
Reinvestment of distributions | 123 | 862 | 1,326 | 7,845 |
Shares redeemed | (83,897) | (59,335) | (970,172) | (579,917) |
Net increase (decrease) | (81,309) | (54,589) | $ (940,791) | $ (533,475) |
Class C | | | | |
Shares sold | 106,942 | 69,065 | $ 1,277,851 | $ 669,794 |
Reinvestment of distributions | 870 | 2,800 | 9,335 | 25,455 |
Shares redeemed | (130,535) | (170,268) | (1,517,604) | (1,664,901) |
Net increase (decrease) | (22,723) | (98,403) | $ (230,418) | $ (969,652) |
Annual Report
10. Share Transactions - continued
| Shares | Dollars |
Years ended October 31, | 2013 | 2012 | 2013 | 2012 |
International Small Cap Opportunities | | | | |
Shares sold | 13,306,080 | 5,283,408 | $ 163,920,015 | $ 53,067,911 |
Reinvestment of distributions | 279,367 | 495,697 | 3,092,593 | 4,634,765 |
Shares redeemed | (6,858,430) | (8,350,807) | (83,019,406) | (84,356,251) |
Net increase (decrease) | 6,727,017 | (2,571,702) | $ 83,993,202 | $ (26,653,575) |
Institutional Class | | | | |
Shares sold | 107,232 | 348,073 | $ 1,308,852 | $ 3,541,043 |
Reinvestment of distributions | 3,187 | 1,709 | 35,307 | 15,997 |
Shares redeemed | (121,854) | (70,045) | (1,389,261) | (705,927) |
Net increase (decrease) | (11,435) | 279,737 | $ (45,102) | $ 2,851,113 |
11. Other.
The Fund's organizational documents provide former and current trustees and officers with a limited indemnification against liabilities arising in connection with the performance of their duties to the Fund. In the normal course of business, the Fund may also enter into contracts that provide general indemnifications. The Fund's maximum exposure under these arrangements is unknown as this would be dependent on future claims that may be made against the Fund. The risk of material loss from such claims is considered remote.
Annual Report
To the Trustees of Fidelity Investment Trust and Shareholders of Fidelity International Small Cap Opportunities Fund:
We have audited the accompanying statement of assets and liabilities of Fidelity International Small Cap Opportunities Fund (the Fund), a fund of Fidelity Investment Trust, including the schedule of investments, as of October 31, 2013, and the related statement of operations for the year then ended, the statement of changes in net assets for each of the two years in the period then ended, and the financial highlights for each of the five years in the period then ended. These financial statements and financial highlights are the responsibility of the Fund's management. Our responsibility is to express an opinion on these financial statements and financial highlights based on our audits.
We conducted our audits in accordance with the standards of the Public Company Accounting Oversight Board (United States). Those standards require that we plan and perform the audit to obtain reasonable assurance about whether the financial statements and financial highlights are free of material misstatement. The Fund is not required to have, nor were we engaged to perform, an audit of its internal control over financial reporting. Our audits included consideration of internal control over financial reporting as a basis for designing audit procedures that are appropriate in the circumstances, but not for the purpose of expressing an opinion on the effectiveness of the Fund's internal control over financial reporting. Accordingly, we express no such opinion. An audit also includes examining, on a test basis, evidence supporting the amounts and disclosures in the financial statements, assessing the accounting principles used and significant estimates made by management, as well as evaluating the overall financial statement presentation. Our procedures included confirmation of securities owned as of October 31, 2013, by correspondence with the custodians and brokers; where replies were not received from brokers, we performed other auditing procedures. We believe that our audits provide a reasonable basis for our opinion.
In our opinion, the financial statements and financial highlights referred to above present fairly, in all material respects, the financial position of Fidelity International Small Cap Opportunities Fund as of October 31, 2013, the results of its operations for the year then ended, the changes in its net assets for each of the two years in the period then ended, and the financial highlights for each of the five years in the period then ended, in conformity with accounting principles generally accepted in the United States of America.
DELOITTE & TOUCHE LLP
Boston, Massachusetts
December 12, 2013
Annual Report
The Trustees, Member of the Advisory Board, and executive officers of the trust and fund, as applicable, are listed below. The Board of Trustees governs the fund and is responsible for protecting the interests of shareholders. The Trustees are experienced executives who meet periodically throughout the year to oversee the fund's activities, review contractual arrangements with companies that provide services to the fund, oversee management of the risks associated with such activities and contractual arrangements, and review the fund's performance. Except for James C. Curvey, Ned C. Lautenbach, Ronald P. O'Hanley, and William S. Stavropoulos, each of the Trustees oversees 171 funds. Mr. Curvey oversees 394 funds. Mr. Lautenbach, Mr. O'Hanley, and Mr. Stavropoulos each oversees 245 funds.
The Trustees hold office without limit in time except that (a) any Trustee may resign; (b) any Trustee may be removed by written instrument, signed by at least two-thirds of the number of Trustees prior to such removal; (c) any Trustee who requests to be retired or who has become incapacitated by illness or injury may be retired by written instrument signed by a majority of the other Trustees; and (d) any Trustee may be removed at any special meeting of shareholders by a two-thirds vote of the outstanding voting securities of the trust. Each Trustee who is not an interested person of the trust and the fund (as defined in the 1940 Act) (Independent Trustee), shall retire not later than the last day of the calendar year in which his or her 75th birthday occurs. The Independent Trustees may waive this mandatory retirement age policy with respect to individual Trustees. The executive officers and Advisory Board Member hold office without limit in time, except that any officer and Advisory Board Member may resign or may be removed by a vote of a majority of the Trustees at any regular meeting or any special meeting of the Trustees. Except as indicated, each individual has held the office shown or other offices in the same company for the past five years.
Experience, Skills, Attributes, and Qualifications of the Fund's Trustees. The Governance and Nominating Committee has adopted a statement of policy that describes the experience, qualifications, attributes, and skills that are necessary and desirable for potential Independent Trustee candidates (Statement of Policy). The Board believes that each Trustee satisfied at the time he or she was initially elected or appointed a Trustee, and continues to satisfy, the standards contemplated by the Statement of Policy. The Governance and Nominating Committee also engages professional search firms to help identify potential Independent Trustee candidates who have the experience, qualifications, attributes, and skills consistent with the Statement of Policy. From time to time, additional criteria based on the composition and skills of the current Independent Trustees, as well as experience or skills that may be appropriate in light of future changes to board composition, business conditions, and regulatory or other developments, have also been considered by the professional search firms and the Governance and Nominating Committee. In addition, the Board takes into account the Trustees' commitment and participation in Board and committee meetings, as well as their leadership of standing and ad hoc committees throughout their tenure.
Annual Report
In determining that a particular Trustee was and continues to be qualified to serve as a Trustee, the Board has considered a variety of criteria, none of which, in isolation, was controlling. The Board believes that, collectively, the Trustees have balanced and diverse experience, qualifications, attributes, and skills, which allow the Board to operate effectively in governing the fund and protecting the interests of shareholders. Information about the specific experience, skills, attributes, and qualifications of each Trustee, which in each case led to the Board's conclusion that the Trustee should serve (or continue to serve) as a trustee of the fund, is provided below.
Board Structure and Oversight Function. James C. Curvey is an interested person (as defined in the 1940 Act) and currently serves as Chairman. The Trustees have determined that an interested Chairman is appropriate and benefits shareholders because an interested Chairman has a personal and professional stake in the quality and continuity of services provided to the fund. Independent Trustees exercise their informed business judgment to appoint an individual of their choosing to serve as Chairman, regardless of whether the Trustee happens to be independent or a member of management. The Independent Trustees have determined that they can act independently and effectively without having an Independent Trustee serve as Chairman and that a key structural component for assuring that they are in a position to do so is for the Independent Trustees to constitute a substantial majority for the Board. The Independent Trustees also regularly meet in executive session. Ned C. Lautenbach serves as Chairman of the Independent Trustees and as such (i) acts as a liaison between the Independent Trustees and management with respect to matters important to the Independent Trustees and (ii) with management prepares agendas for Board meetings.
Fidelity funds are overseen by different Boards of Trustees. The fund's Board oversees Fidelity's equity and high income funds and another Board oversees Fidelity's investment-grade bond, money market, and asset allocation funds. The asset allocation funds may invest in Fidelity funds overseen by the fund's Board. The use of separate Boards, each with its own committee structure, allows the Trustees of each group of Fidelity funds to focus on the unique issues of the funds they oversee, including common research, investment, and operational issues. On occasion, the separate Boards establish joint committees to address issues of overlapping consequences for the Fidelity funds overseen by each Board.
The Trustees operate using a system of committees to facilitate the timely and efficient consideration of all matters of importance to the Trustees, the fund, and fund shareholders and to facilitate compliance with legal and regulatory requirements and oversight of the fund's activities and associated risks. The Board, acting through its committees, has charged FMR and its affiliates with (i) identifying events or circumstances the occurrence of which could have demonstrably adverse effects on the fund's business and/or reputation; (ii) implementing processes and controls to lessen the possibility that such events or circumstances occur or to mitigate the effects of such events or circumstances if they do occur; and (iii) creating and maintaining a system designed to evaluate continuously business and market conditions in order to facilitate the identification and implementation processes described in (i) and (ii) above. Because the day-to-day operations and activities of the fund are carried out by or through FMR, its affiliates and other service providers, the fund's exposure to risks is mitigated but not eliminated by the processes overseen by the Trustees. While each of the Board's committees has responsibility for overseeing different aspects of the fund's activities, oversight is exercised primarily through the Operations, Audit, and Compliance Committees. In addition, the Independent Trustees have worked with FMR to enhance the Board's oversight of investment and financial risks, legal and regulatory risks, technology risks, and operational risks, including the development of additional risk reporting to the Board. For example, a working group comprised of Independent Trustees and FMR has worked and continues to work to review the Fidelity funds' valuation-related activities, reporting and risk management. Appropriate personnel, including but not limited to the fund's Chief Compliance Officer (CCO), FMR's internal auditor, the independent accountants, the fund's Treasurer and portfolio management personnel, make periodic reports to the Board's committees, as appropriate, including an annual review of FMR's risk management program for the Fidelity funds. The responsibilities of each standing committee, including their oversight responsibilities, are described further under "Standing Committees of the Fund's Trustees."
Annual Report
Trustees and Officers - continued
The fund's Statement of Additional Information (SAI) includes more information about the Trustees. To request a free copy, call Fidelity at 1-877-208-0098.
Interested Trustees*:
Correspondence intended for each Trustee who is an interested person may be sent to Fidelity Investments, 245 Summer Street, Boston, Massachusetts 02210.
Name, Year of Birth; Principal Occupations and Other Relevant Experience+ |
James C. Curvey (1935) |
Year of Election or Appointment: 2007 Trustee Chairman of the Board of Trustees |
| Mr. Curvey also serves as Trustee of other Fidelity funds. Mr. Curvey is a Director of Fidelity Investments Money Management, Inc. (2009-present), Director of Fidelity Research & Analysis Co. (2009-present) and Director of FMR and FMR Co., Inc. (2007-present). Mr. Curvey is also Vice Chairman (2007-present) and Director of FMR LLC. In addition, Mr. Curvey serves as an Overseer for the Boston Symphony Orchestra and a member of the Trustees of Villanova University. Previously, Mr. Curvey was the Vice Chairman (2006-2007) and Director (2000-2007) of FMR Corp. |
Ronald P. O'Hanley (1957) |
Year of Election or Appointment: 2011 Trustee |
| Mr. O'Hanley also serves as Trustee of other Fidelity funds. He is Director of Fidelity SelectCo, LLC (2013-present), FMR Co., Inc. (2010-present), Director of Fidelity Investments Money Management, Inc. (2010-present), Director of Fidelity Research & Analysis Company (2010-present), President of Fidelity Asset Management and Corporate Services and a Member of Fidelity's Executive Committee (2010-present). Previously, Mr. O'Hanley served as President and Chief Executive Officer of BNY Mellon Asset Management (2007-2010). Mr. O'Hanley also served as Vice Chairman of Bank New York Mellon Corp. and a member of that firm's Executive Committee. Prior to the 2007 merger of The Bank of New York and Mellon Financial Corporation, he was Vice Chairman of Mellon Financial Corporation and President and Chief Executive Officer of Mellon Asset Management. He joined Mellon in February 1997. Mr. O'Hanley currently serves as Chairman of the Boston Public Library Foundation Board of Directors and sits on the Board of Directors of Beth Israel Deaconess Medical Center, the Board of Trustees of the Marine Biological Laboratory and the Advisory Board of the Maxwell School of Citizenship and Public Administration at Syracuse University. Mr. O'Hanley also chairs the Council on Asset Management for the Financial Services Roundtable and is a member of the Board of Directors of Institutional Investor's U.S. Institute. |
* Trustees have been determined to be "Interested Trustees" by virtue of, among other things, their affiliation with the trust or various entities under common control with FMR.
+ The information above includes each Trustee's principal occupation during the last five years and other information relating to the experience, attributes, and skills relevant to each Trustee's qualifications to serve as a Trustee, which led to the conclusion that each Trustee should serve as a Trustee for the fund.
Annual Report
Trustees and Officers - continued
Independent Trustees:
Correspondence intended for each Independent Trustee (that is, the Trustees other than the Interested Trustees) may be sent to Fidelity Investments, P.O. Box 55235, Boston, Massachusetts 02205-5235.
Name, Year of Birth; Principal Occupations and Other Relevant Experience+ |
Dennis J. Dirks (1948) |
Year of Election or Appointment: 2005 Trustee |
| Mr. Dirks also serves as Trustee of other Fidelity funds. Prior to his retirement in May 2003, Mr. Dirks was Chief Operating Officer and a member of the Board of The Depository Trust & Clearing Corporation (DTCC). He also served as President, Chief Operating Officer, and Board member of The Depository Trust Company (DTC) and President and Board member of the National Securities Clearing Corporation (NSCC). In addition, Mr. Dirks served as Chief Executive Officer and Board member of the Government Securities Clearing Corporation, Chief Executive Officer and Board member of the Mortgage-Backed Securities Clearing Corporation, as a Trustee and a member of the Finance Committee of Manhattan College (2005-2008), and as a Trustee and a member of the Finance Committee of AHRC of Nassau County (2006-2008). Mr. Dirks is a member of the Independent Directors Council (IDC) Governing Council (2010-present) and Board of Directors for The Brookville Center for Children's Services, Inc. (2009-present). |
Alan J. Lacy (1953) |
Year of Election or Appointment: 2008 Trustee |
| Mr. Lacy also serves as Trustee of other Fidelity funds. Mr. Lacy serves as Senior Adviser (2007-present) of Oak Hill Capital Partners, L.P. (private equity). Mr. Lacy also served as Chief Executive Officer (2000-2005) and Vice Chairman (2005-2006) of Sears Holdings Corporation and Sears, Roebuck and Co. (retail). In addition, Mr. Lacy serves as a member of the Board of Directors of Dave & Buster's Entertainment, Inc. (restaurant and entertainment complexes, 2010-present), Earth Fare, Inc. (retail grocery, 2012-present), The Hillman Companies, Inc. (hardware wholesalers, 2010-present), and Bristol-Myers Squibb Company (global pharmaceuticals, 2008-present). Mr. Lacy is a member of the Board of Trustees of The National Parks Conservation Association (2006-present). Previously, Mr. Lacy served as Chairman of the Board of Trustees of the National Parks Conservation Association (2008-2011) and as a member of the Board of Directors for the Western Union Company (global money transfer, 2006-2011). |
Ned C. Lautenbach (1944) |
Year of Election or Appointment: 2000 Trustee Chairman of the Independent Trustees |
| Mr. Lautenbach also serves as Trustee of other Fidelity funds. Mr. Lautenbach currently serves as the Lead Director of the Eaton Corporation Board of Directors (diversified industrial, 1997-present). Mr. Lautenbach is Chairman of the Board of Directors of the Philharmonic Center for the Arts in Naples, Florida (2012-present) and a member of the Council on Foreign Relations (1994-present). Previously, Mr. Lautenbach was a Partner/Advisory Partner at Clayton, Dubilier & Rice, LLC (private equity investment, 1998-2010), as well as a Director of Sony Corporation (2006-2007). |
Joseph Mauriello (1944) |
Year of Election or Appointment: 2008 Trustee |
| Mr. Mauriello also serves as Trustee of other Fidelity funds. Prior to his retirement in January 2006, Mr. Mauriello served in numerous senior management positions including Deputy Chairman and Chief Operating Officer (2004-2005), and Vice Chairman of Financial Services (2002-2004) of KPMG LLP US (professional services, 1965-2005). Mr. Mauriello currently serves as a member of the Board of Directors of XL Group plc. (global insurance and re-insurance, 2006-present). Previously, Mr. Mauriello served as a Director of the Hamilton Funds of the Bank of New York (2006-2007) and of Arcadia Resources Inc. (health care services and products, 2007-2012). |
Robert W. Selander (1950) |
Year of Election or Appointment: 2011 Trustee |
| Mr. Selander also serves as Trustee of other Fidelity funds. Previously, Mr. Selander served as a Member of the Advisory Board of other Fidelity funds (2011), and Executive Vice Chairman (2010), Chief Executive Officer (2009-2010), and President and Chief Executive Officer (1997-2009) of Mastercard, Inc. |
Cornelia M. Small (1944) |
Year of Election or Appointment: 2005 Trustee |
| Ms. Small also serves as Trustee of other Fidelity funds. Ms. Small is a member of the Board of Directors (2009-present) and Chair of the Investment Committee (2010-present) of the Teagle Foundation. Ms. Small also serves on the Investment Committee of the Berkshire Taconic Community Foundation (2008-present). Previously, Ms. Small served as Chairperson (2002-2008) and a member of the Investment Committee and Chairperson (2008-2012) and a member of the Board of Trustees of Smith College. In addition, Ms. Small served as Chief Investment Officer, Director of Global Equity Investments, and a member of the Board of Directors of Scudder, Stevens & Clark and Scudder Kemper Investments. |
William S. Stavropoulos (1939) |
Year of Election or Appointment: 2001 Trustee Vice Chairman of the Independent Trustees |
| Mr. Stavropoulos also serves as Trustee of other Fidelity funds. Mr. Stavropoulos serves as President and Founder of the Michigan Baseball Foundation, the Great Lakes Loons (2007-present). Mr. Stavropoulos is Chairman Emeritus of the Board of Directors of The Dow Chemical Company, where he previously served in numerous senior management positions, including President, CEO (1995-2000; 2002-2004), Chairman of the Executive Committee (2000-2006), and as a member of the Board of Directors (1990-2006). Currently, Mr. Stavropoulos is Chairman of the Board of Directors of Univar Inc. (global distributor of commodity and specialty chemicals), a Director of Teradata Corporation (data warehousing and technology solutions), and Maersk Inc. (industrial conglomerate), and a member of the Advisory Board for Metalmark Capital LLC (private equity investment, 2005-present). Mr. Stavropoulos is an operating advisor to Clayton, Dubilier & Rice, LLC (private equity investment). In addition, Mr. Stavropoulos is a member of the University of Notre Dame Advisory Council for the College of Science, a Trustee of the Rollin L. Gerstacker Foundation, and a Director of the Naples Philharmonic Center for the Arts. Previously, Mr. Stavropoulos served as a Director of Chemical Financial Corporation (bank holding company, 1993-2012) and Tyco International, Ltd. (multinational manufacturing and services, 2007-2012). |
David M. Thomas (1949) |
Year of Election or Appointment: 2008 Trustee |
| Mr. Thomas also serves as Trustee of other Fidelity funds. Mr. Thomas serves as Non-Executive Chairman of the Board of Directors of Fortune Brands Home and Security (home and security products, 2011-present), and as a member of the Board of Directors of Interpublic Group of Companies, Inc. (marketing communication, 2004-present). Previously, Mr. Thomas served as Executive Chairman (2005-2006) and Chairman and Chief Executive Officer (2000-2005) of IMS Health, Inc. (pharmaceutical and healthcare information solutions), and a Director of Fortune Brands, Inc. (consumer products, 2000-2011). |
+ The information above includes each Trustee's principal occupation during the last five years and other information relating to the experience, attributes, and skills relevant to each Trustee's qualifications to serve as a Trustee, which led to the conclusion that each Trustee should serve as a Trustee for the fund.
Advisory Board Member and Executive Officers:
Correspondence intended for each executive officer and Peter S. Lynch may be sent to Fidelity Investments, 245 Summer Street, Boston, Massachusetts 02210. Executive officers appear below in alphabetical order.
Name, Year of Birth; Principal Occupation |
Peter S. Lynch (1944) |
Year of Election or Appointment: 2003 Member of the Advisory Board |
| Mr. Lynch also serves as Member of the Advisory Board of other Fidelity funds. Mr. Lynch is Vice Chairman and a Director of FMR and FMR Co., Inc. In addition, Mr. Lynch serves as a Trustee of Boston College and as the Chairman of the Inner-City Scholarship Fund. Previously, Mr. Lynch served on the Special Olympics International Board of Directors (1997-2006). |
Elizabeth Paige Baumann (1968) |
Year of Election or Appointment: 2012 Anti-Money Laundering (AML) Officer |
| Ms. Baumann also serves as AML Officer of other funds. She is Chief AML Officer of FMR LLC (2012-present) and is an employee of Fidelity Investments. Previously, Ms. Baumann served as Vice President and Deputy Anti-Money Laundering Officer (2007-2012). |
William C. Coffey (1969) |
Year of Election or Appointment: 2009 Assistant Secretary |
| Mr. Coffey also serves as Assistant Secretary of other funds. He is Senior Vice President and Deputy General Counsel of FMR LLC (2010-present), and is an employee of Fidelity Investments. Previously, Mr. Coffey served as Vice President and Associate General Counsel of FMR LLC (2005-2009). |
Jonathan Davis (1968) |
Year of Election or Appointment: 2010 Assistant Treasurer |
| Mr. Davis also serves as Assistant Treasurer of other funds. Mr. Davis is an employee of Fidelity Investments. Previously, Mr. Davis served as Vice President and Associate General Counsel of FMR LLC (2003-2010). |
Adrien E. Deberghes (1967) |
Year of Election or Appointment: 2008 Deputy Treasurer |
| Mr. Deberghes also serves as an officer of other funds. He is an employee of Fidelity Investments (2008-present). Prior to joining Fidelity Investments, Mr. Deberghes was Senior Vice President of Mutual Fund Administration at State Street Corporation (2007-2008), Senior Director of Mutual Fund Administration at Investors Bank & Trust (2005-2007), and Director of Finance for Dunkin' Brands (2000-2005). |
Stephanie J. Dorsey (1969) |
Year of Election or Appointment: 2010 Assistant Treasurer |
| Ms. Dorsey also serves as an officer of other funds. She is an employee of Fidelity Investments (2008-present) and has served in other fund officer roles. Prior to joining Fidelity Investments, Ms. Dorsey served as Treasurer (2004-2008) of the JPMorgan Mutual Funds and Vice President (2004-2008) of JPMorgan Chase Bank. |
Scott C. Goebel (1968) |
Year of Election or Appointment: 2008 Secretary and Chief Legal Officer (CLO) |
| Mr. Goebel serves as Secretary and CLO of other funds. Mr. Goebel also serves as Secretary of Fidelity Investments Money Management, Inc. (FIMM) (2010-present) and Fidelity Research and Analysis Company (FRAC) (2010-present); General Counsel, Secretary, and Senior Vice President of FMR (2008-present) and FMR Co., Inc. (2008-present); Chief Legal Officer of Fidelity Management & Research (Hong Kong) Limited (2008-present) and Assistant Secretary of Fidelity Management & Research (Japan) Inc. (2008-present), and Fidelity Management & Research (U.K.) Inc. (2008-present). Previously, Mr. Goebel served as Secretary and CLO of other Fidelity funds (2008-2013), Assistant Secretary of FIMM (2008-2010), FRAC (2008-2010), and certain funds (2007-2008); and as Vice President and Secretary of Fidelity Distributors Corporation (FDC) (2005-2007). Mr. Goebel has been employed by FMR LLC or an affiliate since 2001. |
Joseph A. Hanlon (1968) |
Year of Election or Appointment: 2012 Chief Compliance Officer |
| Mr. Hanlon also serves as Chief Compliance Officer of other funds. Mr. Hanlon serves as Compliance Officer of FMR, FMR Co., Inc., Fidelity Investments Money Management, Inc. (FIMM), Fidelity Research and Analysis Company (FRAC), and Fidelity Management & Research (Hong Kong) (2009-present), as Senior Vice President of the Fidelity Asset Management Division (2009-present), and is an employee of Fidelity Investments. Previously, Mr. Hanlon served as Compliance Officer of Fidelity Management & Research (Japan) Inc. (2009-2013), Strategic Advisers, Inc. (2009-2013), and Fidelity Management & Research (U.K.) Inc. (2009-2013). |
Bruce T. Herring (1965) |
Year of Election or Appointment: 2006 Vice President of certain Equity Funds |
| Mr. Herring also serves as Vice President of other funds. He serves as Chief Investment Officer of Fidelity Global Asset Allocation (GAA) (2013-present), Chief Investment Officer and Director of Fidelity Management & Research (U.K.) Inc. (2010-present), Group Chief Investment Officer of FMR, and President of Fidelity Research & Analysis Company (2010-present). Previously, Mr. Herring served as Vice President (2005-2006) and Senior Vice President (2006-2007) of Fidelity Management & Research Company, Vice President of FMR Co., Inc. (2001-2007), and as a portfolio manager for Fidelity U.S. Equity Funds. |
Brian B. Hogan (1964) |
Year of Election or Appointment: 2009 Vice President |
| Mr. Hogan also serves as Vice President of other funds. Mr. Hogan serves as President of FMR's Equity Division (2009-present). Previously, Mr. Hogan served as Senior Vice President, Equity Research of FMR (2006-2009) and as a portfolio manager. |
Chris Maher (1972) |
Year of Election or Appointment: 2013 Assistant Treasurer |
| Mr. Maher serves as Assistant Treasurer of other funds. Mr. Maher is Vice President of Valuation Oversight and is an employee of Fidelity Investments. Previously, Mr. Maher served as Vice President of Asset Management Compliance (2013), Vice President of FMR's Program Management Group (2010-2013), and Vice President of Valuation Oversight (2008-2010). |
Christine Reynolds (1958) |
Year of Election or Appointment: 2008 Chief Financial Officer |
| Ms. Reynolds also serves as Chief Financial Officer of other funds. Ms. Reynolds became President of Fidelity Pricing and Cash Management Services (FPCMS) in August 2008. Ms. Reynolds served as Chief Operating Officer of FPCMS (2007-2008). Previously, Ms. Reynolds served as President, Treasurer, and Anti-Money Laundering officer of the Fidelity funds (2004-2007). |
Kenneth B. Robins (1969) |
Year of Election or Appointment: 2008 President and Treasurer |
| Mr. Robins also serves as an officer of other funds. Mr. Robins serves as Executive Vice President of Fidelity Investments Money Management, Inc. (FIMM) (2013-present) and is an employee of Fidelity Investments (2004-present). Previously, Mr. Robins served in other fund officer roles. |
Gary W. Ryan (1958) |
Year of Election or Appointment: 2005 Assistant Treasurer |
| Mr. Ryan also serves as Assistant Treasurer of other funds. Mr. Ryan is an employee of Fidelity Investments and has served in other fund officer roles. Previously, Mr. Ryan served as Vice President of Fund Reporting in Fidelity Pricing and Cash Management Services (FPCMS) (1999-2005). |
Stephen Sadoski (1971) |
Year of Election or Appointment: 2012 Deputy Treasurer |
| Mr. Sadoski also serves as Deputy Treasurer of other funds. He is an employee of Fidelity Investments (2012-present) and has served in another fund officer role. Prior to joining Fidelity Investments, Mr. Sadoski served as an assistant chief accountant in the Division of Investment Management of the Securities and Exchange Commission (SEC) (2009-2012) and as a senior manager at Deloitte & Touche LLP (1997-2009). |
Stacie M. Smith (1974) |
Year of Election or Appointment: 2013 Deputy Treasurer |
| Ms. Smith also serves as an officer of other funds. She is an employee of Fidelity Investments (2009-present) and has served in other fund officer roles. Prior to joining Fidelity Investments, Ms. Smith served as Senior Audit Manager of Ernst & Young LLP (1996-2009). |
Renee Stagnone (1975) |
Year of Election or Appointment: 2013 Deputy Treasurer |
| Ms. Stagnone also serves as Deputy Treasurer of other funds. Ms. Stagnone is an employee of Fidelity Investments. |
Joseph F. Zambello (1957) |
Year of Election or Appointment: 2011 Deputy Treasurer |
| Mr. Zambello also serves as Deputy Treasurer of other funds. Mr. Zambello is an employee of Fidelity Investments. Previously, Mr. Zambello served as Vice President of FMR's Program Management Group (2009-2011) and Vice President of the Transfer Agent Oversight Group (2005-2009). |
Annual Report
The Board of Trustees of Advisor International Small Cap Opportunities Fund voted to pay to shareholders of record at the opening of business on record date, the following distributions per share derived from capital gains realized from sales of portfolio securities, and dividends derived from net investment income:
| Pay Date | Record Date | Dividends | Capital Gains |
Class A | 12/09/13 | 12/06/13 | $0.055 | $0.079 |
Class T | 12/09/13 | 12/06/13 | $0.024 | $0.079 |
Class B | 12/09/13 | 12/06/13 | $0.000 | $0.000 |
Class C | 12/09/13 | 12/06/13 | $0.000 | $0.054 |
Class A designates 13%, Class T designates 17%, Class B designates 58% and Class C designates 42% of the dividends distributed in December 2012 during the fiscal year as qualifying for the dividends-received deduction for corporate shareholders.
Class A, Class T, Class B and Class C designates 100% of the dividends distributed in December 2012 during the fiscal year as amounts which may be taken into account as a dividend for purposes of the maximum rate under section 1(h) (11) of the Internal Revenue Code.
The amounts per share which represent income derived from sources within, and taxes paid to, foreign countries or possessions of the United States are as follows:
| Pay Date | Income | Taxes |
Class A | 12/10/2012 | 0.096 | 0.0136 |
Class T | 12/10/2012 | 0.073 | 0.0136 |
Class B | 12/10/2012 | 0.022 | 0.0136 |
Class C | 12/10/2012 | 0.030 | 0.0136 |
The fund will notify shareholders in January 2014 of amounts for use in preparing 2013 income tax returns.
Annual Report
Board Approval of Investment Advisory Contracts and Management Fees
Fidelity International Small Cap Opportunities Fund
Each year, the Board of Trustees, including the Independent Trustees (together, the Board), votes on the renewal of the management contract and sub-advisory agreements (together, the Advisory Contracts) for the fund. The Board, assisted by the advice of fund counsel and Independent Trustees' counsel, requests and considers a broad range of information relevant to the renewal of the Advisory Contracts throughout the year.
The Board meets regularly and, at each of its meetings, covers an extensive agenda of topics and materials and considers factors that are relevant to its annual consideration of the renewal of the fund's Advisory Contracts, including the services and support provided to the fund and its shareholders. The Board has established various standing committees, each composed of and chaired by Independent Trustees with varying backgrounds, to which the Board has assigned specific subject matter responsibilities in order to enhance effective decision-making by the Board. The Board, acting directly and through its Committees, requests and receives information concerning the annual consideration of the renewal of the fund's Advisory Contracts. The Board also meets as needed to consider matters specifically related to the Board's annual consideration of the renewal of Advisory Contracts. Members of the Board may also meet with trustees of other Fidelity funds through ad hoc joint committees to discuss certain matters relevant to the Fidelity funds.
At its July 2013 meeting, the Board, including the Independent Trustees, unanimously determined to renew the fund's Advisory Contracts. In reaching its determination, the Board considered all factors it believed relevant, including (i) the nature, extent, and quality of the services to be provided to the fund and its shareholders (including the investment performance of the fund); (ii) the competitiveness of the fund's management fee and total expense ratio relative to peer funds; (iii) the total costs of the services to be provided by and the profits to be realized by Fidelity from its relationship with the fund; (iv) the extent to which economies of scale exist and would be realized as the fund grows; and (v) whether fee levels reflect these economies of scale, if any, for the benefit of fund shareholders.
In considering whether to renew the Advisory Contracts for the fund, the Board reached a determination, with the assistance of fund counsel and Independent Trustees' counsel and through the exercise of its business judgment, that the renewal of the Advisory Contracts was in the best interests of the fund and its shareholders and that the compensation payable under the Advisory Contracts was fair and reasonable. The Board's decision to renew the Advisory Contracts was not based on any single factor, but rather was based on a comprehensive consideration of all the information provided to the Board at its meetings throughout the year. The Board, in reaching its determination to renew the Advisory Contracts, was aware that shareholders in the fund have a broad range of investment choices available to them, including a wide choice among mutual funds offered by Fidelity's competitors, and that the fund's shareholders, who have the opportunity to review and weigh the disclosure provided by the fund in its prospectus and other public disclosures, have chosen to invest in this fund, which is a part of the Fidelity family of funds.
Annual Report
Board Approval of Investment Advisory Contracts and
Management Fees - continued
Nature, Extent, and Quality of Services Provided. The Board considered the staffing within the investment adviser, Fidelity Management & Research Company (FMR), and the sub-advisers (together, the Investment Advisers) as it relates to the fund, including the backgrounds of the fund's investment personnel, and also considered the fund's investment objective, strategies, and related investment philosophy. The Independent Trustees also had discussions with senior management of Fidelity's investment operations and investment groups. The Board considered the structure of the portfolio manager compensation program and whether this structure provides appropriate incentives to act in the best interests of the fund.
Resources Dedicated to Investment Management and Support Services. The Board and the Fund Oversight and Research Committees reviewed the general qualifications and capabilities of the Investment Advisers' investment staff, including its size, education, experience, and resources, as well as the Investment Advisers' approach to recruiting, training, managing, and compensating investment personnel. The Board noted that FMR has continued to increase the resources devoted to non-U.S. offices, including expansion of Fidelity's global investment organization. The Board also noted that Fidelity's analysts have extensive resources, tools and capabilities that allow them to conduct sophisticated quantitative and fundamental analysis, as well as credit analysis of issuers, counterparties and guarantors. Further, the Board believes that Fidelity's investment professionals have sufficient access to global information and data so as to provide competitive investment results over time, and that those professionals also have access to sophisticated tools that permit them to assess portfolio construction and risk and performance attribution characteristics continuously, as well as to transmit new information and research conclusions rapidly around the world. Additionally, in its deliberations, the Board considered the Investment Advisers' trading and risk management capabilities and resources, which are an integral part of the investment management process.
Shareholder and Administrative Services. The Board considered (i) the nature, extent, quality, and cost of advisory, administrative, and shareholder services performed by the Investment Advisers and their affiliates under the Advisory Contracts and under separate agreements covering transfer agency, pricing and bookkeeping, and securities lending services for the fund; (ii) the nature and extent of the supervision of third party service providers, principally custodians and subcustodians; and (iii) the resources devoted to, and the record of compliance with, the fund's compliance policies and procedures. The Board also reviewed the allocation of fund brokerage, including allocations to brokers affiliated with the Investment Advisers, the use of brokerage commissions to pay fund expenses, and the use of "soft" commission dollars to pay for research services.
Annual Report
The Board noted that the growth of fund assets over time across the complex allows Fidelity to reinvest in the development of services designed to enhance the value or convenience of the Fidelity funds as investment vehicles. These services include 24-hour access to account information and market information through telephone representatives and over the Internet, investor education materials and asset allocation tools, and the expanded availability of Fidelity Investor Centers.
Investment in a Large Fund Family. The Board considered the benefits to shareholders of investing in a Fidelity fund, including the benefits of investing in a fund that is part of a large family of funds offering a variety of investment disciplines and providing a large variety of mutual fund investor services. The Board noted that Fidelity had taken, or had made recommendations that resulted in the Fidelity funds taking, a number of actions over the previous year that benefited particular funds, including (i) continuing to dedicate additional resources to investment research and to the support of the senior management team that oversees asset management; (ii) persisting in efforts to enhance Fidelity's global research capabilities; (iii) launching new funds and making other enhancements to meet client needs for global and income-oriented solutions; (iv) continuing to launch dedicated lower cost underlying funds to meet portfolio construction needs related to expanding underlying fund options for Fidelity funds of funds, specifically for the Freedom Fund product lines; (v) rationalizing product lines and gaining increased efficiencies through the mergers of several funds into other funds; (vi) strengthening Fidelity's index fund offerings by reducing investment minimums and adopting or lowering existing expense caps for certain funds and classes; (vii) enhancing Global Asset Allocation product offerings by launching new funds and strategies, including "open architecture" target date funds that utilize affiliated and unaffiliated sub-advisers; (viii) modifying the eligibility criteria for Institutional Class shares of Advisor funds to increase their marketability to a portion of the defined contribution plan market; (ix) creating a new low-cost retirement share class for certain Advisor funds to appeal to large retirement plans; (x) transitioning the management of certain Fidelity commodity funds to Geode Capital Management LLC, a registered commodity pool operator, while retaining administrative responsibilities for the funds; (xi) reorganizing a number of funds; and (xii) taking steps toward establishing a new Fidelity adviser to manage sector-based funds and products.
Investment Performance. The Board considered whether the fund has operated in accordance with its investment objective, as well as its record of compliance with its investment restrictions and its performance history.
The Board took into account discussions with the Investment Advisers about fund investment performance that occur at Board meetings throughout the year. In this regard the Board noted that as part of regularly scheduled fund reviews and other reports to the Board on fund performance, the Board periodically considers annualized return information for the fund, for different time periods, measured against a securities market index ("benchmark index") and a peer group of mutual funds with similar objectives ("peer group"). In its evaluation of fund investment performance, the Board gave particular attention to information indicating changes in performance of certain Fidelity funds for specific time periods and the Investment Advisers' explanations for any overperformance or underperformance.
Annual Report
Board Approval of Investment Advisory Contracts and
Management Fees - continued
In addition to reviewing absolute and relative fund performance, the Independent Trustees periodically consider the appropriateness of fund performance metrics in evaluating the results achieved. In general, the Independent Trustees believe that fund performance should be evaluated based on net performance (after fees and expenses) of both the highest performing and lowest performing classes, where applicable, compared to appropriate benchmark indices, over appropriate time periods which may include full market cycles, and compared to peer groups, as applicable, over the same periods, taking into account relevant factors including the following: general market conditions; issuer-specific information; tactical opportunities for investment; and fund cash flows and other factors.
The Independent Trustees recognize that shareholders evaluate performance on a net basis over their own holding periods, for which one-, three-, and five-year periods are used as a proxy. For this reason, the performance information reviewed by the Board also included net cumulative calendar year total return information for the fund and an appropriate benchmark index and peer group for the most recent one-, three-, and five-year periods, as shown below. Returns are shown compared to the 25th percentile (top of box) and 75th percentile (bottom of box) of the peer universe. Returns of the benchmark index are "net MA," i.e., adjusted for tax withholding rates applicable to U.S.-based mutual funds organized as Massachusetts business trusts.
Annual Report
Fidelity International Small Cap Opportunities Fund
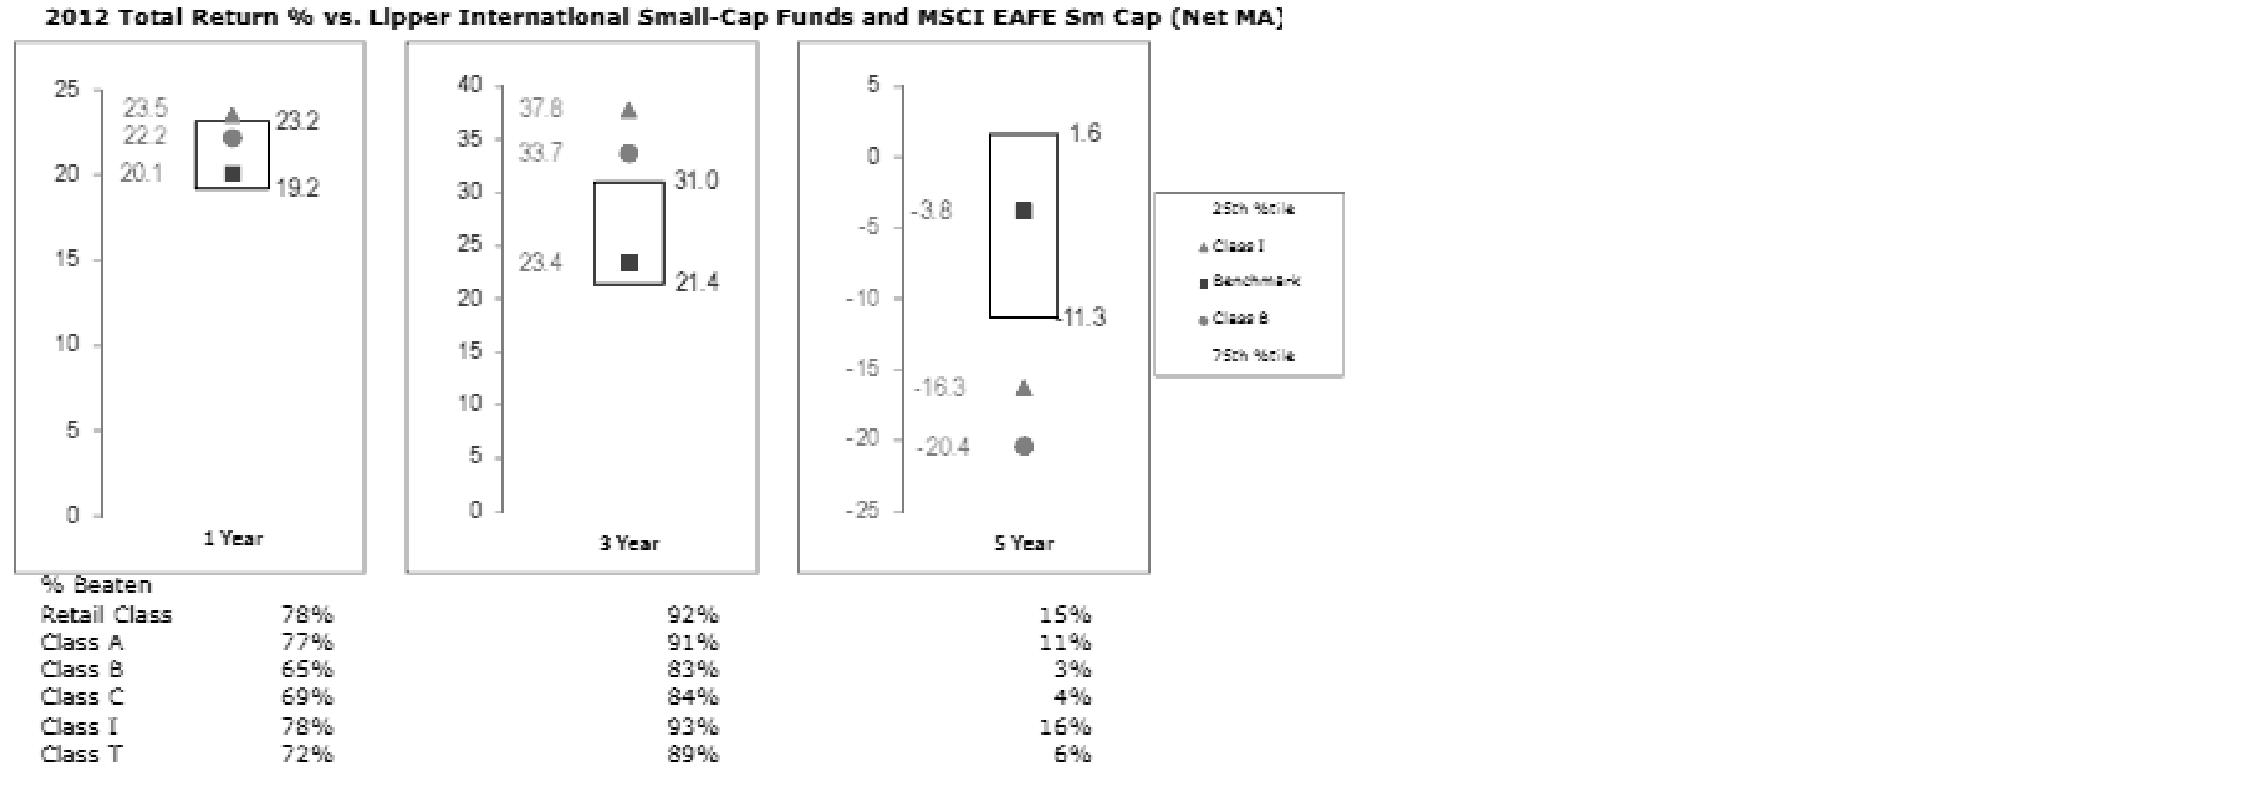
The Board also considered that the fund's management fee is subject to upward or downward adjustment depending upon whether, and to what extent, the fund's investment performance for the performance period exceeds, or is exceeded by, a securities index, thus leading to a performance adjustment for the same period. The Board noted that the performance adjustment provides FMR with a strong economic incentive to seek to achieve superior performance for the fund's shareholders and helps to more closely align the interests of FMR and the fund's shareholders.
Based on its review, the Board concluded that the nature, extent, and quality of services provided to the fund under the Advisory Contracts should benefit the fund's shareholders.
Competitiveness of Management Fee and Total Expense Ratio. The Board considered the fund's management fee and total expense ratio compared to "mapped groups" of competitive funds and classes. Fidelity creates "mapped groups" by combining similar Lipper investment objective categories that have comparable management fee characteristics. Combining Lipper investment objective categories aids the Board's management fee and total expense ratio comparisons by broadening the competitive group used for comparison and by reducing the number of universes to which various Fidelity funds are compared.
Management Fee. The Board considered two proprietary management fee comparisons for the 12-month periods shown in the chart below. The group of Lipper funds used by the Board for management fee comparisons is referred to below as the "Total Mapped Group." The Total Mapped Group is broader than the Lipper peer group used by the Board for performance comparisons because the Total Mapped Group combines several Lipper investment objective categories while the Lipper peer group does not. The Total Mapped Group comparison focuses on a fund's standing in terms of gross management fees before expense reimbursements or caps, and without giving effect to the fund's performance adjustment, relative to the total universe of funds with comparable investment mandates, regardless of whether their management fee structures also are comparable. Funds with comparable investment mandates offer exposure to similar types of securities. Funds with comparable management fee structures have similar management fee contractual arrangements (e.g., flat rate charged for advisory services, all-inclusive fee rate, etc.). "TMG %" represents the percentage of funds in the Total Mapped Group that had management fees that were lower than the fund's. For example, a TMG % of 19% means that 81% of the funds in the Total Mapped Group had higher management fees than the fund. The "Asset-Size Peer Group" (ASPG) comparison focuses on a fund's standing relative to a subset of non-Fidelity funds within the Total Mapped Group that are similar in size and management fee structure. The ASPG represents at least 15% of the funds in the Total Mapped Group with comparable asset size and management fee structures, subject to a minimum of 50 funds (or all funds in the Total Mapped Group if fewer than 50). Additional information, such as the ASPG quartile in which the fund's management fee ranked and the impact of the fund's performance adjustment, is also included in the chart and considered by the Board.
Annual Report
Board Approval of Investment Advisory Contracts and
Management Fees - continued
Fidelity International Small Cap Opportunities Fund

The Board noted that the fund's management fee ranked below the median of its Total Mapped Group and below the median of its ASPG for 2012. The Board also noted the effect of the fund's positive performance adjustment on the fund's management fee ranking.
Annual Report
Based on its review, the Board concluded that the fund's management fee is fair and reasonable in light of the services that the fund receives and the other factors considered.
Total Expense Ratio. In its review of each class's total expense ratio, the Board considered the fund's management fee as well as other fund or class expenses, as applicable, such as transfer agent fees, pricing and bookkeeping fees, fund-paid 12b-1 fees, and custodial, legal, and audit fees. The Board also noted the effects of any waivers and reimbursements on fees and expenses, as well as the impact of the fund's performance adjustment. As part of its review, the Board also considered the current and historical total expense ratios of each class of the fund compared to competitive fund median expenses. Each class of the fund is compared to those funds and classes in the Total Mapped Group (used by the Board for management fee comparisons) that have a similar sales load structure.
The Board noted that the total expense ratio of each of Class A and the retail class ranked below its competitive median for 2012 and the total expense ratio of each of Class T, Class B, Class C, and Institutional Class ranked above its competitive median for 2012. The Board considered that, in general, various factors can affect total expense ratios. The Board noted that the total expense ratio of Class T was above the competitive median primarily because of higher 12b-1 fees on Class T. Class T has a higher 12b-1 fee, but a lower front-end sales charge, than traditionally priced front-end sales charge classes. The Board considered that Class T is primarily sold load-waived in the retirement plan market where its 0.50% 12b-1 fee is comparable to competing no-load, higher 12b-1 fee classes designed specifically for retirement plans. The Board noted that the fund offers multiple classes, each of which has a different sales load and 12b-1 fee structure, and that the multiple structures are intended to offer a range of pricing options for the intermediary market. The Board also noted that the total expense ratios of the classes vary primarily by the level of their 12b-1 fees, although differences in transfer agent fees may also cause expenses to vary from class to class.
Fees Charged to Other Fidelity Clients. The Board also considered Fidelity fee structures and other information with respect to clients of FMR and its affiliates, such as other mutual funds advised or subadvised by FMR or its affiliates, pension plan clients, and other institutional clients. The Board noted the findings of the 2013 ad hoc joint committee (created with the board of other Fidelity funds), which reviewed and compared Fidelity's institutional investment advisory business with its business of providing services to the Fidelity funds, including the differences in services provided, fees charged, and costs incurred, as well as competition in their respective marketplaces.
Annual Report
Board Approval of Investment Advisory Contracts and
Management Fees - continued
Based on its review of total expense ratios and fees charged to other Fidelity clients, the Board concluded that the total expense ratio of each class of the fund was reasonable, although in some cases above the median of the universe presented for comparison, in light of the services that the fund and its shareholders receive and the other factors considered.
Costs of the Services and Profitability. The Board considered the revenues earned and the expenses incurred by Fidelity in conducting the business of developing, marketing, distributing, managing, administering and servicing the fund and servicing the fund's shareholders. The Board also considered the level of Fidelity's profits in respect of all the Fidelity funds.
On an annual basis, FMR presents to the Board Fidelity's profitability for the fund. Fidelity calculates the profitability for each fund, as well as aggregate profitability for groups of Fidelity funds and all Fidelity funds, using a series of detailed revenue and cost allocation methodologies which originate with the books and records of Fidelity on which Fidelity's audited financial statements are based. The Audit Committee of the Board reviews any significant changes from the prior year's methodologies.
PricewaterhouseCoopers LLP (PwC), independent registered public accounting firm and auditor to Fidelity and certain Fidelity funds, has been engaged annually by the Board as part of the Board's assessment of Fidelity's profitability analysis. PwC's engagement includes the review and assessment of the methodologies used by Fidelity in determining the revenues and expenses attributable to Fidelity's mutual fund business, and completion of agreed-upon procedures surrounding the mathematical accuracy of fund profitability and its conformity to allocation methodologies. After considering PwC's reports issued under the engagement and information provided by Fidelity, the Board concluded that while other allocation methods may also be reasonable, Fidelity's profitability methodologies are reasonable in all material respects.
The Board also reviewed Fidelity's non-fund businesses and fall-out benefits related to the mutual fund business as well as cases where Fidelity's affiliates may benefit from or be related to the fund's business.
The Board considered the costs of the services provided by and the profits realized by Fidelity in connection with the operation of the fund and was satisfied that the profitability was not excessive in the circumstances.
Economies of Scale. The Board considered whether there have been economies of scale in respect of the management of the Fidelity funds, whether the Fidelity funds (including the fund) have appropriately benefited from any such economies of scale, and whether there is potential for realization of any further economies of scale. The Board considered the extent to which the fund will benefit from economies of scale through increased services to the fund, through waivers or reimbursements, or through fee or expense reductions. The Board also noted that in 2009, it and the board of other Fidelity funds created an ad hoc committee (the Economies of Scale Committee) to analyze whether FMR attains economies of scale in respect of the management and servicing of the Fidelity funds, whether the Fidelity funds have appropriately benefited from such economies of scale, and whether there is potential for realization of any further economies of scale.
Annual Report
The Board recognized that the fund's management contract incorporates a "group fee" structure, which provides for lower group fee rates as total fund assets under FMR's management increase, and for higher group fee rates as total fund assets under FMR's management decrease. FMR calculates the group fee rates based on a tiered asset "breakpoint" schedule that varies based on asset class. The Board considered that the group fee is designed to deliver the benefits of economies of scale to fund shareholders when total Fidelity fund assets increase, even if assets of any particular fund are unchanged or have declined, because some portion of Fidelity's costs are attributable to services provided to all Fidelity funds, and all funds benefit if those costs can be allocated among more assets. The Board concluded that, given the group fee structure, fund shareholders will benefit from lower management fees as assets under FMR's management increase at the fund complex level, regardless of whether Fidelity achieves any such economies of scale.
The Board concluded, taking into account the analysis of the Economies of Scale Committee, that economies of scale, if any, are being appropriately shared between fund shareholders and Fidelity.
Amendment to Description of Group Fee Rate. At its July 2013 meeting, the Board voted to approve an amendment to the fund's management contract to modify the description of the "group fee rate" effective August 1, 2013. The Board noted that under the prior description in the contract, the group fee rate was based on the average net assets of all registered investment companies with which FMR has management contracts. Under the contract's tiered asset breakpoint schedule, the group fee rate is lower as total fund assets under FMR's management increase, and higher as total fund assets under FMR's management decrease. The Board considered that the prior description would have excluded the assets of 64 Fidelity sector funds from the group fee rate calculation once Fidelity SelectCo, LLC, an affiliate of FMR, assumed management responsibilities for those funds. The Board noted that modifying the description of the group fee rate to continue to include the assets of those 64 funds for purposes of determining group fee rate breakpoints would avoid an immediate adverse impact on the group fee rate for any fund.
Additional Information Requested by the Board. In order to develop fully the factual basis for consideration of the Fidelity funds' Advisory Contracts, the Board requested and received additional information on certain topics, including: (i) fund performance trends and Fidelity's long-term strategies for certain funds; (ii) the potential to further rationalize the Fidelity fund lineup with the possibility of achieving savings for the funds and Fidelity; (iii) the methodology with respect to competitive fund data and peer group classifications; (iv) the arrangements with, and performance of, certain sub-advisers on behalf of the Fidelity funds, as well as certain proposed participating affiliate arrangements; (v) the realization of fall-out benefits in certain Fidelity business units; (vi) Fidelity's group fee structures, including the rationale for the individual fee rates of certain categories of funds and the definition of group assets; (vii) trends regarding industry use of performance fee structures and the performance adjustment methodologies applicable to the Fidelity funds; (viii) additional competitive analysis regarding the total expenses for certain classes; and (ix) fund profitability methodology, including Fidelity's cost allocation methodology, and the impact of certain factors on fund profitability results.
Annual Report
Board Approval of Investment Advisory Contracts and
Management Fees - continued
Based on its evaluation of all of the conclusions noted above, and after considering all factors it believed relevant, the Board ultimately concluded that the advisory fee structures are fair and reasonable, and that the fund's Advisory Contracts should be renewed.
Annual Report
Investment Adviser
Fidelity Management & Research Company
Boston, MA
Investment Sub-Advisers
FMR Co., Inc.
Fidelity Management & Research
(Hong Kong) Limited
Fidelity Management & Research
(Japan) Inc.
Fidelity Management & Research
(U.K.) Inc.
FIL Investment Advisors
FIL Investments (Japan) Limited
FIL Investment Advisors (U.K.) Limited
General Distributor
Fidelity Distributors Corporation
Smithfield, RI
Transfer and Service Agents
Fidelity Investments Institutional
Operations Company, Inc.
Boston, MA
Fidelity Service Company, Inc.
Boston, MA
Custodian
The Northern Trust Company
Chicago, IL
(Fidelity Investment logo)(registered trademark)
AILS-UANN-1213
1.815089.108
(Fidelity Investment logo)(registered trademark)
Fidelity Advisor®
International Small Cap Opportunities
Fund - Institutional Class
Annual Report
October 31, 2013
(Fidelity Cover Art)
Institutional Class
is a class of Fidelity®
International Small Cap
Opportunities Fund
Contents
Performance | (Click Here) | How the fund has done over time. |
Management's Discussion of Fund Performance | (Click Here) | The Portfolio Manager's review of fund performance and strategy. |
Shareholder Expense Example | (Click Here) | An example of shareholder expenses. |
Investment Changes | (Click Here) | A summary of major shifts in the fund's investments over the past six months. |
Investments | (Click Here) | A complete list of the fund's investments with their market values. |
Financial Statements | (Click Here) | Statements of assets and liabilities, operations, and changes in net assets, as well as financial highlights. |
Notes | (Click Here) | Notes to the financial statements. |
Report of Independent Registered Public Accounting Firm | (Click Here) | |
Trustees and Officers | (Click Here) | |
Distributions | (Click Here) | |
Board Approval of Investment Advisory Contracts and Management Fees | (Click Here) | |
To view a fund's proxy voting guidelines and proxy voting record for the 12-month period ended June 30, visit http://www.fidelity.com/proxyvotingresults or visit the Securities and Exchange Commission's (SEC) web site at http://www.sec.gov. You may also call 1-877-208-0098 to request a free copy of the proxy voting guidelines.
Standard & Poor's, S&P and S&P 500 are registered service marks of The McGraw-Hill Companies, Inc. and have been licensed for use by Fidelity Distributors Corporation.
Other third-party marks appearing herein are the property of their respective owners.
All other marks appearing herein are registered or unregistered trademarks or service marks of FMR LLC or an affiliated company. © 2013 FMR LLC. All rights reserved.
Annual Report
This report and the financial statements contained herein are submitted for the general information of the shareholders of the fund. This report is not authorized for distribution to prospective investors in the fund unless preceded or accompanied by an effective prospectus.
A fund files its complete schedule of portfolio holdings with the SEC for the first and third quarters of each fiscal year on Form N-Q. Forms N-Q are available on the SEC's web site at http://www.sec.gov. A fund's Forms N-Q may be reviewed and copied at the SEC's Public Reference Room in Washington, DC. Information regarding the operation of the SEC's Public Reference Room may be obtained by calling 1-800-SEC-0330. For a complete list of a fund's portfolio holdings, view the most recent holdings listing, semiannual report, or annual report on Fidelity's web site at http://www.fidelity.com, http://www.advisor.fidelity.com, or http://www.401k.com, as applicable.
NOT FDIC INSURED • MAY LOSE VALUE • NO BANK GUARANTEE
Neither the fund nor Fidelity Distributors Corporation is a bank.
Annual Report
Average annual total return reflects the change in the value of an investment, assuming reinvestment of the class' distributions from dividend income and capital gains (the profits earned upon the sale of securities that have grown in value, if any) and assuming a constant rate of performance each year. The $10,000 table and the fund's returns do not reflect the deduction of taxes that a shareholder would pay on fund distributions or the redemption of fund shares. During periods of reimbursement by Fidelity, a fund's total return will be greater than it would be had the reimbursement not occurred. How a fund did yesterday is no guarantee of how it will do tomorrow.
Average Annual Total Returns
Periods ended October 31, 2013 | Past 1
year | Past 5
years | Life of
fund A |
Institutional Class | 28.11% | 18.63% | 6.35% |
A From August 2, 2005.
$10,000 Over Life of Fund
Let's say hypothetically that $10,000 was invested in Fidelity Advisor® International Small Cap Opportunities Fund - Institutional Class on August 2, 2005, when the fund started. The chart shows how the value of your investment would have changed, and also shows how the MSCI® EAFE® Small Cap Index performed over the same period.
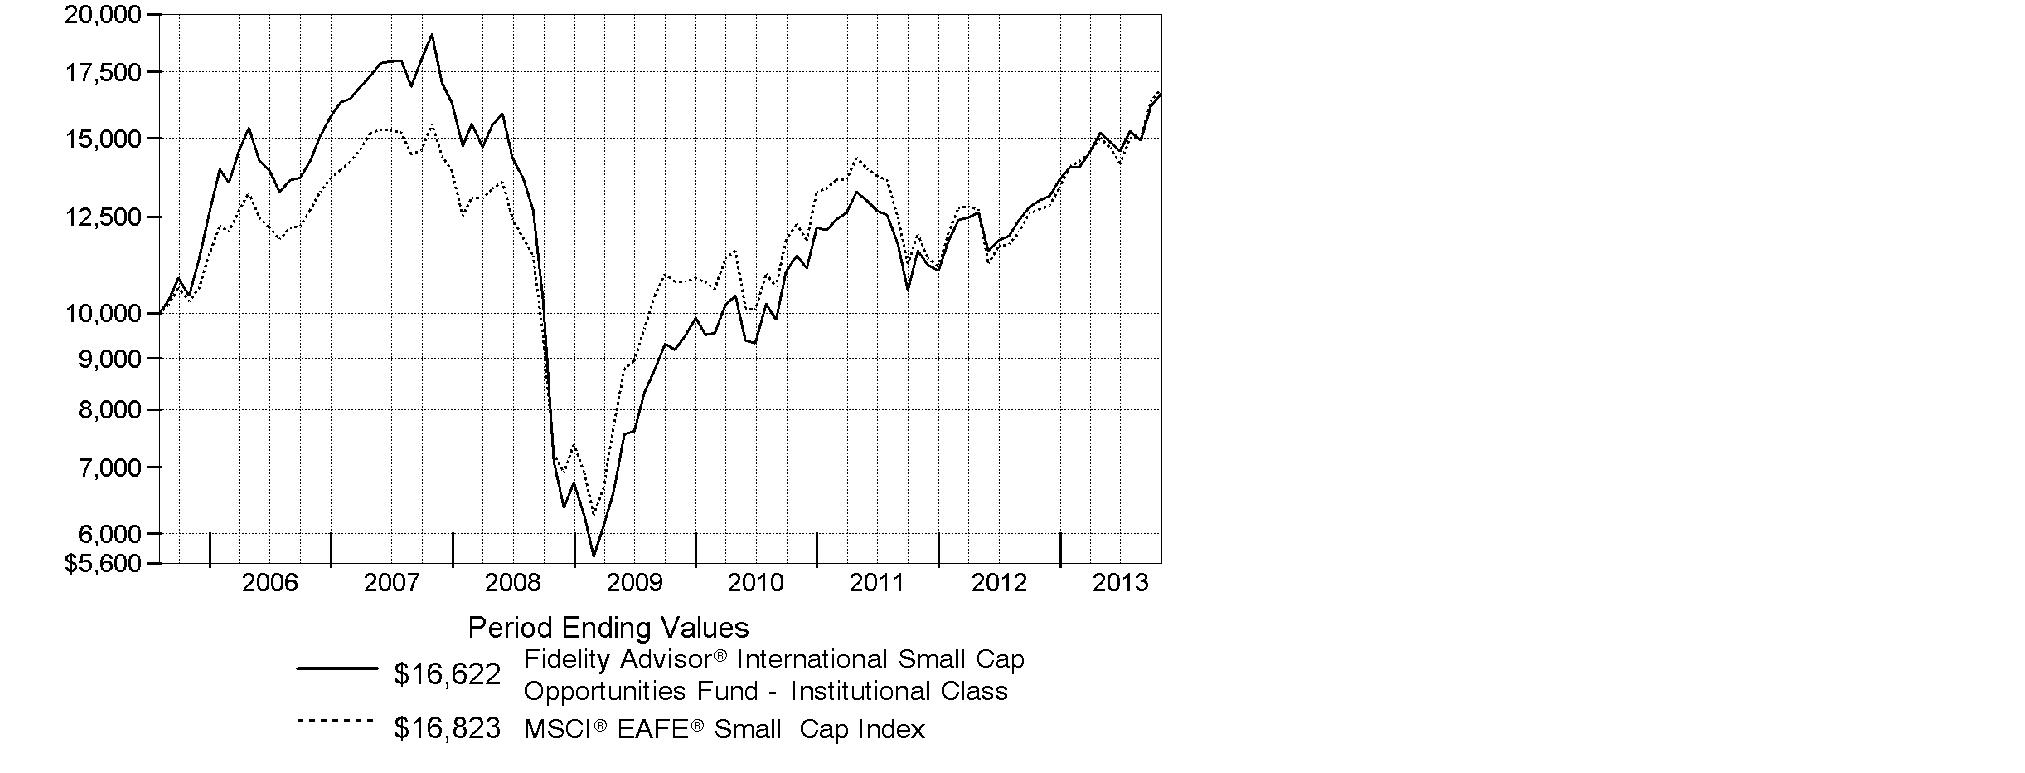
Annual Report
Market Recap: On balance, global equity markets remained upbeat for the 12-month period ending October 31, 2013. The MSCI® ACWI® (All Country World Index) Index gained 23.75% for the period, amid investor preference for higher-risk assets. The period was not without turbulence, however. In the spring and summer, central banks worldwide, especially in the U.S. and China, made clear their intentions to maintain accommodative monetary policies. That stance, combined with modest cyclical improvements around the globe and generally low valuations, underpinned the broad rally in equities. Europe (+32%) shone brightly, with most markets in the region - large and small - registering solid, index-beating gains. Another bright spot was Japan, which, despite a struggling yen and taking a second-half breather, posted a 34% result for the full year. The U.S. - by far the index's biggest constituent - also outperformed the global market with a roughly 28% advance. Meanwhile, Asia-Pacific ex Japan (+14%) lagged, hurt in part by a slowdown in Australia's mining industry as well as currency headwinds. Foreign-exchange and commodity weakness also curbed results in resource-heavy Canada and emerging markets (EM), both of which were up 7%. Country-level EM performance diverged meaningfully for the period, as evidenced by performance in Brazil (-1%), Russia (+12%), India (+1%) and China (+8%).
Comments from Jed Weiss, Portfolio Manager of Fidelity Advisor® International Small Cap Opportunities Fund: For the year, the fund's Institutional Class shares gained 28.11%, trailing the 32.33% increase in the MSCI® EAFE® Small Cap Index. Europe was a detractor, as poor stock picking in the region weighed on the fund's result. The fund also had a moderate cash position, which hurt performance in an up market. Further, stock picking in Canada was a negative, with out-of-index mining-related companies Eldorado Gold, Copper Mountain Mining and Agnico Eagle Mines hurting results. I ultimately sold all three stocks, none of which were in the benchmark. Emerging markets, especially South African drug store chain Clicks Group, posed an additional challenge. On the positive side, the fund was significantly helped by a large underweighting in the Asia-Pacific ex Japan region, especially Australia, which included a large number of poor-performing mining companies that I chose to avoid. The fund's out-of-benchmark U.S. holdings also helped. The vast majority of these investments were in companies that do all or most of their business abroad but that happen to be domiciled stateside. Of final note, stock picking in Japan proved very helpful in relative terms, with investment bank Nihon M&A Center producing an outsized contribution.
The views expressed above reflect those of the portfolio manager(s) only through the end of the period as stated on the cover of this report and do not necessarily represent the views of Fidelity or any other person in the Fidelity organization. Any such views are subject to change at any time based upon market or other conditions and Fidelity disclaims any responsibility to update such views. These views may not be relied on as investment advice and, because investment decisions for a Fidelity fund are based on numerous factors, may not be relied on as an indication of trading intent on behalf of any Fidelity fund.
Annual Report
Shareholder Expense Example
As a shareholder of the Fund, you incur two types of costs: (1) transaction costs, including sales charges (loads) on purchase payments or redemption proceeds, redemption fees and (2) ongoing costs, including management fees, distribution and/or service (12b-1) fees and other Fund expenses. This Example is intended to help you understand your ongoing costs (in dollars) of investing in the Fund and to compare these costs with the ongoing costs of investing in other mutual funds.
The Example is based on an investment of $1,000 invested at the beginning of the period and held for the entire period (May 1, 2013 to October 31, 2013).
Actual Expenses
The first line of the accompanying table for each class of the Fund provides information about actual account values and actual expenses. You may use the information in this line, together with the amount you invested, to estimate the expenses that you paid over the period. Simply divide your account value by $1,000.00 (for example, an $8,600 account value divided by $1,000.00 = 8.6), then multiply the result by the number in the first line for a class of the Fund under the heading entitled "Expenses Paid During Period" to estimate the expenses you paid on your account during this period. A small balance maintenance fee of $12.00 that is charged once a year may apply for certain accounts with a value of less than $2,000. This fee is not included in the table below. If it was, the estimate of expenses you paid during the period would be higher, and your ending account value lower, by this amount. In addition, the Fund, as a shareholder in the underlying Fidelity Central Funds, will indirectly bear its pro-rata share of the fees and expenses incurred by the underlying Fidelity Central Funds. These fees and expenses are not included in the Fund's annualized expense ratio used to calculate the expense estimate in the table below.
Hypothetical Example for Comparison Purposes
The second line of the accompanying table for each class of the Fund provides information about hypothetical account values and hypothetical expenses based on a Class' actual expense ratio and an assumed rate of return of 5% per year before expenses, which is not the Class' actual return. The hypothetical account values and expenses may not be used to estimate the actual ending account balance or expenses you paid for the period. You may use this information to compare the ongoing costs of investing in the Fund and other funds. To do so, compare this 5% hypothetical example with the 5% hypothetical examples that appear in the shareholder reports of the other funds. A small balance maintenance fee of $12.00 that is charged once a year may apply for certain accounts with a value of less than $2,000. This fee is not included in the table below. If it was, the estimate of expenses you paid during the period would be higher, and your ending account value lower, by this amount. In addition, the Fund, as a shareholder in the underlying Fidelity Central Funds, will indirectly bear its pro-rata share of the fees and expenses incurred by the underlying Fidelity Central Funds. These fees and expenses are not included in the Fund's annualized expense ratio used to calculate the expense estimate in the table below.
Please note that the expenses shown in the table are meant to highlight your ongoing costs only and do not reflect any transaction costs. Therefore, the second line of the table is useful in comparing ongoing costs only, and will not help you determine the relative total costs of owning different funds. In addition, if these transactional costs were included, your costs would have been higher.
Annual Report
| Annualized
Expense Ratio B | Beginning
Account Value
May 1, 2013 | Ending
Account Value
October 31, 2013 | Expenses Paid
During Period*
May 1, 2013
to October 31, 2013 |
Class A | 1.65% | | | |
Actual | | $ 1,000.00 | $ 1,093.50 | $ 8.71 |
Hypothetical A | | $ 1,000.00 | $ 1,016.89 | $ 8.39 |
Class T | 1.90% | | | |
Actual | | $ 1,000.00 | $ 1,091.80 | $ 10.02 |
Hypothetical A | | $ 1,000.00 | $ 1,015.63 | $ 9.65 |
Class B | 2.40% | | | |
Actual | | $ 1,000.00 | $ 1,089.20 | $ 12.64 |
Hypothetical A | | $ 1,000.00 | $ 1,013.11 | $ 12.18 |
Class C | 2.40% | | | |
Actual | | $ 1,000.00 | $ 1,089.40 | $ 12.64 |
Hypothetical A | | $ 1,000.00 | $ 1,013.11 | $ 12.18 |
International Small Cap Opportunities | 1.39% | | | |
Actual | | $ 1,000.00 | $ 1,095.10 | $ 7.34 |
Hypothetical A | | $ 1,000.00 | $ 1,018.20 | $ 7.07 |
Institutional Class | 1.36% | | | |
Actual | | $ 1,000.00 | $ 1,095.00 | $ 7.18 |
Hypothetical A | | $ 1,000.00 | $ 1,018.35 | $ 6.92 |
A 5% return per year before expenses
B Annualized expense ratio reflects expenses net of applicable fee waivers.
* Expenses are equal to each Class' annualized expense ratio, multiplied by the average account value over the period, multiplied by 184/365 (to reflect the one-half year period).
Annual Report
Investment Changes (Unaudited)
Geographic Diversification (% of fund's net assets) |
As of October 31, 2013 |
 | Japan 26.1% | |
 | United Kingdom 19.3% | |
 | United States of America* 14.6% | |
 | Germany 5.1% | |
 | Italy 3.5% | |
 | Netherlands 3.5% | |
 | France 2.4% | |
 | Sweden 2.1% | |
 | Ireland 2.0% | |
 | Other 21.4% | |

Percentages are based on country or territory of incorporation and are adjusted for the effect of futures contracts, if applicable. |
* Includes Short-Term Investments and Net Other Assets (Liabilities). |
As of April 30, 2013 |
| Japan 24.9% | |
| United Kingdom 17.9% | |
| United States of America* 16.9% | |
| Germany 4.0% | |
| Turkey 3.7% | |
| Netherlands 3.0% | |
| Italy 2.6% | |
| France 2.6% | |
| Sweden 2.4% | |
| Other 22.0% | |

Percentages are based on country or territory of incorporation and are adjusted for the effect of futures contracts, if applicable. |
* Includes Short-Term Investments and Net Other Assets (Liabilities). |
Asset Allocation as of October 31, 2013 |
| % of fund's
net assets | % of fund's net assets
6 months ago |
Stocks | 97.6 | 95.6 |
Short-Term Investments and Net Other Assets (Liabilities) | 2.4 | 4.4 |
Top Ten Stocks as of October 31, 2013 |
| % of fund's
net assets | % of fund's net assets
6 months ago |
USS Co. Ltd. (Japan, Specialty Retail) | 2.3 | 2.1 |
PriceSmart, Inc. (United States of America, Food & Staples Retailing) | 1.9 | 2.0 |
Aalberts Industries NV (Netherlands, Machinery) | 1.6 | 1.1 |
Spirax-Sarco Engineering PLC (United Kingdom, Machinery) | 1.5 | 1.4 |
CTS Eventim AG (Germany, Media) | 1.4 | 1.2 |
Interpump Group SpA (Italy, Machinery) | 1.4 | 1.1 |
Azimut Holding SpA (Italy, Capital Markets) | 1.4 | 1.0 |
Intrum Justitia AB (Sweden, Commercial Services & Supplies) | 1.4 | 1.4 |
Unite Group PLC (United Kingdom, Real Estate Management & Development) | 1.3 | 1.2 |
Spectris PLC (United Kingdom, Electronic Equipment & Components) | 1.3 | 1.0 |
| 15.5 | |
Market Sectors as of October 31, 2013 |
| % of fund's
net assets | % of fund's net assets
6 months ago |
Industrials | 24.1 | 23.7 |
Consumer Discretionary | 18.5 | 19.3 |
Financials | 18.5 | 16.7 |
Consumer Staples | 10.4 | 10.6 |
Materials | 9.8 | 9.4 |
Information Technology | 7.0 | 7.2 |
Health Care | 6.0 | 5.2 |
Energy | 3.3 | 3.5 |
Annual Report
Investments October 31, 2013
Showing Percentage of Net Assets
Common Stocks - 96.8% |
| Shares | | Value |
Australia - 1.6% |
Imdex Ltd. | 1,328,443 | | $ 904,016 |
Ramsay Health Care Ltd. | 79,365 | | 2,910,459 |
RCG Corp. Ltd. | 2,789,963 | | 1,951,331 |
Sydney Airport unit | 790,959 | | 3,132,339 |
TOTAL AUSTRALIA | | 8,898,145 |
Austria - 1.7% |
Andritz AG | 104,700 | | 6,449,637 |
Zumtobel AG | 164,181 | | 2,934,699 |
TOTAL AUSTRIA | | 9,384,336 |
Bailiwick of Jersey - 1.2% |
Informa PLC | 779,140 | | 6,989,683 |
Belgium - 1.9% |
Gimv NV | 71,688 | | 3,630,573 |
KBC Ancora (a) | 137,238 | | 4,470,174 |
Umicore SA | 56,570 | | 2,698,646 |
TOTAL BELGIUM | | 10,799,393 |
Bermuda - 0.4% |
Lazard Ltd. Class A | 58,699 | | 2,268,716 |
Brazil - 0.2% |
Arezzo Industria e Comercio SA | 84,300 | | 1,260,624 |
British Virgin Islands - 0.3% |
Gem Diamonds Ltd. (a) | 636,898 | | 1,628,818 |
Canada - 1.6% |
Pason Systems, Inc. | 243,700 | | 5,064,959 |
ShawCor Ltd. Class A | 62,500 | | 2,627,320 |
TAG Oil Ltd. (a)(e) | 289,400 | | 1,176,863 |
TOTAL CANADA | | 8,869,142 |
Denmark - 1.4% |
Jyske Bank A/S (Reg.) (a) | 66,327 | | 3,744,232 |
Spar Nord Bank A/S (a) | 457,069 | | 4,077,073 |
TOTAL DENMARK | | 7,821,305 |
Finland - 1.5% |
Nokian Tyres PLC | 92,000 | | 4,655,508 |
Tikkurila Oyj | 148,220 | | 3,841,781 |
TOTAL FINLAND | | 8,497,289 |
Common Stocks - continued |
| Shares | | Value |
France - 2.4% |
Laurent-Perrier Group SA | 27,463 | | $ 2,565,780 |
Remy Cointreau SA | 30,773 | | 3,036,719 |
Saft Groupe SA | 89,475 | | 2,840,312 |
Vetoquinol SA | 55,184 | | 2,196,833 |
Virbac SA | 15,500 | | 3,117,835 |
TOTAL FRANCE | | 13,757,479 |
Germany - 4.5% |
alstria office REIT-AG | 200,000 | | 2,535,734 |
Bilfinger Berger AG | 49,266 | | 5,469,670 |
CompuGROUP Holding AG (d) | 178,878 | | 4,661,920 |
CTS Eventim AG | 167,545 | | 8,178,058 |
Fielmann AG | 39,837 | | 4,456,908 |
TOTAL GERMANY | | 25,302,290 |
Greece - 0.7% |
Titan Cement Co. SA (Reg.) (a) | 138,880 | | 3,790,143 |
India - 0.6% |
Jyothy Laboratories Ltd. (a) | 1,106,018 | | 3,325,736 |
Ireland - 2.0% |
FBD Holdings PLC | 219,528 | | 4,739,220 |
James Hardie Industries PLC: | | | |
CDI | 151,916 | | 1,569,367 |
sponsored ADR | 100,715 | | 5,245,237 |
TOTAL IRELAND | | 11,553,824 |
Israel - 1.2% |
Azrieli Group | 96,005 | | 3,087,406 |
Ituran Location & Control Ltd. | 97,286 | | 1,780,334 |
Strauss Group Ltd. | 96,744 | | 1,708,675 |
TOTAL ISRAEL | | 6,576,415 |
Italy - 3.5% |
Azimut Holding SpA | 308,873 | | 7,846,456 |
Beni Stabili SpA SIIQ | 5,953,083 | | 4,089,896 |
Interpump Group SpA | 711,143 | | 7,917,546 |
TOTAL ITALY | | 19,853,898 |
Japan - 26.1% |
Air Water, Inc. | 101,000 | | 1,443,722 |
Anicom Holdings, Inc. (a)(d) | 56,400 | | 668,360 |
Aozora Bank Ltd. | 1,875,000 | | 5,450,690 |
Common Stocks - continued |
| Shares | | Value |
Japan - continued |
ARNEST ONE Corp. (d) | 90,000 | | $ 2,467,609 |
Artnature, Inc. | 74,200 | | 1,583,730 |
Asahi Co. Ltd. | 148,100 | | 2,510,464 |
Autobacs Seven Co. Ltd. | 275,800 | | 4,021,296 |
Azbil Corp. | 174,800 | | 4,211,741 |
Coca-Cola Central Japan Co. Ltd. | 139,000 | | 2,461,779 |
Cosmos Pharmaceutical Corp. | 29,100 | | 3,545,271 |
Daikokutenbussan Co. Ltd. | 168,700 | | 5,062,340 |
FCC Co. Ltd. | 267,800 | | 6,117,869 |
GCA Savvian Group Corp. | 155,600 | | 1,715,286 |
Glory Ltd. | 74,200 | | 1,839,930 |
Goldcrest Co. Ltd. | 244,630 | | 6,544,798 |
Hajime Construction Co. Ltd. | 16,300 | | 1,123,909 |
Harmonic Drive Systems, Inc. | 121,400 | | 2,613,511 |
Iwatsuka Confectionary Co. Ltd. | 48,400 | | 2,496,259 |
Kamigumi Co. Ltd. | 217,000 | | 1,887,545 |
Kobayashi Pharmaceutical Co. Ltd. | 59,900 | | 3,353,863 |
Kyoto Kimono Yuzen Co. Ltd. | 83,300 | | 875,376 |
Lasertec Corp. (a) | 199,800 | | 2,064,120 |
Meiko Network Japan Co. Ltd. | 112,600 | | 1,299,874 |
Miraial Co. Ltd. | 69,800 | | 1,132,218 |
Nabtesco Corp. | 124,900 | | 3,048,499 |
Nagaileben Co. Ltd. | 205,900 | | 3,397,806 |
Nihon M&A Center, Inc. | 82,700 | | 6,378,286 |
Nihon Parkerizing Co. Ltd. | 267,000 | | 5,215,861 |
Nippon Seiki Co. Ltd. | 218,000 | | 3,554,253 |
Nippon Thompson Co. Ltd. | 47,000 | | 255,804 |
NS Tool Co. Ltd. | 17,800 | | 303,184 |
Obic Co. Ltd. | 144,900 | | 4,550,248 |
OSG Corp. | 394,200 | | 6,376,834 |
San-Ai Oil Co. Ltd. | 32,000 | | 138,202 |
Seven Bank Ltd. | 1,860,000 | | 6,583,016 |
SHO-BOND Holdings Co. Ltd. | 134,400 | | 6,293,595 |
Shoei Co. Ltd. | 233,800 | | 2,196,588 |
Software Service, Inc. | 43,100 | | 1,620,489 |
Techno Medica Co. Ltd. | 65,900 | | 1,435,105 |
The Nippon Synthetic Chemical Industry Co. Ltd. | 472,000 | | 4,550,686 |
Tocalo Co. Ltd. | 112,400 | | 1,840,264 |
Tsutsumi Jewelry Co. Ltd. | 81,000 | | 1,973,613 |
USS Co. Ltd. | 868,600 | | 12,720,209 |
Common Stocks - continued |
| Shares | | Value |
Japan - continued |
Workman Co. Ltd. | 43,400 | | $ 1,700,821 |
Yamato Kogyo Co. Ltd. | 182,500 | | 6,764,217 |
TOTAL JAPAN | | 147,389,140 |
Korea (South) - 1.0% |
Coway Co. Ltd. | 95,705 | | 5,464,835 |
Mexico - 0.4% |
Consorcio ARA S.A.B. de CV (a) | 5,696,218 | | 2,226,577 |
Netherlands - 3.5% |
Aalberts Industries NV | 291,901 | | 8,735,082 |
ASM International NV (depositary receipt) | 75,900 | | 2,506,218 |
Heijmans NV (Certificaten Van Aandelen) | 319,533 | | 4,251,256 |
VastNed Retail NV | 90,134 | | 4,167,632 |
TOTAL NETHERLANDS | | 19,660,188 |
Philippines - 0.4% |
Jollibee Food Corp. | 566,420 | | 2,325,186 |
Portugal - 0.4% |
Jeronimo Martins SGPS SA | 128,900 | | 2,381,940 |
South Africa - 1.6% |
Clicks Group Ltd. | 957,241 | | 5,964,430 |
Nampak Ltd. | 997,000 | | 3,297,263 |
TOTAL SOUTH AFRICA | | 9,261,693 |
Spain - 1.1% |
Grifols SA | 54,232 | | 2,224,100 |
Prosegur Compania de Seguridad SA (Reg.) | 717,890 | | 4,269,252 |
TOTAL SPAIN | | 6,493,352 |
Sweden - 2.1% |
Fagerhult AB | 137,487 | | 4,222,176 |
Intrum Justitia AB | 286,334 | | 7,622,258 |
TOTAL SWEDEN | | 11,844,434 |
Switzerland - 0.4% |
Zehnder Group AG | 42,336 | | 1,994,670 |
Turkey - 1.6% |
Albaraka Turk Katilim Bankasi A/S (a) | 3,932,046 | | 3,506,095 |
Coca-Cola Icecek A/S | 198,362 | | 5,688,779 |
TOTAL TURKEY | | 9,194,874 |
Common Stocks - continued |
| Shares | | Value |
United Kingdom - 19.3% |
Babcock International Group PLC | 219,700 | | $ 4,491,404 |
Bellway PLC | 258,872 | | 6,242,733 |
Berendsen PLC | 281,163 | | 4,375,177 |
Britvic PLC | 462,271 | | 4,632,533 |
Dechra Pharmaceuticals PLC | 342,500 | | 3,789,235 |
Derwent London PLC | 89,210 | | 3,581,704 |
Elementis PLC | 1,272,510 | | 5,286,528 |
Fenner PLC | 389,762 | | 2,499,778 |
Great Portland Estates PLC | 660,789 | | 6,070,987 |
H&T Group PLC | 214,353 | | 567,094 |
Hilton Food Group PLC | 142,800 | | 979,972 |
InterContinental Hotel Group PLC ADR | 130,126 | | 3,819,198 |
Johnson Matthey PLC | 89,175 | | 4,295,215 |
Meggitt PLC | 563,614 | | 5,173,675 |
Persimmon PLC | 191,863 | | 3,891,559 |
Rotork PLC | 153,400 | | 7,041,879 |
Serco Group PLC | 641,797 | | 5,731,849 |
Shaftesbury PLC | 564,273 | | 5,374,247 |
Spectris PLC | 196,078 | | 7,268,731 |
Spirax-Sarco Engineering PLC | 176,521 | | 8,258,925 |
Ted Baker PLC | 92,300 | | 2,526,255 |
Ultra Electronics Holdings PLC | 191,958 | | 5,952,571 |
Unite Group PLC | 1,160,870 | | 7,370,902 |
TOTAL UNITED KINGDOM | | 109,222,151 |
United States of America - 12.2% |
ANSYS, Inc. (a) | 16,285 | | 1,424,123 |
Autoliv, Inc. | 58,300 | | 5,202,109 |
BPZ Energy, Inc. (a)(d) | 549,267 | | 1,104,027 |
Broadridge Financial Solutions, Inc. | 44,505 | | 1,564,796 |
Dril-Quip, Inc. (a) | 38,395 | | 4,508,341 |
Evercore Partners, Inc. Class A | 85,700 | | 4,325,279 |
Greenhill & Co., Inc. | 55,195 | | 2,831,504 |
Kansas City Southern | 17,904 | | 2,175,694 |
Kennedy-Wilson Holdings, Inc. | 193,329 | | 3,874,313 |
Martin Marietta Materials, Inc. | 41,720 | | 4,092,315 |
Mohawk Industries, Inc. (a) | 37,700 | | 4,992,234 |
Oceaneering International, Inc. | 46,102 | | 3,959,240 |
PriceSmart, Inc. | 95,971 | | 10,920,540 |
ResMed, Inc. (d) | 99,100 | | 5,127,434 |
Common Stocks - continued |
| Shares | | Value |
United States of America - continued |
Solera Holdings, Inc. | 114,956 | | $ 6,462,826 |
SS&C Technologies Holdings, Inc. (a) | 163,958 | | 6,443,549 |
TOTAL UNITED STATES OF AMERICA | | 69,008,324 |
TOTAL COMMON STOCKS (Cost $404,246,204) |
547,044,600
|
Nonconvertible Preferred Stocks - 0.8% |
| | | |
Brazil - 0.2% |
Banco ABC Brasil SA | 222,389 | | 1,368,960 |
Germany - 0.6% |
Sartorius AG (non-vtg.) | 32,579 | | 3,436,993 |
TOTAL NONCONVERTIBLE PREFERRED STOCKS (Cost $5,148,060) |
4,805,953
|
Money Market Funds - 4.5% |
| | | |
Fidelity Cash Central Fund, 0.09% (b) | 18,051,128 | | 18,051,128 |
Fidelity Securities Lending Cash Central Fund, 0.09% (b)(c) | 7,174,591 | | 7,174,591 |
TOTAL MONEY MARKET FUNDS (Cost $25,225,719) |
25,225,719
|
TOTAL INVESTMENT PORTFOLIO - 102.1% (Cost $434,619,983) | | 577,076,272 |
NET OTHER ASSETS (LIABILITIES) - (2.1)% | | (12,118,320) |
NET ASSETS - 100% | $ 564,957,952 |
Legend |
(a) Non-income producing |
(b) Affiliated fund that is generally available only to investment companies and other accounts managed by Fidelity Investments. The rate quoted is the annualized seven-day yield of the fund at period end. A complete unaudited listing of the fund's holdings as of its most recent quarter end is available upon request. In addition, each Fidelity Central Fund's financial statements, which are not covered by the Fund's Report of Independent Registered Public Accounting Firm, are available on the SEC's website or upon request. |
(c) Investment made with cash collateral received from securities on loan. |
(d) Security or a portion of the security is on loan at period end. |
(e) Security or a portion of the security purchased on a delayed delivery or when-issued basis. |
Affiliated Central Funds |
Information regarding fiscal year to date income earned by the Fund from investments in Fidelity Central Funds is as follows: |
Fund | Income earned |
Fidelity Cash Central Fund | $ 23,340 |
Fidelity Securities Lending Cash Central Fund | 158,525 |
Total | $ 181,865 |
Other Information |
Categorizations in the Schedule of Investments are based on country or territory of incorporation. |
The following is a summary of the inputs used, as of October 31, 2013, involving the Fund's assets and liabilities carried at fair value. The inputs or methodology used for valuing securities may not be an indication of the risk associated with investing in those securities. For more information on valuation inputs, and their aggregation into the levels used in the tables below, please refer to the Investment Valuation section in the accompanying Notes to Financial Statements. |
Valuation Inputs at Reporting Date: |
Description | Total | Level 1 | Level 2 | Level 3 |
Investments in Securities: | | | | |
Equities: | | | | |
Consumer Discretionary | $ 104,744,679 | $ 64,182,798 | $ 36,970,363 | $ 3,591,518 |
Consumer Staples | 59,708,346 | 41,205,104 | 18,503,242 | - |
Energy | 18,578,952 | 18,440,750 | 138,202 | - |
Financials | 104,490,347 | 83,528,197 | 20,962,150 | - |
Health Care | 33,918,209 | 27,464,809 | 6,453,400 | - |
Industrials | 136,377,301 | 105,539,849 | 30,837,452 | - |
Information Technology | 39,408,904 | 27,450,577 | 11,958,327 | - |
Materials | 54,623,815 | 36,649,329 | 17,974,486 | - |
Money Market Funds | 25,225,719 | 25,225,719 | - | - |
Total Investments in Securities: | $ 577,076,272 | $ 429,687,132 | $ 143,797,622 | $ 3,591,518 |
The following is a summary of transfers between Level 1 and Level 2 for the period ended October 31, 2013. Transfers are assumed to have occurred at the beginning of the period, and are primarily attributable to the valuation techniques used for foreign equity securities, as discussed in the accompanying Notes to Financial Statements: |
Transfers | Total |
Level 1 to Level 2 | $ 76,627,921 |
Level 2 to Level 1 | $ 0 |
See accompanying notes which are an integral part of the financial statements.
Annual Report
Statement of Assets and Liabilities
| October 31, 2013 |
| | |
Assets | | |
Investment in securities, at value (including securities loaned of $6,987,440) - See accompanying schedule: Unaffiliated issuers (cost $409,394,264) | $ 551,850,553 | |
Fidelity Central Funds (cost $25,225,719) | 25,225,719 | |
Total Investments (cost $434,619,983) | | $ 577,076,272 |
Receivable for investments sold | | 4,506,670 |
Receivable for fund shares sold | | 507,688 |
Dividends receivable | | 1,303,342 |
Distributions receivable from Fidelity Central Funds | | 9,452 |
Prepaid expenses | | 1,697 |
Other receivables | | 7,965 |
Total assets | | 583,413,086 |
| | |
Liabilities | | |
Payable for investments purchased
Regular delivery | $ 9,748,207 | |
Delayed delivery | 121,976 | |
Payable for fund shares redeemed | 696,646 | |
Accrued management fee | 466,893 | |
Distribution and service plan fees payable | 16,120 | |
Other affiliated payables | 129,994 | |
Other payables and accrued expenses | 100,707 | |
Collateral on securities loaned, at value | 7,174,591 | |
Total liabilities | | 18,455,134 |
| | |
Net Assets | | $ 564,957,952 |
Net Assets consist of: | | |
Paid in capital | | $ 731,355,395 |
Undistributed net investment income | | 3,595,468 |
Accumulated undistributed net realized gain (loss) on investments and foreign currency transactions | | (312,444,762) |
Net unrealized appreciation (depreciation) on investments and assets and liabilities in foreign currencies | | 142,451,851 |
Net Assets | | $ 564,957,952 |
See accompanying notes which are an integral part of the financial statements.
Annual Report
Financial Statements - continued
Statement of Assets and Liabilities - continued
| October 31, 2013 |
| | |
Calculation of Maximum Offering Price Class A:
Net Asset Value and redemption price per share ($22,051,924 ÷ 1,611,668 shares) | | $ 13.68 |
| | |
Maximum offering price per share (100/94.25 of $13.68) | | $ 14.51 |
Class T:
Net Asset Value and redemption price per share ($9,634,442 ÷ 710,451 shares) | | $ 13.56 |
| | |
Maximum offering price per share (100/96.50 of $13.56) | | $ 14.05 |
Class B:
Net Asset Value and offering price per share ($1,410,258 ÷ 105,955 shares)A | | $ 13.31 |
| | |
Class C:
Net Asset Value and offering price per share ($8,070,406 ÷ 607,758 shares)A | | $ 13.28 |
| | |
| | |
International Small Cap Opportunities:
Net Asset Value, offering price and redemption price per share ($518,121,061 ÷ 37,496,899 shares) | | $ 13.82 |
| | |
Institutional Class:
Net Asset Value, offering price and redemption price per share ($5,669,861 ÷ 409,848 shares) | | $ 13.83 |
A Redemption price per share is equal to net asset value less any applicable contingent deferred sales charge.
See accompanying notes which are an integral part of the financial statements.
Annual Report
Statement of Operations
| Year ended October 31, 2013 |
| | |
Investment Income | | |
Dividends | | $ 10,512,209 |
Income from Fidelity Central Funds | | 181,865 |
Income before foreign taxes withheld | | 10,694,074 |
Less foreign taxes withheld | | (769,601) |
Total income | | 9,924,473 |
| | |
Expenses | | |
Management fee
Basic fee | $ 3,787,691 | |
Performance adjustment | 774,974 | |
Transfer agent fees | 1,108,282 | |
Distribution and service plan fees | 181,823 | |
Accounting and security lending fees | 230,791 | |
Custodian fees and expenses | 134,829 | |
Independent trustees' compensation | 2,439 | |
Registration fees | 95,153 | |
Audit | 68,957 | |
Legal | 1,172 | |
Miscellaneous | 3,054 | |
Total expenses before reductions | 6,389,165 | |
Expense reductions | (68,959) | 6,320,206 |
Net investment income (loss) | | 3,604,267 |
Realized and Unrealized Gain (Loss) Net realized gain (loss) on: | | |
Investment securities: | | |
Unaffiliated issuers | 37,160,055 | |
Foreign currency transactions | (43,323) | |
Total net realized gain (loss) | | 37,116,732 |
Change in net unrealized appreciation (depreciation) on: Investment securities | 71,930,920 | |
Assets and liabilities in foreign currencies | 14,737 | |
Total change in net unrealized appreciation (depreciation) | | 71,945,657 |
Net gain (loss) | | 109,062,389 |
Net increase (decrease) in net assets resulting from operations | | $ 112,666,656 |
See accompanying notes which are an integral part of the financial statements.
Annual Report
Financial Statements - continued
Statement of Changes in Net Assets
| Year ended
October 31,
2013 | Year ended
October 31,
2012 |
Increase (Decrease) in Net Assets | | |
Operations | | |
Net investment income (loss) | $ 3,604,267 | $ 3,779,313 |
Net realized gain (loss) | 37,116,732 | 21,361,280 |
Change in net unrealized appreciation (depreciation) | 71,945,657 | 17,236,425 |
Net increase (decrease) in net assets resulting
from operations | 112,666,656 | 42,377,018 |
Distributions to shareholders from net investment income | (3,311,096) | (4,886,680) |
Distributions to shareholders from net realized gain | (171,255) | (369,319) |
Total distributions | (3,482,351) | (5,255,999) |
Share transactions - net increase (decrease) | 81,271,586 | (28,976,326) |
Redemption fees | 56,441 | 64,463 |
Total increase (decrease) in net assets | 190,512,332 | 8,209,156 |
| | |
Net Assets | | |
Beginning of period | 374,445,620 | 366,236,464 |
End of period (including undistributed net investment income of $3,595,468 and undistributed net investment income of $3,302,296, respectively) | $ 564,957,952 | $ 374,445,620 |
See accompanying notes which are an integral part of the financial statements.
Annual Report
Financial Highlights - Class A
Years ended October 31, | 2013 | 2012 | 2011 | 2010 | 2009 |
Selected Per-Share Data | | | | | |
Net asset value, beginning of period | $ 10.78 | $ 9.75 | $ 9.82 | $ 8.07 | $ 6.24 |
Income from Investment Operations | | | | | |
Net investment income (loss) C | .07 | .08 | .15 F | .06 | .06 |
Net realized and unrealized gain (loss) | 2.91 | 1.07 | (.07) | 1.85 | 1.77 |
Total from investment operations | 2.98 | 1.15 | .08 | 1.91 | 1.83 |
Distributions from net investment income | (.08) | (.11) | (.11) | (.07) | - |
Distributions from net realized gain | (.01) | (.01) | (.04) | (.09) | - |
Total distributions | (.08) I | (.12) | (.15) | (.16) | - |
Redemption fees added to paid in capital C, H | - | - | - | - | - |
Net asset value, end of period | $ 13.68 | $ 10.78 | $ 9.75 | $ 9.82 | $ 8.07 |
Total Return A, B | 27.85% | 12.00% | .81% | 24.05% | 29.33% |
Ratios to Average Net Assets D, G | | | | | |
Expenses before reductions | 1.70% | 1.75% | 1.34% | 1.16% | .94% |
Expenses net of fee waivers, if any | 1.65% | 1.65% | 1.33% | 1.16% | .94% |
Expenses net of all reductions | 1.64% | 1.64% | 1.32% | 1.15% | .89% |
Net investment income (loss) | .59% | .85% | 1.44% F | .74% | 1.00% |
Supplemental Data | | | | | |
Net assets, end of period (000 omitted) | $ 22,052 | $ 18,194 | $ 18,686 | $ 20,228 | $ 18,883 |
Portfolio turnover rate E | 31% | 28% | 24% | 49% | 174% |
A Total returns would have been lower if certain expenses had not been reduced during the applicable periods shown.
B Total returns do not include the effect of the sales charges.
C Calculated based on average shares outstanding during the period.
D Fees and expenses of any underlying Fidelity Central Funds are not included in the Fund's expense ratio. The Fund indirectly bears its proportionate share of the expenses of any underlying Fidelity Central Funds.
E Amount does not include the portfolio activity of any underlying Fidelity Central Funds.
F Investment income per share reflects a large, non-recurring dividend which amounted to $.06 per share. Excluding this non-recurring dividend, the ratio of net investment income (loss) to average net assets would have been .80%.
G Expense ratios reflect operating expenses of the class. Expenses before reductions do not reflect amounts reimbursed by the investment adviser or reductions from brokerage service arrangements or reductions from other expense offset arrangements and do not represent the amount paid by the class during periods when reimbursements or reductions occur. Expenses net of fee waivers reflect expenses after reimbursement by the investment adviser but prior to reductions from brokerage service arrangements or other expense offset arrangements. Expenses net of all reductions represent the net expenses paid by the class.
H Amount represents less than $.01 per share.
I Total distributions of $.08 per share is comprised of distributions from net investment income of $.077 and distributions from net realized gain of $.005 per share.
See accompanying notes which are an integral part of the financial statements.
Annual Report
Financial Highlights - Class T
Years ended October 31, | 2013 | 2012 | 2011 | 2010 | 2009 |
Selected Per-Share Data | | | | | |
Net asset value, beginning of period | $ 10.69 | $ 9.66 | $ 9.72 | $ 8.00 | $ 6.20 |
Income from Investment Operations | | | | | |
Net investment income (loss) C | .04 | .06 | .12 F | .04 | .05 |
Net realized and unrealized gain (loss) | 2.89 | 1.06 | (.06) | 1.83 | 1.75 |
Total from investment operations | 2.93 | 1.12 | .06 | 1.87 | 1.80 |
Distributions from net investment income | (.05) | (.08) | (.08) | (.06) | - |
Distributions from net realized gain | (.01) | (.01) | (.04) | (.09) | - |
Total distributions | (.06) | (.09) | (.12) | (.15) | - |
Redemption fees added to paid in capital C, H | - | - | - | - | - |
Net asset value, end of period | $ 13.56 | $ 10.69 | $ 9.66 | $ 9.72 | $ 8.00 |
Total Return A, B | 27.53% | 11.72% | .60% | 23.65% | 29.03% |
Ratios to Average Net Assets D, G | | | | | |
Expenses before reductions | 1.96% | 2.02% | 1.60% | 1.43% | 1.20% |
Expenses net of fee waivers, if any | 1.90% | 1.90% | 1.60% | 1.43% | 1.20% |
Expenses net of all reductions | 1.89% | 1.89% | 1.59% | 1.41% | 1.15% |
Net investment income (loss) | .34% | .60% | 1.17% F | .48% | .74% |
Supplemental Data | | | | | |
Net assets, end of period (000 omitted) | $ 9,634 | $ 8,169 | $ 8,701 | $ 11,202 | $ 11,915 |
Portfolio turnover rate E | 31% | 28% | 24% | 49% | 174% |
A Total returns would have been lower if certain expenses had not been reduced during the applicable periods shown.
B Total returns do not include the effect of the sales charges.
C Calculated based on average shares outstanding during the period.
D Fees and expenses of any underlying Fidelity Central Funds are not included in the Fund's expense ratio. The Fund indirectly bears its proportionate share of the expenses of any underlying Fidelity Central Funds.
E Amount does not include the portfolio activity of any underlying Fidelity Central Funds.
F Investment income per share reflects a large, non-recurring dividend which amounted to $.06 per share. Excluding this non-recurring dividend, the ratio of net investment income (loss) to average net assets would have been .54%.
G Expense ratios reflect operating expenses of the class. Expenses before reductions do not reflect amounts reimbursed by the investment adviser or reductions from brokerage service arrangements or reductions from other expense offset arrangements and do not represent the amount paid by the class during periods when reimbursements or reductions occur. Expenses net of fee waivers reflect expenses after reimbursement by the investment adviser but prior to reductions from brokerage service arrangements or other expense offset arrangements. Expenses net of all reductions represent the net expenses paid by the class.
H Amount represents less than $.01 per share.
See accompanying notes which are an integral part of the financial statements.
Annual Report
Financial Highlights - Class B
Years ended October 31, | 2013 | 2012 | 2011 | 2010 | 2009 |
Selected Per-Share Data | | | | | |
Net asset value, beginning of period | $ 10.50 | $ 9.48 | $ 9.54 | $ 7.87 | $ 6.12 |
Income from Investment Operations | | | | | |
Net investment income (loss) C | (.02) | .01 | .07 F | - H | .02 |
Net realized and unrealized gain (loss) | 2.84 | 1.05 | (.06) | 1.79 | 1.73 |
Total from investment operations | 2.82 | 1.06 | .01 | 1.79 | 1.75 |
Distributions from net investment income | - H | (.03) | (.06) | (.03) | - |
Distributions from net realized gain | (.01) | (.01) | (.02) | (.09) | - |
Total distributions | (.01) | (.04) | (.07) I | (.12) | - |
Redemption fees added to paid in capital C, H | - | - | - | - | - |
Net asset value, end of period | $ 13.31 | $ 10.50 | $ 9.48 | $ 9.54 | $ 7.87 |
Total Return A, B | 26.86% | 11.21% | .10% | 23.03% | 28.59% |
Ratios to Average Net Assets D, G | | | | | |
Expenses before reductions | 2.46% | 2.50% | 2.09% | 1.91% | 1.69% |
Expenses net of fee waivers, if any | 2.40% | 2.40% | 2.09% | 1.91% | 1.69% |
Expenses net of all reductions | 2.39% | 2.39% | 2.07% | 1.90% | 1.64% |
Net investment income (loss) | (.16)% | .10% | .68% F | (.01)% | .25% |
Supplemental Data | | | | | |
Net assets, end of period (000 omitted) | $ 1,410 | $ 1,966 | $ 2,293 | $ 2,902 | $ 2,799 |
Portfolio turnover rate E | 31% | 28% | 24% | 49% | 174% |
A Total returns would have been lower if certain expenses had not been reduced during the applicable periods shown.
B Total returns do not include the effect of the contingent deferred sales charge.
C Calculated based on average shares outstanding during the period.
D Fees and expenses of any underlying Fidelity Central Funds are not included in the Fund's expense ratio. The Fund indirectly bears its proportionate share of the expenses of any underlying Fidelity Central Funds.
E Amount does not include the portfolio activity of any underlying Fidelity Central Funds.
F Investment income per share reflects a large, non-recurring dividend which amounted to $.06 per share. Excluding this non-recurring dividend, the ratio of net investment income (loss) to average net assets would have been .05%.
G Expense ratios reflect operating expenses of the class. Expenses before reductions do not reflect amounts reimbursed by the investment adviser or reductions from brokerage service arrangements or reductions from other expense offset arrangements and do not represent the amount paid by the class during periods when reimbursements or reductions occur. Expenses net of fee waivers reflect expenses after reimbursement by the investment adviser but prior to reductions from brokerage service arrangements or other expense offset arrangements. Expenses net of all reductions represent the net expenses paid by the class.
H Amount represents less than $.01 per share.
I Total distributions of $.07 per share is comprised of distributions from net investment income of $.058 and distributions from net realized gain of $.015 per share.
See accompanying notes which are an integral part of the financial statements.
Annual Report
Financial Highlights - Class C
Years ended October 31, | 2013 | 2012 | 2011 | 2010 | 2009 |
Selected Per-Share Data | | | | | |
Net asset value, beginning of period | $ 10.48 | $ 9.47 | $ 9.53 | $ 7.86 | $ 6.11 |
Income from Investment Operations | | | | | |
Net investment income (loss) C | (.02) | .01 | .07 F | - H | .02 |
Net realized and unrealized gain (loss) | 2.84 | 1.04 | (.06) | 1.79 | 1.73 |
Total from investment operations | 2.82 | 1.05 | .01 | 1.79 | 1.75 |
Distributions from net investment income | (.01) | (.03) | (.06) | (.03) | - |
Distributions from net realized gain | (.01) | (.01) | (.02) | (.09) | - |
Total distributions | (.02) | (.04) | (.07) I | (.12) | - |
Redemption fees added to paid in capital C, H | - | - | - | - | - |
Net asset value, end of period | $ 13.28 | $ 10.48 | $ 9.47 | $ 9.53 | $ 7.86 |
Total Return A, B | 26.91% | 11.13% | .10% | 23.06% | 28.64% |
Ratios to Average Net Assets D, G | | | | | |
Expenses before reductions | 2.45% | 2.50% | 2.09% | 1.91% | 1.68% |
Expenses net of fee waivers, if any | 2.40% | 2.40% | 2.09% | 1.91% | 1.68% |
Expenses net of all reductions | 2.39% | 2.39% | 2.07% | 1.90% | 1.63% |
Net investment income (loss) | (.16)% | .10% | .68% F | (.01)% | .26% |
Supplemental Data | | | | | |
Net assets, end of period (000 omitted) | $ 8,070 | $ 6,608 | $ 6,900 | $ 8,936 | $ 8,543 |
Portfolio turnover rate E | 31% | 28% | 24% | 49% | 174% |
A Total returns would have been lower if certain expenses had not been reduced during the applicable periods shown.
B Total returns do not include the effect of the contingent deferred sales charge.
C Calculated based on average shares outstanding during the period.
D Fees and expenses of any underlying Fidelity Central Funds are not included in the Fund's expense ratio. The Fund indirectly bears its proportionate share of the expenses of any underlying Fidelity Central Funds.
E Amount does not include the portfolio activity of any underlying Fidelity Central Funds.
F Investment income per share reflects a large, non-recurring dividend which amounted to $.06 per share. Excluding this non-recurring dividend, the ratio of net investment income (loss) to average net assets would have been .05%.
G Expense ratios reflect operating expenses of the class. Expenses before reductions do not reflect amounts reimbursed by the investment adviser or reductions from brokerage service arrangements or reductions from other expense offset arrangements and do not represent the amount paid by the class during periods when reimbursements or reductions occur. Expenses net of fee waivers reflect expenses after reimbursement by the investment adviser but prior to reductions from brokerage service arrangements or other expense offset arrangements. Expenses net of all reductions represent the net expenses paid by the class.
H Amount represents less than $.01 per share.
I Total distributions of $.07 per share is comprised of distributions from net investment income of $.058 and distributions from net realized gain of $.015 per share.
See accompanying notes which are an integral part of the financial statements.
Annual Report
Financial Highlights - International Small Cap Opportunities
Years ended October 31, | 2013 | 2012 | 2011 | 2010 | 2009 |
Selected Per-Share Data | | | | | |
Net asset value, beginning of period | $ 10.88 | $ 9.85 | $ 9.92 | $ 8.14 | $ 6.28 |
Income from Investment Operations | | | | | |
Net investment income (loss) B | .10 | .11 | .17 E | .09 | .08 |
Net realized and unrealized gain (loss) | 2.95 | 1.07 | (.06) | 1.87 | 1.78 |
Total from investment operations | 3.05 | 1.18 | .11 | 1.96 | 1.86 |
Distributions from net investment income | (.10) | (.14) | (.14) | (.09) | - G |
Distributions from net realized gain | (.01) | (.01) | (.04) | (.09) | - |
Total distributions | (.11) | (.15) | (.18) | (.18) | - G |
Redemption fees added to paid in capital B, G | - | - | - | - | - |
Net asset value, end of period | $ 13.82 | $ 10.88 | $ 9.85 | $ 9.92 | $ 8.14 |
Total Return A | 28.24% | 12.21% | 1.10% | 24.43% | 29.68% |
Ratios to Average Net Assets C, F | | | | | |
Expenses before reductions | 1.39% | 1.47% | 1.08% | .91% | .68% |
Expenses net of fee waivers, if any | 1.39% | 1.40% | 1.08% | .91% | .68% |
Expenses net of all reductions | 1.38% | 1.39% | 1.06% | .89% | .64% |
Net investment income (loss) | .85% | 1.10% | 1.69% E | 1.00% | 1.25% |
Supplemental Data | | | | | |
Net assets, end of period (000 omitted) | $ 518,121 | $ 334,918 | $ 328,262 | $ 398,331 | $ 329,128 |
Portfolio turnover rate D | 31% | 28% | 24% | 49% | 174% |
A Total returns would have been lower if certain expenses had not been reduced during the applicable periods shown.
B Calculated based on average shares outstanding during the period.
C Fees and expenses of any underlying Fidelity Central Funds are not included in the Fund's expense ratio. The Fund indirectly bears its proportionate share of the expenses of any underlying Fidelity Central Funds.
D Amount does not include the portfolio activity of any underlying Fidelity Central Funds.
E Investment income per share reflects a large, non-recurring dividend which amounted to $.07 per share. Excluding this non-recurring dividend, the ratio of net investment income (loss) to average net assets would have been 1.06%.
F Expense ratios reflect operating expenses of the class. Expenses before reductions do not reflect amounts reimbursed by the investment adviser or reductions from brokerage service arrangements or reductions from other expense offset arrangements and do not represent the amount paid by the class during periods when reimbursements or reductions occur. Expenses net of fee waivers reflect expenses after reimbursement by the investment adviser but prior to reductions from brokerage service arrangements or other expense offset arrangements. Expenses net of all reductions represent the net expenses paid by the class.
G Amount represents less than $.01 per share.
See accompanying notes which are an integral part of the financial statements.
Annual Report
Financial Highlights - Institutional Class
Years ended October 31, | 2013 | 2012 | 2011 | 2010 | 2009 |
Selected Per-Share Data | | | | | |
Net asset value, beginning of period | $ 10.90 | $ 9.86 | $ 9.93 | $ 8.14 | $ 6.27 |
Income from Investment Operations | | | | | |
Net investment income (loss) B | .11 | .11 | .18 E | .09 | .08 |
Net realized and unrealized gain (loss) | 2.93 | 1.08 | (.06) | 1.86 | 1.79 |
Total from investment operations | 3.04 | 1.19 | .12 | 1.95 | 1.87 |
Distributions from net investment income | (.10) | (.14) | (.15) | (.07) | - G |
Distributions from net realized gain | (.01) | (.01) | (.04) | (.09) | - |
Total distributions | (.11) | (.15) | (.19) | (.16) | - G |
Redemption fees added to paid in capital B, G | - | - | - | - | - |
Net asset value, end of period | $ 13.83 | $ 10.90 | $ 9.86 | $ 9.93 | $ 8.14 |
Total Return A | 28.11% | 12.32% | 1.13% | 24.33% | 29.87% |
Ratios to Average Net Assets C, F | | | | | |
Expenses before reductions | 1.38% | 1.44% | 1.03% | .90% | .68% |
Expenses net of fee waivers, if any | 1.37% | 1.40% | 1.03% | .90% | .68% |
Expenses net of all reductions | 1.37% | 1.39% | 1.02% | .88% | .64% |
Net investment income (loss) | .87% | 1.10% | 1.74% E | 1.01% | 1.25% |
Supplemental Data | | | | | |
Net assets, end of period (000 omitted) | $ 5,670 | $ 4,591 | $ 1,395 | $ 2,418 | $ 2,022 |
Portfolio turnover rate D | 31% | 28% | 24% | 49% | 174% |
A Total returns would have been lower if certain expenses had not been reduced during the applicable periods shown.
B Calculated based on average shares outstanding during the period.
C Fees and expenses of any underlying Fidelity Central Funds are not included in the Fund's expense ratio. The Fund indirectly bears its proportionate share of the expenses of any underlying Fidelity Central Funds.
D Amount does not include the portfolio activity of any underlying Fidelity Central Funds.
E Investment income per share reflects a large, non-recurring dividend which amounted to $.07 per share. Excluding this non-recurring dividend, the ratio of net investment income (loss) to average net assets would have been 1.11%.
F Expense ratios reflect operating expenses of the class. Expenses before reductions do not reflect amounts reimbursed by the investment adviser or reductions from brokerage service arrangements or reductions from other expense offset arrangements and do not represent the amount paid by the class during periods when reimbursements or reductions occur. Expenses net of fee waivers reflect expenses after reimbursement by the investment adviser but prior to reductions from brokerage service arrangements or other expense offset arrangements. Expenses net of all reductions represent the net expenses paid by the class.
G Amount represents less than $.01 per share.
See accompanying notes which are an integral part of the financial statements.
Annual Report
Notes to Financial Statements
For the period ended October 31, 2013
1. Organization.
Fidelity International Small Cap Opportunities Fund (the Fund) is a fund of Fidelity Investment Trust (the Trust) and is authorized to issue an unlimited number of shares. The Trust is registered under the Investment Company Act of 1940, as amended (the 1940 Act), as an open-end management investment company organized as a Massachusetts business trust. The Fund offers Class A, Class T, Class C, International Small Cap Opportunities and Institutional Class shares, each of which, along with Class B shares, has equal rights as to assets and voting privileges. Class B shares are closed to new accounts and additional purchases, except for exchanges and reinvestments. Each class has exclusive voting rights with respect to matters that affect that class. Class B shares will automatically convert to Class A shares after a holding period of seven years from the initial date of purchase.
2. Investments in Fidelity Central Funds.
The Fund invests in Fidelity Central Funds, which are open-end investment companies generally available only to other investment companies and accounts managed by Fidelity Management & Research Company (FMR) and its affiliates. The Fund's Schedule of Investments lists each of the Fidelity Central Funds held as of period end, if any, as an investment of the Fund, but does not include the underlying holdings of each Fidelity Central Fund. As an Investing Fund, the Fund indirectly bears its proportionate share of the expenses of the underlying Fidelity Central Funds.
The Money Market Central Funds seek preservation of capital and current income and are managed by Fidelity Investments Money Management, Inc. (FIMM), an affiliate of FMR.
A complete unaudited list of holdings for each Fidelity Central Fund is available upon request or at the Securities and Exchange Commission (the SEC) website at www.sec.gov. In addition, the financial statements of the Fidelity Central Funds, which are not covered by the Fund's Report of Independent Registered Public Accounting Firm, are available on the SEC website or upon request.
3. Significant Accounting Policies.
The financial statements have been prepared in conformity with accounting principles generally accepted in the United States of America (GAAP), which require management to make certain estimates and assumptions at the date of the financial statements. Actual results could differ from those estimates. Subsequent events, if any, through the date that the financial statements were issued have been evaluated in the preparation of
Annual Report
Notes to Financial Statements - continued
3. Significant Accounting Policies - continued
the financial statements. The following summarizes the significant accounting policies of the Fund:
Investment Valuation. Investments are valued as of 4:00 p.m. Eastern time on the last calendar day of the period. In accordance with valuation policies and procedures approved by the Board of Trustees (the Board), the Fund attempts to obtain prices from one or more third party pricing vendors or brokers to value its investments. When current market prices, quotations or currency exchange rates are not readily available or reliable, investments will be fair valued in good faith by the FMR Fair Value Committee (the Committee), in accordance with procedures adopted by the Board. Factors used in determining fair value vary by investment type and may include market or investment specific events. The frequency with which these procedures are used cannot be predicted and they may be utilized to a significant extent. The Committee oversees the Fund's valuation policies and procedures and is responsible for approving and reporting to the Board all fair value determinations.
The Fund categorizes the inputs to valuation techniques used to value its investments into a disclosure hierarchy consisting of three levels as shown below:
Level 1 - quoted prices in active markets for identical investments
Level 2 - other significant observable inputs (including quoted prices for similar investments, interest rates, prepayment speeds, etc.)
Level 3 - unobservable inputs (including the Fund's own assumptions based on the best information available)
Valuation techniques used to value the Fund's investments by major category are as follows:
Equity securities, including restricted securities, for which market quotations are readily available, are valued at the last reported sale price or official closing price as reported by a third party pricing vendor on the primary market or exchange on which they are traded and are categorized as Level 1 in the hierarchy. In the event there were no sales during the day or closing prices are not available, securities are valued at the last quoted bid price or may be valued using the last available price and are generally categorized as Level 2 in the hierarchy. For foreign equity securities, when market or security specific events arise, comparisons to the valuation of American Depositary Receipts (ADRs), futures contracts, Exchange-Traded Funds (ETFs) and certain indexes as well as quoted prices for similar securities may be used and would be categorized as Level 2 in the hierarchy. Utilizing these techniques may result in transfers between Level 1 and Level 2. For equity securities, including restricted securities, where observable inputs are
Annual Report
3. Significant Accounting Policies - continued
Investment Valuation - continued
limited, assumptions about market activity and risk are used and these securities may be categorized as Level 3 in the hierarchy.
Investments in open-end mutual funds, including the Fidelity Central Funds, are valued at their closing net asset value (NAV) each business day and are categorized as Level 1 in the hierarchy.
Changes in valuation techniques may result in transfers in or out of an assigned level within the disclosure hierarchy. The aggregate value of investments by input level, as of October 31, 2013, including information on transfers between Levels 1 and 2 is included at the end of the Fund's Schedule of Investments.
Foreign Currency. The Fund may use foreign currency contracts to facilitate transactions in foreign-denominated securities. Gains and losses from these transactions may arise from changes in the value of the foreign currency or if the counterparties do not perform under the contracts' terms.
Foreign-denominated assets, including investment securities, and liabilities are translated into U.S. dollars at the exchange rates at period end. Purchases and sales of investment securities, income and dividends received and expenses denominated in foreign currencies are translated into U.S. dollars at the exchange rate in effect on the transaction date.
The effects of exchange rate fluctuations on investments are included with the net realized and unrealized gain (loss) on investment securities. Other foreign currency transactions resulting in realized and unrealized gain (loss) are disclosed separately.
Investment Transactions and Income. For financial reporting purposes, the Fund's investment holdings and NAV include trades executed through the end of the last business day of the period. The NAV per share for processing shareholder transactions is calculated as of the close of business of the New York Stock Exchange (NYSE), normally 4:00 p.m. Eastern time and includes trades executed through the end of the prior business day. Gains and losses on securities sold are determined on the basis of identified cost and may include proceeds received from litigation. Dividend income is recorded on the ex-dividend date, except for certain dividends from foreign securities where the ex-dividend date may have passed, which are recorded as soon as the Fund is informed of the ex-dividend date. Non-cash dividends included in dividend income, if any, are recorded at the fair market value of the securities received. Distributions received on securities that represent a return of capital or capital gain are recorded as a reduction of cost of investments and/or as a realized gain. Subsequent to ex-dividend date the Fund determines the components of these distributions, based upon receipt of tax filings or
Annual Report
Notes to Financial Statements - continued
3. Significant Accounting Policies - continued
Investment Transactions and Income - continued
other correspondence relating to the underlying investment. Interest income and distributions from the Fidelity Central Funds are accrued as earned. Investment income is recorded net of foreign taxes withheld where recovery of such taxes is uncertain.
Class Allocations and Expenses. Investment income, realized and unrealized capital gains and losses, common expenses of the Fund, and certain fund-level expense reductions, if any, are allocated daily on a pro-rata basis to each class based on the relative net assets of each class to the total net assets of the Fund. Each class differs with respect to transfer agent and distribution and service plan fees incurred. Certain expense reductions may also differ by class. For the reporting period, the allocated portion of income and expenses to each class as a percent of its average net assets may vary due to the timing of recording these transactions in relation to fluctuating net assets of the classes. Expenses directly attributable to a fund are charged to that fund. Expenses attributable to more than one fund are allocated among the respective funds on the basis of relative net assets or other appropriate methods. Expense estimates are accrued in the period to which they relate and adjustments are made when actual amounts are known.
Income Tax Information and Distributions to Shareholders. Each year, the Fund intends to qualify as a regulated investment company under Subchapter M of the Internal Revenue Code, including distributing substantially all of its taxable income and realized gains. As a result, no provision for U.S. Federal income taxes is required. As of October 31, 2013, the Fund did not have any unrecognized tax benefits in the financial statements; nor is the Fund aware of any tax positions for which it is reasonably possible that the total amounts of unrecognized tax benefits will significantly change in the next twelve months. The Fund files a U.S. federal tax return, in addition to state and local tax returns as required. The Fund's federal income tax returns are subject to examination by the Internal Revenue Service (IRS) for a period of three fiscal years after they are filed. State and local tax returns may be subject to examination for an additional fiscal year depending on the jurisdiction. Foreign taxes are provided for based on the Fund's understanding of the tax rules and rates that exist in the foreign markets in which it invests.
Distributions are declared and recorded on the ex-dividend date. Income dividends and capital gain distributions are declared separately for each class. Income and capital gain distributions are determined in accordance with income tax regulations, which may differ from GAAP.
Capital accounts within the financial statements are adjusted for permanent book-tax differences. These adjustments have no impact on net assets or the results of operations. Temporary book-tax differences will reverse in a subsequent period.
Annual Report
3. Significant Accounting Policies - continued
Income Tax Information and Distributions to Shareholders - continued
Book-tax differences are primarily due to foreign currency transactions, passive foreign investment companies (PFIC), partnerships, capital loss carryforwards and losses deferred due to wash sales.
The federal tax cost of investment securities and unrealized appreciation (depreciation) as of period end were as follows:
Gross unrealized appreciation | $ 146,329,234 |
Gross unrealized depreciation | (9,406,877) |
Net unrealized appreciation (depreciation) on securities and other investments | $ 136,922,357 |
| |
Tax Cost | $ 440,153,915 |
The tax-based components of distributable earnings as of period end were as follows:
Undistributed ordinary income | $ 6,738,514 |
Capital loss carryforward | $ (310,053,876) |
Net unrealized appreciation (depreciation) | $ 136,917,919 |
Capital loss carryforwards are only available to offset future capital gains of the Fund to the extent provided by regulations and may be limited. Under the Regulated Investment Company Modernization Act of 2010 (the Act), the Fund is permitted to carry forward capital losses incurred in taxable years beginning after December 22, 2010 for an unlimited period and such capital losses are required to be used prior to any losses that expire. The capital loss carryforward information presented below, including any applicable limitation, is estimated as of fiscal period end and is subject to adjustment.
Fiscal year of expiration | |
2017 | $ (310,053,876) |
The tax character of distributions paid was as follows:
| October 31, 2013 | October 31, 2012 |
Ordinary Income | $ 3,482,351 | $ 5,255,999 |
Short-Term Trading (Redemption) Fees. Shares held by investors in the Fund less than 90 days may have been subject to a redemption fee equal to 2.00% of the net asset value of shares redeemed. All redemption fees, which reduce the proceeds of the shareholder redemption, are retained by the Fund and accounted for as an addition to paid in capital.
Annual Report
Notes to Financial Statements - continued
3. Significant Accounting Policies - continued
Delayed Delivery Transactions and When-Issued Securities. During the period, the Fund transacted in securities on a delayed delivery or when-issued basis. Payment and delivery may take place after the customary settlement period for that security. The price of the underlying securities and the date when the securities will be delivered and paid for are fixed at the time the transaction is negotiated. The securities purchased on a delayed delivery or when-issued basis are identified as such in the Fund's Schedule of Investments. With respect to purchase commitments, the Fund identifies securities as segregated in its records with a value at least equal to the amount of the commitment. Losses may arise due to changes in the value of the underlying securities or if the counterparty does not perform under the contract's terms, or if the issuer does not issue the securities due to political, economic, or other factors.
4. Purchases and Sales of Investments.
Purchases and sales of securities, other than short-term securities, aggregated $214,172,612 and $131,095,474, respectively.
5. Fees and Other Transactions with Affiliates.
Management Fee. FMR and its affiliates provide the Fund with investment management related services for which the Fund pays a monthly management fee. The management fee is the sum of an individual fund fee rate that is based on an annual rate of .60% of the Fund's average net assets and an annualized group fee rate that averaged .25% during the period. The group fee rate is based upon the average net assets of all the mutual funds advised by FMR, including any mutual funds previously advised by FMR that are currently advised by Fidelity SelectCo, LLC, an affiliate of FMR. The group fee rate decreases as assets under management increase and increases as assets under management decrease. In addition, the management fee is subject to a performance adjustment (up to a maximum of ± .20% of the Fund's average net assets over a 36 month performance period). The upward or downward adjustment to the management fee is based on the relative investment performance of International Small Cap Opportunities as compared to an appropriate benchmark index over the same 36 month performance period. For the reporting period, the total annual management fee rate, including the performance adjustment, was 1.03% of the Fund's average net assets. The performance adjustment included in the management fee rate may be higher or lower than the maximum performance adjustment rate due to the difference between the average net assets for the reporting and performance periods.
Distribution and Service Plan Fees. In accordance with Rule 12b-1 of the 1940 Act, the Fund has adopted separate Distribution and Service Plans for each class of shares. Certain classes pay Fidelity Distributors Corporation (FDC), an affiliate of FMR,
Annual Report
5. Fees and Other Transactions with Affiliates - continued
Distribution and Service Plan Fees - continued
separate Distribution and Service Fees, each of which is based on an annual percentage of each class' average net assets. In addition, FDC may pay financial intermediaries for selling shares of the Fund and providing shareholder support services. For the period, the Distribution and Service Fee rates, total fees and amounts retained by FDC were as follows:
| Distribution
Fee | Service
Fee | Total Fees | Retained
by FDC |
Class A | -% | .25% | $ 50,175 | $ 829 |
Class T | .25% | .25% | 44,164 | 211 |
Class B | .75% | .25% | 16,241 | 12,254 |
Class C | .75% | .25% | 71,243 | 5,808 |
| | | $ 181,823 | $ 19,102 |
Sales Load. FDC may receive a front-end sales charge of up to 5.75% for selling Class A shares and 3.50% for selling Class T shares, some of which is paid to financial intermediaries for selling shares of the Fund. Depending on the holding period, FDC may receive contingent deferred sales charges levied on Class A, Class T, Class B and Class C redemptions. The deferred sales charges range from 5.00% to 1.00% for Class B shares, 1.00% for Class C shares, 1.00% for certain purchases of Class A shares and .25% for certain purchases of Class T shares.
For the period, sales charge amounts retained by FDC were as follows:
| Retained
by FDC |
Class A | $ 5,751 |
Class T | 1,958 |
Class B* | 1,016 |
Class C* | 325 |
| $ 9,050 |
* When Class B and Class C shares are initially sold, FDC pays commissions from its own resources to financial intermediaries through which the sales
are made.
Transfer Agent Fees. Fidelity Investments Institutional Operations Company, Inc., (FIIOC), an affiliate of FMR, is the transfer, dividend disbursing and shareholder servicing agent for each class of the Fund. FIIOC receives account fees and asset-based fees that vary according to the account size and type of account of the shareholders of the respective classes of the Fund. FIIOC receives no fees for providing transfer agency services to Class F. FIIOC pays for typesetting, printing and mailing of shareholder reports, except proxy statements.
Annual Report
Notes to Financial Statements - continued
5. Fees and Other Transactions with Affiliates - continued
Transfer Agent Fees - continued
For the period, transfer agent fees for each class were as follows:
| Amount | % of
Average
Net Assets |
Class A | $ 60,229 | .30 |
Class T | 27,487 | .31 |
Class B | 4,868 | .30 |
Class C | 21,409 | .30 |
International Small Cap Opportunities | 983,422 | .24 |
Institutional Class | 10,867 | .23 |
| $ 1,108,282 | |
Accounting and Security Lending Fees. Fidelity Service Company, Inc. (FSC), an affiliate of FMR, maintains the Fund's accounting records. The accounting fee is based on the level of average net assets for each month. Under a separate contract, FSC administers the security lending program. The security lending fee is based on the number and duration of lending transactions.
Brokerage Commissions. The Fund placed a portion of its portfolio transactions with brokerage firms which are affiliates of the investment adviser. Brokerage commissions are included in net realized gain (loss) and change in net unrealized appreciation (depreciation) in the Statement of Operations. The commissions paid to these affiliated firms were $887 for the period.
6. Committed Line of Credit.
The Fund participates with other funds managed by FMR or an affiliate in a $4.25 billion credit facility (the "line of credit") to be utilized for temporary or emergency purposes to fund shareholder redemptions or for other short-term liquidity purposes. The Fund has agreed to pay commitment fees on its pro-rata portion of the line of credit, which amounted to $920 and is reflected in Miscellaneous expenses on the Statement of Operations. During the period, there were no borrowings on this line of credit.
7. Security Lending.
The Fund lends portfolio securities through a lending agent from time to time in order to earn additional income. For equity securities, a lending agent is used and may loan securities to certain qualified borrowers, including Fidelity Capital Markets (FCM), a broker-dealer affiliated with the Fund. On the settlement date of the loan, the Fund receives collateral (in the form of U.S. Treasury obligations, letters of credit and/or cash) against the loaned securities and maintains collateral in an amount not less than 100% of
Annual Report
7. Security Lending - continued
the market value of the loaned securities during the period of the loan. The market value of the loaned securities is determined at the close of business of the Fund and any additional required collateral is delivered to the Fund on the next business day. If the borrower defaults on its obligation to return the securities loaned because of insolvency or other reasons, the Fund may apply collateral received from the borrower against the obligation. The Fund may experience delays and costs in recovering the securities loaned. Any cash collateral received is invested in the Fidelity Securities Lending Cash Central Fund. The value of loaned securities and cash collateral at period end are disclosed on the Fund's Statement of Assets and Liabilities. At period end, there were no security loans outstanding with FCM. Security lending income represents the income earned on investing cash collateral, less rebates paid to borrowers and any lending agent fees associated with the loan, plus any premium payments received for lending certain types of securities. Security lending income is presented in the Statement of Operations as a component of income from Fidelity Central Funds. Total security lending income during the period amounted to $158,525, including $587 from securities loaned to FCM.
8. Expense Reductions.
FMR voluntarily agreed to reimburse each class to the extent annual operating expenses exceeded certain levels of average net assets as noted in the table below. Some expenses, for example interest expense, including commitment fees, are excluded from this reimbursement.
The following classes were in reimbursement during the period:
| Expense
Limitations | Reimbursement |
Class A | 1.65% | $ 10,041 |
Class T | 1.90% | 5,407 |
Class B | 2.40% | 1,003 |
Class C | 2.40% | 3,591 |
| | $ 20,042 |
In addition, FMR reimbursed a portion of the Fund's operating expenses during the period in the amount of $9,498.
Commissions paid to certain brokers with whom FMR, or its affiliates, places trades on behalf of the Fund include an amount in addition to trade execution, which may be rebated back to the Fund to offset certain expenses. This amount totaled $39,394 for the period. In addition, through arrangements with the Fund's custodian, credits realized as a result of uninvested cash balances were used to reduce the Fund's expenses. During the period, these credits reduced the Fund's custody expenses by $25.
Annual Report
Notes to Financial Statements - continued
9. Distributions to Shareholders.
Distributions to shareholders of each class were as follows:
Years ended October 31, | 2013 | 2012 |
From net investment income | | |
Class A | $ 127,604 | $ 208,264 |
Class T | 40,329 | 69,950 |
Class B | 540 | 6,357 |
Class C | 6,860 | 20,258 |
International Small Cap Opportunities | 3,098,688 | 4,562,121 |
Institutional Class | 37,075 | 19,730 |
Total | $ 3,311,096 | $ 4,886,680 |
From net realized gain | | |
Class A | $ 8,286 | $ 18,763 |
Class T | 3,734 | 8,968 |
Class B | 900 | 2,355 |
Class C | 3,118 | 7,235 |
International Small Cap Opportunities | 153,400 | 330,589 |
Institutional Class | 1,817 | 1,409 |
Total | $ 171,255 | $ 369,319 |
10. Share Transactions.
Transactions for each class of shares were as follows:
| Shares | Dollars |
Years ended October 31, | 2013 | 2012 | 2013 | 2012 |
Class A | | | | |
Shares sold | 373,515 | 245,367 | $ 4,517,568 | $ 2,443,449 |
Reinvestment of distributions | 10,878 | 21,375 | 119,442 | 198,575 |
Shares redeemed | (460,010) | (495,775) | (5,504,745) | (4,923,741) |
Net increase (decrease) | (75,617) | (229,033) | $ (867,735) | $ (2,281,717) |
Class T | | | | |
Shares sold | 94,833 | 101,299 | $ 1,133,727 | $ 986,575 |
Reinvestment of distributions | 3,872 | 8,148 | 42,245 | 75,201 |
Shares redeemed | (152,245) | (246,162) | (1,813,542) | (2,450,796) |
Net increase (decrease) | (53,540) | (136,715) | $ (637,570) | $ (1,389,020) |
Class B | | | | |
Shares sold | 2,465 | 3,884 | $ 28,055 | $ 38,597 |
Reinvestment of distributions | 123 | 862 | 1,326 | 7,845 |
Shares redeemed | (83,897) | (59,335) | (970,172) | (579,917) |
Net increase (decrease) | (81,309) | (54,589) | $ (940,791) | $ (533,475) |
Class C | | | | |
Shares sold | 106,942 | 69,065 | $ 1,277,851 | $ 669,794 |
Reinvestment of distributions | 870 | 2,800 | 9,335 | 25,455 |
Shares redeemed | (130,535) | (170,268) | (1,517,604) | (1,664,901) |
Net increase (decrease) | (22,723) | (98,403) | $ (230,418) | $ (969,652) |
Annual Report
10. Share Transactions - continued
| Shares | Dollars |
Years ended October 31, | 2013 | 2012 | 2013 | 2012 |
International Small Cap Opportunities | | | | |
Shares sold | 13,306,080 | 5,283,408 | $ 163,920,015 | $ 53,067,911 |
Reinvestment of distributions | 279,367 | 495,697 | 3,092,593 | 4,634,765 |
Shares redeemed | (6,858,430) | (8,350,807) | (83,019,406) | (84,356,251) |
Net increase (decrease) | 6,727,017 | (2,571,702) | $ 83,993,202 | $ (26,653,575) |
Institutional Class | | | | |
Shares sold | 107,232 | 348,073 | $ 1,308,852 | $ 3,541,043 |
Reinvestment of distributions | 3,187 | 1,709 | 35,307 | 15,997 |
Shares redeemed | (121,854) | (70,045) | (1,389,261) | (705,927) |
Net increase (decrease) | (11,435) | 279,737 | $ (45,102) | $ 2,851,113 |
11. Other.
The Fund's organizational documents provide former and current trustees and officers with a limited indemnification against liabilities arising in connection with the performance of their duties to the Fund. In the normal course of business, the Fund may also enter into contracts that provide general indemnifications. The Fund's maximum exposure under these arrangements is unknown as this would be dependent on future claims that may be made against the Fund. The risk of material loss from such claims is considered remote.
Annual Report
To the Trustees of Fidelity Investment Trust and Shareholders of Fidelity International Small Cap Opportunities Fund:
We have audited the accompanying statement of assets and liabilities of Fidelity International Small Cap Opportunities Fund (the Fund), a fund of Fidelity Investment Trust, including the schedule of investments, as of October 31, 2013, and the related statement of operations for the year then ended, the statement of changes in net assets for each of the two years in the period then ended, and the financial highlights for each of the five years in the period then ended. These financial statements and financial highlights are the responsibility of the Fund's management. Our responsibility is to express an opinion on these financial statements and financial highlights based on our audits.
We conducted our audits in accordance with the standards of the Public Company Accounting Oversight Board (United States). Those standards require that we plan and perform the audit to obtain reasonable assurance about whether the financial statements and financial highlights are free of material misstatement. The Fund is not required to have, nor were we engaged to perform, an audit of its internal control over financial reporting. Our audits included consideration of internal control over financial reporting as a basis for designing audit procedures that are appropriate in the circumstances, but not for the purpose of expressing an opinion on the effectiveness of the Fund's internal control over financial reporting. Accordingly, we express no such opinion. An audit also includes examining, on a test basis, evidence supporting the amounts and disclosures in the financial statements, assessing the accounting principles used and significant estimates made by management, as well as evaluating the overall financial statement presentation. Our procedures included confirmation of securities owned as of October 31, 2013, by correspondence with the custodians and brokers; where replies were not received from brokers, we performed other auditing procedures. We believe that our audits provide a reasonable basis for our opinion.
In our opinion, the financial statements and financial highlights referred to above present fairly, in all material respects, the financial position of Fidelity International Small Cap Opportunities Fund as of October 31, 2013, the results of its operations for the year then ended, the changes in its net assets for each of the two years in the period then ended, and the financial highlights for each of the five years in the period then ended, in conformity with accounting principles generally accepted in the United States of America.
DELOITTE & TOUCHE LLP
Boston, Massachusetts
December 12, 2013
Annual Report
The Trustees, Member of the Advisory Board, and executive officers of the trust and fund, as applicable, are listed below. The Board of Trustees governs the fund and is responsible for protecting the interests of shareholders. The Trustees are experienced executives who meet periodically throughout the year to oversee the fund's activities, review contractual arrangements with companies that provide services to the fund, oversee management of the risks associated with such activities and contractual arrangements, and review the fund's performance. Except for James C. Curvey, Ned C. Lautenbach, Ronald P. O'Hanley, and William S. Stavropoulos, each of the Trustees oversees 171 funds. Mr. Curvey oversees 394 funds. Mr. Lautenbach, Mr. O'Hanley, and Mr. Stavropoulos each oversees 245 funds.
The Trustees hold office without limit in time except that (a) any Trustee may resign; (b) any Trustee may be removed by written instrument, signed by at least two-thirds of the number of Trustees prior to such removal; (c) any Trustee who requests to be retired or who has become incapacitated by illness or injury may be retired by written instrument signed by a majority of the other Trustees; and (d) any Trustee may be removed at any special meeting of shareholders by a two-thirds vote of the outstanding voting securities of the trust. Each Trustee who is not an interested person of the trust and the fund (as defined in the 1940 Act) (Independent Trustee), shall retire not later than the last day of the calendar year in which his or her 75th birthday occurs. The Independent Trustees may waive this mandatory retirement age policy with respect to individual Trustees. The executive officers and Advisory Board Member hold office without limit in time, except that any officer and Advisory Board Member may resign or may be removed by a vote of a majority of the Trustees at any regular meeting or any special meeting of the Trustees. Except as indicated, each individual has held the office shown or other offices in the same company for the past five years.
Experience, Skills, Attributes, and Qualifications of the Fund's Trustees. The Governance and Nominating Committee has adopted a statement of policy that describes the experience, qualifications, attributes, and skills that are necessary and desirable for potential Independent Trustee candidates (Statement of Policy). The Board believes that each Trustee satisfied at the time he or she was initially elected or appointed a Trustee, and continues to satisfy, the standards contemplated by the Statement of Policy. The Governance and Nominating Committee also engages professional search firms to help identify potential Independent Trustee candidates who have the experience, qualifications, attributes, and skills consistent with the Statement of Policy. From time to time, additional criteria based on the composition and skills of the current Independent Trustees, as well as experience or skills that may be appropriate in light of future changes to board composition, business conditions, and regulatory or other developments, have also been considered by the professional search firms and the Governance and Nominating Committee. In addition, the Board takes into account the Trustees' commitment and participation in Board and committee meetings, as well as their leadership of standing and ad hoc committees throughout their tenure.
Annual Report
In determining that a particular Trustee was and continues to be qualified to serve as a Trustee, the Board has considered a variety of criteria, none of which, in isolation, was controlling. The Board believes that, collectively, the Trustees have balanced and diverse experience, qualifications, attributes, and skills, which allow the Board to operate effectively in governing the fund and protecting the interests of shareholders. Information about the specific experience, skills, attributes, and qualifications of each Trustee, which in each case led to the Board's conclusion that the Trustee should serve (or continue to serve) as a trustee of the fund, is provided below.
Board Structure and Oversight Function. James C. Curvey is an interested person (as defined in the 1940 Act) and currently serves as Chairman. The Trustees have determined that an interested Chairman is appropriate and benefits shareholders because an interested Chairman has a personal and professional stake in the quality and continuity of services provided to the fund. Independent Trustees exercise their informed business judgment to appoint an individual of their choosing to serve as Chairman, regardless of whether the Trustee happens to be independent or a member of management. The Independent Trustees have determined that they can act independently and effectively without having an Independent Trustee serve as Chairman and that a key structural component for assuring that they are in a position to do so is for the Independent Trustees to constitute a substantial majority for the Board. The Independent Trustees also regularly meet in executive session. Ned C. Lautenbach serves as Chairman of the Independent Trustees and as such (i) acts as a liaison between the Independent Trustees and management with respect to matters important to the Independent Trustees and (ii) with management prepares agendas for Board meetings.
Fidelity funds are overseen by different Boards of Trustees. The fund's Board oversees Fidelity's equity and high income funds and another Board oversees Fidelity's investment-grade bond, money market, and asset allocation funds. The asset allocation funds may invest in Fidelity funds overseen by the fund's Board. The use of separate Boards, each with its own committee structure, allows the Trustees of each group of Fidelity funds to focus on the unique issues of the funds they oversee, including common research, investment, and operational issues. On occasion, the separate Boards establish joint committees to address issues of overlapping consequences for the Fidelity funds overseen by each Board.
The Trustees operate using a system of committees to facilitate the timely and efficient consideration of all matters of importance to the Trustees, the fund, and fund shareholders and to facilitate compliance with legal and regulatory requirements and oversight of the fund's activities and associated risks. The Board, acting through its committees, has charged FMR and its affiliates with (i) identifying events or circumstances the occurrence of which could have demonstrably adverse effects on the fund's business and/or reputation; (ii) implementing processes and controls to lessen the possibility that such events or circumstances occur or to mitigate the effects of such events or circumstances if they do occur; and (iii) creating and maintaining a system designed to evaluate continuously business and market conditions in order to facilitate the identification and implementation processes described in (i) and (ii) above. Because the day-to-day operations and activities of the fund are carried out by or through FMR, its affiliates and other service providers, the fund's exposure to risks is mitigated but not eliminated by the processes overseen by the Trustees. While each of the Board's committees has responsibility for overseeing different aspects of the fund's activities, oversight is exercised primarily through the Operations, Audit, and Compliance Committees. In addition, the Independent Trustees have worked with FMR to enhance the Board's oversight of investment and financial risks, legal and regulatory risks, technology risks, and operational risks, including the development of additional risk reporting to the Board. For example, a working group comprised of Independent Trustees and FMR has worked and continues to work to review the Fidelity funds' valuation-related activities, reporting and risk management. Appropriate personnel, including but not limited to the fund's Chief Compliance Officer (CCO), FMR's internal auditor, the independent accountants, the fund's Treasurer and portfolio management personnel, make periodic reports to the Board's committees, as appropriate, including an annual review of FMR's risk management program for the Fidelity funds. The responsibilities of each standing committee, including their oversight responsibilities, are described further under "Standing Committees of the Fund's Trustees."
Annual Report
Trustees and Officers - continued
The fund's Statement of Additional Information (SAI) includes more information about the Trustees. To request a free copy, call Fidelity at 1-877-208-0098.
Interested Trustees*:
Correspondence intended for each Trustee who is an interested person may be sent to Fidelity Investments, 245 Summer Street, Boston, Massachusetts 02210.
Name, Year of Birth; Principal Occupations and Other Relevant Experience+ |
James C. Curvey (1935) |
Year of Election or Appointment: 2007 Trustee Chairman of the Board of Trustees |
| Mr. Curvey also serves as Trustee of other Fidelity funds. Mr. Curvey is a Director of Fidelity Investments Money Management, Inc. (2009-present), Director of Fidelity Research & Analysis Co. (2009-present) and Director of FMR and FMR Co., Inc. (2007-present). Mr. Curvey is also Vice Chairman (2007-present) and Director of FMR LLC. In addition, Mr. Curvey serves as an Overseer for the Boston Symphony Orchestra and a member of the Trustees of Villanova University. Previously, Mr. Curvey was the Vice Chairman (2006-2007) and Director (2000-2007) of FMR Corp. |
Ronald P. O'Hanley (1957) |
Year of Election or Appointment: 2011 Trustee |
| Mr. O'Hanley also serves as Trustee of other Fidelity funds. He is Director of Fidelity SelectCo, LLC (2013-present), FMR Co., Inc. (2010-present), Director of Fidelity Investments Money Management, Inc. (2010-present), Director of Fidelity Research & Analysis Company (2010-present), President of Fidelity Asset Management and Corporate Services and a Member of Fidelity's Executive Committee (2010-present). Previously, Mr. O'Hanley served as President and Chief Executive Officer of BNY Mellon Asset Management (2007-2010). Mr. O'Hanley also served as Vice Chairman of Bank New York Mellon Corp. and a member of that firm's Executive Committee. Prior to the 2007 merger of The Bank of New York and Mellon Financial Corporation, he was Vice Chairman of Mellon Financial Corporation and President and Chief Executive Officer of Mellon Asset Management. He joined Mellon in February 1997. Mr. O'Hanley currently serves as Chairman of the Boston Public Library Foundation Board of Directors and sits on the Board of Directors of Beth Israel Deaconess Medical Center, the Board of Trustees of the Marine Biological Laboratory and the Advisory Board of the Maxwell School of Citizenship and Public Administration at Syracuse University. Mr. O'Hanley also chairs the Council on Asset Management for the Financial Services Roundtable and is a member of the Board of Directors of Institutional Investor's U.S. Institute. |
* Trustees have been determined to be "Interested Trustees" by virtue of, among other things, their affiliation with the trust or various entities under common control with FMR.
+ The information above includes each Trustee's principal occupation during the last five years and other information relating to the experience, attributes, and skills relevant to each Trustee's qualifications to serve as a Trustee, which led to the conclusion that each Trustee should serve as a Trustee for the fund.
Annual Report
Trustees and Officers - continued
Independent Trustees:
Correspondence intended for each Independent Trustee (that is, the Trustees other than the Interested Trustees) may be sent to Fidelity Investments, P.O. Box 55235, Boston, Massachusetts 02205-5235.
Name, Year of Birth; Principal Occupations and Other Relevant Experience+ |
Dennis J. Dirks (1948) |
Year of Election or Appointment: 2005 Trustee |
| Mr. Dirks also serves as Trustee of other Fidelity funds. Prior to his retirement in May 2003, Mr. Dirks was Chief Operating Officer and a member of the Board of The Depository Trust & Clearing Corporation (DTCC). He also served as President, Chief Operating Officer, and Board member of The Depository Trust Company (DTC) and President and Board member of the National Securities Clearing Corporation (NSCC). In addition, Mr. Dirks served as Chief Executive Officer and Board member of the Government Securities Clearing Corporation, Chief Executive Officer and Board member of the Mortgage-Backed Securities Clearing Corporation, as a Trustee and a member of the Finance Committee of Manhattan College (2005-2008), and as a Trustee and a member of the Finance Committee of AHRC of Nassau County (2006-2008). Mr. Dirks is a member of the Independent Directors Council (IDC) Governing Council (2010-present) and Board of Directors for The Brookville Center for Children's Services, Inc. (2009-present). |
Alan J. Lacy (1953) |
Year of Election or Appointment: 2008 Trustee |
| Mr. Lacy also serves as Trustee of other Fidelity funds. Mr. Lacy serves as Senior Adviser (2007-present) of Oak Hill Capital Partners, L.P. (private equity). Mr. Lacy also served as Chief Executive Officer (2000-2005) and Vice Chairman (2005-2006) of Sears Holdings Corporation and Sears, Roebuck and Co. (retail). In addition, Mr. Lacy serves as a member of the Board of Directors of Dave & Buster's Entertainment, Inc. (restaurant and entertainment complexes, 2010-present), Earth Fare, Inc. (retail grocery, 2012-present), The Hillman Companies, Inc. (hardware wholesalers, 2010-present), and Bristol-Myers Squibb Company (global pharmaceuticals, 2008-present). Mr. Lacy is a member of the Board of Trustees of The National Parks Conservation Association (2006-present). Previously, Mr. Lacy served as Chairman of the Board of Trustees of the National Parks Conservation Association (2008-2011) and as a member of the Board of Directors for the Western Union Company (global money transfer, 2006-2011). |
Ned C. Lautenbach (1944) |
Year of Election or Appointment: 2000 Trustee Chairman of the Independent Trustees |
| Mr. Lautenbach also serves as Trustee of other Fidelity funds. Mr. Lautenbach currently serves as the Lead Director of the Eaton Corporation Board of Directors (diversified industrial, 1997-present). Mr. Lautenbach is Chairman of the Board of Directors of the Philharmonic Center for the Arts in Naples, Florida (2012-present) and a member of the Council on Foreign Relations (1994-present). Previously, Mr. Lautenbach was a Partner/Advisory Partner at Clayton, Dubilier & Rice, LLC (private equity investment, 1998-2010), as well as a Director of Sony Corporation (2006-2007). |
Joseph Mauriello (1944) |
Year of Election or Appointment: 2008 Trustee |
| Mr. Mauriello also serves as Trustee of other Fidelity funds. Prior to his retirement in January 2006, Mr. Mauriello served in numerous senior management positions including Deputy Chairman and Chief Operating Officer (2004-2005), and Vice Chairman of Financial Services (2002-2004) of KPMG LLP US (professional services, 1965-2005). Mr. Mauriello currently serves as a member of the Board of Directors of XL Group plc. (global insurance and re-insurance, 2006-present). Previously, Mr. Mauriello served as a Director of the Hamilton Funds of the Bank of New York (2006-2007) and of Arcadia Resources Inc. (health care services and products, 2007-2012). |
Robert W. Selander (1950) |
Year of Election or Appointment: 2011 Trustee |
| Mr. Selander also serves as Trustee of other Fidelity funds. Previously, Mr. Selander served as a Member of the Advisory Board of other Fidelity funds (2011), and Executive Vice Chairman (2010), Chief Executive Officer (2009-2010), and President and Chief Executive Officer (1997-2009) of Mastercard, Inc. |
Cornelia M. Small (1944) |
Year of Election or Appointment: 2005 Trustee |
| Ms. Small also serves as Trustee of other Fidelity funds. Ms. Small is a member of the Board of Directors (2009-present) and Chair of the Investment Committee (2010-present) of the Teagle Foundation. Ms. Small also serves on the Investment Committee of the Berkshire Taconic Community Foundation (2008-present). Previously, Ms. Small served as Chairperson (2002-2008) and a member of the Investment Committee and Chairperson (2008-2012) and a member of the Board of Trustees of Smith College. In addition, Ms. Small served as Chief Investment Officer, Director of Global Equity Investments, and a member of the Board of Directors of Scudder, Stevens & Clark and Scudder Kemper Investments. |
William S. Stavropoulos (1939) |
Year of Election or Appointment: 2001 Trustee Vice Chairman of the Independent Trustees |
| Mr. Stavropoulos also serves as Trustee of other Fidelity funds. Mr. Stavropoulos serves as President and Founder of the Michigan Baseball Foundation, the Great Lakes Loons (2007-present). Mr. Stavropoulos is Chairman Emeritus of the Board of Directors of The Dow Chemical Company, where he previously served in numerous senior management positions, including President, CEO (1995-2000; 2002-2004), Chairman of the Executive Committee (2000-2006), and as a member of the Board of Directors (1990-2006). Currently, Mr. Stavropoulos is Chairman of the Board of Directors of Univar Inc. (global distributor of commodity and specialty chemicals), a Director of Teradata Corporation (data warehousing and technology solutions), and Maersk Inc. (industrial conglomerate), and a member of the Advisory Board for Metalmark Capital LLC (private equity investment, 2005-present). Mr. Stavropoulos is an operating advisor to Clayton, Dubilier & Rice, LLC (private equity investment). In addition, Mr. Stavropoulos is a member of the University of Notre Dame Advisory Council for the College of Science, a Trustee of the Rollin L. Gerstacker Foundation, and a Director of the Naples Philharmonic Center for the Arts. Previously, Mr. Stavropoulos served as a Director of Chemical Financial Corporation (bank holding company, 1993-2012) and Tyco International, Ltd. (multinational manufacturing and services, 2007-2012). |
David M. Thomas (1949) |
Year of Election or Appointment: 2008 Trustee |
| Mr. Thomas also serves as Trustee of other Fidelity funds. Mr. Thomas serves as Non-Executive Chairman of the Board of Directors of Fortune Brands Home and Security (home and security products, 2011-present), and as a member of the Board of Directors of Interpublic Group of Companies, Inc. (marketing communication, 2004-present). Previously, Mr. Thomas served as Executive Chairman (2005-2006) and Chairman and Chief Executive Officer (2000-2005) of IMS Health, Inc. (pharmaceutical and healthcare information solutions), and a Director of Fortune Brands, Inc. (consumer products, 2000-2011). |
+ The information above includes each Trustee's principal occupation during the last five years and other information relating to the experience, attributes, and skills relevant to each Trustee's qualifications to serve as a Trustee, which led to the conclusion that each Trustee should serve as a Trustee for the fund.
Advisory Board Member and Executive Officers:
Correspondence intended for each executive officer and Peter S. Lynch may be sent to Fidelity Investments, 245 Summer Street, Boston, Massachusetts 02210. Executive officers appear below in alphabetical order.
Name, Year of Birth; Principal Occupation |
Peter S. Lynch (1944) |
Year of Election or Appointment: 2003 Member of the Advisory Board |
| Mr. Lynch also serves as Member of the Advisory Board of other Fidelity funds. Mr. Lynch is Vice Chairman and a Director of FMR and FMR Co., Inc. In addition, Mr. Lynch serves as a Trustee of Boston College and as the Chairman of the Inner-City Scholarship Fund. Previously, Mr. Lynch served on the Special Olympics International Board of Directors (1997-2006). |
Elizabeth Paige Baumann (1968) |
Year of Election or Appointment: 2012 Anti-Money Laundering (AML) Officer |
| Ms. Baumann also serves as AML Officer of other funds. She is Chief AML Officer of FMR LLC (2012-present) and is an employee of Fidelity Investments. Previously, Ms. Baumann served as Vice President and Deputy Anti-Money Laundering Officer (2007-2012). |
William C. Coffey (1969) |
Year of Election or Appointment: 2009 Assistant Secretary |
| Mr. Coffey also serves as Assistant Secretary of other funds. He is Senior Vice President and Deputy General Counsel of FMR LLC (2010-present), and is an employee of Fidelity Investments. Previously, Mr. Coffey served as Vice President and Associate General Counsel of FMR LLC (2005-2009). |
Jonathan Davis (1968) |
Year of Election or Appointment: 2010 Assistant Treasurer |
| Mr. Davis also serves as Assistant Treasurer of other funds. Mr. Davis is an employee of Fidelity Investments. Previously, Mr. Davis served as Vice President and Associate General Counsel of FMR LLC (2003-2010). |
Adrien E. Deberghes (1967) |
Year of Election or Appointment: 2008 Deputy Treasurer |
| Mr. Deberghes also serves as an officer of other funds. He is an employee of Fidelity Investments (2008-present). Prior to joining Fidelity Investments, Mr. Deberghes was Senior Vice President of Mutual Fund Administration at State Street Corporation (2007-2008), Senior Director of Mutual Fund Administration at Investors Bank & Trust (2005-2007), and Director of Finance for Dunkin' Brands (2000-2005). |
Stephanie J. Dorsey (1969) |
Year of Election or Appointment: 2010 Assistant Treasurer |
| Ms. Dorsey also serves as an officer of other funds. She is an employee of Fidelity Investments (2008-present) and has served in other fund officer roles. Prior to joining Fidelity Investments, Ms. Dorsey served as Treasurer (2004-2008) of the JPMorgan Mutual Funds and Vice President (2004-2008) of JPMorgan Chase Bank. |
Scott C. Goebel (1968) |
Year of Election or Appointment: 2008 Secretary and Chief Legal Officer (CLO) |
| Mr. Goebel serves as Secretary and CLO of other funds. Mr. Goebel also serves as Secretary of Fidelity Investments Money Management, Inc. (FIMM) (2010-present) and Fidelity Research and Analysis Company (FRAC) (2010-present); General Counsel, Secretary, and Senior Vice President of FMR (2008-present) and FMR Co., Inc. (2008-present); Chief Legal Officer of Fidelity Management & Research (Hong Kong) Limited (2008-present) and Assistant Secretary of Fidelity Management & Research (Japan) Inc. (2008-present), and Fidelity Management & Research (U.K.) Inc. (2008-present). Previously, Mr. Goebel served as Secretary and CLO of other Fidelity funds (2008-2013), Assistant Secretary of FIMM (2008-2010), FRAC (2008-2010), and certain funds (2007-2008); and as Vice President and Secretary of Fidelity Distributors Corporation (FDC) (2005-2007). Mr. Goebel has been employed by FMR LLC or an affiliate since 2001. |
Joseph A. Hanlon (1968) |
Year of Election or Appointment: 2012 Chief Compliance Officer |
| Mr. Hanlon also serves as Chief Compliance Officer of other funds. Mr. Hanlon serves as Compliance Officer of FMR, FMR Co., Inc., Fidelity Investments Money Management, Inc. (FIMM), Fidelity Research and Analysis Company (FRAC), and Fidelity Management & Research (Hong Kong) (2009-present), as Senior Vice President of the Fidelity Asset Management Division (2009-present), and is an employee of Fidelity Investments. Previously, Mr. Hanlon served as Compliance Officer of Fidelity Management & Research (Japan) Inc. (2009-2013), Strategic Advisers, Inc. (2009-2013), and Fidelity Management & Research (U.K.) Inc. (2009-2013). |
Bruce T. Herring (1965) |
Year of Election or Appointment: 2006 Vice President of certain Equity Funds |
| Mr. Herring also serves as Vice President of other funds. He serves as Chief Investment Officer of Fidelity Global Asset Allocation (GAA) (2013-present), Chief Investment Officer and Director of Fidelity Management & Research (U.K.) Inc. (2010-present), Group Chief Investment Officer of FMR, and President of Fidelity Research & Analysis Company (2010-present). Previously, Mr. Herring served as Vice President (2005-2006) and Senior Vice President (2006-2007) of Fidelity Management & Research Company, Vice President of FMR Co., Inc. (2001-2007), and as a portfolio manager for Fidelity U.S. Equity Funds. |
Brian B. Hogan (1964) |
Year of Election or Appointment: 2009 Vice President |
| Mr. Hogan also serves as Vice President of other funds. Mr. Hogan serves as President of FMR's Equity Division (2009-present). Previously, Mr. Hogan served as Senior Vice President, Equity Research of FMR (2006-2009) and as a portfolio manager. |
Chris Maher (1972) |
Year of Election or Appointment: 2013 Assistant Treasurer |
| Mr. Maher serves as Assistant Treasurer of other funds. Mr. Maher is Vice President of Valuation Oversight and is an employee of Fidelity Investments. Previously, Mr. Maher served as Vice President of Asset Management Compliance (2013), Vice President of FMR's Program Management Group (2010-2013), and Vice President of Valuation Oversight (2008-2010). |
Christine Reynolds (1958) |
Year of Election or Appointment: 2008 Chief Financial Officer |
| Ms. Reynolds also serves as Chief Financial Officer of other funds. Ms. Reynolds became President of Fidelity Pricing and Cash Management Services (FPCMS) in August 2008. Ms. Reynolds served as Chief Operating Officer of FPCMS (2007-2008). Previously, Ms. Reynolds served as President, Treasurer, and Anti-Money Laundering officer of the Fidelity funds (2004-2007). |
Kenneth B. Robins (1969) |
Year of Election or Appointment: 2008 President and Treasurer |
| Mr. Robins also serves as an officer of other funds. Mr. Robins serves as Executive Vice President of Fidelity Investments Money Management, Inc. (FIMM) (2013-present) and is an employee of Fidelity Investments (2004-present). Previously, Mr. Robins served in other fund officer roles. |
Gary W. Ryan (1958) |
Year of Election or Appointment: 2005 Assistant Treasurer |
| Mr. Ryan also serves as Assistant Treasurer of other funds. Mr. Ryan is an employee of Fidelity Investments and has served in other fund officer roles. Previously, Mr. Ryan served as Vice President of Fund Reporting in Fidelity Pricing and Cash Management Services (FPCMS) (1999-2005). |
Stephen Sadoski (1971) |
Year of Election or Appointment: 2012 Deputy Treasurer |
| Mr. Sadoski also serves as Deputy Treasurer of other funds. He is an employee of Fidelity Investments (2012-present) and has served in another fund officer role. Prior to joining Fidelity Investments, Mr. Sadoski served as an assistant chief accountant in the Division of Investment Management of the Securities and Exchange Commission (SEC) (2009-2012) and as a senior manager at Deloitte & Touche LLP (1997-2009). |
Stacie M. Smith (1974) |
Year of Election or Appointment: 2013 Deputy Treasurer |
| Ms. Smith also serves as an officer of other funds. She is an employee of Fidelity Investments (2009-present) and has served in other fund officer roles. Prior to joining Fidelity Investments, Ms. Smith served as Senior Audit Manager of Ernst & Young LLP (1996-2009). |
Renee Stagnone (1975) |
Year of Election or Appointment: 2013 Deputy Treasurer |
| Ms. Stagnone also serves as Deputy Treasurer of other funds. Ms. Stagnone is an employee of Fidelity Investments. |
Joseph F. Zambello (1957) |
Year of Election or Appointment: 2011 Deputy Treasurer |
| Mr. Zambello also serves as Deputy Treasurer of other funds. Mr. Zambello is an employee of Fidelity Investments. Previously, Mr. Zambello served as Vice President of FMR's Program Management Group (2009-2011) and Vice President of the Transfer Agent Oversight Group (2005-2009). |
Annual Report
The Board of Trustees of Advisor International Small Cap Opportunities Fund voted to pay to shareholders of record at the opening of business on record date, the following distributions per share derived from capital gains realized from sales of portfolio securities, and dividends derived from net investment income:
| Pay Date | Record Date | Dividends | Capital Gains |
Institutional Class | 12/09/13 | 12/06/13 | $0.092 | $0.079 |
Institutional Class designates 10% of the dividends distributed in December 2012 during the fiscal year as qualifying for the dividends-received deduction for corporate shareholders.
Institutional Class designates 100% of the dividends distributed in December 2012 during the fiscal year as amounts which may be taken into account as a dividend for purposes of the maximum rate under section 1(h) (11) of the Internal Revenue Code.
The amounts per share which represent income derived from sources within, and taxes paid to, foreign countries or possessions of the United States are as follows:
| Pay Date | Income | Taxes |
Institutional Class | 12/10/2012 | 0.121 | 0.0136 |
The fund will notify shareholders in January 2014 of amounts for use in preparing 2013 income tax returns.
Annual Report
Board Approval of Investment Advisory Contracts and Management Fees
Fidelity International Small Cap Opportunities Fund
Each year, the Board of Trustees, including the Independent Trustees (together, the Board), votes on the renewal of the management contract and sub-advisory agreements (together, the Advisory Contracts) for the fund. The Board, assisted by the advice of fund counsel and Independent Trustees' counsel, requests and considers a broad range of information relevant to the renewal of the Advisory Contracts throughout the year.
The Board meets regularly and, at each of its meetings, covers an extensive agenda of topics and materials and considers factors that are relevant to its annual consideration of the renewal of the fund's Advisory Contracts, including the services and support provided to the fund and its shareholders. The Board has established various standing committees, each composed of and chaired by Independent Trustees with varying backgrounds, to which the Board has assigned specific subject matter responsibilities in order to enhance effective decision-making by the Board. The Board, acting directly and through its Committees, requests and receives information concerning the annual consideration of the renewal of the fund's Advisory Contracts. The Board also meets as needed to consider matters specifically related to the Board's annual consideration of the renewal of Advisory Contracts. Members of the Board may also meet with trustees of other Fidelity funds through ad hoc joint committees to discuss certain matters relevant to the Fidelity funds.
At its July 2013 meeting, the Board, including the Independent Trustees, unanimously determined to renew the fund's Advisory Contracts. In reaching its determination, the Board considered all factors it believed relevant, including (i) the nature, extent, and quality of the services to be provided to the fund and its shareholders (including the investment performance of the fund); (ii) the competitiveness of the fund's management fee and total expense ratio relative to peer funds; (iii) the total costs of the services to be provided by and the profits to be realized by Fidelity from its relationship with the fund; (iv) the extent to which economies of scale exist and would be realized as the fund grows; and (v) whether fee levels reflect these economies of scale, if any, for the benefit of fund shareholders.
In considering whether to renew the Advisory Contracts for the fund, the Board reached a determination, with the assistance of fund counsel and Independent Trustees' counsel and through the exercise of its business judgment, that the renewal of the Advisory Contracts was in the best interests of the fund and its shareholders and that the compensation payable under the Advisory Contracts was fair and reasonable. The Board's decision to renew the Advisory Contracts was not based on any single factor, but rather was based on a comprehensive consideration of all the information provided to the Board at its meetings throughout the year. The Board, in reaching its determination to renew the Advisory Contracts, was aware that shareholders in the fund have a broad range of investment choices available to them, including a wide choice among mutual funds offered by Fidelity's competitors, and that the fund's shareholders, who have the opportunity to review and weigh the disclosure provided by the fund in its prospectus and other public disclosures, have chosen to invest in this fund, which is a part of the Fidelity family of funds.
Annual Report
Board Approval of Investment Advisory Contracts and
Management Fees - continued
Nature, Extent, and Quality of Services Provided. The Board considered the staffing within the investment adviser, Fidelity Management & Research Company (FMR), and the sub-advisers (together, the Investment Advisers) as it relates to the fund, including the backgrounds of the fund's investment personnel, and also considered the fund's investment objective, strategies, and related investment philosophy. The Independent Trustees also had discussions with senior management of Fidelity's investment operations and investment groups. The Board considered the structure of the portfolio manager compensation program and whether this structure provides appropriate incentives to act in the best interests of the fund.
Resources Dedicated to Investment Management and Support Services. The Board and the Fund Oversight and Research Committees reviewed the general qualifications and capabilities of the Investment Advisers' investment staff, including its size, education, experience, and resources, as well as the Investment Advisers' approach to recruiting, training, managing, and compensating investment personnel. The Board noted that FMR has continued to increase the resources devoted to non-U.S. offices, including expansion of Fidelity's global investment organization. The Board also noted that Fidelity's analysts have extensive resources, tools and capabilities that allow them to conduct sophisticated quantitative and fundamental analysis, as well as credit analysis of issuers, counterparties and guarantors. Further, the Board believes that Fidelity's investment professionals have sufficient access to global information and data so as to provide competitive investment results over time, and that those professionals also have access to sophisticated tools that permit them to assess portfolio construction and risk and performance attribution characteristics continuously, as well as to transmit new information and research conclusions rapidly around the world. Additionally, in its deliberations, the Board considered the Investment Advisers' trading and risk management capabilities and resources, which are an integral part of the investment management process.
Shareholder and Administrative Services. The Board considered (i) the nature, extent, quality, and cost of advisory, administrative, and shareholder services performed by the Investment Advisers and their affiliates under the Advisory Contracts and under separate agreements covering transfer agency, pricing and bookkeeping, and securities lending services for the fund; (ii) the nature and extent of the supervision of third party service providers, principally custodians and subcustodians; and (iii) the resources devoted to, and the record of compliance with, the fund's compliance policies and procedures. The Board also reviewed the allocation of fund brokerage, including allocations to brokers affiliated with the Investment Advisers, the use of brokerage commissions to pay fund expenses, and the use of "soft" commission dollars to pay for research services.
Annual Report
The Board noted that the growth of fund assets over time across the complex allows Fidelity to reinvest in the development of services designed to enhance the value or convenience of the Fidelity funds as investment vehicles. These services include 24-hour access to account information and market information through telephone representatives and over the Internet, investor education materials and asset allocation tools, and the expanded availability of Fidelity Investor Centers.
Investment in a Large Fund Family. The Board considered the benefits to shareholders of investing in a Fidelity fund, including the benefits of investing in a fund that is part of a large family of funds offering a variety of investment disciplines and providing a large variety of mutual fund investor services. The Board noted that Fidelity had taken, or had made recommendations that resulted in the Fidelity funds taking, a number of actions over the previous year that benefited particular funds, including (i) continuing to dedicate additional resources to investment research and to the support of the senior management team that oversees asset management; (ii) persisting in efforts to enhance Fidelity's global research capabilities; (iii) launching new funds and making other enhancements to meet client needs for global and income-oriented solutions; (iv) continuing to launch dedicated lower cost underlying funds to meet portfolio construction needs related to expanding underlying fund options for Fidelity funds of funds, specifically for the Freedom Fund product lines; (v) rationalizing product lines and gaining increased efficiencies through the mergers of several funds into other funds; (vi) strengthening Fidelity's index fund offerings by reducing investment minimums and adopting or lowering existing expense caps for certain funds and classes; (vii) enhancing Global Asset Allocation product offerings by launching new funds and strategies, including "open architecture" target date funds that utilize affiliated and unaffiliated sub-advisers; (viii) modifying the eligibility criteria for Institutional Class shares of Advisor funds to increase their marketability to a portion of the defined contribution plan market; (ix) creating a new low-cost retirement share class for certain Advisor funds to appeal to large retirement plans; (x) transitioning the management of certain Fidelity commodity funds to Geode Capital Management LLC, a registered commodity pool operator, while retaining administrative responsibilities for the funds; (xi) reorganizing a number of funds; and (xii) taking steps toward establishing a new Fidelity adviser to manage sector-based funds and products.
Investment Performance. The Board considered whether the fund has operated in accordance with its investment objective, as well as its record of compliance with its investment restrictions and its performance history.
The Board took into account discussions with the Investment Advisers about fund investment performance that occur at Board meetings throughout the year. In this regard the Board noted that as part of regularly scheduled fund reviews and other reports to the Board on fund performance, the Board periodically considers annualized return information for the fund, for different time periods, measured against a securities market index ("benchmark index") and a peer group of mutual funds with similar objectives ("peer group"). In its evaluation of fund investment performance, the Board gave particular attention to information indicating changes in performance of certain Fidelity funds for specific time periods and the Investment Advisers' explanations for any overperformance or underperformance.
Annual Report
Board Approval of Investment Advisory Contracts and
Management Fees - continued
In addition to reviewing absolute and relative fund performance, the Independent Trustees periodically consider the appropriateness of fund performance metrics in evaluating the results achieved. In general, the Independent Trustees believe that fund performance should be evaluated based on net performance (after fees and expenses) of both the highest performing and lowest performing classes, where applicable, compared to appropriate benchmark indices, over appropriate time periods which may include full market cycles, and compared to peer groups, as applicable, over the same periods, taking into account relevant factors including the following: general market conditions; issuer-specific information; tactical opportunities for investment; and fund cash flows and other factors.
The Independent Trustees recognize that shareholders evaluate performance on a net basis over their own holding periods, for which one-, three-, and five-year periods are used as a proxy. For this reason, the performance information reviewed by the Board also included net cumulative calendar year total return information for the fund and an appropriate benchmark index and peer group for the most recent one-, three-, and five-year periods, as shown below. Returns are shown compared to the 25th percentile (top of box) and 75th percentile (bottom of box) of the peer universe. Returns of the benchmark index are "net MA," i.e., adjusted for tax withholding rates applicable to U.S.-based mutual funds organized as Massachusetts business trusts.
Annual Report
Fidelity International Small Cap Opportunities Fund

The Board also considered that the fund's management fee is subject to upward or downward adjustment depending upon whether, and to what extent, the fund's investment performance for the performance period exceeds, or is exceeded by, a securities index, thus leading to a performance adjustment for the same period. The Board noted that the performance adjustment provides FMR with a strong economic incentive to seek to achieve superior performance for the fund's shareholders and helps to more closely align the interests of FMR and the fund's shareholders.
Based on its review, the Board concluded that the nature, extent, and quality of services provided to the fund under the Advisory Contracts should benefit the fund's shareholders.
Competitiveness of Management Fee and Total Expense Ratio. The Board considered the fund's management fee and total expense ratio compared to "mapped groups" of competitive funds and classes. Fidelity creates "mapped groups" by combining similar Lipper investment objective categories that have comparable management fee characteristics. Combining Lipper investment objective categories aids the Board's management fee and total expense ratio comparisons by broadening the competitive group used for comparison and by reducing the number of universes to which various Fidelity funds are compared.
Management Fee. The Board considered two proprietary management fee comparisons for the 12-month periods shown in the chart below. The group of Lipper funds used by the Board for management fee comparisons is referred to below as the "Total Mapped Group." The Total Mapped Group is broader than the Lipper peer group used by the Board for performance comparisons because the Total Mapped Group combines several Lipper investment objective categories while the Lipper peer group does not. The Total Mapped Group comparison focuses on a fund's standing in terms of gross management fees before expense reimbursements or caps, and without giving effect to the fund's performance adjustment, relative to the total universe of funds with comparable investment mandates, regardless of whether their management fee structures also are comparable. Funds with comparable investment mandates offer exposure to similar types of securities. Funds with comparable management fee structures have similar management fee contractual arrangements (e.g., flat rate charged for advisory services, all-inclusive fee rate, etc.). "TMG %" represents the percentage of funds in the Total Mapped Group that had management fees that were lower than the fund's. For example, a TMG % of 19% means that 81% of the funds in the Total Mapped Group had higher management fees than the fund. The "Asset-Size Peer Group" (ASPG) comparison focuses on a fund's standing relative to a subset of non-Fidelity funds within the Total Mapped Group that are similar in size and management fee structure. The ASPG represents at least 15% of the funds in the Total Mapped Group with comparable asset size and management fee structures, subject to a minimum of 50 funds (or all funds in the Total Mapped Group if fewer than 50). Additional information, such as the ASPG quartile in which the fund's management fee ranked and the impact of the fund's performance adjustment, is also included in the chart and considered by the Board.
Annual Report
Board Approval of Investment Advisory Contracts and
Management Fees - continued
Fidelity International Small Cap Opportunities Fund

The Board noted that the fund's management fee ranked below the median of its Total Mapped Group and below the median of its ASPG for 2012. The Board also noted the effect of the fund's positive performance adjustment on the fund's management fee ranking.
Annual Report
Based on its review, the Board concluded that the fund's management fee is fair and reasonable in light of the services that the fund receives and the other factors considered.
Total Expense Ratio. In its review of each class's total expense ratio, the Board considered the fund's management fee as well as other fund or class expenses, as applicable, such as transfer agent fees, pricing and bookkeeping fees, fund-paid 12b-1 fees, and custodial, legal, and audit fees. The Board also noted the effects of any waivers and reimbursements on fees and expenses, as well as the impact of the fund's performance adjustment. As part of its review, the Board also considered the current and historical total expense ratios of each class of the fund compared to competitive fund median expenses. Each class of the fund is compared to those funds and classes in the Total Mapped Group (used by the Board for management fee comparisons) that have a similar sales load structure.
The Board noted that the total expense ratio of each of Class A and the retail class ranked below its competitive median for 2012 and the total expense ratio of each of Class T, Class B, Class C, and Institutional Class ranked above its competitive median for 2012. The Board considered that, in general, various factors can affect total expense ratios. The Board noted that the total expense ratio of Class T was above the competitive median primarily because of higher 12b-1 fees on Class T. Class T has a higher 12b-1 fee, but a lower front-end sales charge, than traditionally priced front-end sales charge classes. The Board considered that Class T is primarily sold load-waived in the retirement plan market where its 0.50% 12b-1 fee is comparable to competing no-load, higher 12b-1 fee classes designed specifically for retirement plans. The Board noted that the fund offers multiple classes, each of which has a different sales load and 12b-1 fee structure, and that the multiple structures are intended to offer a range of pricing options for the intermediary market. The Board also noted that the total expense ratios of the classes vary primarily by the level of their 12b-1 fees, although differences in transfer agent fees may also cause expenses to vary from class to class.
Fees Charged to Other Fidelity Clients. The Board also considered Fidelity fee structures and other information with respect to clients of FMR and its affiliates, such as other mutual funds advised or subadvised by FMR or its affiliates, pension plan clients, and other institutional clients. The Board noted the findings of the 2013 ad hoc joint committee (created with the board of other Fidelity funds), which reviewed and compared Fidelity's institutional investment advisory business with its business of providing services to the Fidelity funds, including the differences in services provided, fees charged, and costs incurred, as well as competition in their respective marketplaces.
Annual Report
Board Approval of Investment Advisory Contracts and
Management Fees - continued
Based on its review of total expense ratios and fees charged to other Fidelity clients, the Board concluded that the total expense ratio of each class of the fund was reasonable, although in some cases above the median of the universe presented for comparison, in light of the services that the fund and its shareholders receive and the other factors considered.
Costs of the Services and Profitability. The Board considered the revenues earned and the expenses incurred by Fidelity in conducting the business of developing, marketing, distributing, managing, administering and servicing the fund and servicing the fund's shareholders. The Board also considered the level of Fidelity's profits in respect of all the Fidelity funds.
On an annual basis, FMR presents to the Board Fidelity's profitability for the fund. Fidelity calculates the profitability for each fund, as well as aggregate profitability for groups of Fidelity funds and all Fidelity funds, using a series of detailed revenue and cost allocation methodologies which originate with the books and records of Fidelity on which Fidelity's audited financial statements are based. The Audit Committee of the Board reviews any significant changes from the prior year's methodologies.
PricewaterhouseCoopers LLP (PwC), independent registered public accounting firm and auditor to Fidelity and certain Fidelity funds, has been engaged annually by the Board as part of the Board's assessment of Fidelity's profitability analysis. PwC's engagement includes the review and assessment of the methodologies used by Fidelity in determining the revenues and expenses attributable to Fidelity's mutual fund business, and completion of agreed-upon procedures surrounding the mathematical accuracy of fund profitability and its conformity to allocation methodologies. After considering PwC's reports issued under the engagement and information provided by Fidelity, the Board concluded that while other allocation methods may also be reasonable, Fidelity's profitability methodologies are reasonable in all material respects.
The Board also reviewed Fidelity's non-fund businesses and fall-out benefits related to the mutual fund business as well as cases where Fidelity's affiliates may benefit from or be related to the fund's business.
The Board considered the costs of the services provided by and the profits realized by Fidelity in connection with the operation of the fund and was satisfied that the profitability was not excessive in the circumstances.
Economies of Scale. The Board considered whether there have been economies of scale in respect of the management of the Fidelity funds, whether the Fidelity funds (including the fund) have appropriately benefited from any such economies of scale, and whether there is potential for realization of any further economies of scale. The Board considered the extent to which the fund will benefit from economies of scale through increased services to the fund, through waivers or reimbursements, or through fee or expense reductions. The Board also noted that in 2009, it and the board of other Fidelity funds created an ad hoc committee (the Economies of Scale Committee) to analyze whether FMR attains economies of scale in respect of the management and servicing of the Fidelity funds, whether the Fidelity funds have appropriately benefited from such economies of scale, and whether there is potential for realization of any further economies of scale.
Annual Report
The Board recognized that the fund's management contract incorporates a "group fee" structure, which provides for lower group fee rates as total fund assets under FMR's management increase, and for higher group fee rates as total fund assets under FMR's management decrease. FMR calculates the group fee rates based on a tiered asset "breakpoint" schedule that varies based on asset class. The Board considered that the group fee is designed to deliver the benefits of economies of scale to fund shareholders when total Fidelity fund assets increase, even if assets of any particular fund are unchanged or have declined, because some portion of Fidelity's costs are attributable to services provided to all Fidelity funds, and all funds benefit if those costs can be allocated among more assets. The Board concluded that, given the group fee structure, fund shareholders will benefit from lower management fees as assets under FMR's management increase at the fund complex level, regardless of whether Fidelity achieves any such economies of scale.
The Board concluded, taking into account the analysis of the Economies of Scale Committee, that economies of scale, if any, are being appropriately shared between fund shareholders and Fidelity.
Amendment to Description of Group Fee Rate. At its July 2013 meeting, the Board voted to approve an amendment to the fund's management contract to modify the description of the "group fee rate" effective August 1, 2013. The Board noted that under the prior description in the contract, the group fee rate was based on the average net assets of all registered investment companies with which FMR has management contracts. Under the contract's tiered asset breakpoint schedule, the group fee rate is lower as total fund assets under FMR's management increase, and higher as total fund assets under FMR's management decrease. The Board considered that the prior description would have excluded the assets of 64 Fidelity sector funds from the group fee rate calculation once Fidelity SelectCo, LLC, an affiliate of FMR, assumed management responsibilities for those funds. The Board noted that modifying the description of the group fee rate to continue to include the assets of those 64 funds for purposes of determining group fee rate breakpoints would avoid an immediate adverse impact on the group fee rate for any fund.
Additional Information Requested by the Board. In order to develop fully the factual basis for consideration of the Fidelity funds' Advisory Contracts, the Board requested and received additional information on certain topics, including: (i) fund performance trends and Fidelity's long-term strategies for certain funds; (ii) the potential to further rationalize the Fidelity fund lineup with the possibility of achieving savings for the funds and Fidelity; (iii) the methodology with respect to competitive fund data and peer group classifications; (iv) the arrangements with, and performance of, certain sub-advisers on behalf of the Fidelity funds, as well as certain proposed participating affiliate arrangements; (v) the realization of fall-out benefits in certain Fidelity business units; (vi) Fidelity's group fee structures, including the rationale for the individual fee rates of certain categories of funds and the definition of group assets; (vii) trends regarding industry use of performance fee structures and the performance adjustment methodologies applicable to the Fidelity funds; (viii) additional competitive analysis regarding the total expenses for certain classes; and (ix) fund profitability methodology, including Fidelity's cost allocation methodology, and the impact of certain factors on fund profitability results.
Annual Report
Board Approval of Investment Advisory Contracts and
Management Fees - continued
Based on its evaluation of all of the conclusions noted above, and after considering all factors it believed relevant, the Board ultimately concluded that the advisory fee structures are fair and reasonable, and that the fund's Advisory Contracts should be renewed.
Annual Report
Investment Adviser
Fidelity Management & Research Company
Boston, MA
Investment Sub-Advisers
FMR Co., Inc.
Fidelity Management & Research
(U.K.) Inc.
Fidelity Management & Research
(Hong Kong) Limited
Fidelity Management & Research
(Japan) Inc.
FIL Investment Advisors
FIL Investments (Japan) Limited
FIL Investment Advisors (U.K.) Limited
General Distributor
Fidelity Distributors Corporation
Smithfield, RI
Transfer and Service Agents
Fidelity Investments Institutional
Operations Company, Inc.
Boston, MA
Fidelity Service Company, Inc.
Boston, MA
Custodian
The Northern Trust Company
Chicago, IL
(Fidelity Investment logo)(registered trademark)
AILSI-UANN-1213
1.815081.108
Fidelity®
International Value
Fund
Annual Report
October 31, 2013
(Fidelity Cover Art)
Contents
Performance | (Click Here) | How the fund has done over time. |
Management's Discussion of Fund Performance | (Click Here) | The Portfolio Manager's review of fund performance and strategy. |
Shareholder Expense Example | (Click Here) | An example of shareholder expenses. |
Investment Changes | (Click Here) | A summary of major shifts in the fund's investments over the past six months. |
Investments | (Click Here) | A complete list of the fund's investments with their market values. |
Financial Statements | (Click Here) | Statements of assets and liabilities, operations, and changes in net assets, as well as financial highlights. |
Notes | (Click Here) | Notes to financial statements. |
Report of Independent Registered Public Accounting Firm | (Click Here) | |
Trustees and Officers | (Click Here) | |
Distributions | (Click Here) | |
Board Approval of Investment Advisory Contracts and Management Fees | (Click Here) | |
To view a fund's proxy voting guidelines and proxy voting record for the 12-month period ended June 30, visit http://www.fidelity.com/proxyvotingresults or visit the Securities and Exchange Commission's (SEC) web site at http://www.sec.gov. You may also call 1-800-544-8544 to request a free copy of the proxy voting guidelines.
Standard & Poor's, S&P and S&P 500 are registered service marks of The McGraw-Hill Companies, Inc. and have been licensed for use by Fidelity Distributors Corporation.
Other third-party marks appearing herein are the property of their respective owners.
All other marks appearing herein are registered or unregistered trademarks or service marks of FMR LLC or an affiliated company. © 2013 FMR LLC. All rights reserved.
Annual Report
This report and the financial statements contained herein are submitted for the general information of the shareholders of the fund. This report is not authorized for distribution to prospective investors in the fund unless preceded or accompanied by an effective prospectus.
A fund files its complete schedule of portfolio holdings with the SEC for the first and third quarters of each fiscal year on Form N-Q. Forms N-Q are available on the SEC's web site at http://www.sec.gov. A fund's Forms N-Q may be reviewed and copied at the SEC's Public Reference Room in Washington, DC. Information regarding the operation of the SEC's Public Reference Room may be obtained by calling 1-800-SEC-0330. For a complete list of a fund's portfolio holdings, view the most recent holdings listing, semiannual report, or annual report on Fidelity's web site at http://www.fidelity.com, http://www.advisor.fidelity.com, or http://www.401k.com, as applicable.
NOT FDIC INSURED • MAY LOSE VALUE • NO BANK GUARANTEE
Neither the fund nor Fidelity Distributors Corporation is a bank.
Annual Report
Average annual total return reflects the change in the value of an investment, assuming reinvestment of the class' distributions from dividend income and capital gains (the profits earned upon the sale of securities that have grown in value, if any) and assuming a constant rate of performance each year. The $10,000 table and the fund's returns do not reflect the deduction of taxes that a shareholder would pay on fund distributions or the redemption of fund shares. During periods of reimbursement by Fidelity, a fund's total return will be greater than it would be had the reimbursement not occurred. How a fund did yesterday is no guarantee of how it will do tomorrow.
Average Annual Total Returns
Periods ended October 31, 2013 | Past 1
year | Past 5
years | Life of
fund A |
Fidelity® International Value Fund | 25.57% | 11.65% | 1.40% |
A From May 18, 2006
$10,000 Over Life of Fund
Let's say hypothetically that $10,000 was invested in Fidelity® International Value Fund, a class of the fund, on May 18, 2006, when the fund started. The chart shows how the value of your investment would have changed, and also shows how the MSCI® EAFE® Value Index performed over the same period.
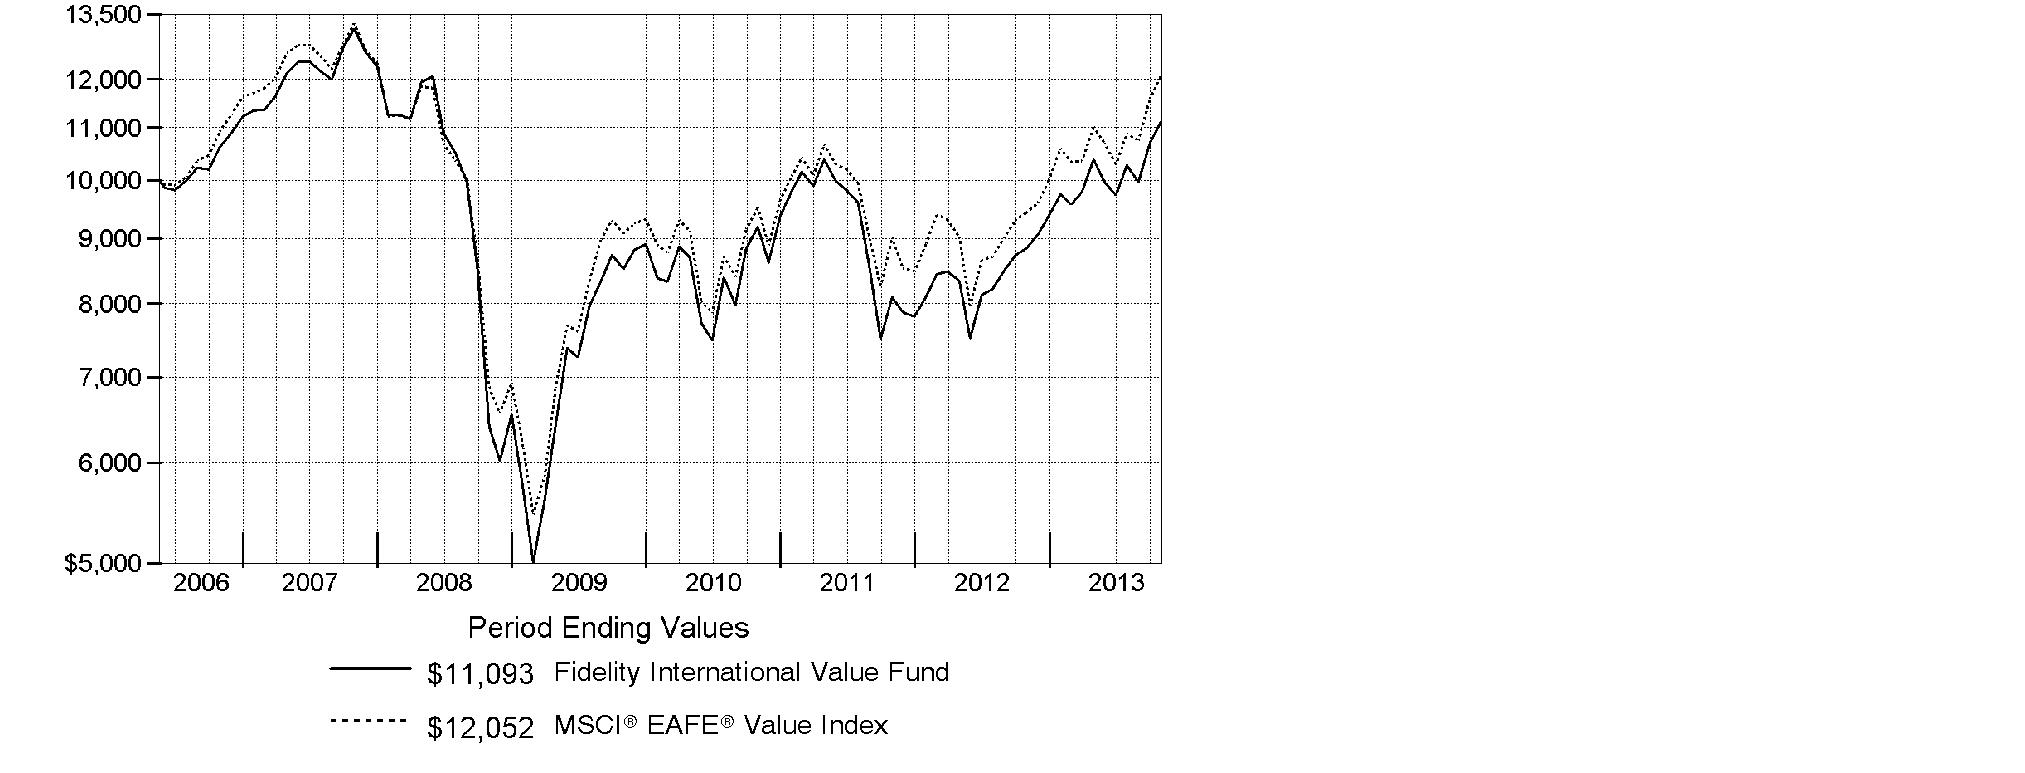
Annual Report
Market Recap: On balance, global equity markets remained upbeat for the 12-month period ending October 31, 2013. The MSCI® ACWI® (All Country World Index) Index gained 23.75% for the period, amid investor preference for higher-risk assets. The period was not without turbulence, however. In the spring and summer, central banks worldwide, especially in the U.S. and China, made clear their intentions to maintain accommodative monetary policies. That stance, combined with modest cyclical improvements around the globe and generally low valuations, underpinned the broad rally in equities. Europe (+32%) shone brightly, with most markets in the region - large and small - registering solid, index-beating gains. Another bright spot was Japan, which, despite a struggling yen and taking a second-half breather, posted a 34% result for the full year. The U.S. - by far the index's biggest constituent - also outperformed the global market with a roughly 28% advance. Meanwhile, Asia-Pacific ex Japan (+14%) lagged, hurt in part by a slowdown in Australia's mining industry as well as currency headwinds. Foreign-exchange and commodity weakness also curbed results in resource-heavy Canada and emerging markets (EM), both of which were up 7%. Country-level EM performance diverged meaningfully for the period, as evidenced by performance in Brazil (-1%), Russia (+12%), India (+1%) and China (+8%).
Comments from Alex Zavratsky, Portfolio Manager of Fidelity® International Value Fund: For the year, the fund's Retail Class shares rose 25.57%, trailing the 27.95% gain of the benchmark MSCI® EAFE® Value Index. The fund performed relatively well through the first half of the reporting period when investors generally gravitated towards the high-quality, steady compounders I seek. However, performance took a turn during the second half - specifically in the third quarter - when investors became more bullish on the European recovery. Versus the index, it hurt to largely avoid Germany-based Daimler - the world's third-largest luxury automobile manufacturer. Daimler's stock rose 85% during the past year amid an improving economic environment in Europe. Daimler was not held at period end. By contrast, a non-index investment in Japan-based SoftBank was a winner. The Internet and telecom-services provider saw significant growth during the period. In June, SoftBank completed its protracted takeover of telecom giant Sprint, the U.S.'s third-largest mobile carrier, and sported two consecutive quarters of better-than-expected financial results in the second half of the period. Additionally, the firm stands to benefit from the planned initial public offering of Alibaba, China's - and the world's - biggest Internet retailer, which is about 37% owned by SoftBank.
The views expressed above reflect those of the portfolio manager(s) only through the end of the period as stated on the cover of this report and do not necessarily represent the views of Fidelity or any other person in the Fidelity organization. Any such views are subject to change at any time based upon market or other conditions and Fidelity disclaims any responsibility to update such views. These views may not be relied on as investment advice and, because investment decisions for a Fidelity fund are based on numerous factors, may not be relied on as an indication of trading intent on behalf of any Fidelity fund.
Annual Report
Shareholder Expense Example
As a shareholder of the Fund, you incur two types of costs: (1) transaction costs, including sales charges (loads) on purchase payments or redemption proceeds, redemption fees and (2) ongoing costs, including management fees, distribution and/or service (12b-1) fees and other Fund expenses. This Example is intended to help you understand your ongoing costs (in dollars) of investing in the Fund and to compare these costs with the ongoing costs of investing in other mutual funds.
The Example is based on an investment of $1,000 invested at the beginning of the period and held for the entire period (May 1, 2013 to October 31, 2013).
Actual Expenses
The first line of the accompanying table for each class of the Fund provides information about actual account values and actual expenses. You may use the information in this line, together with the amount you invested, to estimate the expenses that you paid over the period. Simply divide your account value by $1,000.00 (for example, an $8,600 account value divided by $1,000.00 = 8.6), then multiply the result by the number in the first line for a class of the Fund under the heading entitled "Expenses Paid During Period" to estimate the expenses you paid on your account during this period. A small balance maintenance fee of $12.00 that is charged once a year may apply for certain accounts with a value of less than $2,000. This fee is not included in the table below. If it was, the estimate of expenses you paid during the period would be higher, and your ending account value lower, by this amount. In addition, the Fund, as a shareholder in the underlying Fidelity Central Funds, will indirectly bear its pro-rata share of the fees and expenses incurred by the underlying Fidelity Central Funds. These fees and expenses are not included in the Fund's annualized expense ratio used to calculate the expense estimate in the table below.
Hypothetical Example for Comparison Purposes
The second line of the accompanying table for each class of the Fund provides information about hypothetical account values and hypothetical expenses based on a Class' actual expense ratio and an assumed rate of return of 5% per year before expenses, which is not the Class' actual return. The hypothetical account values and expenses may not be used to estimate the actual ending account balance or expenses you paid for the period. You may use this information to compare the ongoing costs of investing in the Fund and other funds. To do so, compare this 5% hypothetical example with the 5% hypothetical examples that appear in the shareholder reports of the other funds. A small balance maintenance fee of $12.00 that is charged once a year may apply for certain accounts with a value of less than $2,000. This fee is not included in the table below. If it was, the estimate of expenses you paid during the period would be higher, and your ending account value lower, by this amount. In addition, the Fund, as a shareholder in the underlying Fidelity Central Funds, will indirectly bear its pro-rata share of the fees and expenses incurred by the underlying Fidelity Central Funds. These fees and expenses are not included in the Fund's annualized expense ratio used to calculate the expense estimate in the table below.
Please note that the expenses shown in the table are meant to highlight your ongoing costs only and do not reflect any transaction costs. Therefore, the second line of the table is useful in comparing ongoing costs only, and will not help you determine the relative total costs of owning different funds. In addition, if these transactional costs were included, your costs would have been higher.
Annual Report
| Annualized
Expense Ratio B | Beginning
Account Value
May 1, 2013 | Ending
Account Value
October 31, 2013 | Expenses Paid
During Period*
May 1, 2013
to October 31, 2013 |
Class A | 1.37% | | | |
Actual | | $ 1,000.00 | $ 1,066.70 | $ 7.14 |
HypotheticalA | | $ 1,000.00 | $ 1,018.30 | $ 6.97 |
Class T | 1.64% | | | |
Actual | | $ 1,000.00 | $ 1,065.60 | $ 8.54 |
HypotheticalA | | $ 1,000.00 | $ 1,016.94 | $ 8.34 |
Class B | 2.12% | | | |
Actual | | $ 1,000.00 | $ 1,062.70 | $ 11.02 |
HypotheticalA | | $ 1,000.00 | $ 1,014.52 | $ 10.76 |
Class C | 2.12% | | | |
Actual | | $ 1,000.00 | $ 1,061.80 | $ 11.02 |
HypotheticalA | | $ 1,000.00 | $ 1,014.52 | $ 10.76 |
International Value | 1.03% | | | |
Actual | | $ 1,000.00 | $ 1,069.10 | $ 5.37 |
HypotheticalA | | $ 1,000.00 | $ 1,020.01 | $ 5.24 |
Institutional Class | 1.03% | | | |
Actual | | $ 1,000.00 | $ 1,069.00 | $ 5.37 |
HypotheticalA | | $ 1,000.00 | $ 1,020.01 | $ 5.24 |
A 5% return per year before expenses
B Annualized expense ratio reflects expenses net of applicable fee waivers.
* Expenses are equal to each Class' annualized expense ratio, multiplied by the average account value over the period, multiplied by 184/365 (to reflect the one-half year period).
Annual Report
Investment Changes (Unaudited)
Geographic Diversification (% of fund's net assets) |
As of October 31, 2013 |
 | United Kingdom 24.7% | |
 | Japan 19.0% | |
 | France 15.6% | |
 | Germany 9.1% | |
 | Australia 6.8% | |
 | Switzerland 5.7% | |
 | Netherlands 3.2% | |
 | Spain 3.1% | |
 | United States of America* 2.6% | |
 | Other 10.2% | |

* Includes short-term investments and net other assets (liabilities) |
Percentages are based on country or territory of incorporation and are adjusted for the effect of futures contracts, if applicable. |
As of April 30, 2013 |
| United Kingdom 26.6% | |
| Japan 19.2% | |
| Germany 8.9% | |
| Switzerland 8.6% | |
| Australia 8.3% | |
| France 7.8% | |
| Singapore 3.3% | |
| Spain 2.8% | |
| Netherlands 2.4% | |
| Other* 12.1% | |

* Includes short-term investments and net other assets (liabilities) |
Percentages are based on country or territory of incorporation and are adjusted for the effect of futures contracts, if applicable. |
Asset Allocation as of October 31, 2013 |
| % of fund's
net assets | % of fund's net assets
6 months ago |
Stocks | 98.2 | 97.9 |
Short-Term Investments and Net Other Assets (Liabilities) | 1.8 | 2.1 |
Top Ten Stocks as of October 31, 2013 |
| % of fund's
net assets | % of fund's net assets
6 months ago |
HSBC Holdings PLC sponsored ADR (United Kingdom, Commercial Banks) | 3.7 | 3.6 |
Total SA (France, Oil, Gas & Consumable Fuels) | 3.6 | 0.0 |
Sanofi SA (France, Pharmaceuticals) | 3.4 | 3.7 |
Vodafone Group PLC sponsored ADR (United Kingdom, Wireless Telecommunication Services) | 3.4 | 3.2 |
Royal Dutch Shell PLC Class A sponsored ADR (United Kingdom, Oil, Gas & Consumable Fuels) | 2.6 | 4.0 |
Australia & New Zealand Banking Group Ltd. (Australia, Commercial Banks) | 2.3 | 2.4 |
Westpac Banking Corp. (Australia, Commercial Banks) | 2.2 | 2.7 |
Sumitomo Mitsui Financial Group, Inc. (Japan, Commercial Banks) | 2.2 | 2.5 |
BNP Paribas SA (France, Commercial Banks) | 1.9 | 1.6 |
BASF AG (Germany, Chemicals) | 1.9 | 0.5 |
| 27.2 | |
Market Sectors as of October 31, 2013 |
| % of fund's
net assets | % of fund's net assets
6 months ago |
Financials | 31.7 | 34.8 |
Health Care | 10.7 | 12.1 |
Consumer Discretionary | 10.2 | 8.6 |
Telecommunication Services | 10.2 | 8.5 |
Industrials | 9.2 | 6.3 |
Materials | 7.1 | 6.0 |
Energy | 6.9 | 7.7 |
Consumer Staples | 6.3 | 6.2 |
Information Technology | 3.3 | 2.3 |
Utilities | 2.6 | 5.4 |
Annual Report
Investments October 31, 2013
Showing Percentage of Net Assets
Common Stocks - 96.7% |
| Shares | | Value |
Australia - 6.8% |
Ansell Ltd. | 47,969 | | $ 883,636 |
Australia & New Zealand Banking Group Ltd. | 139,122 | | 4,449,661 |
Telstra Corp. Ltd. | 331,729 | | 1,624,104 |
Transurban Group unit | 143,240 | | 961,221 |
Westfield Group unit | 98,459 | | 1,006,893 |
Westpac Banking Corp. | 135,554 | | 4,393,196 |
TOTAL AUSTRALIA | | 13,318,711 |
Bailiwick of Guernsey - 0.1% |
Resolution Ltd. | 43,079 | | 246,866 |
Bailiwick of Jersey - 1.0% |
Informa PLC | 105,010 | | 942,047 |
Wolseley PLC | 18,760 | | 1,010,982 |
TOTAL BAILIWICK OF JERSEY | | 1,953,029 |
Belgium - 1.3% |
Anheuser-Busch InBev SA NV | 7,400 | | 767,112 |
KBC Groupe SA | 16,551 | | 902,256 |
UCB SA | 11,800 | | 775,759 |
TOTAL BELGIUM | | 2,445,127 |
Bermuda - 0.4% |
Hongkong Land Holdings Ltd. | 129,000 | | 794,640 |
Denmark - 0.6% |
A.P. Moller - Maersk A/S Series B | 126 | | 1,219,114 |
Finland - 1.4% |
Nokia Corp. (a) | 114,033 | | 866,741 |
Sampo Oyj (A Shares) | 40,034 | | 1,896,487 |
TOTAL FINLAND | | 2,763,228 |
France - 15.6% |
Arkema SA | 10,899 | | 1,237,419 |
Atos Origin SA | 15,318 | | 1,307,779 |
BNP Paribas SA | 51,004 | | 3,776,932 |
Cap Gemini SA | 16,693 | | 1,098,115 |
Carrefour SA | 40,136 | | 1,470,266 |
GDF Suez | 78,307 | | 1,949,933 |
Havas SA | 106,875 | | 890,392 |
Kering SA | 4,642 | | 1,054,753 |
Renault SA | 16,119 | | 1,411,838 |
Sanofi SA | 61,770 | | 6,586,117 |
Schneider Electric SA | 7,135 | | 601,112 |
Common Stocks - continued |
| Shares | | Value |
France - continued |
Total SA | 114,528 | | $ 7,026,634 |
Vivendi SA | 81,096 | | 2,058,471 |
TOTAL FRANCE | | 30,469,761 |
Germany - 7.6% |
Allianz SE | 17,093 | | 2,875,474 |
BASF AG | 36,013 | | 3,746,950 |
Bayer AG | 18,190 | | 2,260,807 |
Deutsche Post AG | 53,459 | | 1,809,155 |
Fresenius SE & Co. KGaA | 8,300 | | 1,078,812 |
HeidelbergCement Finance AG | 13,939 | | 1,098,825 |
Siemens AG | 15,408 | | 1,969,024 |
TOTAL GERMANY | | 14,839,047 |
Hong Kong - 0.9% |
Hysan Development Co. Ltd. | 210,000 | | 981,878 |
Wing Hang Bank Ltd. | 57,265 | | 814,695 |
TOTAL HONG KONG | | 1,796,573 |
Italy - 0.2% |
Unione di Banche Italiane ScpA | 68,032 | | 471,089 |
Japan - 19.0% |
AEON Financial Service Co. Ltd. | 13,400 | | 411,517 |
AEON Mall Co. Ltd. | 19,900 | | 565,179 |
Air Water, Inc. | 40,000 | | 571,771 |
Astellas Pharma, Inc. | 17,500 | | 975,562 |
Daikin Industries Ltd. | 13,900 | | 799,714 |
DENSO Corp. | 15,500 | | 745,060 |
Dentsu, Inc. | 20,900 | | 789,648 |
East Japan Railway Co. | 9,600 | | 833,959 |
Hoya Corp. | 53,200 | | 1,275,702 |
Isuzu Motors Ltd. | 124,000 | | 772,220 |
Itochu Corp. | 99,200 | | 1,192,795 |
Japan Exchange Group, Inc. | 23,800 | | 553,306 |
Japan Tobacco, Inc. | 43,400 | | 1,570,372 |
JFE Holdings, Inc. | 40,000 | | 909,388 |
JTEKT Corp. | 61,700 | | 792,122 |
Kansai Electric Power Co., Inc. (a) | 61,200 | | 774,610 |
KDDI Corp. | 32,300 | | 1,749,255 |
Leopalace21 Corp. (a) | 46,800 | | 324,909 |
Mitsubishi Electric Corp. | 95,000 | | 1,044,237 |
MS&AD Insurance Group Holdings, Inc. | 43,000 | | 1,111,866 |
Common Stocks - continued |
| Shares | | Value |
Japan - continued |
Nippon Telegraph & Telephone Corp. | 28,300 | | $ 1,471,043 |
Omron Corp. | 21,900 | | 835,731 |
ORIX Corp. | 102,000 | | 1,766,751 |
Santen Pharmaceutical Co. Ltd. | 18,600 | | 944,243 |
Seven & i Holdings Co., Ltd. | 36,200 | | 1,339,713 |
Seven Bank Ltd. | 168,100 | | 594,949 |
Shinsei Bank Ltd. | 355,000 | | 831,164 |
SoftBank Corp. | 14,900 | | 1,112,716 |
Sumitomo Corp. | 82,000 | | 1,067,091 |
Sumitomo Mitsui Financial Group, Inc. | 89,100 | | 4,306,728 |
Sumitomo Mitsui Trust Holdings, Inc. | 287,000 | | 1,417,518 |
Tokyo Tatemono Co. Ltd. | 71,000 | | 666,548 |
Toyota Motor Corp. | 34,100 | | 2,210,982 |
USS Co. Ltd. | 54,100 | | 792,267 |
TOTAL JAPAN | | 37,120,636 |
Netherlands - 3.2% |
AEGON NV | 77,771 | | 618,815 |
ING Groep NV (Certificaten Van Aandelen) (a) | 103,600 | | 1,316,520 |
Koninklijke Philips Electronics NV | 58,871 | | 2,080,544 |
Royal DSM NV | 16,756 | | 1,269,248 |
Unilever NV (Certificaten Van Aandelen) (Bearer) | 23,931 | | 948,756 |
TOTAL NETHERLANDS | | 6,233,883 |
Norway - 1.1% |
Telenor ASA | 86,977 | | 2,089,301 |
Singapore - 1.7% |
Singapore Telecommunications Ltd. | 604,000 | | 1,837,965 |
United Overseas Bank Ltd. | 89,480 | | 1,501,178 |
TOTAL SINGAPORE | | 3,339,143 |
Spain - 3.1% |
Amadeus IT Holding SA Class A | 25,469 | | 945,778 |
Banco Bilbao Vizcaya Argentaria SA sponsored ADR | 258,286 | | 3,016,780 |
International Consolidated Airlines Group SA CDI (a) | 131,800 | | 735,211 |
Repsol YPF SA | 51,172 | | 1,374,290 |
TOTAL SPAIN | | 6,072,059 |
Sweden - 1.5% |
Svenska Cellulosa AB (SCA) (B Shares) | 36,665 | | 1,041,097 |
Svenska Handelsbanken AB (A Shares) | 40,733 | | 1,845,543 |
TOTAL SWEDEN | | 2,886,640 |
Common Stocks - continued |
| Shares | | Value |
Switzerland - 5.7% |
Novartis AG | 47,615 | | $ 3,695,999 |
Roche Holding AG (participation certificate) | 5,519 | | 1,527,936 |
Swiss Re Ltd. | 25,690 | | 2,256,564 |
Syngenta AG (Switzerland) | 3,374 | | 1,361,803 |
UBS AG (NY Shares) | 119,658 | | 2,316,579 |
TOTAL SWITZERLAND | | 11,158,881 |
United Kingdom - 24.7% |
Barclays PLC | 710,298 | | 2,988,555 |
BHP Billiton PLC | 103,607 | | 3,197,156 |
British American Tobacco PLC (United Kingdom) | 23,760 | | 1,310,893 |
BT Group PLC | 188,458 | | 1,140,290 |
Bunzl PLC | 57,725 | | 1,274,500 |
Compass Group PLC | 99,686 | | 1,433,734 |
GlaxoSmithKline PLC sponsored ADR | 18,675 | | 982,865 |
HSBC Holdings PLC sponsored ADR | 130,948 | | 7,207,381 |
Imperial Tobacco Group PLC | 54,799 | | 2,046,369 |
ITV PLC | 460,796 | | 1,410,446 |
Kingfisher PLC | 228,068 | | 1,380,458 |
Legal & General Group PLC | 607,012 | | 2,105,211 |
National Grid PLC | 188,558 | | 2,369,563 |
Next PLC | 11,900 | | 1,038,931 |
Prudential PLC | 89,236 | | 1,824,944 |
Reed Elsevier PLC | 111,611 | | 1,564,085 |
Rolls-Royce Group PLC | 42,200 | | 778,130 |
Royal Dutch Shell PLC Class A sponsored ADR | 77,296 | | 5,152,551 |
Taylor Wimpey PLC | 405,828 | | 717,076 |
Tesco PLC | 320,338 | | 1,870,640 |
Vodafone Group PLC sponsored ADR | 177,808 | | 6,546,891 |
TOTAL UNITED KINGDOM | | 48,340,669 |
United States of America - 0.8% |
AbbVie, Inc. | 23,011 | | 1,114,883 |
Cabot Corp. | 11,470 | | 534,617 |
TOTAL UNITED STATES OF AMERICA | | 1,649,500 |
TOTAL COMMON STOCKS (Cost $164,698,583) |
189,207,897
|
Nonconvertible Preferred Stocks - 1.5% |
| Shares | | Value |
Germany - 1.5% |
Volkswagen AG
(Cost $2,345,243) | 11,381 | | $ 2,892,718 |
Money Market Funds - 1.8% |
| | | |
Fidelity Cash Central Fund, 0.09% (b)
(Cost $3,487,195) | 3,487,195 | |
3,487,195
|
TOTAL INVESTMENT PORTFOLIO - 100.0% (Cost $170,531,021) | | 195,587,810 |
NET OTHER ASSETS (LIABILITIES) - 0.0% | | 77,461 |
NET ASSETS - 100% | $ 195,665,271 |
Legend |
(a) Non-income producing |
(b) Affiliated fund that is generally available only to investment companies and other accounts managed by Fidelity Investments. The rate quoted is the annualized seven-day yield of the fund at period end. A complete unaudited listing of the fund's holdings as of its most recent quarter end is available upon request. In addition, each Fidelity Central Fund's financial statements, which are not covered by the Fund's Report of Independent Registered Public Accounting Firm, are available on the SEC's website or upon request. |
Affiliated Central Funds |
Information regarding fiscal year to date income earned by the Fund from investments in Fidelity Central Funds is as follows: |
Fund | Income earned |
Fidelity Cash Central Fund | $ 2,240 |
Fidelity Securities Lending Cash Central Fund | 158,210 |
Total | $ 160,450 |
Other Information |
Categorizations in the Schedule of Investments are based on country or territory of incorporation. |
The following is a summary of the inputs used, as of October 31, 2013, involving the Fund's assets and liabilities carried at fair value. The inputs or methodology used for valuing securities may not be an indication of the risk associated with investing in those securities. For more information on valuation inputs, and their aggregation into the levels used in the tables below, please refer to the Investment Valuation section in the accompanying Notes to Financial Statements. |
Valuation Inputs at Reporting Date: |
Description | Total | Level 1 | Level 2 | Level 3 |
Investments in Securities: | | | | |
Equities: | | | | |
Consumer Discretionary | $ 20,046,655 | $ 14,736,478 | $ 5,310,177 | $ - |
Consumer Staples | 12,365,218 | 6,428,372 | 5,936,846 | - |
Energy | 13,553,475 | 6,526,841 | 7,026,634 | - |
Financials | 62,158,572 | 42,859,303 | 19,299,269 | - |
Health Care | 20,826,619 | 8,624,698 | 12,201,921 | - |
Industrials | 18,168,911 | 8,389,425 | 9,779,486 | - |
Information Technology | 6,329,846 | 3,351,672 | 2,978,174 | - |
Materials | 13,927,177 | 7,887,059 | 6,040,118 | - |
Telecommunication Services | 19,630,036 | 14,156,732 | 5,473,304 | - |
Utilities | 5,094,106 | 1,949,933 | 3,144,173 | - |
Money Market Funds | 3,487,195 | 3,487,195 | - | - |
Total Investments in Securities: | $ 195,587,810 | $ 118,397,708 | $ 77,190,102 | $ - |
The following is a summary of transfers between Level 1 and Level 2 for the period ended October 31, 2013. Transfers are assumed to have occurred at the beginning of the period, and are primarily attributable to the valuation techniques used for foreign equity securities, as discussed in the accompanying Notes to Financial Statements: |
Transfers | Total |
Level 1 to Level 2 | $ 11,626,467 |
Level 2 to Level 1 | $ 0 |
See accompanying notes which are an integral part of the financial statements.
Annual Report
Statement of Assets and Liabilities
| October 31, 2013 |
| | |
Assets | | |
Investment in securities, at value - See accompanying schedule: Unaffiliated issuers (cost $167,043,826) | $ 192,100,615 | |
Fidelity Central Funds (cost $3,487,195) | 3,487,195 | |
Total Investments (cost $170,531,021) | | $ 195,587,810 |
Receivable for investments sold | | 945,289 |
Receivable for fund shares sold | | 73,339 |
Dividends receivable | | 654,419 |
Distributions receivable from Fidelity Central Funds | | 351 |
Prepaid expenses | | 630 |
Other receivables | | 10,543 |
Total assets | | 197,272,381 |
| | |
Liabilities | | |
Payable for investments purchased | $ 1,230,443 | |
Payable for fund shares redeemed | 157,688 | |
Accrued management fee | 94,900 | |
Distribution and service plan fees payable | 6,010 | |
Other affiliated payables | 40,392 | |
Other payables and accrued expenses | 77,677 | |
Total liabilities | | 1,607,110 |
| | |
Net Assets | | $ 195,665,271 |
Net Assets consist of: | | |
Paid in capital | | $ 282,926,219 |
Undistributed net investment income | | 3,680,675 |
Accumulated undistributed net realized gain (loss) on investments and foreign currency transactions | | (116,002,753) |
Net unrealized appreciation (depreciation) on investments and assets and liabilities in foreign currencies | | 25,061,130 |
Net Assets | | $ 195,665,271 |
See accompanying notes which are an integral part of the financial statements.
Annual Report
Statement of Assets and Liabilities - continued
| October 31, 2013 |
| | |
Calculation of Maximum Offering Price Class A:
Net Asset Value and redemption price per share ($6,190,531 ÷ 690,803 shares) | | $ 8.96 |
| | |
Maximum offering price per share (100/94.25 of $8.96) | | $ 9.51 |
Class T:
Net Asset Value and redemption price per share ($3,757,790 ÷ 420,208 shares) | | $ 8.94 |
| | |
Maximum offering price per share (100/96.50 of $8.94) | | $ 9.26 |
Class B:
Net Asset Value and offering price per share ($678,055 ÷ 75,490 shares)A | | $ 8.98 |
| | |
Class C:
Net Asset Value and offering price per share ($3,231,305 ÷ 361,660 shares)A | | $ 8.93 |
| | |
International Value:
Net Asset Value, offering price and redemption price per share ($181,568,150 ÷ 20,236,094 shares) | | $ 8.97 |
| | |
Institutional Class:
Net Asset Value, offering price and redemption price per share ($239,440 ÷ 26,656 shares) | | $ 8.98 |
A Redemption price per share is equal to net asset value less any applicable contingent deferred sales charge.
See accompanying notes which are an integral part of the financial statements.
Annual Report
Financial Statements - continued
Statement of Operations
| Year ended October 31, 2013 |
| | |
Investment Income | | |
Dividends | | $ 5,981,397 |
Income from Fidelity Central Funds | | 160,450 |
Income before foreign taxes withheld | | 6,141,847 |
Less foreign taxes withheld | | (388,783) |
Total income | | 5,753,064 |
| | |
Expenses | | |
Management fee
Basic fee | $ 1,176,503 | |
Performance adjustment | (93,277) | |
Transfer agent fees | 370,369 | |
Distribution and service plan fees | 62,780 | |
Accounting and security lending fees | 87,132 | |
Custodian fees and expenses | 93,872 | |
Independent trustees' compensation | 929 | |
Registration fees | 74,322 | |
Audit | 62,420 | |
Legal | 395 | |
Miscellaneous | 1,091 | |
Total expenses before reductions | 1,836,536 | |
Expense reductions | (47,772) | 1,788,764 |
Net investment income (loss) | | 3,964,300 |
Realized and Unrealized Gain (Loss) Net realized gain (loss) on: | | |
Investment securities: | | |
Unaffiliated issuers | 9,459,633 | |
Foreign currency transactions | (62,042) | |
Total net realized gain (loss) | | 9,397,591 |
Change in net unrealized appreciation (depreciation) on: Investment securities | 23,778,218 | |
Assets and liabilities in foreign currencies | 13,304 | |
Total change in net unrealized appreciation (depreciation) | | 23,791,522 |
Net gain (loss) | | 33,189,113 |
Net increase (decrease) in net assets resulting from operations | | $ 37,153,413 |
See accompanying notes which are an integral part of the financial statements.
Annual Report
Statement of Changes in Net Assets
| Year ended
October 31,
2013 | Year ended
October 31,
2012 |
Increase (Decrease) in Net Assets | | |
Operations | | |
Net investment income (loss) | $ 3,964,300 | $ 4,504,170 |
Net realized gain (loss) | 9,397,591 | (6,022,570) |
Change in net unrealized appreciation (depreciation) | 23,791,522 | 12,827,702 |
Net increase (decrease) in net assets resulting
from operations | 37,153,413 | 11,309,302 |
Distributions to shareholders from net investment income | (4,120,600) | (5,463,877) |
Distributions to shareholders from net realized gain | (786,952) | - |
Total distributions | (4,907,552) | (5,463,877) |
Share transactions - net increase (decrease) | 23,938,130 | (27,953,937) |
Redemption fees | 3,144 | 2,109 |
Total increase (decrease) in net assets | 56,187,135 | (22,106,403) |
| | |
Net Assets | | |
Beginning of period | 139,478,136 | 161,584,539 |
End of period (including undistributed net investment income of $3,680,675 and undistributed net investment income of $3,836,975, respectively) | $ 195,665,271 | $ 139,478,136 |
See accompanying notes which are an integral part of the financial statements.
Annual Report
Financial Highlights - Class A
Years ended October 31, | 2013 | 2012 | 2011 | 2010 | 2009 |
Selected Per-Share Data | | | | | |
Net asset value, beginning of period | $ 7.39 | $ 7.02 | $ 8.22 | $ 7.75 | $ 5.93 |
Income from Investment Operations | | | | | |
Net investment income (loss) C | .17 | .20 | .22 | .15 | .12 |
Net realized and unrealized gain (loss) | 1.64 | .39 | (1.19) | .44 | 1.78 |
Total from investment operations | 1.81 | .59 | (.97) | .59 | 1.90 |
Distributions from net investment income | (.20) | (.22) | (.19) | (.11) | (.08) |
Distributions from net realized gain | (.04) | - | (.03) | (.01) | - |
Total distributions | (.24) | (.22) | (.23) H | (.12) | (.08) |
Redemption fees added to paid in capital C, G | - | - | - | - | - |
Net asset value, end of period | $ 8.96 | $ 7.39 | $ 7.02 | $ 8.22 | $ 7.75 |
Total Return A, B | 25.24% | 8.82% | (12.19)% | 7.60% | 32.71% |
Ratios to Average Net Assets D, F | | | | | |
Expenses before reductions | 1.39% | 1.44% | 1.36% | 1.40% | 1.34% |
Expenses net of fee waivers, if any | 1.39% | 1.44% | 1.36% | 1.40% | 1.34% |
Expenses net of all reductions | 1.36% | 1.41% | 1.34% | 1.38% | 1.32% |
Net investment income (loss) | 2.08% | 2.85% | 2.79% | 1.93% | 1.86% |
Supplemental Data | | | | | |
Net assets, end of period (000 omitted) | $ 6,191 | $ 4,491 | $ 4,668 | $ 4,699 | $ 4,456 |
Portfolio turnover rate E | 79% | 74% | 83% | 43% | 46% |
A Total returns would have been lower if certain expenses had not been reduced during the applicable periods shown.
B Total returns do not include the effect of the sales charges.
C Calculated based on average shares outstanding during the period.
D Fees and expenses of any underlying Fidelity Central Funds are not included in the Fund's expense ratio. The Fund indirectly bears its proportionate share of the expenses of any underlying Fidelity Central Funds.
E Amount does not include the portfolio activity of any underlying Fidelity Central Funds.
F Expense ratios reflect operating expenses of the class. Expenses before reductions do not reflect amounts reimbursed by the investment adviser or reductions from brokerage service arrangements or reductions from other expense offset arrangements and do not represent the amount paid by the class during periods when reimbursements or reductions occur. Expenses net of fee waivers reflect expenses after reimbursement by the investment adviser but prior to reductions from brokerage service arrangements or other expense offset arrangements. Expenses net of all reductions represent the net expenses paid by the class.
G Amount represents less than $.01 per share.
H Total distributions of $.23 per share is comprised of distributions from net investment income of $.191 and distributions from net realized gain of $.034 per share.
See accompanying notes which are an integral part of the financial statements.
Annual Report
Financial Highlights - Class T
Years ended October 31, | 2013 | 2012 | 2011 | 2010 | 2009 |
Selected Per-Share Data | | | | | |
Net asset value, beginning of period | $ 7.38 | $ 7.00 | $ 8.20 | $ 7.73 | $ 5.91 |
Income from Investment Operations | | | | | |
Net investment income (loss) C | .15 | .18 | .20 | .13 | .10 |
Net realized and unrealized gain (loss) | 1.64 | .40 | (1.19) | .44 | 1.77 |
Total from investment operations | 1.79 | .58 | (.99) | .57 | 1.87 |
Distributions from net investment income | (.19) | (.20) | (.17) | (.09) | (.05) |
Distributions from net realized gain | (.04) | - | (.03) | (.01) | - |
Total distributions | (.23) | (.20) | (.21) H | (.10) | (.05) |
Redemption fees added to paid in capital C, G | - | - | - | - | - |
Net asset value, end of period | $ 8.94 | $ 7.38 | $ 7.00 | $ 8.20 | $ 7.73 |
Total Return A, B | 24.86% | 8.60% | (12.42)% | 7.32% | 32.14% |
Ratios to Average Net Assets D, F | | | | | |
Expenses before reductions | 1.66% | 1.71% | 1.63% | 1.67% | 1.60% |
Expenses net of fee waivers, if any | 1.65% | 1.70% | 1.62% | 1.67% | 1.60% |
Expenses net of all reductions | 1.63% | 1.67% | 1.60% | 1.65% | 1.59% |
Net investment income (loss) | 1.81% | 2.58% | 2.52% | 1.65% | 1.59% |
Supplemental Data | | | | | |
Net assets, end of period (000 omitted) | $ 3,758 | $ 2,693 | $ 2,468 | $ 2,276 | $ 2,395 |
Portfolio turnover rate E | 79% | 74% | 83% | 43% | 46% |
A Total returns would have been lower if certain expenses had not been reduced during the applicable periods shown.
B Total returns do not include the effect of the sales charges.
C Calculated based on average shares outstanding during the period.
D Fees and expenses of any underlying Fidelity Central Funds are not included in the Fund's expense ratio. The Fund indirectly bears its proportionate share of the expenses of any underlying Fidelity Central Funds.
E Amount does not include the portfolio activity of any underlying Fidelity Central Funds.
F Expense ratios reflect operating expenses of the class. Expenses before reductions do not reflect amounts reimbursed by the investment adviser or reductions from brokerage service arrangements or reductions from other expense offset arrangements and do not represent the amount paid by the class during periods when reimbursements or reductions occur. Expenses net of fee waivers reflect expenses after reimbursement by the investment adviser but prior to reductions from brokerage service arrangements or other expense offset arrangements. Expenses net of all reductions represent the net expenses paid by the class.
G Amount represents less than $.01 per share.
H Total distributions of $.21 per share is comprised of distributions from net investment income of $.173 and distributions from net realized gain of $.034 per share.
See accompanying notes which are an integral part of the financial statements.
Annual Report
Financial Highlights - Class B
Years ended October 31, | 2013 | 2012 | 2011 | 2010 | 2009 |
Selected Per-Share Data | | | | | |
Net asset value, beginning of period | $ 7.39 | $ 7.00 | $ 8.20 | $ 7.74 | $ 5.88 |
Income from Investment Operations | | | | | |
Net investment income (loss) C | .11 | .14 | .17 | .09 | .07 |
Net realized and unrealized gain (loss) | 1.65 | .41 | (1.20) | .44 | 1.79 |
Total from investment operations | 1.76 | .55 | (1.03) | .53 | 1.86 |
Distributions from net investment income | (.13) | (.16) | (.13) | (.06) | - |
Distributions from net realized gain | (.04) | - | (.03) | (.01) | - |
Total distributions | (.17) | (.16) | (.17) H | (.07) | - |
Redemption fees added to paid in capital C, G | - | - | - | - | - |
Net asset value, end of period | $ 8.98 | $ 7.39 | $ 7.00 | $ 8.20 | $ 7.74 |
Total Return A, B | 24.30% | 8.07% | (12.88)% | 6.82% | 31.63% |
Ratios to Average Net Assets D, F | | | | | |
Expenses before reductions | 2.14% | 2.19% | 2.11% | 2.15% | 2.08% |
Expenses net of fee waivers, if any | 2.14% | 2.19% | 2.11% | 2.15% | 2.08% |
Expenses net of all reductions | 2.11% | 2.16% | 2.09% | 2.13% | 2.07% |
Net investment income (loss) | 1.32% | 2.09% | 2.04% | 1.18% | 1.11% |
Supplemental Data | | | | | |
Net assets, end of period (000 omitted) | $ 678 | $ 691 | $ 901 | $ 1,216 | $ 1,076 |
Portfolio turnover rate E | 79% | 74% | 83% | 43% | 46% |
A Total returns would have been lower if certain expenses had not been reduced during the applicable periods shown.
B Total returns do not include the effect of the contingent deferred sales charge.
C Calculated based on average shares outstanding during the period.
D Fees and expenses of any underlying Fidelity Central Funds are not included in the Fund's expense ratio. The Fund indirectly bears its proportionate share of the expenses of any underlying Fidelity Central Funds.
E Amount does not include the portfolio activity of any underlying Fidelity Central Funds.
F Expense ratios reflect operating expenses of the class. Expenses before reductions do not reflect amounts reimbursed by the investment adviser or reductions from brokerage service arrangements or reductions from other expense offset arrangements and do not represent the amount paid by the class during periods when reimbursements or reductions occur. Expenses net of fee waivers reflect expenses after reimbursement by the investment adviser but prior to reductions from brokerage service arrangements or other expense offset arrangements. Expenses net of all reductions represent the net expenses paid by the class.
G Amount represents less than $.01 per share.
H Total distributions of $.17 per share is comprised of distributions from net investment income of $.131 and distributions from net realized gain of $.034 per share.
See accompanying notes which are an integral part of the financial statements.
Annual Report
Financial Highlights - Class C
Years ended October 31, | 2013 | 2012 | 2011 | 2010 | 2009 |
Selected Per-Share Data | | | | | |
Net asset value, beginning of period | $ 7.38 | $ 7.00 | $ 8.20 | $ 7.73 | $ 5.88 |
Income from Investment Operations | | | | | |
Net investment income (loss) C | .11 | .14 | .16 | .09 | .07 |
Net realized and unrealized gain (loss) | 1.63 | .41 | (1.19) | .44 | 1.78 |
Total from investment operations | 1.74 | .55 | (1.03) | .53 | 1.85 |
Distributions from net investment income | (.15) | (.17) | (.14) | (.05) | - |
Distributions from net realized gain | (.04) | - | (.03) | (.01) | - |
Total distributions | (.19) | (.17) | (.17) | (.06) | - |
Redemption fees added to paid in capital C, G | - | - | - | - | - |
Net asset value, end of period | $ 8.93 | $ 7.38 | $ 7.00 | $ 8.20 | $ 7.73 |
Total Return A, B | 24.17% | 8.12% | (12.84)% | 6.84% | 31.46% |
Ratios to Average Net Assets D, F | | | | | |
Expenses before reductions | 2.14% | 2.19% | 2.12% | 2.15% | 2.08% |
Expenses net of fee waivers, if any | 2.14% | 2.19% | 2.11% | 2.15% | 2.08% |
Expenses net of all reductions | 2.11% | 2.16% | 2.09% | 2.13% | 2.06% |
Net investment income (loss) | 1.33% | 2.09% | 2.04% | 1.18% | 1.12% |
Supplemental Data | | | | | |
Net assets, end of period (000 omitted) | $ 3,231 | $ 2,249 | $ 2,108 | $ 2,123 | $ 2,108 |
Portfolio turnover rate E | 79% | 74% | 83% | 43% | 46% |
A Total returns would have been lower if certain expenses had not been reduced during the applicable periods shown.
B Total returns do not include the effect of the contingent deferred sales charge.
C Calculated based on average shares outstanding during the period.
D Fees and expenses of any underlying Fidelity Central Funds are not included in the Fund's expense ratio. The Fund indirectly bears its proportionate share of the expenses of any underlying Fidelity Central Funds.
E Amount does not include the portfolio activity of any underlying Fidelity Central Funds.
F Expense ratios reflect operating expenses of the class. Expenses before reductions do not reflect amounts reimbursed by the investment adviser or reductions from brokerage service arrangements or reductions from other expense offset arrangements and do not represent the amount paid by the class during periods when reimbursements or reductions occur. Expenses net of fee waivers reflect expenses after reimbursement by the investment adviser but prior to reductions from brokerage service arrangements or other expense offset arrangements. Expenses net of all reductions represent the net expenses paid by the class.
G Amount represents less than $.01 per share.
See accompanying notes which are an integral part of the financial statements.
Annual Report
Financial Highlights - International Value
Years ended October 31, | 2013 | 2012 | 2011 | 2010 | 2009 |
Selected Per-Share Data | | | | | |
Net asset value, beginning of period | $ 7.40 | $ 7.03 | $ 8.23 | $ 7.75 | $ 5.95 |
Income from Investment Operations | | | | | |
Net investment income (loss) B | .19 | .22 | .25 | .17 | .13 |
Net realized and unrealized gain (loss) | 1.65 | .40 | (1.20) | .44 | 1.78 |
Total from investment operations | 1.84 | .62 | (.95) | .61 | 1.91 |
Distributions from net investment income | (.22) | (.25) | (.22) | (.13) | (.11) |
Distributions from net realized gain | (.04) | - | (.03) | (.01) | - |
Total distributions | (.27) H | (.25) | (.25) | (.13) G | (.11) |
Redemption fees added to paid in capital B, F | - | - | - | - | - |
Net asset value, end of period | $ 8.97 | $ 7.40 | $ 7.03 | $ 8.23 | $ 7.75 |
Total Return A | 25.57% | 9.19% | (11.91)% | 7.95% | 33.09% |
Ratios to Average Net Assets C, E | | | | | |
Expenses before reductions | 1.05% | 1.13% | 1.04% | 1.09% | 1.07% |
Expenses net of fee waivers, if any | 1.05% | 1.13% | 1.03% | 1.09% | 1.07% |
Expenses net of all reductions | 1.02% | 1.10% | 1.01% | 1.08% | 1.06% |
Net investment income (loss) | 2.41% | 3.16% | 3.11% | 2.23% | 2.12% |
Supplemental Data | | | | | |
Net assets, end of period (000 omitted) | $ 181,568 | $ 128,983 | $ 150,967 | $ 163,090 | $ 180,447 |
Portfolio turnover rate D | 79% | 74% | 83% | 43% | 46% |
A Total returns would have been lower if certain expenses had not been reduced during the applicable periods shown.
B Calculated based on average shares outstanding during the period.
C Fees and expenses of any underlying Fidelity Central Funds are not included in the Fund's expense ratio. The Fund indirectly bears its proportionate share of the expenses of any underlying Fidelity Central Funds.
D Amount does not include the portfolio activity of any underlying Fidelity Central Funds.
E Expense ratios reflect operating expenses of the class. Expenses before reductions do not reflect amounts reimbursed by the investment adviser or reductions from brokerage service arrangements or reductions from other expense offset arrangements and do not represent the amount paid by the class during periods when reimbursements or reductions occur. Expenses net of fee waivers reflect expenses after reimbursement by the investment adviser but prior to reductions from brokerage service arrangements or other expense offset arrangements. Expenses net of all reductions represent the net expenses paid by the class.
F Amount represents less than $.01 per share.
G Total distributions of $.13 per share is comprised of distributions from net investment income of $.129 and distributions from net realized gain of $.005 per share.
H Total distributions of $.27 per share is comprised of distributions from net investment income of $.223 and distributions from net realized gain of $.042 per share.
See accompanying notes which are an integral part of the financial statements.
Annual Report
Financial Highlights - Institutional Class
Years ended October 31, | 2013 | 2012 | 2011 | 2010 | 2009 |
Selected Per-Share Data | | | | | |
Net asset value, beginning of period | $ 7.41 | $ 7.04 | $ 8.24 | $ 7.76 | $ 5.96 |
Income from Investment Operations | | | | | |
Net investment income (loss) B | .19 | .22 | .25 | .18 | .14 |
Net realized and unrealized gain (loss) | 1.65 | .40 | (1.19) | .44 | 1.78 |
Total from investment operations | 1.84 | .62 | (.94) | .62 | 1.92 |
Distributions from net investment income | (.23) | (.25) | (.22) | (.14) | (.12) |
Distributions from net realized gain | (.04) | - | (.03) | (.01) | - |
Total distributions | (.27) | (.25) | (.26) H | (.14) G | (.12) |
Redemption fees added to paid in capital B, F | - | - | - | - | - |
Net asset value, end of period | $ 8.98 | $ 7.41 | $ 7.04 | $ 8.24 | $ 7.76 |
Total Return A | 25.64% | 9.22% | (11.83)% | 8.05% | 33.06% |
Ratios to Average Net Assets C, E | | | | | |
Expenses before reductions | 1.07% | 1.10% | .98% | .98% | .93% |
Expenses net of fee waivers, if any | 1.07% | 1.10% | .98% | .98% | .93% |
Expenses net of all reductions | 1.04% | 1.07% | .96% | .97% | .92% |
Net investment income (loss) | 2.39% | 3.18% | 3.17% | 2.34% | 2.26% |
Supplemental Data | | | | | |
Net assets, end of period (000 omitted) | $ 239 | $ 372 | $ 473 | $ 519 | $ 814 |
Portfolio turnover rate D | 79% | 74% | 83% | 43% | 46% |
A Total returns would have been lower if certain expenses had not been reduced during the applicable periods shown.
B Calculated based on average shares outstanding during the period.
C Fees and expenses of any underlying Fidelity Central Funds are not included in the Fund's expense ratio. The Fund indirectly bears its proportionate share of the expenses of any underlying Fidelity Central Funds.
D Amount does not include the portfolio activity of any underlying Fidelity Central Funds.
E Expense ratios reflect operating expenses of the class. Expenses before reductions do not reflect amounts reimbursed by the investment adviser or reductions from brokerage service arrangements or reductions from other expense offset arrangements and do not represent the amount paid by the class during periods when reimbursements or reductions occur. Expenses net of fee waivers reflect expenses after reimbursement by the investment adviser but prior to reductions from brokerage service arrangements or other expense offset arrangements. Expenses net of all reductions represent the net expenses paid by the class.
F Amount represents less than $.01 per share.
G Total distributions of $.14 per share is comprised of distributions from net investment income of $.137 and distributions from net realized gain of $.005 per share.
H Total distributions of $.26 per share is comprised of distributions from net investment income of $.221 and distributions from net realized gain of $.034 per share.
See accompanying notes which are an integral part of the financial statements.
Annual Report
Notes to Financial Statements
For the period ended October 31, 2013
1. Organization.
Fidelity International Value Fund (the Fund) is a fund of Fidelity Investment Trust (the Trust) and is authorized to issue an unlimited number of shares. The Trust is registered under the Investment Company Act of 1940, as amended (the 1940 Act), as an open-end management investment company organized as a Massachusetts business trust. The Fund offers Class A, Class T, Class C, International Value and Institutional Class shares, each of which, along with Class B shares, has equal rights as to assets and voting privileges. Class B shares are closed to new accounts and additional purchases, except for exchanges and reinvestments. Each class has exclusive voting rights with respect to matters that affect that class. Class B shares will automatically convert to Class A shares after a holding period of seven years from the initial date of purchase.
2. Investments in Fidelity Central Funds.
The Fund invests in Fidelity Central Funds, which are open-end investment companies generally available only to other investment companies and accounts managed by Fidelity Management & Research Company (FMR) and its affiliates. The Fund's Schedule of Investments lists each of the Fidelity Central Funds held as of period end, if any, as an investment of the Fund, but does not include the underlying holdings of each Fidelity Central Fund. As an Investing Fund, the Fund indirectly bears its proportionate share of the expenses of the underlying Fidelity Central Funds.
The Money Market Central Funds seek preservation of capital and current income and are managed by Fidelity Investments Money Management, Inc. (FIMM), an affiliate of FMR.
A complete unaudited list of holdings for each Fidelity Central Fund is available upon request or at the Securities and Exchange Commission (the SEC) website at www.sec.gov. In addition, the financial statements of the Fidelity Central Funds, which are not covered by the Fund's Report of Independent Registered Public Accounting Firm, are available on the SEC website or upon request.
3. Significant Accounting Policies.
The financial statements have been prepared in conformity with accounting principles generally accepted in the United States of America (GAAP), which require management to make certain estimates and assumptions at the date of the financial statements. Actual results could differ from those estimates. Subsequent events, if any, through the date that the financial statements were issued have been evaluated in the preparation of
Annual Report
3. Significant Accounting Policies - continued
the financial statements. The following summarizes the significant accounting policies of the Fund:
Investment Valuation. Investments are valued as of 4:00 p.m. Eastern time on the last calendar day of the period. In accordance with valuation policies and procedures approved by the Board of Trustees (the Board), the Fund attempts to obtain prices from one or more third party pricing vendors or brokers to value its investments. When current market prices, quotations or currency exchange rates are not readily available or reliable, investments will be fair valued in good faith by the FMR Fair Value Committee (the Committee), in accordance with procedures adopted by the Board. Factors used in determining fair value vary by investment type and may include market or investment specific events. The frequency with which these procedures are used cannot be predicted and they may be utilized to a significant extent. The Committee oversees the Fund's valuation policies and procedures and is responsible for approving and reporting to the Board all fair value determinations.
The Fund categorizes the inputs to valuation techniques used to value its investments into a disclosure hierarchy consisting of three levels as shown below:
Level 1 - quoted prices in active markets for identical investments
Level 2 - other significant observable inputs (including quoted prices for similar investments, interest rates, prepayment speeds, etc.)
Level 3 - unobservable inputs (including the Fund's own assumptions based on the best information available)
Valuation techniques used to value the Fund's investments by major category are as follows:
Equity securities, including restricted securities, for which market quotations are readily available, are valued at the last reported sale price or official closing price as reported by a third party pricing vendor on the primary market or exchange on which they are traded and are categorized as Level 1 in the hierarchy. In the event there were no sales during the day or closing prices are not available, securities are valued at the last quoted bid price or may be valued using the last available price and are generally categorized as Level 2 in the hierarchy. For foreign equity securities, when market or security specific events arise, comparisons to the valuation of American Depositary Receipts (ADRs), futures contracts, Exchange-Traded Funds (ETFs) and certain indexes as well as quoted prices for similar securities may be used and would be categorized as Level 2 in the hierarchy. Utilizing these techniques may result in transfers between Level 1 and Level 2. For equity securities, including restricted securities, where observable inputs are
Annual Report
Notes to Financial Statements - continued
3. Significant Accounting Policies - continued
Investment Valuation - continued
limited, assumptions about market activity and risk are used and these securities may be categorized as Level 3 in the hierarchy.
Investments in open-end mutual funds, including the Fidelity Central Funds, are valued at their closing net asset value (NAV) each business day and are categorized as Level 1 in the hierarchy.
Changes in valuation techniques may result in transfers in or out of an assigned level within the disclosure hierarchy. The aggregate value of investments by input level, as of October 31, 2013, including information on transfers between Levels 1 and 2, is included at the end of the Fund's Schedule of Investments.
Foreign Currency. The Fund may use foreign currency contracts to facilitate transactions in foreign-denominated securities. Gains and losses from these transactions may arise from changes in the value of the foreign currency or if the counterparties do not perform under the contracts' terms.
Foreign-denominated assets, including investment securities, and liabilities are translated into U.S. dollars at the exchange rates at period end. Purchases and sales of investment securities, income and dividends received and expenses denominated in foreign currencies are translated into U.S. dollars at the exchange rate in effect on the transaction date.
The effects of exchange rate fluctuations on investments are included with the net realized and unrealized gain (loss) on investment securities. Other foreign currency transactions resulting in realized and unrealized gain (loss) are disclosed separately.
Investment Transactions and Income. For financial reporting purposes, the Fund's investment holdings and NAV include trades executed through the end of the last business day of the period. The NAV per share for processing shareholder transactions is calculated as of the close of business of the New York Stock Exchange (NYSE), normally 4:00 p.m. Eastern time and includes trades executed through the end of the prior business day. Gains and losses on securities sold are determined on the basis of identified cost and may include proceeds received from litigation. Dividend income is recorded on the ex-dividend date, except for certain dividends from foreign securities where the ex-dividend date may have passed, which are recorded as soon as the Fund is informed of the ex-dividend date. Non-cash dividends included in dividend income, if any, are recorded at the fair market value of the securities received. Interest income and distributions from the Fidelity Central Funds are accrued as earned. Investment income is recorded net of foreign taxes withheld where recovery of such taxes is uncertain.
Annual Report
3. Significant Accounting Policies - continued
Class Allocations and Expenses. Investment income, realized and unrealized capital gains and losses, common expenses of the Fund, and certain fund-level expense reductions, if any, are allocated daily on a pro-rata basis to each class based on the relative net assets of each class to the total net assets of the Fund. Each class differs with respect to transfer agent and distribution and service plan fees incurred. Certain expense reductions may also differ by class. For the reporting period, the allocated portion of income and expenses to each class as a percent of its average net assets may vary due to the timing of recording these transactions in relation to fluctuating net assets of the classes. Expenses directly attributable to a fund are charged to that fund. Expenses attributable to more than one fund are allocated among the respective funds on the basis of relative net assets or other appropriate methods. Expense estimates are accrued in the period to which they relate and adjustments are made when actual amounts are known.
Income Tax Information and Distributions to Shareholders. Each year, the Fund intends to qualify as a regulated investment company under Subchapter M of the Internal Revenue Code, including distributing substantially all of its taxable income and realized gains. As a result, no provision for U.S. Federal income taxes is required. As of October 31, 2013, the Fund did not have any unrecognized tax benefits in the financial statements; nor is the Fund aware of any tax positions for which it is reasonably possible that the total amounts of unrecognized tax benefits will significantly change in the next twelve months. The Fund files a U.S. federal tax return, in addition to state and local tax returns as required. The Fund's federal income tax returns are subject to examination by the Internal Revenue Service (IRS) for a period of three fiscal years after they are filed. State and local tax returns may be subject to examination for an additional fiscal year depending on the jurisdiction. Foreign taxes are provided for based on the Fund's understanding of the tax rules and rates that exist in the foreign markets in which it invests.
Distributions are declared and recorded on the ex-dividend date. Income dividends and capital gain distributions are declared separately for each class. Income and capital gain distributions are determined in accordance with income tax regulations, which may differ from GAAP.
Capital accounts within the financial statements are adjusted for permanent book-tax differences. These adjustments have no impact on net assets or the results of operations. Temporary book-tax differences will reverse in a subsequent period.
Book-tax differences are primarily due to foreign currency transactions, passive foreign investment companies (PFIC), capital loss carryforwards and losses deferred due to wash sales.
Annual Report
Notes to Financial Statements - continued
3. Significant Accounting Policies - continued
Income Tax Information and Distributions to Shareholders - continued
The federal tax cost of investment securities and unrealized appreciation (depreciation) as of period end were as follows:
Gross unrealized appreciation | $ 28,874,674 |
Gross unrealized depreciation | (4,985,981) |
Net unrealized appreciation (depreciation) on securities and other investments | $ 23,888,693 |
| |
Tax Cost | $ 171,699,117 |
The tax-based components of distributable earnings as of period end were as follows:
Undistributed ordinary income | $ 3,934,281 |
Capital loss carryforward | $ (115,088,265) |
Net unrealized appreciation (depreciation) | $ 23,893,034 |
Capital loss carryforwards are only available to offset future capital gains of the Fund to the extent provided by regulations and may be limited. Under the Regulated Investment Company Modernization Act of 2010 (the Act), the Fund is permitted to carry forward capital losses incurred in taxable years beginning after December 22, 2010 for an unlimited period and such capital losses are required to be used prior to any losses that expire. The capital loss carryforward information presented below, including any applicable limitation, is estimated as of fiscal period end and is subject to adjustment.
Fiscal year of expiration | |
2016 | $ (14,771,177) |
2017 | (65,376,972) |
2018 | (3,571,319) |
2019 | (31,368,797) |
Total with expiration | $ (115,088,265) |
The tax character of distributions paid was as follows:
| October 31, 2013 | October 31, 2012 |
Ordinary Income | $ 4,907,552 | $ 5,463,877 |
Short-Term Trading (Redemption) Fees. Shares held by investors in the Fund less than 30 days may have been subject to a redemption fee equal to 1.00% of the net asset value of shares redeemed. All redemption fees, which reduce the proceeds of the shareholder redemption, are retained by the Fund and accounted for as an addition to paid in capital.
Annual Report
4. Purchases and Sales of Investments.
Purchases and sales of securities, other than short-term securities, aggregated $150,085,429 and $129,207,208, respectively.
5. Fees and Other Transactions with Affiliates.
Management Fee. FMR and its affiliates provide the Fund with investment management related services for which the Fund pays a monthly management fee. The management fee is the sum of an individual fund fee rate that is based on an annual rate of .45% of the Fund's average net assets and an annualized group fee rate that averaged .25% during the period. The group fee rate is based upon the average net assets of all the mutual funds advised by FMR, including any mutual funds previously advised by FMR that are currently advised by Fidelity SelectCo, LLC, an affiliate of FMR. The group fee rate decreases as assets under management increase and increases as assets under management decrease. In addition, the management fee is subject to a performance adjustment (up to a maximum of ± .20% of the Fund's average net assets over a 36 month performance period). The upward or downward adjustment to the management fee is based on the relative investment performance of International Value as compared to an appropriate benchmark index over the same 36 month performance period. For the reporting period, the total annual management fee rate, including the performance adjustment, was .65% of the Fund's average net assets. The performance adjustment included in the management fee rate may be higher or lower than the maximum performance adjustment rate due to the difference between the average net assets for the reporting and performance periods.
Distribution and Service Plan Fees. In accordance with Rule 12b-1 of the 1940 Act, the Fund has adopted separate Distribution and Service Plans for each class of shares. Certain classes pay Fidelity Distributors Corporation (FDC), an affiliate of FMR, separate Distribution and Service Fees, each of which is based on an annual percentage of each class' average net assets. In addition, FDC may pay financial intermediaries for selling shares of the Fund and providing shareholder support services. For the period, the Distribution and Service Fee rates, total fees and amounts retained by FDC were as follows:
| Distribution
Fee | Service
Fee | Total Fees | Retained
by FDC |
Class A | -% | .25% | $ 13,148 | $ 2,395 |
Class T | .25% | .25% | 15,589 | 2,306 |
Class B | .75% | .25% | 6,888 | 5,482 |
Class C | .75% | .25% | 27,155 | 8,369 |
| | | $ 62,780 | $ 18,552 |
Annual Report
Notes to Financial Statements - continued
5. Fees and Other Transactions with Affiliates - continued
Sales Load. FDC may receive a front-end sales charge of up to 5.75% for selling Class A shares and 3.50% for selling Class T shares, some of which is paid to financial intermediaries for selling shares of the Fund. Depending on the holding period, FDC may receive contingent deferred sales charges levied on Class A, Class T, Class B, and Class C redemptions. The deferred sales charges range from 5.00% to 1.00% for Class B shares, 1.00% for Class C shares, 1.00% for certain purchases of Class A shares and .25% for certain purchases of Class T shares.
For the period, sales charge amounts retained by FDC were as follows:
| Retained
by FDC |
Class A | $ 3,932 |
Class T | 1,030 |
Class B* | 1,552 |
Class C* | 514 |
| $ 7,028 |
* When Class B and Class C shares are initially sold, FDC pays commissions from its own resources to financial intermediaries through which the sales
are made.
Transfer Agent Fees. Fidelity Investments Institutional Operations Company, Inc., (FIIOC), an affiliate of FMR, is the transfer, dividend disbursing and shareholder servicing agent for each class of the Fund. FIIOC receives account fees and asset-based fees that vary according to the account size and type of account of the shareholders of the respective classes of the Fund. FIIOC pays for typesetting, printing and mailing of shareholder reports, except proxy statements.
For the period, transfer agent fees for each class were as follows:
| Amount | % of
Average
Net Assets |
Class A | $ 15,780 | .30 |
Class T | 9,962 | .32 |
Class B | 2,081 | .30 |
Class C | 8,174 | .30 |
International Value | 333,690 | .21 |
Institutional Class | 682 | .23 |
| $ 370,369 | |
Accounting and Security Lending Fees. Fidelity Service Company, Inc. (FSC), an affiliate of FMR, maintains the Fund's accounting records. The accounting fee is based on the level of average net assets for each month. Under a separate contract, FSC
Annual Report
5. Fees and Other Transactions with Affiliates - continued
Accounting and Security Lending Fees - continued
administers the security lending program. The security lending fee is based on the number and duration of lending transactions.
Brokerage Commissions. The Fund placed a portion of its portfolio transactions with brokerage firms which are affiliates of the investment adviser. Brokerage commissions are included in net realized gain (loss) and change in net unrealized appreciation (depreciation) in the Statement of Operations. The commissions paid to these affiliated firms were $199 for the period.
6. Committed Line of Credit.
The Fund participates with other funds managed by FMR or an affiliate in a $4.25 billion credit facility (the "line of credit") to be utilized for temporary or emergency purposes to fund shareholder redemptions or for other short-term liquidity purposes. The Fund has agreed to pay commitment fees on its pro-rata portion of the line of credit, which amounted to $349 and is reflected in Miscellaneous expenses on the Statement of Operations. During the period, there were no borrowings on this line of credit.
7. Security Lending.
The Fund lends portfolio securities through a lending agent from time to time in order to earn additional income. For equity securities, a lending agent is used and may loan securities to certain qualified borrowers, including Fidelity Capital Markets (FCM), a broker-dealer affiliated with the Fund. On the settlement date of the loan, the Fund receives collateral (in the form of U.S. Treasury obligations, letters of credit and/or cash) against the loaned securities and maintains collateral in an amount not less than 100% of the market value of the loaned securities during the period of the loan. The market value of the loaned securities is determined at the close of business of the Fund and any additional required collateral is delivered to the Fund on the next business day. If the borrower defaults on its obligation to return the securities loaned because of insolvency or other reasons, the Fund may apply collateral received from the borrower against the obligation. The Fund may experience delays and costs in recovering the securities loaned. Any cash collateral received is invested in the Fidelity Securities Lending Cash Central Fund. At period end, there were no security loans outstanding. Security lending income represents the income earned on investing cash collateral, less rebates paid to borrowers and any lending agent fees associated with the loan, plus any premium payments received for lending certain types of securities. Security lending income is presented in the Statement of Operations as a component of income from Fidelity Central Funds. Total security lending income during the period amounted to $158,210. During the period, there were no securities loaned to FCM.
Annual Report
Notes to Financial Statements - continued
8. Expense Reductions.
Commissions paid to certain brokers with whom FMR, or its affiliates, places trades on behalf of the Fund include an amount in addition to trade execution, which may be rebated back to the Fund to offset certain expenses. This amount totaled $47,222 for the period.
In addition, FMR reimbursed a portion of the Fund's operating expenses during the period in the amount of $550.
9. Distributions to Shareholders.
Distributions to shareholders of each class were as follows:
Years ended October 31, | 2013 | 2012 |
From net investment income | | |
Class A | $ 121,166 | $ 143,989 |
Class T | 67,016 | 67,838 |
Class B | 11,860 | 19,758 |
Class C | 47,865 | 50,970 |
International Value | 3,862,005 | 5,163,324 |
Institutional Class | 10,688 | 17,998 |
Total | $ 4,120,600 | $ 5,463,877 |
From net realized gain | | |
Class A | $ 25,318 | $ - |
Class T | 15,214 | - |
Class B | 3,861 | - |
Class C | 13,226 | - |
International Value | 727,373 | - |
Institutional Class | 1,960 | - |
Total | $ 786,952 | $ - |
10. Share Transactions.
Transactions for each class of shares were as follows:
| Shares | Dollars |
Years ended October 31, | 2013 | 2012 | 2013 | 2012 |
Class A | | | | |
Shares sold | 221,312 | 186,877 | $ 1,773,149 | $ 1,294,428 |
Reinvestment of distributions | 17,344 | 19,578 | 128,001 | 128,823 |
Shares redeemed | (155,517) | (263,913) | (1,235,132) | (1,814,670) |
Net increase (decrease) | 83,139 | (57,458) | $ 666,018 | $ (391,419) |
Class T | | | | |
Shares sold | 91,084 | 87,833 | $ 741,140 | $ 599,355 |
Reinvestment of distributions | 11,018 | 10,069 | 81,425 | 66,355 |
Shares redeemed | (46,826) | (85,446) | (371,734) | (585,214) |
Net increase (decrease) | 55,276 | 12,456 | $ 450,831 | $ 80,496 |
Annual Report
10. Share Transactions - continued
| Shares | Dollars |
Years ended October 31, | 2013 | 2012 | 2013 | 2012 |
Class B | | | | |
Shares sold | 6,334 | 2,850 | $ 51,789 | $ 19,157 |
Reinvestment of distributions | 1,746 | 2,474 | 13,011 | 16,400 |
Shares redeemed | (26,098) | (40,532) | (212,223) | (279,913) |
Net increase (decrease) | (18,018) | (35,208) | $ (147,423) | $ (244,356) |
Class C | | | | |
Shares sold | 93,011 | 72,761 | $ 748,735 | $ 498,768 |
Reinvestment of distributions | 7,487 | 6,699 | 55,475 | 44,283 |
Shares redeemed | (43,711) | (75,717) | (352,531) | (522,498) |
Net increase (decrease) | 56,787 | 3,743 | $ 451,679 | $ 20,553 |
International Value | | | | |
Shares sold | 6,308,136 | 2,278,492 | $ 51,241,221 | $ 15,694,819 |
Reinvestment of distributions | 602,705 | 762,294 | 4,441,937 | 5,008,269 |
Shares redeemed | (4,113,021) | (7,089,505) | (32,981,230) | (48,008,194) |
Net increase (decrease) | 2,797,820 | (4,048,719) | $ 22,701,928 | $ (27,305,106) |
Institutional Class | | | | |
Shares sold | 6,984 | 18,483 | $ 56,532 | $ 132,098 |
Reinvestment of distributions | 1,136 | 1,234 | 8,383 | 8,117 |
Shares redeemed | (31,601) | (36,776) | (249,818) | (254,320) |
Net increase (decrease) | (23,481) | (17,059) | $ (184,903) | $ (114,105) |
11. Other.
The Fund's organizational documents provide former and current trustees and officers with a limited indemnification against liabilities arising in connection with the performance of their duties to the Fund. In the normal course of business, the Fund may also enter into contracts that provide general indemnifications. The Fund's maximum exposure under these arrangements is unknown as this would be dependent on future claims that may be made against the Fund. The risk of material loss from such claims is considered remote.
At the end of the period, Strategic Advisers International II Fund and VIP FundsManager 60% Portfolio were the owners of record of approximately 25% and 14%, respectively, of the total outstanding shares of the Fund.
Mutual funds managed by FMR or its affiliates were owners of record, in the aggregate, of approximately 46% of the total outstanding shares of the Fund.
Annual Report
To the Trustees of Fidelity Investment Trust and Shareholders of Fidelity International Value Fund:
We have audited the accompanying statement of assets and liabilities of Fidelity International Value Fund (the Fund), a fund of Fidelity Investment Trust, including the schedule of investments, as of October 31, 2013, and the related statement of operations for the year then ended, the statement of changes in net assets for each of the two years in the period then ended, and the financial highlights for each of the five years in the period then ended. These financial statements and financial highlights are the responsibility of the Fund's management. Our responsibility is to express an opinion on these financial statements and financial highlights based on our audits.
We conducted our audits in accordance with the standards of the Public Company Accounting Oversight Board (United States). Those standards require that we plan and perform the audit to obtain reasonable assurance about whether the financial statements and financial highlights are free of material misstatement. The Fund is not required to have, nor were we engaged to perform, an audit of its internal control over financial reporting. Our audits included consideration of internal control over financial reporting as a basis for designing audit procedures that are appropriate in the circumstances, but not for the purpose of expressing an opinion on the effectiveness of the Fund's internal control over financial reporting. Accordingly, we express no such opinion. An audit also includes examining, on a test basis, evidence supporting the amounts and disclosures in the financial statements, assessing the accounting principles used and significant estimates made by management, as well as evaluating the overall financial statement presentation. Our procedures included confirmation of securities owned as of October 31, 2013, by correspondence with the custodians and brokers; where replies were not received from brokers, we performed other auditing procedures. We believe that our audits provide a reasonable basis for our opinion.
In our opinion, the financial statements and financial highlights referred to above present fairly, in all material respects, the financial position of Fidelity International Value Fund as of October 31, 2013, the results of its operations for the year then ended, the changes in its net assets for each of the two years in the period then ended, and the financial highlights for each of the five years in the period then ended, in conformity with accounting principles generally accepted in the United States of America.
DELOITTE & TOUCHE LLP
Boston, Massachusetts
December 6, 2013
Annual Report
The Trustees, Member of the Advisory Board, and executive officers of the trust and fund, as applicable, are listed below. The Board of Trustees governs the fund and is responsible for protecting the interests of shareholders. The Trustees are experienced executives who meet periodically throughout the year to oversee the fund's activities, review contractual arrangements with companies that provide services to the fund, oversee management of the risks associated with such activities and contractual arrangements, and review the fund's performance. Except for James C. Curvey, Ned C. Lautenbach, Ronald P. O'Hanley, and William S. Stavropoulos, each of the Trustees oversees 171 funds. Mr. Curvey oversees 394 funds. Mr. Lautenbach, Mr. O'Hanley, and Mr. Stavropoulos each oversees 245 funds.
The Trustees hold office without limit in time except that (a) any Trustee may resign; (b) any Trustee may be removed by written instrument, signed by at least two-thirds of the number of Trustees prior to such removal; (c) any Trustee who requests to be retired or who has become incapacitated by illness or injury may be retired by written instrument signed by a majority of the other Trustees; and (d) any Trustee may be removed at any special meeting of shareholders by a two-thirds vote of the outstanding voting securities of the trust. Each Trustee who is not an interested person of the trust and the fund (as defined in the 1940 Act) (Independent Trustee), shall retire not later than the last day of the calendar year in which his or her 75th birthday occurs. The Independent Trustees may waive this mandatory retirement age policy with respect to individual Trustees. The executive officers and Advisory Board Member hold office without limit in time, except that any officer and Advisory Board Member may resign or may be removed by a vote of a majority of the Trustees at any regular meeting or any special meeting of the Trustees. Except as indicated, each individual has held the office shown or other offices in the same company for the past five years.
Experience, Skills, Attributes, and Qualifications of the Fund's Trustees. The Governance and Nominating Committee has adopted a statement of policy that describes the experience, qualifications, attributes, and skills that are necessary and desirable for potential Independent Trustee candidates (Statement of Policy). The Board believes that each Trustee satisfied at the time he or she was initially elected or appointed a Trustee, and continues to satisfy, the standards contemplated by the Statement of Policy. The Governance and Nominating Committee also engages professional search firms to help identify potential Independent Trustee candidates who have the experience, qualifications, attributes, and skills consistent with the Statement of Policy. From time to time, additional criteria based on the composition and skills of the current Independent Trustees, as well as experience or skills that may be appropriate in light of future changes to board composition, business conditions, and regulatory or other developments, have also been considered by the professional search firms and the Governance and Nominating Committee. In addition, the Board takes into account the Trustees' commitment and participation in Board and committee meetings, as well as their leadership of standing and ad hoc committees throughout their tenure.
Annual Report
Trustees and Officers - continued
In determining that a particular Trustee was and continues to be qualified to serve as a Trustee, the Board has considered a variety of criteria, none of which, in isolation, was controlling. The Board believes that, collectively, the Trustees have balanced and diverse experience, qualifications, attributes, and skills, which allow the Board to operate effectively in governing the fund and protecting the interests of shareholders. Information about the specific experience, skills, attributes, and qualifications of each Trustee, which in each case led to the Board's conclusion that the Trustee should serve (or continue to serve) as a trustee of the fund, is provided below.
Board Structure and Oversight Function. James C. Curvey is an interested person (as defined in the 1940 Act) and currently serves as Chairman. The Trustees have determined that an interested Chairman is appropriate and benefits shareholders because an interested Chairman has a personal and professional stake in the quality and continuity of services provided to the fund. Independent Trustees exercise their informed business judgment to appoint an individual of their choosing to serve as Chairman, regardless of whether the Trustee happens to be independent or a member of management. The Independent Trustees have determined that they can act independently and effectively without having an Independent Trustee serve as Chairman and that a key structural component for assuring that they are in a position to do so is for the Independent Trustees to constitute a substantial majority for the Board. The Independent Trustees also regularly meet in executive session. Ned C. Lautenbach serves as Chairman of the Independent Trustees and as such (i) acts as a liaison between the Independent Trustees and management with respect to matters important to the Independent Trustees and (ii) with management prepares agendas for Board meetings.
Fidelity funds are overseen by different Boards of Trustees. The fund's Board oversees Fidelity's equity and high income funds and another Board oversees Fidelity's investment-grade bond, money market, and asset allocation funds. The asset allocation funds may invest in Fidelity funds overseen by the fund's Board. The use of separate Boards, each with its own committee structure, allows the Trustees of each group of Fidelity funds to focus on the unique issues of the funds they oversee, including common research, investment, and operational issues. On occasion, the separate Boards establish joint committees to address issues of overlapping consequences for the Fidelity funds overseen by each Board.
The Trustees operate using a system of committees to facilitate the timely and efficient consideration of all matters of importance to the Trustees, the fund, and fund shareholders and to facilitate compliance with legal and regulatory requirements and oversight of the fund's activities and associated risks. The Board, acting through its committees, has charged FMR and its affiliates with (i) identifying events or circumstances the occurrence of which could have demonstrably adverse effects on the fund's business and/or reputation; (ii) implementing processes and controls to lessen the possibility that such events or circumstances occur or to mitigate the effects of such events or circumstances if they do occur; and (iii) creating and maintaining a system designed to evaluate continuously business and market conditions in order to facilitate the identification and implementation processes described in (i) and (ii) above. Because the day-to-day operations and activities of the fund are carried out by or through FMR, its affiliates and other service providers, the fund's exposure to risks is mitigated but not eliminated by the processes overseen by the Trustees. While each of the Board's committees has responsibility for overseeing different aspects of the fund's activities, oversight is exercised primarily through the Operations, Audit, and Compliance Committees. In addition, the Independent Trustees have worked with FMR to enhance the Board's oversight of investment and financial risks, legal and regulatory risks, technology risks, and operational risks, including the development of additional risk reporting to the Board. For example, a working group comprised of Independent Trustees and FMR has worked and continues to work to review the Fidelity funds' valuation-related activities, reporting and risk management. Appropriate personnel, including but not limited to the fund's Chief Compliance Officer (CCO), FMR's internal auditor, the independent accountants, the fund's Treasurer and portfolio management personnel, make periodic reports to the Board's committees, as appropriate, including an annual review of FMR's risk management program for the Fidelity funds. The responsibilities of each standing committee, including their oversight responsibilities, are described further under "Standing Committees of the Fund's Trustees."
Annual Report
The fund's Statement of Additional Information (SAI) includes more information about the Trustees. To request a free copy, call Fidelity at 1-800-544-8544.
Interested Trustees*:
Correspondence intended for each Trustee who is an interested person may be sent to Fidelity Investments, 245 Summer Street, Boston, Massachusetts 02210.
Name, Year of Birth; Principal Occupations and Other Relevant Experience+ |
James C. Curvey (1935) |
Year of Election or Appointment: 2007 Trustee Chairman of the Board of Trustees |
| Mr. Curvey also serves as Trustee of other Fidelity funds. Mr. Curvey is a Director of Fidelity Investments Money Management, Inc. (2009-present), Director of Fidelity Research & Analysis Co. (2009-present) and Director of FMR and FMR Co., Inc. (2007-present). Mr. Curvey is also Vice Chairman (2007-present) and Director of FMR LLC. In addition, Mr. Curvey serves as an Overseer for the Boston Symphony Orchestra and a member of the Trustees of Villanova University. Previously, Mr. Curvey was the Vice Chairman (2006-2007) and Director (2000-2007) of FMR Corp. |
Ronald P. O'Hanley (1957) |
Year of Election or Appointment: 2011 Trustee |
| Mr. O'Hanley also serves as Trustee of other Fidelity funds. He is Director of Fidelity SelectCo, LLC (2013-present), FMR Co., Inc. (2010-present), Director of Fidelity Investments Money Management, Inc. (2010-present), Director of Fidelity Research & Analysis Company (2010-present), President of Fidelity Asset Management and Corporate Services and a Member of Fidelity's Executive Committee (2010-present). Previously, Mr. O'Hanley served as President and Chief Executive Officer of BNY Mellon Asset Management (2007-2010). Mr. O'Hanley also served as Vice Chairman of Bank New York Mellon Corp. and a member of that firm's Executive Committee. Prior to the 2007 merger of The Bank of New York and Mellon Financial Corporation, he was Vice Chairman of Mellon Financial Corporation and President and Chief Executive Officer of Mellon Asset Management. He joined Mellon in February 1997. Mr. O'Hanley currently serves as Chairman of the Boston Public Library Foundation Board of Directors and sits on the Board of Directors of Beth Israel Deaconess Medical Center, the Board of Trustees of the Marine Biological Laboratory and the Advisory Board of the Maxwell School of Citizenship and Public Administration at Syracuse University. Mr. O'Hanley also chairs the Council on Asset Management for the Financial Services Roundtable and is a member of the Board of Directors of Institutional Investor's U.S. Institute. |
* Trustees have been determined to be "Interested Trustees" by virtue of, among other things, their affiliation with the trust or various entities under common control with FMR.
+ The information above includes each Trustee's principal occupation during the last five years and other information relating to the experience, attributes, and skills relevant to each Trustee's qualifications to serve as a Trustee, which led to the conclusion that each Trustee should serve as a Trustee for the fund.
Annual Report
Independent Trustees:
Correspondence intended for each Independent Trustee (that is, the Trustees other than the Interested Trustees) may be sent to Fidelity Investments, P.O. Box 55235, Boston, Massachusetts 02205-5235.
Name, Year of Birth; Principal Occupations and Other Relevant Experience+ |
Dennis J. Dirks (1948) |
Year of Election or Appointment: 2005 Trustee |
| Mr. Dirks also serves as Trustee of other Fidelity funds. Prior to his retirement in May 2003, Mr. Dirks was Chief Operating Officer and a member of the Board of The Depository Trust & Clearing Corporation (DTCC). He also served as President, Chief Operating Officer, and Board member of The Depository Trust Company (DTC) and President and Board member of the National Securities Clearing Corporation (NSCC). In addition, Mr. Dirks served as Chief Executive Officer and Board member of the Government Securities Clearing Corporation, Chief Executive Officer and Board member of the Mortgage-Backed Securities Clearing Corporation, as a Trustee and a member of the Finance Committee of Manhattan College (2005-2008), and as a Trustee and a member of the Finance Committee of AHRC of Nassau County (2006-2008). Mr. Dirks is a member of the Independent Directors Council (IDC) Governing Council (2010-present) and Board of Directors for The Brookville Center for Children's Services, Inc. (2009-present). |
Alan J. Lacy (1953) |
Year of Election or Appointment: 2008 Trustee |
| Mr. Lacy also serves as Trustee of other Fidelity funds. Mr. Lacy serves as Senior Adviser (2007-present) of Oak Hill Capital Partners, L.P. (private equity). Mr. Lacy also served as Chief Executive Officer (2000-2005) and Vice Chairman (2005-2006) of Sears Holdings Corporation and Sears, Roebuck and Co. (retail). In addition, Mr. Lacy serves as a member of the Board of Directors of Dave & Buster's Entertainment, Inc. (restaurant and entertainment complexes, 2010-present), Earth Fare, Inc. (retail grocery, 2012-present), The Hillman Companies, Inc. (hardware wholesalers, 2010-present), and Bristol-Myers Squibb Company (global pharmaceuticals, 2008-present). Mr. Lacy is a member of the Board of Trustees of The National Parks Conservation Association (2006-present). Previously, Mr. Lacy served as Chairman of the Board of Trustees of the National Parks Conservation Association (2008-2011) and as a member of the Board of Directors for the Western Union Company (global money transfer, 2006-2011). |
Ned C. Lautenbach (1944) |
Year of Election or Appointment: 2000 Trustee Chairman of the Independent Trustees |
| Mr. Lautenbach also serves as Trustee of other Fidelity funds. Mr. Lautenbach currently serves as the Lead Director of the Eaton Corporation Board of Directors (diversified industrial, 1997-present). Mr. Lautenbach is Chairman of the Board of Directors of the Philharmonic Center for the Arts in Naples, Florida (2012-present) and a member of the Council on Foreign Relations (1994-present). Previously, Mr. Lautenbach was a Partner/Advisory Partner at Clayton, Dubilier & Rice, LLC (private equity investment, 1998-2010), as well as a Director of Sony Corporation (2006-2007). |
Joseph Mauriello (1944) |
Year of Election or Appointment: 2008 Trustee |
| Mr. Mauriello also serves as Trustee of other Fidelity funds. Prior to his retirement in January 2006, Mr. Mauriello served in numerous senior management positions including Deputy Chairman and Chief Operating Officer (2004-2005), and Vice Chairman of Financial Services (2002-2004) of KPMG LLP US (professional services, 1965-2005). Mr. Mauriello currently serves as a member of the Board of Directors of XL Group plc. (global insurance and re-insurance, 2006-present). Previously, Mr. Mauriello served as a Director of the Hamilton Funds of the Bank of New York (2006-2007) and of Arcadia Resources Inc. (health care services and products, 2007-2012). |
Robert W. Selander (1950) |
Year of Election or Appointment: 2011 Trustee |
| Mr. Selander also serves as Trustee of other Fidelity funds. Previously, Mr. Selander served as a Member of the Advisory Board of other Fidelity funds (2011), and Executive Vice Chairman (2010), Chief Executive Officer (2009-2010), and President and Chief Executive Officer (1997-2009) of Mastercard, Inc. |
Cornelia M. Small (1944) |
Year of Election or Appointment: 2005 Trustee |
| Ms. Small also serves as Trustee of other Fidelity funds. Ms. Small is a member of the Board of Directors (2009-present) and Chair of the Investment Committee (2010-present) of the Teagle Foundation. Ms. Small also serves on the Investment Committee of the Berkshire Taconic Community Foundation (2008-present). Previously, Ms. Small served as Chairperson (2002-2008) and a member of the Investment Committee and Chairperson (2008-2012) and a member of the Board of Trustees of Smith College. In addition, Ms. Small served as Chief Investment Officer, Director of Global Equity Investments, and a member of the Board of Directors of Scudder, Stevens & Clark and Scudder Kemper Investments. |
William S. Stavropoulos (1939) |
Year of Election or Appointment: 2001 Trustee Vice Chairman of the Independent Trustees |
| Mr. Stavropoulos also serves as Trustee of other Fidelity funds. Mr. Stavropoulos serves as President and Founder of the Michigan Baseball Foundation, the Great Lakes Loons (2007-present). Mr. Stavropoulos is Chairman Emeritus of the Board of Directors of The Dow Chemical Company, where he previously served in numerous senior management positions, including President, CEO (1995-2000; 2002-2004), Chairman of the Executive Committee (2000-2006), and as a member of the Board of Directors (1990-2006). Currently, Mr. Stavropoulos is Chairman of the Board of Directors of Univar Inc. (global distributor of commodity and specialty chemicals), a Director of Teradata Corporation (data warehousing and technology solutions), and Maersk Inc. (industrial conglomerate), and a member of the Advisory Board for Metalmark Capital LLC (private equity investment, 2005-present). Mr. Stavropoulos is an operating advisor to Clayton, Dubilier & Rice, LLC (private equity investment). In addition, Mr. Stavropoulos is a member of the University of Notre Dame Advisory Council for the College of Science, a Trustee of the Rollin L. Gerstacker Foundation, and a Director of the Naples Philharmonic Center for the Arts. Previously, Mr. Stavropoulos served as a Director of Chemical Financial Corporation (bank holding company, 1993-2012) and Tyco International, Ltd. (multinational manufacturing and services, 2007-2012). |
David M. Thomas (1949) |
Year of Election or Appointment: 2008 Trustee |
| Mr. Thomas also serves as Trustee of other Fidelity funds. Mr. Thomas serves as Non-Executive Chairman of the Board of Directors of Fortune Brands Home and Security (home and security products, 2011-present), and as a member of the Board of Directors of Interpublic Group of Companies, Inc. (marketing communication, 2004-present). Previously, Mr. Thomas served as Executive Chairman (2005-2006) and Chairman and Chief Executive Officer (2000-2005) of IMS Health, Inc. (pharmaceutical and healthcare information solutions), and a Director of Fortune Brands, Inc. (consumer products, 2000-2011). |
+ The information above includes each Trustee's principal occupation during the last five years and other information relating to the experience, attributes, and skills relevant to each Trustee's qualifications to serve as a Trustee, which led to the conclusion that each Trustee should serve as a Trustee for the fund.
Advisory Board Member and Executive Officers:
Correspondence intended for each executive officer and Peter S. Lynch may be sent to Fidelity Investments, 245 Summer Street, Boston, Massachusetts 02210. Executive officers appear below in alphabetical order.
Name, Year of Birth; Principal Occupation |
Peter S. Lynch (1944) |
Year of Election or Appointment: 2003 Member of the Advisory Board |
| Mr. Lynch also serves as Member of the Advisory Board of other Fidelity funds. Mr. Lynch is Vice Chairman and a Director of FMR and FMR Co., Inc. In addition, Mr. Lynch serves as a Trustee of Boston College and as the Chairman of the Inner-City Scholarship Fund. Previously, Mr. Lynch served on the Special Olympics International Board of Directors (1997-2006). |
Elizabeth Paige Baumann (1968) |
Year of Election or Appointment: 2012 Anti-Money Laundering (AML) Officer |
| Ms. Baumann also serves as AML Officer of other funds. She is Chief AML Officer of FMR LLC (2012-present) and is an employee of Fidelity Investments. Previously, Ms. Baumann served as Vice President and Deputy Anti-Money Laundering Officer (2007-2012). |
William C. Coffey (1969) |
Year of Election or Appointment: 2009 Assistant Secretary |
| Mr. Coffey also serves as Assistant Secretary of other funds. He is Senior Vice President and Deputy General Counsel of FMR LLC (2010-present), and is an employee of Fidelity Investments. Previously, Mr. Coffey served as Vice President and Associate General Counsel of FMR LLC (2005-2009). |
Jonathan Davis (1968) |
Year of Election or Appointment: 2010 Assistant Treasurer |
| Mr. Davis also serves as Assistant Treasurer of other funds. Mr. Davis is an employee of Fidelity Investments. Previously, Mr. Davis served as Vice President and Associate General Counsel of FMR LLC (2003-2010). |
Adrien E. Deberghes (1967) |
Year of Election or Appointment: 2008 Deputy Treasurer |
| Mr. Deberghes also serves as an officer of other funds. He is an employee of Fidelity Investments (2008-present). Prior to joining Fidelity Investments, Mr. Deberghes was Senior Vice President of Mutual Fund Administration at State Street Corporation (2007-2008), Senior Director of Mutual Fund Administration at Investors Bank & Trust (2005-2007), and Director of Finance for Dunkin' Brands (2000-2005). |
Stephanie J. Dorsey (1969) |
Year of Election or Appointment: 2010 Assistant Treasurer |
| Ms. Dorsey also serves as an officer of other funds. She is an employee of Fidelity Investments (2008-present) and has served in other fund officer roles. Prior to joining Fidelity Investments, Ms. Dorsey served as Treasurer (2004-2008) of the JPMorgan Mutual Funds and Vice President (2004-2008) of JPMorgan Chase Bank. |
Scott C. Goebel (1968) |
Year of Election or Appointment: 2008 Secretary and Chief Legal Officer (CLO) |
| Mr. Goebel serves as Secretary and CLO of other funds. Mr. Goebel also serves as Secretary of Fidelity Investments Money Management, Inc. (FIMM) (2010-present) and Fidelity Research and Analysis Company (FRAC) (2010-present); General Counsel, Secretary, and Senior Vice President of FMR (2008-present) and FMR Co., Inc. (2008-present); Chief Legal Officer of Fidelity Management & Research (Hong Kong) Limited (2008-present) and Assistant Secretary of Fidelity Management & Research (Japan) Inc. (2008-present), and Fidelity Management & Research (U.K.) Inc. (2008-present). Previously, Mr. Goebel served as Secretary and CLO of other Fidelity funds (2008-2013), Assistant Secretary of FIMM (2008-2010), FRAC (2008-2010), and certain funds (2007-2008); and as Vice President and Secretary of Fidelity Distributors Corporation (FDC) (2005-2007). Mr. Goebel has been employed by FMR LLC or an affiliate since 2001. |
Joseph A. Hanlon (1968) |
Year of Election or Appointment: 2012 Chief Compliance Officer |
| Mr. Hanlon also serves as Chief Compliance Officer of other funds. Mr. Hanlon serves as Compliance Officer of FMR, FMR Co., Inc., Fidelity Investments Money Management, Inc. (FIMM), Fidelity Research and Analysis Company (FRAC), and Fidelity Management & Research (Hong Kong) (2009-present), as Senior Vice President of the Fidelity Asset Management Division (2009-present), and is an employee of Fidelity Investments. Previously, Mr. Hanlon served as Compliance Officer of Fidelity Management & Research (Japan) Inc. (2009-2013), Strategic Advisers, Inc. (2009-2013), and Fidelity Management & Research (U.K.) Inc. (2009-2013). |
Bruce T. Herring (1965) |
Year of Election or Appointment: 2006 Vice President of certain Equity Funds |
| Mr. Herring also serves as Vice President of other funds. He serves as Chief Investment Officer of Fidelity Global Asset Allocation (GAA) (2013-present), Chief Investment Officer and Director of Fidelity Management & Research (U.K.) Inc. (2010-present), Group Chief Investment Officer of FMR, and President of Fidelity Research & Analysis Company (2010-present). Previously, Mr. Herring served as Vice President (2005-2006) and Senior Vice President (2006-2007) of Fidelity Management & Research Company, Vice President of FMR Co., Inc. (2001-2007), and as a portfolio manager for Fidelity U.S. Equity Funds. |
Brian B. Hogan (1964) |
Year of Election or Appointment: 2009 Vice President |
| Mr. Hogan also serves as Vice President of other funds. Mr. Hogan serves as President of FMR's Equity Division (2009-present). Previously, Mr. Hogan served as Senior Vice President, Equity Research of FMR (2006-2009) and as a portfolio manager. |
Chris Maher (1972) |
Year of Election or Appointment: 2013 Assistant Treasurer |
| Mr. Maher serves as Assistant Treasurer of other funds. Mr. Maher is Vice President of Valuation Oversight and is an employee of Fidelity Investments. Previously, Mr. Maher served as Vice President of Asset Management Compliance (2013), Vice President of FMR's Program Management Group (2010-2013), and Vice President of Valuation Oversight (2008-2010). |
Christine Reynolds (1958) |
Year of Election or Appointment: 2008 Chief Financial Officer |
| Ms. Reynolds also serves as Chief Financial Officer of other funds. Ms. Reynolds became President of Fidelity Pricing and Cash Management Services (FPCMS) in August 2008. Ms. Reynolds served as Chief Operating Officer of FPCMS (2007-2008). Previously, Ms. Reynolds served as President, Treasurer, and Anti-Money Laundering officer of the Fidelity funds (2004-2007). |
Kenneth B. Robins (1969) |
Year of Election or Appointment: 2008 President and Treasurer |
| Mr. Robins also serves as an officer of other funds. Mr. Robins serves as Executive Vice President of Fidelity Investments Money Management, Inc. (FIMM) (2013-present) and is an employee of Fidelity Investments (2004-present). Previously, Mr. Robins served in other fund officer roles. |
Gary W. Ryan (1958) |
Year of Election or Appointment: 2005 Assistant Treasurer |
| Mr. Ryan also serves as Assistant Treasurer of other funds. Mr. Ryan is an employee of Fidelity Investments and has served in other fund officer roles. Previously, Mr. Ryan served as Vice President of Fund Reporting in Fidelity Pricing and Cash Management Services (FPCMS) (1999-2005). |
Stephen Sadoski (1971) |
Year of Election or Appointment: 2012 Deputy Treasurer |
| Mr. Sadoski also serves as Deputy Treasurer of other funds. He is an employee of Fidelity Investments (2012-present) and has served in another fund officer role. Prior to joining Fidelity Investments, Mr. Sadoski served as an assistant chief accountant in the Division of Investment Management of the Securities and Exchange Commission (SEC) (2009-2012) and as a senior manager at Deloitte & Touche LLP (1997-2009). |
Stacie M. Smith (1974) |
Year of Election or Appointment: 2013 Deputy Treasurer |
| Ms. Smith also serves as an officer of other funds. She is an employee of Fidelity Investments (2009-present) and has served in other fund officer roles. Prior to joining Fidelity Investments, Ms. Smith served as Senior Audit Manager of Ernst & Young LLP (1996-2009). |
Renee Stagnone (1975) |
Year of Election or Appointment: 2013 Deputy Treasurer |
| Ms. Stagnone also serves as Deputy Treasurer of other funds. Ms. Stagnone is an employee of Fidelity Investments. |
Joseph F. Zambello (1957) |
Year of Election or Appointment: 2011 Deputy Treasurer |
| Mr. Zambello also serves as Deputy Treasurer of other funds. Mr. Zambello is an employee of Fidelity Investments. Previously, Mr. Zambello served as Vice President of FMR's Program Management Group (2009-2011) and Vice President of the Transfer Agent Oversight Group (2005-2009). |
Annual Report
The Board of Trustees of Fidelity International Value Fund voted to pay on December 09, 2013, to shareholders of record at the opening of business on December 6, 2013, a distribution of $0.014 per share derived from capital gains realized from sales of portfolio securities and a dividend of $0.197 per share from net investment income.
The fund designates 76% of the dividends distributed in December 2012 during the fiscal year as amounts which may be taken into account as a dividend for the purposes of the maximum rate under section 1(h)(11) of the Internal Revenue Code.
The amounts per share which represent income derived from sources within, and taxes paid to, foreign countries or possessions of the United States are as follows:
| Pay Date | Income | Taxes |
International Value Fund | 12/10/12 | $0.195 | $0.0098 |
The fund will notify shareholders in January 2014 of amounts for use in preparing 2013 income tax returns.
Annual Report
Board Approval of Investment Advisory Contracts and Management Fees
Fidelity International Value Fund
Each year, the Board of Trustees, including the Independent Trustees (together, the Board), votes on the renewal of the management contract and sub-advisory agreements (together, the Advisory Contracts) for the fund. The Board, assisted by the advice of fund counsel and Independent Trustees' counsel, requests and considers a broad range of information relevant to the renewal of the Advisory Contracts throughout the year.
The Board meets regularly and, at each of its meetings, covers an extensive agenda of topics and materials and considers factors that are relevant to its annual consideration of the renewal of the fund's Advisory Contracts, including the services and support provided to the fund and its shareholders. The Board has established various standing committees, each composed of and chaired by Independent Trustees with varying backgrounds, to which the Board has assigned specific subject matter responsibilities in order to enhance effective decision-making by the Board. The Board, acting directly and through its Committees, requests and receives information concerning the annual consideration of the renewal of the fund's Advisory Contracts. The Board also meets as needed to consider matters specifically related to the Board's annual consideration of the renewal of Advisory Contracts. Members of the Board may also meet with trustees of other Fidelity funds through ad hoc joint committees to discuss certain matters relevant to the Fidelity funds.
At its July 2013 meeting, the Board, including the Independent Trustees, unanimously determined to renew the fund's Advisory Contracts. In reaching its determination, the Board considered all factors it believed relevant, including (i) the nature, extent, and quality of the services to be provided to the fund and its shareholders (including the investment performance of the fund); (ii) the competitiveness of the fund's management fee and total expense ratio relative to peer funds; (iii) the total costs of the services to be provided by and the profits to be realized by Fidelity from its relationship with the fund; (iv) the extent to which economies of scale exist and would be realized as the fund grows; and (v) whether fee levels reflect these economies of scale, if any, for the benefit of fund shareholders.
In considering whether to renew the Advisory Contracts for the fund, the Board reached a determination, with the assistance of fund counsel and Independent Trustees' counsel and through the exercise of its business judgment, that the renewal of the Advisory Contracts was in the best interests of the fund and its shareholders and that the compensation payable under the Advisory Contracts was fair and reasonable. The Board's decision to renew the Advisory Contracts was not based on any single factor, but rather was based on a comprehensive consideration of all the information provided to the Board at its meetings throughout the year. The Board, in reaching its determination to renew the Advisory Contracts, was aware that shareholders in the fund have a broad range of investment choices available to them, including a wide choice among mutual funds offered by Fidelity's competitors, and that the fund's shareholders, who have the opportunity to review and weigh the disclosure provided by the fund in its prospectus and other public disclosures, have chosen to invest in this fund, which is a part of the Fidelity family of funds.
Annual Report
Nature, Extent, and Quality of Services Provided. The Board considered the staffing within the investment adviser, Fidelity Management & Research Company (FMR), and the sub-advisers (together, the Investment Advisers) as it relates to the fund, including the backgrounds of the fund's investment personnel, and also considered the fund's investment objective, strategies, and related investment philosophy. The Independent Trustees also had discussions with senior management of Fidelity's investment operations and investment groups. The Board considered the structure of the portfolio manager compensation program and whether this structure provides appropriate incentives to act in the best interests of the fund.
Resources Dedicated to Investment Management and Support Services. The Board and the Fund Oversight and Research Committees reviewed the general qualifications and capabilities of the Investment Advisers' investment staff, including its size, education, experience, and resources, as well as the Investment Advisers' approach to recruiting, training, managing, and compensating investment personnel. The Board noted that FMR has continued to increase the resources devoted to non-U.S. offices, including expansion of Fidelity's global investment organization. The Board also noted that Fidelity's analysts have extensive resources, tools and capabilities that allow them to conduct sophisticated quantitative and fundamental analysis, as well as credit analysis of issuers, counterparties and guarantors. Further, the Board believes that Fidelity's investment professionals have sufficient access to global information and data so as to provide competitive investment results over time, and that those professionals also have access to sophisticated tools that permit them to assess portfolio construction and risk and performance attribution characteristics continuously, as well as to transmit new information and research conclusions rapidly around the world. Additionally, in its deliberations, the Board considered the Investment Advisers' trading and risk management capabilities and resources, which are an integral part of the investment management process.
Shareholder and Administrative Services. The Board considered (i) the nature, extent, quality, and cost of advisory, administrative, and shareholder services performed by the Investment Advisers and their affiliates under the Advisory Contracts and under separate agreements covering transfer agency, pricing and bookkeeping, and securities lending services for the fund; (ii) the nature and extent of the supervision of third party service providers, principally custodians and subcustodians; and (iii) the resources devoted to, and the record of compliance with, the fund's compliance policies and procedures. The Board also reviewed the allocation of fund brokerage, including allocations to brokers affiliated with the Investment Advisers, the use of brokerage commissions to pay fund expenses, and the use of "soft" commission dollars to pay for research services.
Annual Report
Board Approval of Investment Advisory Contracts and
Management Fees - continued
The Board noted that the growth of fund assets over time across the complex allows Fidelity to reinvest in the development of services designed to enhance the value or convenience of the Fidelity funds as investment vehicles. These services include 24-hour access to account information and market information through telephone representatives and over the Internet, investor education materials and asset allocation tools, and the expanded availability of Fidelity Investor Centers.
Investment in a Large Fund Family. The Board considered the benefits to shareholders of investing in a Fidelity fund, including the benefits of investing in a fund that is part of a large family of funds offering a variety of investment disciplines and providing a large variety of mutual fund investor services. The Board noted that Fidelity had taken, or had made recommendations that resulted in the Fidelity funds taking, a number of actions over the previous year that benefited particular funds, including (i) continuing to dedicate additional resources to investment research and to the support of the senior management team that oversees asset management; (ii) persisting in efforts to enhance Fidelity's global research capabilities; (iii) launching new funds and making other enhancements to meet client needs for global and income-oriented solutions; (iv) continuing to launch dedicated lower cost underlying funds to meet portfolio construction needs related to expanding underlying fund options for Fidelity funds of funds, specifically for the Freedom Fund product lines; (v) rationalizing product lines and gaining increased efficiencies through the mergers of several funds into other funds; (vi) strengthening Fidelity's index fund offerings by reducing investment minimums and adopting or lowering existing expense caps for certain funds and classes; (vii) enhancing Global Asset Allocation product offerings by launching new funds and strategies, including "open architecture" target date funds that utilize affiliated and unaffiliated sub-advisers; (viii) modifying the eligibility criteria for Institutional Class shares of Advisor funds to increase their marketability to a portion of the defined contribution plan market; (ix) creating a new low-cost retirement share class for certain Advisor funds to appeal to large retirement plans; (x) transitioning the management of certain Fidelity commodity funds to Geode Capital Management LLC, a registered commodity pool operator, while retaining administrative responsibilities for the funds; (xi) reorganizing a number of funds; and (xii) taking steps toward establishing a new Fidelity adviser to manage sector-based funds and products.
Investment Performance. The Board considered whether the fund has operated in accordance with its investment objective, as well as its record of compliance with its investment restrictions and its performance history. The Board noted that there was a portfolio management change for the fund in September 2011.
Annual Report
The Board took into account discussions with the Investment Advisers about fund investment performance that occur at Board meetings throughout the year. In this regard the Board noted that as part of regularly scheduled fund reviews and other reports to the Board on fund performance, the Board periodically considers annualized return information for the fund, for different time periods, measured against a securities market index ("benchmark index") and a peer group of mutual funds with similar objectives ("peer group"). In its evaluation of fund investment performance, the Board gave particular attention to information indicating changes in performance of certain Fidelity funds for specific time periods and the Investment Advisers' explanations for any overperformance or underperformance.
In addition to reviewing absolute and relative fund performance, the Independent Trustees periodically consider the appropriateness of fund performance metrics in evaluating the results achieved. In general, the Independent Trustees believe that fund performance should be evaluated based on net performance (after fees and expenses) of both the highest performing and lowest performing classes, where applicable, compared to appropriate benchmark indices, over appropriate time periods which may include full market cycles, and compared to peer groups, as applicable, over the same periods, taking into account relevant factors including the following: general market conditions; issuer-specific information; tactical opportunities for investment; and fund cash flows and other factors.
The Independent Trustees recognize that shareholders evaluate performance on a net basis over their own holding periods, for which one-, three-, and five-year periods are used as a proxy. For this reason, the performance information reviewed by the Board also included net cumulative calendar year total return information for the fund and an appropriate benchmark index and peer group for the most recent one-, three-, and five-year periods, as shown below. Returns are shown compared to the 25th percentile (top of box) and 75th percentile (bottom of box) of the peer universe. Returns of the benchmark index are "net MA," i.e., adjusted for tax withholding rates applicable to U.S.-based mutual funds organized as Massachusetts business trusts.
Annual Report
Board Approval of Investment Advisory Contracts and
Management Fees - continued
Fidelity International Value Fund

The Board also considered that the fund's management fee is subject to upward or downward adjustment depending upon whether, and to what extent, the fund's investment performance for the performance period exceeds, or is exceeded by, a securities index, thus leading to a performance adjustment for the same period. The Board noted that the performance adjustment provides FMR with a strong economic incentive to seek to achieve superior performance for the fund's shareholders and helps to more closely align the interests of FMR and the fund's shareholders.
Based on its review, the Board concluded that the nature, extent, and quality of services provided to the fund under the Advisory Contracts should benefit the fund's shareholders.
Competitiveness of Management Fee and Total Expense Ratio. The Board considered the fund's management fee and total expense ratio compared to "mapped groups" of competitive funds and classes. Fidelity creates "mapped groups" by combining similar Lipper investment objective categories that have comparable management fee characteristics. Combining Lipper investment objective categories aids the Board's management fee and total expense ratio comparisons by broadening the competitive group used for comparison and by reducing the number of universes to which various Fidelity funds are compared.
Management Fee. The Board considered two proprietary management fee comparisons for the 12-month periods shown in the chart below. The group of Lipper funds used by the Board for management fee comparisons is referred to below as the "Total Mapped Group." The Total Mapped Group comparison focuses on a fund's standing in terms of gross management fees before expense reimbursements or caps, and without giving effect to the fund's performance adjustment, relative to the total universe of funds with comparable investment mandates, regardless of whether their management fee structures also are comparable. Funds with comparable investment mandates offer exposure to similar types of securities. Funds with comparable management fee structures have similar management fee contractual arrangements (e.g., flat rate charged for advisory services, all-inclusive fee rate, etc.). "TMG %" represents the percentage of funds in the Total Mapped Group that had management fees that were lower than the fund's. For example, a TMG % of 16% means that 84% of the funds in the Total Mapped Group had higher management fees than the fund. The "Asset-Size Peer Group" (ASPG) comparison focuses on a fund's standing relative to a subset of non-Fidelity funds within the Total Mapped Group that are similar in size and management fee structure. The ASPG represents at least 15% of the funds in the Total Mapped Group with comparable asset size and management fee structures, subject to a minimum of 50 funds (or all funds in the Total Mapped Group if fewer than 50). Additional information, such as the ASPG quartile in which the fund's management fee ranked and the impact of the fund's performance adjustment, is also included in the chart and considered by the Board.
Annual Report
Fidelity International Value Fund

The Board noted that the fund's management fee ranked below the median of its Total Mapped Group and below the median of its ASPG for 2012. The Board also noted the effect of the fund's negative performance adjustment on the fund's management fee ranking.
Annual Report
Board Approval of Investment Advisory Contracts and
Management Fees - continued
Based on its review, the Board concluded that the fund's management fee is fair and reasonable in light of the services that the fund receives and the other factors considered.
Total Expense Ratio. In its review of each class's total expense ratio, the Board considered the fund's management fee as well as other fund or class expenses, as applicable, such as transfer agent fees, pricing and bookkeeping fees, fund-paid 12b-1 fees, and custodial, legal, and audit fees. The Board also noted the effects of any waivers and reimbursements on fees and expenses, as well as the impact of the fund's performance adjustment. As part of its review, the Board also considered the current and historical total expense ratios of each class of the fund compared to competitive fund median expenses. Each class of the fund is compared to those funds and classes in the Total Mapped Group (used by the Board for management fee comparisons) that have a similar sales load structure.
The Board noted that the total expense ratio of each of Class A, Class B, Institutional Class, and the retail class ranked below its competitive median for 2012 and the total expense ratio of each of Class T and Class C ranked above its competitive median for 2012. The Board considered that, in general, various factors can affect total expense ratios. The Board noted that the total expense ratio of Class T was above the competitive median primarily because of higher 12b-1 fees on Class T. Class T has a higher 12b-1 fee, but a lower front-end sales charge, than traditionally priced front-end sales charge classes. The Board considered that Class T is primarily sold load-waived in the retirement plan market where its 0.50% 12b-1 fee is comparable to competing no-load, higher 12b-1 fee classes designed specifically for retirement plans. The Board noted that the fund offers multiple classes, each of which has a different sales load and 12b-1 fee structure, and that the multiple structures are intended to offer a range of pricing options for the intermediary market. The Board also noted that the total expense ratios of the classes vary primarily by the level of their 12b-1 fees, although differences in transfer agent fees may also cause expenses to vary from class to class.
Fees Charged to Other Fidelity Clients. The Board also considered Fidelity fee structures and other information with respect to clients of FMR and its affiliates, such as other mutual funds advised or subadvised by FMR or its affiliates, pension plan clients, and other institutional clients. The Board noted the findings of the 2013 ad hoc joint committee (created with the board of other Fidelity funds), which reviewed and compared Fidelity's institutional investment advisory business with its business of providing services to the Fidelity funds, including the differences in services provided, fees charged, and costs incurred, as well as competition in their respective marketplaces.
Based on its review of total expense ratios and fees charged to other Fidelity clients, the Board concluded that the total expense ratio of each class of the fund was reasonable, although in some cases above the median of the universe presented for comparison, in light of the services that the fund and its shareholders receive and the other factors considered.
Annual Report
Costs of the Services and Profitability. The Board considered the revenues earned and the expenses incurred by Fidelity in conducting the business of developing, marketing, distributing, managing, administering and servicing the fund and servicing the fund's shareholders. The Board also considered the level of Fidelity's profits in respect of all the Fidelity funds.
On an annual basis, FMR presents to the Board Fidelity's profitability for the fund. Fidelity calculates the profitability for each fund, as well as aggregate profitability for groups of Fidelity funds and all Fidelity funds, using a series of detailed revenue and cost allocation methodologies which originate with the books and records of Fidelity on which Fidelity's audited financial statements are based. The Audit Committee of the Board reviews any significant changes from the prior year's methodologies.
PricewaterhouseCoopers LLP (PwC), independent registered public accounting firm and auditor to Fidelity and certain Fidelity funds, has been engaged annually by the Board as part of the Board's assessment of Fidelity's profitability analysis. PwC's engagement includes the review and assessment of the methodologies used by Fidelity in determining the revenues and expenses attributable to Fidelity's mutual fund business, and completion of agreed-upon procedures surrounding the mathematical accuracy of fund profitability and its conformity to allocation methodologies. After considering PwC's reports issued under the engagement and information provided by Fidelity, the Board concluded that while other allocation methods may also be reasonable, Fidelity's profitability methodologies are reasonable in all material respects.
The Board also reviewed Fidelity's non-fund businesses and fall-out benefits related to the mutual fund business as well as cases where Fidelity's affiliates may benefit from or be related to the fund's business.
The Board considered the costs of the services provided by and the profits realized by Fidelity in connection with the operation of the fund and was satisfied that the profitability was not excessive in the circumstances.
Economies of Scale. The Board considered whether there have been economies of scale in respect of the management of the Fidelity funds, whether the Fidelity funds (including the fund) have appropriately benefited from any such economies of scale, and whether there is potential for realization of any further economies of scale. The Board considered the extent to which the fund will benefit from economies of scale through increased services to the fund, through waivers or reimbursements, or through fee or expense reductions. The Board also noted that in 2009, it and the board of other Fidelity funds created an ad hoc committee (the Economies of Scale Committee) to analyze whether FMR attains economies of scale in respect of the management and servicing of the Fidelity funds, whether the Fidelity funds have appropriately benefited from such economies of scale, and whether there is potential for realization of any further economies of scale.
Annual Report
Board Approval of Investment Advisory Contracts and
Management Fees - continued
The Board recognized that the fund's management contract incorporates a "group fee" structure, which provides for lower group fee rates as total fund assets under FMR's management increase, and for higher group fee rates as total fund assets under FMR's management decrease. FMR calculates the group fee rates based on a tiered asset "breakpoint" schedule that varies based on asset class. The Board considered that the group fee is designed to deliver the benefits of economies of scale to fund shareholders when total Fidelity fund assets increase, even if assets of any particular fund are unchanged or have declined, because some portion of Fidelity's costs are attributable to services provided to all Fidelity funds, and all funds benefit if those costs can be allocated among more assets. The Board concluded that, given the group fee structure, fund shareholders will benefit from lower management fees as assets under FMR's management increase at the fund complex level, regardless of whether Fidelity achieves any such economies of scale.
The Board concluded, taking into account the analysis of the Economies of Scale Committee, that economies of scale, if any, are being appropriately shared between fund shareholders and Fidelity.
Amendment to Description of Group Fee Rate. At its July 2013 meeting, the Board voted to approve an amendment to the fund's management contract to modify the description of the "group fee rate" effective August 1, 2013. The Board noted that under the prior description in the contract, the group fee rate was based on the average net assets of all registered investment companies with which FMR has management contracts. Under the contract's tiered asset breakpoint schedule, the group fee rate is lower as total fund assets under FMR's management increase, and higher as total fund assets under FMR's management decrease. The Board considered that the prior description would have excluded the assets of 64 Fidelity sector funds from the group fee rate calculation once Fidelity SelectCo, LLC, an affiliate of FMR, assumed management responsibilities for those funds. The Board noted that modifying the description of the group fee rate to continue to include the assets of those 64 funds for purposes of determining group fee rate breakpoints would avoid an immediate adverse impact on the group fee rate for any fund.
Additional Information Requested by the Board. In order to develop fully the factual basis for consideration of the Fidelity funds' Advisory Contracts, the Board requested and received additional information on certain topics, including: (i) fund performance trends and Fidelity's long-term strategies for certain funds; (ii) the potential to further rationalize the Fidelity fund lineup with the possibility of achieving savings for the funds and Fidelity; (iii) the methodology with respect to competitive fund data and peer group classifications; (iv) the arrangements with, and performance of, certain sub-advisers on behalf of the Fidelity funds, as well as certain proposed participating affiliate arrangements; (v) the realization of fall-out benefits in certain Fidelity business units; (vi) Fidelity's group fee structures, including the rationale for the individual fee rates of certain categories of funds and the definition of group assets; (vii) trends regarding industry use of performance fee structures and the performance adjustment methodologies applicable to the Fidelity funds; (viii) additional competitive analysis regarding the total expenses for certain classes; and (ix) fund profitability methodology, including Fidelity's cost allocation methodology, and the impact of certain factors on fund profitability results.
Annual Report
Based on its evaluation of all of the conclusions noted above, and after considering all factors it believed relevant, the Board ultimately concluded that the advisory fee structures are fair and reasonable, and that the fund's Advisory Contracts should be renewed.
Annual Report
Investment Adviser
Fidelity Management & Research Company
Boston, MA
Investment Sub-Advisers
FMR Co., Inc.
Fidelity Management & Research
(U.K.) Inc.
Fidelity Management & Research
(Hong Kong) Limited
Fidelity Management & Research
(Japan) Inc.
FIL Investment Advisors
FIL Investment Advisors (U.K.) Limited
FIL Investments (Japan) Limited
General Distributor
Fidelity Distributors Corporation
Smithfield, RI
Transfer and Service Agents
Fidelity Investments Institutional
Operations Company, Inc.
Boston, MA
Fidelity Service Company, Inc.
Boston, MA
Custodian
The Northern Trust Company
Chicago, IL
The Fidelity Telephone Connection
Mutual Fund 24-Hour Service
Exchanges/Redemptions
and Account Assistance 1-800-544-6666
Product Information 1-800-544-8888
Retirement Accounts 1-800-544-4774
(8 a.m. - 9 p.m.)
TDD Service 1-800-544-0118
for the deaf and hearing impaired
(9 a.m. - 9 p.m. Eastern time)
Fidelity Automated Service
Telephone (FAST®)
1-800-544-5555
Automated line for quickest service
(Fidelity Investment logo)(registered trademark)
Corporate Headquarters
245 Summer St., Boston, MA 02210
www.fidelity.com
FIV-UANN-1213
1.827481.107
(Fidelity Investment logo)(registered trademark)
Fidelity Advisor®
International Value
Fund - Class A, Class T, Class B
and Class C
Annual Report
October 31, 2013
(Fidelity Cover Art)
Class A, Class T, Class B, and Class C are classes of Fidelity® International Value Fund
Contents
Performance | (Click Here) | How the fund has done over time. |
Management's Discussion of Fund Performance | (Click Here) | The Portfolio Manager's review of fund performance and strategy. |
Shareholder Expense Example | (Click Here) | An example of shareholder expenses. |
Investment Changes | (Click Here) | A summary of major shifts in the fund's investments over the past six months. |
Investments | (Click Here) | A complete list of the fund's investments with their market values. |
Financial Statements | (Click Here) | Statements of assets and liabilities, operations, and changes in net assets, as well as financial highlights. |
Notes | (Click Here) | Notes to financial statements. |
Report of Independent Registered Public Accounting Firm | (Click Here) | |
Trustees and Officers | (Click Here) | |
Distributions | (Click Here) | |
Board Approval of Investment Advisory Contracts and Management Fees | (Click Here) | |
To view a fund's proxy voting guidelines and proxy voting record for the 12-month period ended June 30, visit http://www.fidelity.com/proxyvotingresults or visit the Securities and Exchange Commission's (SEC) web site at http://www.sec.gov. You may also call 1-877-208-0098 to request a free copy of the proxy voting guidelines.
Standard & Poor's, S&P and S&P 500 are registered service marks of The McGraw-Hill Companies, Inc. and have been licensed for use by Fidelity Distributors Corporation.
Other third-party marks appearing herein are the property of their respective owners.
All other marks appearing herein are registered or unregistered trademarks or service marks of FMR LLC or an affiliated company. © 2013 FMR LLC. All rights reserved.
Annual Report
This report and the financial statements contained herein are submitted for the general information of the shareholders of the fund. This report is not authorized for distribution to prospective investors in the fund unless preceded or accompanied by an effective prospectus.
A fund files its complete schedule of portfolio holdings with the SEC for the first and third quarters of each fiscal year on Form N-Q. Forms N-Q are available on the SEC's web site at http://www.sec.gov. A fund's Forms N-Q may be reviewed and copied at the SEC's Public Reference Room in Washington, DC. Information regarding the operation of the SEC's Public Reference Room may be obtained by calling 1-800-SEC-0330. For a complete list of a fund's portfolio holdings, view the most recent holdings listing, semiannual report, or annual report on Fidelity's web site at http://www.fidelity.com, http://www.advisor.fidelity.com, or http://www.401k.com, as applicable.
NOT FDIC INSURED • MAY LOSE VALUE • NO BANK GUARANTEE
Neither the fund nor Fidelity Distributors Corporation is a bank.
Annual Report
Average annual total return reflects the change in the value of an investment, assuming reinvestment of the class' distributions from dividend income and capital gains (the profits earned upon the sale of securities that have grown in value, if any) and assuming a constant rate of performance each year. The $10,000 table and the fund's returns do not reflect the deduction of taxes that a shareholder would pay on fund distributions or the redemption of fund shares. During periods of reimbursement by Fidelity, a fund's total return will be greater than it would be had the reimbursement not occurred. How a fund did yesterday is no guarantee of how it will do tomorrow. Returns reflect the conversion of Class B shares to Class A shares after a maximum of seven years.
Average Annual Total Returns
Periods ended October 31, 2013 | Past 1
year | Past 5
years | Life of
fund A |
Class A (incl. 5.75% sales charge) | 18.04% | 10.00% | 0.29% |
Class T (incl. 3.50% sales charge) | 20.49% | 10.20% | 0.34% |
Class B (incl. contingent deferred sales charge)B | 19.30% | 10.20% | 0.39% |
Class C (incl. contingent deferred sales charge)C | 23.17% | 10.45% | 0.34% |
A From May 18, 2006.
B Class B shares' contingent deferred sales charges included in the past one year, past five years, and life of fund total return figures are 5%, 2%, and 0%, respectively.
C Class C shares' contingent deferred sales charges included in the past one year, past five years, and life of fund total return figures are 1%, 0%, and 0%, respectively.
Annual Report
$10,000 Over Life of Fund
Let's say hypothetically that $10,000 was invested in Fidelity Advisor® International Value Fund - Class A on May 18, 2006, when the fund started, and the current 5.75% sales charge was paid. The chart shows how the value of your investment would have changed, and also shows how the MSCI® EAFE® Value Index performed over the same period.
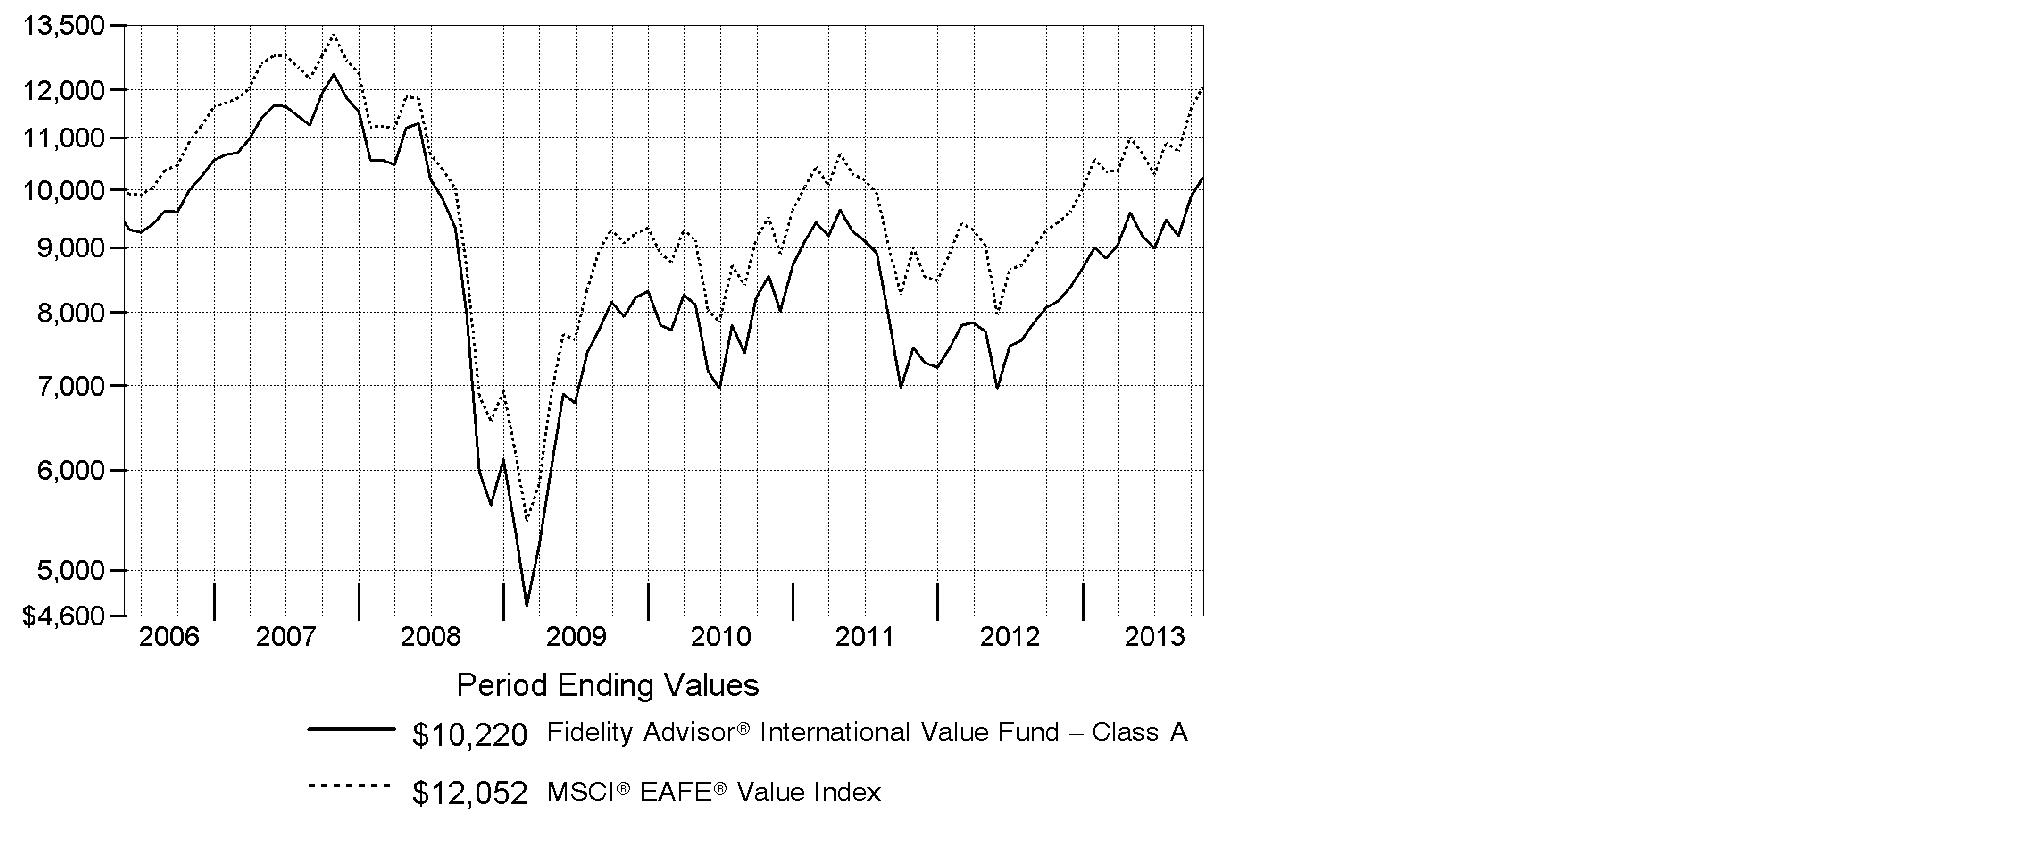
Annual Report
Market Recap: On balance, global equity markets remained upbeat for the 12-month period ending October 31, 2013. The MSCI® ACWI® (All Country World Index) Index gained 23.75% for the period, amid investor preference for higher-risk assets. The period was not without turbulence, however. In the spring and summer, central banks worldwide, especially in the U.S. and China, made clear their intentions to maintain accommodative monetary policies. That stance, combined with modest cyclical improvements around the globe and generally low valuations, underpinned the broad rally in equities. Europe (+32%) shone brightly, with most markets in the region - large and small - registering solid, index-beating gains. Another bright spot was Japan, which, despite a struggling yen and taking a second-half breather, posted a 34% result for the full year. The U.S. - by far the index's biggest constituent - also outperformed the global market with a roughly 28% advance. Meanwhile, Asia-Pacific ex Japan (+14%) lagged, hurt in part by a slowdown in Australia's mining industry as well as currency headwinds. Foreign-exchange and commodity weakness also curbed results in resource-heavy Canada and emerging markets (EM), both of which were up 7%. Country-level EM performance diverged meaningfully for the period, as evidenced by performance in Brazil (-1%), Russia (+12%), India (+1%) and China (+8%).
Comments from Alex Zavratsky, Portfolio Manager of Fidelity Advisor® International Value Fund: For the year, the fund's Class A, Class T, Class B and Class C shares rose 25.24%, 24.86%, 24.30% and 24.17%, respectively (excluding sales charges), trailing the 27.95% gain of the benchmark MSCI® EAFE® Value Index. The fund performed relatively well through the first half of the reporting period when investors generally gravitated towards the high-quality, steady compounders I seek. However, performance took a turn during the second half - specifically in the third quarter - when investors became more bullish on the European recovery. Versus the index, it hurt to largely avoid Germany-based Daimler - the world's third-largest luxury automobile manufacturer. Daimler's stock rose 85% during the past year amid an improving economic environment in Europe. Daimler was not held at period end. By contrast, a non-index investment in Japan-based SoftBank was a winner. The Internet and telecom-services provider saw significant growth during the period. In June, SoftBank completed its protracted takeover of telecom giant Sprint, the U.S.'s third-largest mobile carrier, and sported two consecutive quarters of better-than-expected financial results in the second half of the period. Additionally, the firm stands to benefit from the planned initial public offering of Alibaba, China's - and the world's - biggest Internet retailer, which is about 37% owned by SoftBank.
The views expressed above reflect those of the portfolio manager(s) only through the end of the period as stated on the cover of this report and do not necessarily represent the views of Fidelity or any other person in the Fidelity organization. Any such views are subject to change at any time based upon market or other conditions and Fidelity disclaims any responsibility to update such views. These views may not be relied on as investment advice and, because investment decisions for a Fidelity fund are based on numerous factors, may not be relied on as an indication of trading intent on behalf of any Fidelity fund.
Annual Report
Shareholder Expense Example
As a shareholder of the Fund, you incur two types of costs: (1) transaction costs, including sales charges (loads) on purchase payments or redemption proceeds, redemption fees and (2) ongoing costs, including management fees, distribution and/or service (12b-1) fees and other Fund expenses. This Example is intended to help you understand your ongoing costs (in dollars) of investing in the Fund and to compare these costs with the ongoing costs of investing in other mutual funds.
The Example is based on an investment of $1,000 invested at the beginning of the period and held for the entire period (May 1, 2013 to October 31, 2013).
Actual Expenses
The first line of the accompanying table for each class of the Fund provides information about actual account values and actual expenses. You may use the information in this line, together with the amount you invested, to estimate the expenses that you paid over the period. Simply divide your account value by $1,000.00 (for example, an $8,600 account value divided by $1,000.00 = 8.6), then multiply the result by the number in the first line for a class of the Fund under the heading entitled "Expenses Paid During Period" to estimate the expenses you paid on your account during this period. A small balance maintenance fee of $12.00 that is charged once a year may apply for certain accounts with a value of less than $2,000. This fee is not included in the table below. If it was, the estimate of expenses you paid during the period would be higher, and your ending account value lower, by this amount. In addition, the Fund, as a shareholder in the underlying Fidelity Central Funds, will indirectly bear its pro-rata share of the fees and expenses incurred by the underlying Fidelity Central Funds. These fees and expenses are not included in the Fund's annualized expense ratio used to calculate the expense estimate in the table below.
Hypothetical Example for Comparison Purposes
The second line of the accompanying table for each class of the Fund provides information about hypothetical account values and hypothetical expenses based on a Class' actual expense ratio and an assumed rate of return of 5% per year before expenses, which is not the Class' actual return. The hypothetical account values and expenses may not be used to estimate the actual ending account balance or expenses you paid for the period. You may use this information to compare the ongoing costs of investing in the Fund and other funds. To do so, compare this 5% hypothetical example with the 5% hypothetical examples that appear in the shareholder reports of the other funds. A small balance maintenance fee of $12.00 that is charged once a year may apply for certain accounts with a value of less than $2,000. This fee is not included in the table below. If it was, the estimate of expenses you paid during the period would be higher, and your ending account value lower, by this amount. In addition, the Fund, as a shareholder in the underlying Fidelity Central Funds, will indirectly bear its pro-rata share of the fees and expenses incurred by the underlying Fidelity Central Funds. These fees and expenses are not included in the Fund's annualized expense ratio used to calculate the expense estimate in the table below.
Please note that the expenses shown in the table are meant to highlight your ongoing costs only and do not reflect any transaction costs. Therefore, the second line of the table is useful in comparing ongoing costs only, and will not help you determine the relative total costs of owning different funds. In addition, if these transactional costs were included, your costs would have been higher.
Annual Report
| Annualized
Expense Ratio B | Beginning
Account Value
May 1, 2013 | Ending
Account Value
October 31, 2013 | Expenses Paid
During Period*
May 1, 2013
to October 31, 2013 |
Class A | 1.37% | | | |
Actual | | $ 1,000.00 | $ 1,066.70 | $ 7.14 |
HypotheticalA | | $ 1,000.00 | $ 1,018.30 | $ 6.97 |
Class T | 1.64% | | | |
Actual | | $ 1,000.00 | $ 1,065.60 | $ 8.54 |
HypotheticalA | | $ 1,000.00 | $ 1,016.94 | $ 8.34 |
Class B | 2.12% | | | |
Actual | | $ 1,000.00 | $ 1,062.70 | $ 11.02 |
HypotheticalA | | $ 1,000.00 | $ 1,014.52 | $ 10.76 |
Class C | 2.12% | | | |
Actual | | $ 1,000.00 | $ 1,061.80 | $ 11.02 |
HypotheticalA | | $ 1,000.00 | $ 1,014.52 | $ 10.76 |
International Value | 1.03% | | | |
Actual | | $ 1,000.00 | $ 1,069.10 | $ 5.37 |
HypotheticalA | | $ 1,000.00 | $ 1,020.01 | $ 5.24 |
Institutional Class | 1.03% | | | |
Actual | | $ 1,000.00 | $ 1,069.00 | $ 5.37 |
HypotheticalA | | $ 1,000.00 | $ 1,020.01 | $ 5.24 |
A 5% return per year before expenses
B Annualized expense ratio reflects expenses net of applicable fee waivers.
* Expenses are equal to each Class' annualized expense ratio, multiplied by the average account value over the period, multiplied by 184/365 (to reflect the one-half year period).
Annual Report
Investment Changes (Unaudited)
Geographic Diversification (% of fund's net assets) |
As of October 31, 2013 |
 | United Kingdom 24.7% | |
 | Japan 19.0% | |
 | France 15.6% | |
 | Germany 9.1% | |
 | Australia 6.8% | |
 | Switzerland 5.7% | |
 | Netherlands 3.2% | |
 | Spain 3.1% | |
 | United States of America* 2.6% | |
 | Other 10.2% | |

* Includes short-term investments and net other assets (liabilities) |
Percentages are based on country or territory of incorporation and are adjusted for the effect of futures contracts, if applicable. |
As of April 30, 2013 |
| United Kingdom 26.6% | |
| Japan 19.2% | |
| Germany 8.9% | |
| Switzerland 8.6% | |
| Australia 8.3% | |
| France 7.8% | |
| Singapore 3.3% | |
| Spain 2.8% | |
| Netherlands 2.4% | |
| Other* 12.1% | |

* Includes short-term investments and net other assets (liabilities) |
Percentages are based on country or territory of incorporation and are adjusted for the effect of futures contracts, if applicable. |
Asset Allocation as of October 31, 2013 |
| % of fund's
net assets | % of fund's net assets
6 months ago |
Stocks | 98.2 | 97.9 |
Short-Term Investments and Net Other Assets (Liabilities) | 1.8 | 2.1 |
Top Ten Stocks as of October 31, 2013 |
| % of fund's
net assets | % of fund's net assets
6 months ago |
HSBC Holdings PLC sponsored ADR (United Kingdom, Commercial Banks) | 3.7 | 3.6 |
Total SA (France, Oil, Gas & Consumable Fuels) | 3.6 | 0.0 |
Sanofi SA (France, Pharmaceuticals) | 3.4 | 3.7 |
Vodafone Group PLC sponsored ADR (United Kingdom, Wireless Telecommunication Services) | 3.4 | 3.2 |
Royal Dutch Shell PLC Class A sponsored ADR (United Kingdom, Oil, Gas & Consumable Fuels) | 2.6 | 4.0 |
Australia & New Zealand Banking Group Ltd. (Australia, Commercial Banks) | 2.3 | 2.4 |
Westpac Banking Corp. (Australia, Commercial Banks) | 2.2 | 2.7 |
Sumitomo Mitsui Financial Group, Inc. (Japan, Commercial Banks) | 2.2 | 2.5 |
BNP Paribas SA (France, Commercial Banks) | 1.9 | 1.6 |
BASF AG (Germany, Chemicals) | 1.9 | 0.5 |
| 27.2 | |
Market Sectors as of October 31, 2013 |
| % of fund's
net assets | % of fund's net assets
6 months ago |
Financials | 31.7 | 34.8 |
Health Care | 10.7 | 12.1 |
Consumer Discretionary | 10.2 | 8.6 |
Telecommunication Services | 10.2 | 8.5 |
Industrials | 9.2 | 6.3 |
Materials | 7.1 | 6.0 |
Energy | 6.9 | 7.7 |
Consumer Staples | 6.3 | 6.2 |
Information Technology | 3.3 | 2.3 |
Utilities | 2.6 | 5.4 |
Annual Report
Investments October 31, 2013
Showing Percentage of Net Assets
Common Stocks - 96.7% |
| Shares | | Value |
Australia - 6.8% |
Ansell Ltd. | 47,969 | | $ 883,636 |
Australia & New Zealand Banking Group Ltd. | 139,122 | | 4,449,661 |
Telstra Corp. Ltd. | 331,729 | | 1,624,104 |
Transurban Group unit | 143,240 | | 961,221 |
Westfield Group unit | 98,459 | | 1,006,893 |
Westpac Banking Corp. | 135,554 | | 4,393,196 |
TOTAL AUSTRALIA | | 13,318,711 |
Bailiwick of Guernsey - 0.1% |
Resolution Ltd. | 43,079 | | 246,866 |
Bailiwick of Jersey - 1.0% |
Informa PLC | 105,010 | | 942,047 |
Wolseley PLC | 18,760 | | 1,010,982 |
TOTAL BAILIWICK OF JERSEY | | 1,953,029 |
Belgium - 1.3% |
Anheuser-Busch InBev SA NV | 7,400 | | 767,112 |
KBC Groupe SA | 16,551 | | 902,256 |
UCB SA | 11,800 | | 775,759 |
TOTAL BELGIUM | | 2,445,127 |
Bermuda - 0.4% |
Hongkong Land Holdings Ltd. | 129,000 | | 794,640 |
Denmark - 0.6% |
A.P. Moller - Maersk A/S Series B | 126 | | 1,219,114 |
Finland - 1.4% |
Nokia Corp. (a) | 114,033 | | 866,741 |
Sampo Oyj (A Shares) | 40,034 | | 1,896,487 |
TOTAL FINLAND | | 2,763,228 |
France - 15.6% |
Arkema SA | 10,899 | | 1,237,419 |
Atos Origin SA | 15,318 | | 1,307,779 |
BNP Paribas SA | 51,004 | | 3,776,932 |
Cap Gemini SA | 16,693 | | 1,098,115 |
Carrefour SA | 40,136 | | 1,470,266 |
GDF Suez | 78,307 | | 1,949,933 |
Havas SA | 106,875 | | 890,392 |
Kering SA | 4,642 | | 1,054,753 |
Renault SA | 16,119 | | 1,411,838 |
Sanofi SA | 61,770 | | 6,586,117 |
Schneider Electric SA | 7,135 | | 601,112 |
Common Stocks - continued |
| Shares | | Value |
France - continued |
Total SA | 114,528 | | $ 7,026,634 |
Vivendi SA | 81,096 | | 2,058,471 |
TOTAL FRANCE | | 30,469,761 |
Germany - 7.6% |
Allianz SE | 17,093 | | 2,875,474 |
BASF AG | 36,013 | | 3,746,950 |
Bayer AG | 18,190 | | 2,260,807 |
Deutsche Post AG | 53,459 | | 1,809,155 |
Fresenius SE & Co. KGaA | 8,300 | | 1,078,812 |
HeidelbergCement Finance AG | 13,939 | | 1,098,825 |
Siemens AG | 15,408 | | 1,969,024 |
TOTAL GERMANY | | 14,839,047 |
Hong Kong - 0.9% |
Hysan Development Co. Ltd. | 210,000 | | 981,878 |
Wing Hang Bank Ltd. | 57,265 | | 814,695 |
TOTAL HONG KONG | | 1,796,573 |
Italy - 0.2% |
Unione di Banche Italiane ScpA | 68,032 | | 471,089 |
Japan - 19.0% |
AEON Financial Service Co. Ltd. | 13,400 | | 411,517 |
AEON Mall Co. Ltd. | 19,900 | | 565,179 |
Air Water, Inc. | 40,000 | | 571,771 |
Astellas Pharma, Inc. | 17,500 | | 975,562 |
Daikin Industries Ltd. | 13,900 | | 799,714 |
DENSO Corp. | 15,500 | | 745,060 |
Dentsu, Inc. | 20,900 | | 789,648 |
East Japan Railway Co. | 9,600 | | 833,959 |
Hoya Corp. | 53,200 | | 1,275,702 |
Isuzu Motors Ltd. | 124,000 | | 772,220 |
Itochu Corp. | 99,200 | | 1,192,795 |
Japan Exchange Group, Inc. | 23,800 | | 553,306 |
Japan Tobacco, Inc. | 43,400 | | 1,570,372 |
JFE Holdings, Inc. | 40,000 | | 909,388 |
JTEKT Corp. | 61,700 | | 792,122 |
Kansai Electric Power Co., Inc. (a) | 61,200 | | 774,610 |
KDDI Corp. | 32,300 | | 1,749,255 |
Leopalace21 Corp. (a) | 46,800 | | 324,909 |
Mitsubishi Electric Corp. | 95,000 | | 1,044,237 |
MS&AD Insurance Group Holdings, Inc. | 43,000 | | 1,111,866 |
Common Stocks - continued |
| Shares | | Value |
Japan - continued |
Nippon Telegraph & Telephone Corp. | 28,300 | | $ 1,471,043 |
Omron Corp. | 21,900 | | 835,731 |
ORIX Corp. | 102,000 | | 1,766,751 |
Santen Pharmaceutical Co. Ltd. | 18,600 | | 944,243 |
Seven & i Holdings Co., Ltd. | 36,200 | | 1,339,713 |
Seven Bank Ltd. | 168,100 | | 594,949 |
Shinsei Bank Ltd. | 355,000 | | 831,164 |
SoftBank Corp. | 14,900 | | 1,112,716 |
Sumitomo Corp. | 82,000 | | 1,067,091 |
Sumitomo Mitsui Financial Group, Inc. | 89,100 | | 4,306,728 |
Sumitomo Mitsui Trust Holdings, Inc. | 287,000 | | 1,417,518 |
Tokyo Tatemono Co. Ltd. | 71,000 | | 666,548 |
Toyota Motor Corp. | 34,100 | | 2,210,982 |
USS Co. Ltd. | 54,100 | | 792,267 |
TOTAL JAPAN | | 37,120,636 |
Netherlands - 3.2% |
AEGON NV | 77,771 | | 618,815 |
ING Groep NV (Certificaten Van Aandelen) (a) | 103,600 | | 1,316,520 |
Koninklijke Philips Electronics NV | 58,871 | | 2,080,544 |
Royal DSM NV | 16,756 | | 1,269,248 |
Unilever NV (Certificaten Van Aandelen) (Bearer) | 23,931 | | 948,756 |
TOTAL NETHERLANDS | | 6,233,883 |
Norway - 1.1% |
Telenor ASA | 86,977 | | 2,089,301 |
Singapore - 1.7% |
Singapore Telecommunications Ltd. | 604,000 | | 1,837,965 |
United Overseas Bank Ltd. | 89,480 | | 1,501,178 |
TOTAL SINGAPORE | | 3,339,143 |
Spain - 3.1% |
Amadeus IT Holding SA Class A | 25,469 | | 945,778 |
Banco Bilbao Vizcaya Argentaria SA sponsored ADR | 258,286 | | 3,016,780 |
International Consolidated Airlines Group SA CDI (a) | 131,800 | | 735,211 |
Repsol YPF SA | 51,172 | | 1,374,290 |
TOTAL SPAIN | | 6,072,059 |
Sweden - 1.5% |
Svenska Cellulosa AB (SCA) (B Shares) | 36,665 | | 1,041,097 |
Svenska Handelsbanken AB (A Shares) | 40,733 | | 1,845,543 |
TOTAL SWEDEN | | 2,886,640 |
Common Stocks - continued |
| Shares | | Value |
Switzerland - 5.7% |
Novartis AG | 47,615 | | $ 3,695,999 |
Roche Holding AG (participation certificate) | 5,519 | | 1,527,936 |
Swiss Re Ltd. | 25,690 | | 2,256,564 |
Syngenta AG (Switzerland) | 3,374 | | 1,361,803 |
UBS AG (NY Shares) | 119,658 | | 2,316,579 |
TOTAL SWITZERLAND | | 11,158,881 |
United Kingdom - 24.7% |
Barclays PLC | 710,298 | | 2,988,555 |
BHP Billiton PLC | 103,607 | | 3,197,156 |
British American Tobacco PLC (United Kingdom) | 23,760 | | 1,310,893 |
BT Group PLC | 188,458 | | 1,140,290 |
Bunzl PLC | 57,725 | | 1,274,500 |
Compass Group PLC | 99,686 | | 1,433,734 |
GlaxoSmithKline PLC sponsored ADR | 18,675 | | 982,865 |
HSBC Holdings PLC sponsored ADR | 130,948 | | 7,207,381 |
Imperial Tobacco Group PLC | 54,799 | | 2,046,369 |
ITV PLC | 460,796 | | 1,410,446 |
Kingfisher PLC | 228,068 | | 1,380,458 |
Legal & General Group PLC | 607,012 | | 2,105,211 |
National Grid PLC | 188,558 | | 2,369,563 |
Next PLC | 11,900 | | 1,038,931 |
Prudential PLC | 89,236 | | 1,824,944 |
Reed Elsevier PLC | 111,611 | | 1,564,085 |
Rolls-Royce Group PLC | 42,200 | | 778,130 |
Royal Dutch Shell PLC Class A sponsored ADR | 77,296 | | 5,152,551 |
Taylor Wimpey PLC | 405,828 | | 717,076 |
Tesco PLC | 320,338 | | 1,870,640 |
Vodafone Group PLC sponsored ADR | 177,808 | | 6,546,891 |
TOTAL UNITED KINGDOM | | 48,340,669 |
United States of America - 0.8% |
AbbVie, Inc. | 23,011 | | 1,114,883 |
Cabot Corp. | 11,470 | | 534,617 |
TOTAL UNITED STATES OF AMERICA | | 1,649,500 |
TOTAL COMMON STOCKS (Cost $164,698,583) |
189,207,897
|
Nonconvertible Preferred Stocks - 1.5% |
| Shares | | Value |
Germany - 1.5% |
Volkswagen AG
(Cost $2,345,243) | 11,381 | | $ 2,892,718 |
Money Market Funds - 1.8% |
| | | |
Fidelity Cash Central Fund, 0.09% (b)
(Cost $3,487,195) | 3,487,195 | |
3,487,195
|
TOTAL INVESTMENT PORTFOLIO - 100.0% (Cost $170,531,021) | | 195,587,810 |
NET OTHER ASSETS (LIABILITIES) - 0.0% | | 77,461 |
NET ASSETS - 100% | $ 195,665,271 |
Legend |
(a) Non-income producing |
(b) Affiliated fund that is generally available only to investment companies and other accounts managed by Fidelity Investments. The rate quoted is the annualized seven-day yield of the fund at period end. A complete unaudited listing of the fund's holdings as of its most recent quarter end is available upon request. In addition, each Fidelity Central Fund's financial statements, which are not covered by the Fund's Report of Independent Registered Public Accounting Firm, are available on the SEC's website or upon request. |
Affiliated Central Funds |
Information regarding fiscal year to date income earned by the Fund from investments in Fidelity Central Funds is as follows: |
Fund | Income earned |
Fidelity Cash Central Fund | $ 2,240 |
Fidelity Securities Lending Cash Central Fund | 158,210 |
Total | $ 160,450 |
Other Information |
Categorizations in the Schedule of Investments are based on country or territory of incorporation. |
The following is a summary of the inputs used, as of October 31, 2013, involving the Fund's assets and liabilities carried at fair value. The inputs or methodology used for valuing securities may not be an indication of the risk associated with investing in those securities. For more information on valuation inputs, and their aggregation into the levels used in the tables below, please refer to the Investment Valuation section in the accompanying Notes to Financial Statements. |
Valuation Inputs at Reporting Date: |
Description | Total | Level 1 | Level 2 | Level 3 |
Investments in Securities: | | | | |
Equities: | | | | |
Consumer Discretionary | $ 20,046,655 | $ 14,736,478 | $ 5,310,177 | $ - |
Consumer Staples | 12,365,218 | 6,428,372 | 5,936,846 | - |
Energy | 13,553,475 | 6,526,841 | 7,026,634 | - |
Financials | 62,158,572 | 42,859,303 | 19,299,269 | - |
Health Care | 20,826,619 | 8,624,698 | 12,201,921 | - |
Industrials | 18,168,911 | 8,389,425 | 9,779,486 | - |
Information Technology | 6,329,846 | 3,351,672 | 2,978,174 | - |
Materials | 13,927,177 | 7,887,059 | 6,040,118 | - |
Telecommunication Services | 19,630,036 | 14,156,732 | 5,473,304 | - |
Utilities | 5,094,106 | 1,949,933 | 3,144,173 | - |
Money Market Funds | 3,487,195 | 3,487,195 | - | - |
Total Investments in Securities: | $ 195,587,810 | $ 118,397,708 | $ 77,190,102 | $ - |
The following is a summary of transfers between Level 1 and Level 2 for the period ended October 31, 2013. Transfers are assumed to have occurred at the beginning of the period, and are primarily attributable to the valuation techniques used for foreign equity securities, as discussed in the accompanying Notes to Financial Statements: |
Transfers | Total |
Level 1 to Level 2 | $ 11,626,467 |
Level 2 to Level 1 | $ 0 |
See accompanying notes which are an integral part of the financial statements.
Annual Report
Statement of Assets and Liabilities
| October 31, 2013 |
| | |
Assets | | |
Investment in securities, at value - See accompanying schedule: Unaffiliated issuers (cost $167,043,826) | $ 192,100,615 | |
Fidelity Central Funds (cost $3,487,195) | 3,487,195 | |
Total Investments (cost $170,531,021) | | $ 195,587,810 |
Receivable for investments sold | | 945,289 |
Receivable for fund shares sold | | 73,339 |
Dividends receivable | | 654,419 |
Distributions receivable from Fidelity Central Funds | | 351 |
Prepaid expenses | | 630 |
Other receivables | | 10,543 |
Total assets | | 197,272,381 |
| | |
Liabilities | | |
Payable for investments purchased | $ 1,230,443 | |
Payable for fund shares redeemed | 157,688 | |
Accrued management fee | 94,900 | |
Distribution and service plan fees payable | 6,010 | |
Other affiliated payables | 40,392 | |
Other payables and accrued expenses | 77,677 | |
Total liabilities | | 1,607,110 |
| | |
Net Assets | | $ 195,665,271 |
Net Assets consist of: | | |
Paid in capital | | $ 282,926,219 |
Undistributed net investment income | | 3,680,675 |
Accumulated undistributed net realized gain (loss) on investments and foreign currency transactions | | (116,002,753) |
Net unrealized appreciation (depreciation) on investments and assets and liabilities in foreign currencies | | 25,061,130 |
Net Assets | | $ 195,665,271 |
See accompanying notes which are an integral part of the financial statements.
Annual Report
Statement of Assets and Liabilities - continued
| October 31, 2013 |
| | |
Calculation of Maximum Offering Price Class A:
Net Asset Value and redemption price per share ($6,190,531 ÷ 690,803 shares) | | $ 8.96 |
| | |
Maximum offering price per share (100/94.25 of $8.96) | | $ 9.51 |
Class T:
Net Asset Value and redemption price per share ($3,757,790 ÷ 420,208 shares) | | $ 8.94 |
| | |
Maximum offering price per share (100/96.50 of $8.94) | | $ 9.26 |
Class B:
Net Asset Value and offering price per share ($678,055 ÷ 75,490 shares)A | | $ 8.98 |
| | |
Class C:
Net Asset Value and offering price per share ($3,231,305 ÷ 361,660 shares)A | | $ 8.93 |
| | |
International Value:
Net Asset Value, offering price and redemption price per share ($181,568,150 ÷ 20,236,094 shares) | | $ 8.97 |
| | |
Institutional Class:
Net Asset Value, offering price and redemption price per share ($239,440 ÷ 26,656 shares) | | $ 8.98 |
A Redemption price per share is equal to net asset value less any applicable contingent deferred sales charge.
See accompanying notes which are an integral part of the financial statements.
Annual Report
Financial Statements - continued
Statement of Operations
| Year ended October 31, 2013 |
| | |
Investment Income | | |
Dividends | | $ 5,981,397 |
Income from Fidelity Central Funds | | 160,450 |
Income before foreign taxes withheld | | 6,141,847 |
Less foreign taxes withheld | | (388,783) |
Total income | | 5,753,064 |
| | |
Expenses | | |
Management fee
Basic fee | $ 1,176,503 | |
Performance adjustment | (93,277) | |
Transfer agent fees | 370,369 | |
Distribution and service plan fees | 62,780 | |
Accounting and security lending fees | 87,132 | |
Custodian fees and expenses | 93,872 | |
Independent trustees' compensation | 929 | |
Registration fees | 74,322 | |
Audit | 62,420 | |
Legal | 395 | |
Miscellaneous | 1,091 | |
Total expenses before reductions | 1,836,536 | |
Expense reductions | (47,772) | 1,788,764 |
Net investment income (loss) | | 3,964,300 |
Realized and Unrealized Gain (Loss) Net realized gain (loss) on: | | |
Investment securities: | | |
Unaffiliated issuers | 9,459,633 | |
Foreign currency transactions | (62,042) | |
Total net realized gain (loss) | | 9,397,591 |
Change in net unrealized appreciation (depreciation) on: Investment securities | 23,778,218 | |
Assets and liabilities in foreign currencies | 13,304 | |
Total change in net unrealized appreciation (depreciation) | | 23,791,522 |
Net gain (loss) | | 33,189,113 |
Net increase (decrease) in net assets resulting from operations | | $ 37,153,413 |
See accompanying notes which are an integral part of the financial statements.
Annual Report
Statement of Changes in Net Assets
| Year ended
October 31,
2013 | Year ended
October 31,
2012 |
Increase (Decrease) in Net Assets | | |
Operations | | |
Net investment income (loss) | $ 3,964,300 | $ 4,504,170 |
Net realized gain (loss) | 9,397,591 | (6,022,570) |
Change in net unrealized appreciation (depreciation) | 23,791,522 | 12,827,702 |
Net increase (decrease) in net assets resulting
from operations | 37,153,413 | 11,309,302 |
Distributions to shareholders from net investment income | (4,120,600) | (5,463,877) |
Distributions to shareholders from net realized gain | (786,952) | - |
Total distributions | (4,907,552) | (5,463,877) |
Share transactions - net increase (decrease) | 23,938,130 | (27,953,937) |
Redemption fees | 3,144 | 2,109 |
Total increase (decrease) in net assets | 56,187,135 | (22,106,403) |
| | |
Net Assets | | |
Beginning of period | 139,478,136 | 161,584,539 |
End of period (including undistributed net investment income of $3,680,675 and undistributed net investment income of $3,836,975, respectively) | $ 195,665,271 | $ 139,478,136 |
See accompanying notes which are an integral part of the financial statements.
Annual Report
Financial Highlights - Class A
Years ended October 31, | 2013 | 2012 | 2011 | 2010 | 2009 |
Selected Per-Share Data | | | | | |
Net asset value, beginning of period | $ 7.39 | $ 7.02 | $ 8.22 | $ 7.75 | $ 5.93 |
Income from Investment Operations | | | | | |
Net investment income (loss) C | .17 | .20 | .22 | .15 | .12 |
Net realized and unrealized gain (loss) | 1.64 | .39 | (1.19) | .44 | 1.78 |
Total from investment operations | 1.81 | .59 | (.97) | .59 | 1.90 |
Distributions from net investment income | (.20) | (.22) | (.19) | (.11) | (.08) |
Distributions from net realized gain | (.04) | - | (.03) | (.01) | - |
Total distributions | (.24) | (.22) | (.23) H | (.12) | (.08) |
Redemption fees added to paid in capital C, G | - | - | - | - | - |
Net asset value, end of period | $ 8.96 | $ 7.39 | $ 7.02 | $ 8.22 | $ 7.75 |
Total Return A, B | 25.24% | 8.82% | (12.19)% | 7.60% | 32.71% |
Ratios to Average Net Assets D, F | | | | | |
Expenses before reductions | 1.39% | 1.44% | 1.36% | 1.40% | 1.34% |
Expenses net of fee waivers, if any | 1.39% | 1.44% | 1.36% | 1.40% | 1.34% |
Expenses net of all reductions | 1.36% | 1.41% | 1.34% | 1.38% | 1.32% |
Net investment income (loss) | 2.08% | 2.85% | 2.79% | 1.93% | 1.86% |
Supplemental Data | | | | | |
Net assets, end of period (000 omitted) | $ 6,191 | $ 4,491 | $ 4,668 | $ 4,699 | $ 4,456 |
Portfolio turnover rate E | 79% | 74% | 83% | 43% | 46% |
A Total returns would have been lower if certain expenses had not been reduced during the applicable periods shown.
B Total returns do not include the effect of the sales charges.
C Calculated based on average shares outstanding during the period.
D Fees and expenses of any underlying Fidelity Central Funds are not included in the Fund's expense ratio. The Fund indirectly bears its proportionate share of the expenses of any underlying Fidelity Central Funds.
E Amount does not include the portfolio activity of any underlying Fidelity Central Funds.
F Expense ratios reflect operating expenses of the class. Expenses before reductions do not reflect amounts reimbursed by the investment adviser or reductions from brokerage service arrangements or reductions from other expense offset arrangements and do not represent the amount paid by the class during periods when reimbursements or reductions occur. Expenses net of fee waivers reflect expenses after reimbursement by the investment adviser but prior to reductions from brokerage service arrangements or other expense offset arrangements. Expenses net of all reductions represent the net expenses paid by the class.
G Amount represents less than $.01 per share.
H Total distributions of $.23 per share is comprised of distributions from net investment income of $.191 and distributions from net realized gain of $.034 per share.
See accompanying notes which are an integral part of the financial statements.
Annual Report
Financial Highlights - Class T
Years ended October 31, | 2013 | 2012 | 2011 | 2010 | 2009 |
Selected Per-Share Data | | | | | |
Net asset value, beginning of period | $ 7.38 | $ 7.00 | $ 8.20 | $ 7.73 | $ 5.91 |
Income from Investment Operations | | | | | |
Net investment income (loss) C | .15 | .18 | .20 | .13 | .10 |
Net realized and unrealized gain (loss) | 1.64 | .40 | (1.19) | .44 | 1.77 |
Total from investment operations | 1.79 | .58 | (.99) | .57 | 1.87 |
Distributions from net investment income | (.19) | (.20) | (.17) | (.09) | (.05) |
Distributions from net realized gain | (.04) | - | (.03) | (.01) | - |
Total distributions | (.23) | (.20) | (.21) H | (.10) | (.05) |
Redemption fees added to paid in capital C, G | - | - | - | - | - |
Net asset value, end of period | $ 8.94 | $ 7.38 | $ 7.00 | $ 8.20 | $ 7.73 |
Total Return A, B | 24.86% | 8.60% | (12.42)% | 7.32% | 32.14% |
Ratios to Average Net Assets D, F | | | | | |
Expenses before reductions | 1.66% | 1.71% | 1.63% | 1.67% | 1.60% |
Expenses net of fee waivers, if any | 1.65% | 1.70% | 1.62% | 1.67% | 1.60% |
Expenses net of all reductions | 1.63% | 1.67% | 1.60% | 1.65% | 1.59% |
Net investment income (loss) | 1.81% | 2.58% | 2.52% | 1.65% | 1.59% |
Supplemental Data | | | | | |
Net assets, end of period (000 omitted) | $ 3,758 | $ 2,693 | $ 2,468 | $ 2,276 | $ 2,395 |
Portfolio turnover rate E | 79% | 74% | 83% | 43% | 46% |
A Total returns would have been lower if certain expenses had not been reduced during the applicable periods shown.
B Total returns do not include the effect of the sales charges.
C Calculated based on average shares outstanding during the period.
D Fees and expenses of any underlying Fidelity Central Funds are not included in the Fund's expense ratio. The Fund indirectly bears its proportionate share of the expenses of any underlying Fidelity Central Funds.
E Amount does not include the portfolio activity of any underlying Fidelity Central Funds.
F Expense ratios reflect operating expenses of the class. Expenses before reductions do not reflect amounts reimbursed by the investment adviser or reductions from brokerage service arrangements or reductions from other expense offset arrangements and do not represent the amount paid by the class during periods when reimbursements or reductions occur. Expenses net of fee waivers reflect expenses after reimbursement by the investment adviser but prior to reductions from brokerage service arrangements or other expense offset arrangements. Expenses net of all reductions represent the net expenses paid by the class.
G Amount represents less than $.01 per share.
H Total distributions of $.21 per share is comprised of distributions from net investment income of $.173 and distributions from net realized gain of $.034 per share.
See accompanying notes which are an integral part of the financial statements.
Annual Report
Financial Highlights - Class B
Years ended October 31, | 2013 | 2012 | 2011 | 2010 | 2009 |
Selected Per-Share Data | | | | | |
Net asset value, beginning of period | $ 7.39 | $ 7.00 | $ 8.20 | $ 7.74 | $ 5.88 |
Income from Investment Operations | | | | | |
Net investment income (loss) C | .11 | .14 | .17 | .09 | .07 |
Net realized and unrealized gain (loss) | 1.65 | .41 | (1.20) | .44 | 1.79 |
Total from investment operations | 1.76 | .55 | (1.03) | .53 | 1.86 |
Distributions from net investment income | (.13) | (.16) | (.13) | (.06) | - |
Distributions from net realized gain | (.04) | - | (.03) | (.01) | - |
Total distributions | (.17) | (.16) | (.17) H | (.07) | - |
Redemption fees added to paid in capital C, G | - | - | - | - | - |
Net asset value, end of period | $ 8.98 | $ 7.39 | $ 7.00 | $ 8.20 | $ 7.74 |
Total Return A, B | 24.30% | 8.07% | (12.88)% | 6.82% | 31.63% |
Ratios to Average Net Assets D, F | | | | | |
Expenses before reductions | 2.14% | 2.19% | 2.11% | 2.15% | 2.08% |
Expenses net of fee waivers, if any | 2.14% | 2.19% | 2.11% | 2.15% | 2.08% |
Expenses net of all reductions | 2.11% | 2.16% | 2.09% | 2.13% | 2.07% |
Net investment income (loss) | 1.32% | 2.09% | 2.04% | 1.18% | 1.11% |
Supplemental Data | | | | | |
Net assets, end of period (000 omitted) | $ 678 | $ 691 | $ 901 | $ 1,216 | $ 1,076 |
Portfolio turnover rate E | 79% | 74% | 83% | 43% | 46% |
A Total returns would have been lower if certain expenses had not been reduced during the applicable periods shown.
B Total returns do not include the effect of the contingent deferred sales charge.
C Calculated based on average shares outstanding during the period.
D Fees and expenses of any underlying Fidelity Central Funds are not included in the Fund's expense ratio. The Fund indirectly bears its proportionate share of the expenses of any underlying Fidelity Central Funds.
E Amount does not include the portfolio activity of any underlying Fidelity Central Funds.
F Expense ratios reflect operating expenses of the class. Expenses before reductions do not reflect amounts reimbursed by the investment adviser or reductions from brokerage service arrangements or reductions from other expense offset arrangements and do not represent the amount paid by the class during periods when reimbursements or reductions occur. Expenses net of fee waivers reflect expenses after reimbursement by the investment adviser but prior to reductions from brokerage service arrangements or other expense offset arrangements. Expenses net of all reductions represent the net expenses paid by the class.
G Amount represents less than $.01 per share.
H Total distributions of $.17 per share is comprised of distributions from net investment income of $.131 and distributions from net realized gain of $.034 per share.
See accompanying notes which are an integral part of the financial statements.
Annual Report
Financial Highlights - Class C
Years ended October 31, | 2013 | 2012 | 2011 | 2010 | 2009 |
Selected Per-Share Data | | | | | |
Net asset value, beginning of period | $ 7.38 | $ 7.00 | $ 8.20 | $ 7.73 | $ 5.88 |
Income from Investment Operations | | | | | |
Net investment income (loss) C | .11 | .14 | .16 | .09 | .07 |
Net realized and unrealized gain (loss) | 1.63 | .41 | (1.19) | .44 | 1.78 |
Total from investment operations | 1.74 | .55 | (1.03) | .53 | 1.85 |
Distributions from net investment income | (.15) | (.17) | (.14) | (.05) | - |
Distributions from net realized gain | (.04) | - | (.03) | (.01) | - |
Total distributions | (.19) | (.17) | (.17) | (.06) | - |
Redemption fees added to paid in capital C, G | - | - | - | - | - |
Net asset value, end of period | $ 8.93 | $ 7.38 | $ 7.00 | $ 8.20 | $ 7.73 |
Total Return A, B | 24.17% | 8.12% | (12.84)% | 6.84% | 31.46% |
Ratios to Average Net Assets D, F | | | | | |
Expenses before reductions | 2.14% | 2.19% | 2.12% | 2.15% | 2.08% |
Expenses net of fee waivers, if any | 2.14% | 2.19% | 2.11% | 2.15% | 2.08% |
Expenses net of all reductions | 2.11% | 2.16% | 2.09% | 2.13% | 2.06% |
Net investment income (loss) | 1.33% | 2.09% | 2.04% | 1.18% | 1.12% |
Supplemental Data | | | | | |
Net assets, end of period (000 omitted) | $ 3,231 | $ 2,249 | $ 2,108 | $ 2,123 | $ 2,108 |
Portfolio turnover rate E | 79% | 74% | 83% | 43% | 46% |
A Total returns would have been lower if certain expenses had not been reduced during the applicable periods shown.
B Total returns do not include the effect of the contingent deferred sales charge.
C Calculated based on average shares outstanding during the period.
D Fees and expenses of any underlying Fidelity Central Funds are not included in the Fund's expense ratio. The Fund indirectly bears its proportionate share of the expenses of any underlying Fidelity Central Funds.
E Amount does not include the portfolio activity of any underlying Fidelity Central Funds.
F Expense ratios reflect operating expenses of the class. Expenses before reductions do not reflect amounts reimbursed by the investment adviser or reductions from brokerage service arrangements or reductions from other expense offset arrangements and do not represent the amount paid by the class during periods when reimbursements or reductions occur. Expenses net of fee waivers reflect expenses after reimbursement by the investment adviser but prior to reductions from brokerage service arrangements or other expense offset arrangements. Expenses net of all reductions represent the net expenses paid by the class.
G Amount represents less than $.01 per share.
See accompanying notes which are an integral part of the financial statements.
Annual Report
Financial Highlights - International Value
Years ended October 31, | 2013 | 2012 | 2011 | 2010 | 2009 |
Selected Per-Share Data | | | | | |
Net asset value, beginning of period | $ 7.40 | $ 7.03 | $ 8.23 | $ 7.75 | $ 5.95 |
Income from Investment Operations | | | | | |
Net investment income (loss) B | .19 | .22 | .25 | .17 | .13 |
Net realized and unrealized gain (loss) | 1.65 | .40 | (1.20) | .44 | 1.78 |
Total from investment operations | 1.84 | .62 | (.95) | .61 | 1.91 |
Distributions from net investment income | (.22) | (.25) | (.22) | (.13) | (.11) |
Distributions from net realized gain | (.04) | - | (.03) | (.01) | - |
Total distributions | (.27) H | (.25) | (.25) | (.13) G | (.11) |
Redemption fees added to paid in capital B, F | - | - | - | - | - |
Net asset value, end of period | $ 8.97 | $ 7.40 | $ 7.03 | $ 8.23 | $ 7.75 |
Total Return A | 25.57% | 9.19% | (11.91)% | 7.95% | 33.09% |
Ratios to Average Net Assets C, E | | | | | |
Expenses before reductions | 1.05% | 1.13% | 1.04% | 1.09% | 1.07% |
Expenses net of fee waivers, if any | 1.05% | 1.13% | 1.03% | 1.09% | 1.07% |
Expenses net of all reductions | 1.02% | 1.10% | 1.01% | 1.08% | 1.06% |
Net investment income (loss) | 2.41% | 3.16% | 3.11% | 2.23% | 2.12% |
Supplemental Data | | | | | |
Net assets, end of period (000 omitted) | $ 181,568 | $ 128,983 | $ 150,967 | $ 163,090 | $ 180,447 |
Portfolio turnover rate D | 79% | 74% | 83% | 43% | 46% |
A Total returns would have been lower if certain expenses had not been reduced during the applicable periods shown.
B Calculated based on average shares outstanding during the period.
C Fees and expenses of any underlying Fidelity Central Funds are not included in the Fund's expense ratio. The Fund indirectly bears its proportionate share of the expenses of any underlying Fidelity Central Funds.
D Amount does not include the portfolio activity of any underlying Fidelity Central Funds.
E Expense ratios reflect operating expenses of the class. Expenses before reductions do not reflect amounts reimbursed by the investment adviser or reductions from brokerage service arrangements or reductions from other expense offset arrangements and do not represent the amount paid by the class during periods when reimbursements or reductions occur. Expenses net of fee waivers reflect expenses after reimbursement by the investment adviser but prior to reductions from brokerage service arrangements or other expense offset arrangements. Expenses net of all reductions represent the net expenses paid by the class.
F Amount represents less than $.01 per share.
G Total distributions of $.13 per share is comprised of distributions from net investment income of $.129 and distributions from net realized gain of $.005 per share.
H Total distributions of $.27 per share is comprised of distributions from net investment income of $.223 and distributions from net realized gain of $.042 per share.
See accompanying notes which are an integral part of the financial statements.
Annual Report
Financial Highlights - Institutional Class
Years ended October 31, | 2013 | 2012 | 2011 | 2010 | 2009 |
Selected Per-Share Data | | | | | |
Net asset value, beginning of period | $ 7.41 | $ 7.04 | $ 8.24 | $ 7.76 | $ 5.96 |
Income from Investment Operations | | | | | |
Net investment income (loss) B | .19 | .22 | .25 | .18 | .14 |
Net realized and unrealized gain (loss) | 1.65 | .40 | (1.19) | .44 | 1.78 |
Total from investment operations | 1.84 | .62 | (.94) | .62 | 1.92 |
Distributions from net investment income | (.23) | (.25) | (.22) | (.14) | (.12) |
Distributions from net realized gain | (.04) | - | (.03) | (.01) | - |
Total distributions | (.27) | (.25) | (.26) H | (.14) G | (.12) |
Redemption fees added to paid in capital B, F | - | - | - | - | - |
Net asset value, end of period | $ 8.98 | $ 7.41 | $ 7.04 | $ 8.24 | $ 7.76 |
Total Return A | 25.64% | 9.22% | (11.83)% | 8.05% | 33.06% |
Ratios to Average Net Assets C, E | | | | | |
Expenses before reductions | 1.07% | 1.10% | .98% | .98% | .93% |
Expenses net of fee waivers, if any | 1.07% | 1.10% | .98% | .98% | .93% |
Expenses net of all reductions | 1.04% | 1.07% | .96% | .97% | .92% |
Net investment income (loss) | 2.39% | 3.18% | 3.17% | 2.34% | 2.26% |
Supplemental Data | | | | | |
Net assets, end of period (000 omitted) | $ 239 | $ 372 | $ 473 | $ 519 | $ 814 |
Portfolio turnover rate D | 79% | 74% | 83% | 43% | 46% |
A Total returns would have been lower if certain expenses had not been reduced during the applicable periods shown.
B Calculated based on average shares outstanding during the period.
C Fees and expenses of any underlying Fidelity Central Funds are not included in the Fund's expense ratio. The Fund indirectly bears its proportionate share of the expenses of any underlying Fidelity Central Funds.
D Amount does not include the portfolio activity of any underlying Fidelity Central Funds.
E Expense ratios reflect operating expenses of the class. Expenses before reductions do not reflect amounts reimbursed by the investment adviser or reductions from brokerage service arrangements or reductions from other expense offset arrangements and do not represent the amount paid by the class during periods when reimbursements or reductions occur. Expenses net of fee waivers reflect expenses after reimbursement by the investment adviser but prior to reductions from brokerage service arrangements or other expense offset arrangements. Expenses net of all reductions represent the net expenses paid by the class.
F Amount represents less than $.01 per share.
G Total distributions of $.14 per share is comprised of distributions from net investment income of $.137 and distributions from net realized gain of $.005 per share.
H Total distributions of $.26 per share is comprised of distributions from net investment income of $.221 and distributions from net realized gain of $.034 per share.
See accompanying notes which are an integral part of the financial statements.
Annual Report
Notes to Financial Statements
For the period ended October 31, 2013
1. Organization.
Fidelity International Value Fund (the Fund) is a fund of Fidelity Investment Trust (the Trust) and is authorized to issue an unlimited number of shares. The Trust is registered under the Investment Company Act of 1940, as amended (the 1940 Act), as an open-end management investment company organized as a Massachusetts business trust. The Fund offers Class A, Class T, Class C, International Value and Institutional Class shares, each of which, along with Class B shares, has equal rights as to assets and voting privileges. Class B shares are closed to new accounts and additional purchases, except for exchanges and reinvestments. Each class has exclusive voting rights with respect to matters that affect that class. Class B shares will automatically convert to Class A shares after a holding period of seven years from the initial date of purchase.
2. Investments in Fidelity Central Funds.
The Fund invests in Fidelity Central Funds, which are open-end investment companies generally available only to other investment companies and accounts managed by Fidelity Management & Research Company (FMR) and its affiliates. The Fund's Schedule of Investments lists each of the Fidelity Central Funds held as of period end, if any, as an investment of the Fund, but does not include the underlying holdings of each Fidelity Central Fund. As an Investing Fund, the Fund indirectly bears its proportionate share of the expenses of the underlying Fidelity Central Funds.
The Money Market Central Funds seek preservation of capital and current income and are managed by Fidelity Investments Money Management, Inc. (FIMM), an affiliate of FMR.
A complete unaudited list of holdings for each Fidelity Central Fund is available upon request or at the Securities and Exchange Commission (the SEC) website at www.sec.gov. In addition, the financial statements of the Fidelity Central Funds, which are not covered by the Fund's Report of Independent Registered Public Accounting Firm, are available on the SEC website or upon request.
3. Significant Accounting Policies.
The financial statements have been prepared in conformity with accounting principles generally accepted in the United States of America (GAAP), which require management to make certain estimates and assumptions at the date of the financial statements. Actual results could differ from those estimates. Subsequent events, if any, through the date that the financial statements were issued have been evaluated in the preparation of
Annual Report
3. Significant Accounting Policies - continued
the financial statements. The following summarizes the significant accounting policies of the Fund:
Investment Valuation. Investments are valued as of 4:00 p.m. Eastern time on the last calendar day of the period. In accordance with valuation policies and procedures approved by the Board of Trustees (the Board), the Fund attempts to obtain prices from one or more third party pricing vendors or brokers to value its investments. When current market prices, quotations or currency exchange rates are not readily available or reliable, investments will be fair valued in good faith by the FMR Fair Value Committee (the Committee), in accordance with procedures adopted by the Board. Factors used in determining fair value vary by investment type and may include market or investment specific events. The frequency with which these procedures are used cannot be predicted and they may be utilized to a significant extent. The Committee oversees the Fund's valuation policies and procedures and is responsible for approving and reporting to the Board all fair value determinations.
The Fund categorizes the inputs to valuation techniques used to value its investments into a disclosure hierarchy consisting of three levels as shown below:
Level 1 - quoted prices in active markets for identical investments
Level 2 - other significant observable inputs (including quoted prices for similar investments, interest rates, prepayment speeds, etc.)
Level 3 - unobservable inputs (including the Fund's own assumptions based on the best information available)
Valuation techniques used to value the Fund's investments by major category are as follows:
Equity securities, including restricted securities, for which market quotations are readily available, are valued at the last reported sale price or official closing price as reported by a third party pricing vendor on the primary market or exchange on which they are traded and are categorized as Level 1 in the hierarchy. In the event there were no sales during the day or closing prices are not available, securities are valued at the last quoted bid price or may be valued using the last available price and are generally categorized as Level 2 in the hierarchy. For foreign equity securities, when market or security specific events arise, comparisons to the valuation of American Depositary Receipts (ADRs), futures contracts, Exchange-Traded Funds (ETFs) and certain indexes as well as quoted prices for similar securities may be used and would be categorized as Level 2 in the hierarchy. Utilizing these techniques may result in transfers between Level 1 and Level 2. For equity securities, including restricted securities, where observable inputs are
Annual Report
Notes to Financial Statements - continued
3. Significant Accounting Policies - continued
Investment Valuation - continued
limited, assumptions about market activity and risk are used and these securities may be categorized as Level 3 in the hierarchy.
Investments in open-end mutual funds, including the Fidelity Central Funds, are valued at their closing net asset value (NAV) each business day and are categorized as Level 1 in the hierarchy.
Changes in valuation techniques may result in transfers in or out of an assigned level within the disclosure hierarchy. The aggregate value of investments by input level, as of October 31, 2013, including information on transfers between Levels 1 and 2, is included at the end of the Fund's Schedule of Investments.
Foreign Currency. The Fund may use foreign currency contracts to facilitate transactions in foreign-denominated securities. Gains and losses from these transactions may arise from changes in the value of the foreign currency or if the counterparties do not perform under the contracts' terms.
Foreign-denominated assets, including investment securities, and liabilities are translated into U.S. dollars at the exchange rates at period end. Purchases and sales of investment securities, income and dividends received and expenses denominated in foreign currencies are translated into U.S. dollars at the exchange rate in effect on the transaction date.
The effects of exchange rate fluctuations on investments are included with the net realized and unrealized gain (loss) on investment securities. Other foreign currency transactions resulting in realized and unrealized gain (loss) are disclosed separately.
Investment Transactions and Income. For financial reporting purposes, the Fund's investment holdings and NAV include trades executed through the end of the last business day of the period. The NAV per share for processing shareholder transactions is calculated as of the close of business of the New York Stock Exchange (NYSE), normally 4:00 p.m. Eastern time and includes trades executed through the end of the prior business day. Gains and losses on securities sold are determined on the basis of identified cost and may include proceeds received from litigation. Dividend income is recorded on the ex-dividend date, except for certain dividends from foreign securities where the ex-dividend date may have passed, which are recorded as soon as the Fund is informed of the ex-dividend date. Non-cash dividends included in dividend income, if any, are recorded at the fair market value of the securities received. Interest income and distributions from the Fidelity Central Funds are accrued as earned. Investment income is recorded net of foreign taxes withheld where recovery of such taxes is uncertain.
Annual Report
3. Significant Accounting Policies - continued
Class Allocations and Expenses. Investment income, realized and unrealized capital gains and losses, common expenses of the Fund, and certain fund-level expense reductions, if any, are allocated daily on a pro-rata basis to each class based on the relative net assets of each class to the total net assets of the Fund. Each class differs with respect to transfer agent and distribution and service plan fees incurred. Certain expense reductions may also differ by class. For the reporting period, the allocated portion of income and expenses to each class as a percent of its average net assets may vary due to the timing of recording these transactions in relation to fluctuating net assets of the classes. Expenses directly attributable to a fund are charged to that fund. Expenses attributable to more than one fund are allocated among the respective funds on the basis of relative net assets or other appropriate methods. Expense estimates are accrued in the period to which they relate and adjustments are made when actual amounts are known.
Income Tax Information and Distributions to Shareholders. Each year, the Fund intends to qualify as a regulated investment company under Subchapter M of the Internal Revenue Code, including distributing substantially all of its taxable income and realized gains. As a result, no provision for U.S. Federal income taxes is required. As of October 31, 2013, the Fund did not have any unrecognized tax benefits in the financial statements; nor is the Fund aware of any tax positions for which it is reasonably possible that the total amounts of unrecognized tax benefits will significantly change in the next twelve months. The Fund files a U.S. federal tax return, in addition to state and local tax returns as required. The Fund's federal income tax returns are subject to examination by the Internal Revenue Service (IRS) for a period of three fiscal years after they are filed. State and local tax returns may be subject to examination for an additional fiscal year depending on the jurisdiction. Foreign taxes are provided for based on the Fund's understanding of the tax rules and rates that exist in the foreign markets in which it invests.
Distributions are declared and recorded on the ex-dividend date. Income dividends and capital gain distributions are declared separately for each class. Income and capital gain distributions are determined in accordance with income tax regulations, which may differ from GAAP.
Capital accounts within the financial statements are adjusted for permanent book-tax differences. These adjustments have no impact on net assets or the results of operations. Temporary book-tax differences will reverse in a subsequent period.
Book-tax differences are primarily due to foreign currency transactions, passive foreign investment companies (PFIC), capital loss carryforwards and losses deferred due to wash sales.
Annual Report
Notes to Financial Statements - continued
3. Significant Accounting Policies - continued
Income Tax Information and Distributions to Shareholders - continued
The federal tax cost of investment securities and unrealized appreciation (depreciation) as of period end were as follows:
Gross unrealized appreciation | $ 28,874,674 |
Gross unrealized depreciation | (4,985,981) |
Net unrealized appreciation (depreciation) on securities and other investments | $ 23,888,693 |
| |
Tax Cost | $ 171,699,117 |
The tax-based components of distributable earnings as of period end were as follows:
Undistributed ordinary income | $ 3,934,281 |
Capital loss carryforward | $ (115,088,265) |
Net unrealized appreciation (depreciation) | $ 23,893,034 |
Capital loss carryforwards are only available to offset future capital gains of the Fund to the extent provided by regulations and may be limited. Under the Regulated Investment Company Modernization Act of 2010 (the Act), the Fund is permitted to carry forward capital losses incurred in taxable years beginning after December 22, 2010 for an unlimited period and such capital losses are required to be used prior to any losses that expire. The capital loss carryforward information presented below, including any applicable limitation, is estimated as of fiscal period end and is subject to adjustment.
Fiscal year of expiration | |
2016 | $ (14,771,177) |
2017 | (65,376,972) |
2018 | (3,571,319) |
2019 | (31,368,797) |
Total with expiration | $ (115,088,265) |
The tax character of distributions paid was as follows:
| October 31, 2013 | October 31, 2012 |
Ordinary Income | $ 4,907,552 | $ 5,463,877 |
Short-Term Trading (Redemption) Fees. Shares held by investors in the Fund less than 30 days may have been subject to a redemption fee equal to 1.00% of the net asset value of shares redeemed. All redemption fees, which reduce the proceeds of the shareholder redemption, are retained by the Fund and accounted for as an addition to paid in capital.
Annual Report
4. Purchases and Sales of Investments.
Purchases and sales of securities, other than short-term securities, aggregated $150,085,429 and $129,207,208, respectively.
5. Fees and Other Transactions with Affiliates.
Management Fee. FMR and its affiliates provide the Fund with investment management related services for which the Fund pays a monthly management fee. The management fee is the sum of an individual fund fee rate that is based on an annual rate of .45% of the Fund's average net assets and an annualized group fee rate that averaged .25% during the period. The group fee rate is based upon the average net assets of all the mutual funds advised by FMR, including any mutual funds previously advised by FMR that are currently advised by Fidelity SelectCo, LLC, an affiliate of FMR. The group fee rate decreases as assets under management increase and increases as assets under management decrease. In addition, the management fee is subject to a performance adjustment (up to a maximum of ± .20% of the Fund's average net assets over a 36 month performance period). The upward or downward adjustment to the management fee is based on the relative investment performance of International Value as compared to an appropriate benchmark index over the same 36 month performance period. For the reporting period, the total annual management fee rate, including the performance adjustment, was .65% of the Fund's average net assets. The performance adjustment included in the management fee rate may be higher or lower than the maximum performance adjustment rate due to the difference between the average net assets for the reporting and performance periods.
Distribution and Service Plan Fees. In accordance with Rule 12b-1 of the 1940 Act, the Fund has adopted separate Distribution and Service Plans for each class of shares. Certain classes pay Fidelity Distributors Corporation (FDC), an affiliate of FMR, separate Distribution and Service Fees, each of which is based on an annual percentage of each class' average net assets. In addition, FDC may pay financial intermediaries for selling shares of the Fund and providing shareholder support services. For the period, the Distribution and Service Fee rates, total fees and amounts retained by FDC were as follows:
| Distribution
Fee | Service
Fee | Total Fees | Retained
by FDC |
Class A | -% | .25% | $ 13,148 | $ 2,395 |
Class T | .25% | .25% | 15,589 | 2,306 |
Class B | .75% | .25% | 6,888 | 5,482 |
Class C | .75% | .25% | 27,155 | 8,369 |
| | | $ 62,780 | $ 18,552 |
Annual Report
Notes to Financial Statements - continued
5. Fees and Other Transactions with Affiliates - continued
Sales Load. FDC may receive a front-end sales charge of up to 5.75% for selling Class A shares and 3.50% for selling Class T shares, some of which is paid to financial intermediaries for selling shares of the Fund. Depending on the holding period, FDC may receive contingent deferred sales charges levied on Class A, Class T, Class B, and Class C redemptions. The deferred sales charges range from 5.00% to 1.00% for Class B shares, 1.00% for Class C shares, 1.00% for certain purchases of Class A shares and .25% for certain purchases of Class T shares.
For the period, sales charge amounts retained by FDC were as follows:
| Retained
by FDC |
Class A | $ 3,932 |
Class T | 1,030 |
Class B* | 1,552 |
Class C* | 514 |
| $ 7,028 |
* When Class B and Class C shares are initially sold, FDC pays commissions from its own resources to financial intermediaries through which the sales
are made.
Transfer Agent Fees. Fidelity Investments Institutional Operations Company, Inc., (FIIOC), an affiliate of FMR, is the transfer, dividend disbursing and shareholder servicing agent for each class of the Fund. FIIOC receives account fees and asset-based fees that vary according to the account size and type of account of the shareholders of the respective classes of the Fund. FIIOC pays for typesetting, printing and mailing of shareholder reports, except proxy statements.
For the period, transfer agent fees for each class were as follows:
| Amount | % of
Average
Net Assets |
Class A | $ 15,780 | .30 |
Class T | 9,962 | .32 |
Class B | 2,081 | .30 |
Class C | 8,174 | .30 |
International Value | 333,690 | .21 |
Institutional Class | 682 | .23 |
| $ 370,369 | |
Accounting and Security Lending Fees. Fidelity Service Company, Inc. (FSC), an affiliate of FMR, maintains the Fund's accounting records. The accounting fee is based on the level of average net assets for each month. Under a separate contract, FSC
Annual Report
5. Fees and Other Transactions with Affiliates - continued
Accounting and Security Lending Fees - continued
administers the security lending program. The security lending fee is based on the number and duration of lending transactions.
Brokerage Commissions. The Fund placed a portion of its portfolio transactions with brokerage firms which are affiliates of the investment adviser. Brokerage commissions are included in net realized gain (loss) and change in net unrealized appreciation (depreciation) in the Statement of Operations. The commissions paid to these affiliated firms were $199 for the period.
6. Committed Line of Credit.
The Fund participates with other funds managed by FMR or an affiliate in a $4.25 billion credit facility (the "line of credit") to be utilized for temporary or emergency purposes to fund shareholder redemptions or for other short-term liquidity purposes. The Fund has agreed to pay commitment fees on its pro-rata portion of the line of credit, which amounted to $349 and is reflected in Miscellaneous expenses on the Statement of Operations. During the period, there were no borrowings on this line of credit.
7. Security Lending.
The Fund lends portfolio securities through a lending agent from time to time in order to earn additional income. For equity securities, a lending agent is used and may loan securities to certain qualified borrowers, including Fidelity Capital Markets (FCM), a broker-dealer affiliated with the Fund. On the settlement date of the loan, the Fund receives collateral (in the form of U.S. Treasury obligations, letters of credit and/or cash) against the loaned securities and maintains collateral in an amount not less than 100% of the market value of the loaned securities during the period of the loan. The market value of the loaned securities is determined at the close of business of the Fund and any additional required collateral is delivered to the Fund on the next business day. If the borrower defaults on its obligation to return the securities loaned because of insolvency or other reasons, the Fund may apply collateral received from the borrower against the obligation. The Fund may experience delays and costs in recovering the securities loaned. Any cash collateral received is invested in the Fidelity Securities Lending Cash Central Fund. At period end, there were no security loans outstanding. Security lending income represents the income earned on investing cash collateral, less rebates paid to borrowers and any lending agent fees associated with the loan, plus any premium payments received for lending certain types of securities. Security lending income is presented in the Statement of Operations as a component of income from Fidelity Central Funds. Total security lending income during the period amounted to $158,210. During the period, there were no securities loaned to FCM.
Annual Report
Notes to Financial Statements - continued
8. Expense Reductions.
Commissions paid to certain brokers with whom FMR, or its affiliates, places trades on behalf of the Fund include an amount in addition to trade execution, which may be rebated back to the Fund to offset certain expenses. This amount totaled $47,222 for the period.
In addition, FMR reimbursed a portion of the Fund's operating expenses during the period in the amount of $550.
9. Distributions to Shareholders.
Distributions to shareholders of each class were as follows:
Years ended October 31, | 2013 | 2012 |
From net investment income | | |
Class A | $ 121,166 | $ 143,989 |
Class T | 67,016 | 67,838 |
Class B | 11,860 | 19,758 |
Class C | 47,865 | 50,970 |
International Value | 3,862,005 | 5,163,324 |
Institutional Class | 10,688 | 17,998 |
Total | $ 4,120,600 | $ 5,463,877 |
From net realized gain | | |
Class A | $ 25,318 | $ - |
Class T | 15,214 | - |
Class B | 3,861 | - |
Class C | 13,226 | - |
International Value | 727,373 | - |
Institutional Class | 1,960 | - |
Total | $ 786,952 | $ - |
10. Share Transactions.
Transactions for each class of shares were as follows:
| Shares | Dollars |
Years ended October 31, | 2013 | 2012 | 2013 | 2012 |
Class A | | | | |
Shares sold | 221,312 | 186,877 | $ 1,773,149 | $ 1,294,428 |
Reinvestment of distributions | 17,344 | 19,578 | 128,001 | 128,823 |
Shares redeemed | (155,517) | (263,913) | (1,235,132) | (1,814,670) |
Net increase (decrease) | 83,139 | (57,458) | $ 666,018 | $ (391,419) |
Class T | | | | |
Shares sold | 91,084 | 87,833 | $ 741,140 | $ 599,355 |
Reinvestment of distributions | 11,018 | 10,069 | 81,425 | 66,355 |
Shares redeemed | (46,826) | (85,446) | (371,734) | (585,214) |
Net increase (decrease) | 55,276 | 12,456 | $ 450,831 | $ 80,496 |
Annual Report
10. Share Transactions - continued
| Shares | Dollars |
Years ended October 31, | 2013 | 2012 | 2013 | 2012 |
Class B | | | | |
Shares sold | 6,334 | 2,850 | $ 51,789 | $ 19,157 |
Reinvestment of distributions | 1,746 | 2,474 | 13,011 | 16,400 |
Shares redeemed | (26,098) | (40,532) | (212,223) | (279,913) |
Net increase (decrease) | (18,018) | (35,208) | $ (147,423) | $ (244,356) |
Class C | | | | |
Shares sold | 93,011 | 72,761 | $ 748,735 | $ 498,768 |
Reinvestment of distributions | 7,487 | 6,699 | 55,475 | 44,283 |
Shares redeemed | (43,711) | (75,717) | (352,531) | (522,498) |
Net increase (decrease) | 56,787 | 3,743 | $ 451,679 | $ 20,553 |
International Value | | | | |
Shares sold | 6,308,136 | 2,278,492 | $ 51,241,221 | $ 15,694,819 |
Reinvestment of distributions | 602,705 | 762,294 | 4,441,937 | 5,008,269 |
Shares redeemed | (4,113,021) | (7,089,505) | (32,981,230) | (48,008,194) |
Net increase (decrease) | 2,797,820 | (4,048,719) | $ 22,701,928 | $ (27,305,106) |
Institutional Class | | | | |
Shares sold | 6,984 | 18,483 | $ 56,532 | $ 132,098 |
Reinvestment of distributions | 1,136 | 1,234 | 8,383 | 8,117 |
Shares redeemed | (31,601) | (36,776) | (249,818) | (254,320) |
Net increase (decrease) | (23,481) | (17,059) | $ (184,903) | $ (114,105) |
11. Other.
The Fund's organizational documents provide former and current trustees and officers with a limited indemnification against liabilities arising in connection with the performance of their duties to the Fund. In the normal course of business, the Fund may also enter into contracts that provide general indemnifications. The Fund's maximum exposure under these arrangements is unknown as this would be dependent on future claims that may be made against the Fund. The risk of material loss from such claims is considered remote.
At the end of the period, Strategic Advisers International II Fund and VIP FundsManager 60% Portfolio were the owners of record of approximately 25% and 14%, respectively, of the total outstanding shares of the Fund.
Mutual funds managed by FMR or its affiliates were owners of record, in the aggregate, of approximately 46% of the total outstanding shares of the Fund.
Annual Report
To the Trustees of Fidelity Investment Trust and Shareholders of Fidelity International Value Fund:
We have audited the accompanying statement of assets and liabilities of Fidelity International Value Fund (the Fund), a fund of Fidelity Investment Trust, including the schedule of investments, as of October 31, 2013, and the related statement of operations for the year then ended, the statement of changes in net assets for each of the two years in the period then ended, and the financial highlights for each of the five years in the period then ended. These financial statements and financial highlights are the responsibility of the Fund's management. Our responsibility is to express an opinion on these financial statements and financial highlights based on our audits.
We conducted our audits in accordance with the standards of the Public Company Accounting Oversight Board (United States). Those standards require that we plan and perform the audit to obtain reasonable assurance about whether the financial statements and financial highlights are free of material misstatement. The Fund is not required to have, nor were we engaged to perform, an audit of its internal control over financial reporting. Our audits included consideration of internal control over financial reporting as a basis for designing audit procedures that are appropriate in the circumstances, but not for the purpose of expressing an opinion on the effectiveness of the Fund's internal control over financial reporting. Accordingly, we express no such opinion. An audit also includes examining, on a test basis, evidence supporting the amounts and disclosures in the financial statements, assessing the accounting principles used and significant estimates made by management, as well as evaluating the overall financial statement presentation. Our procedures included confirmation of securities owned as of October 31, 2013, by correspondence with the custodians and brokers; where replies were not received from brokers, we performed other auditing procedures. We believe that our audits provide a reasonable basis for our opinion.
In our opinion, the financial statements and financial highlights referred to above present fairly, in all material respects, the financial position of Fidelity International Value Fund as of October 31, 2013, the results of its operations for the year then ended, the changes in its net assets for each of the two years in the period then ended, and the financial highlights for each of the five years in the period then ended, in conformity with accounting principles generally accepted in the United States of America.
DELOITTE & TOUCHE LLP
Boston, Massachusetts
December 6, 2013
Annual Report
The Trustees, Member of the Advisory Board, and executive officers of the trust and fund, as applicable, are listed below. The Board of Trustees governs the fund and is responsible for protecting the interests of shareholders. The Trustees are experienced executives who meet periodically throughout the year to oversee the fund's activities, review contractual arrangements with companies that provide services to the fund, oversee management of the risks associated with such activities and contractual arrangements, and review the fund's performance. Except for James C. Curvey, Ned C. Lautenbach, Ronald P. O'Hanley, and William S. Stavropoulos, each of the Trustees oversees 171 funds. Mr. Curvey oversees 394 funds. Mr. Lautenbach, Mr. O'Hanley, and Mr. Stavropoulos each oversees 245 funds.
The Trustees hold office without limit in time except that (a) any Trustee may resign; (b) any Trustee may be removed by written instrument, signed by at least two-thirds of the number of Trustees prior to such removal; (c) any Trustee who requests to be retired or who has become incapacitated by illness or injury may be retired by written instrument signed by a majority of the other Trustees; and (d) any Trustee may be removed at any special meeting of shareholders by a two-thirds vote of the outstanding voting securities of the trust. Each Trustee who is not an interested person of the trust and the fund (as defined in the 1940 Act) (Independent Trustee), shall retire not later than the last day of the calendar year in which his or her 75th birthday occurs. The Independent Trustees may waive this mandatory retirement age policy with respect to individual Trustees. The executive officers and Advisory Board Member hold office without limit in time, except that any officer and Advisory Board Member may resign or may be removed by a vote of a majority of the Trustees at any regular meeting or any special meeting of the Trustees. Except as indicated, each individual has held the office shown or other offices in the same company for the past five years.
Experience, Skills, Attributes, and Qualifications of the Fund's Trustees. The Governance and Nominating Committee has adopted a statement of policy that describes the experience, qualifications, attributes, and skills that are necessary and desirable for potential Independent Trustee candidates (Statement of Policy). The Board believes that each Trustee satisfied at the time he or she was initially elected or appointed a Trustee, and continues to satisfy, the standards contemplated by the Statement of Policy. The Governance and Nominating Committee also engages professional search firms to help identify potential Independent Trustee candidates who have the experience, qualifications, attributes, and skills consistent with the Statement of Policy. From time to time, additional criteria based on the composition and skills of the current Independent Trustees, as well as experience or skills that may be appropriate in light of future changes to board composition, business conditions, and regulatory or other developments, have also been considered by the professional search firms and the Governance and Nominating Committee. In addition, the Board takes into account the Trustees' commitment and participation in Board and committee meetings, as well as their leadership of standing and ad hoc committees throughout their tenure.
Annual Report
Trustees and Officers - continued
In determining that a particular Trustee was and continues to be qualified to serve as a Trustee, the Board has considered a variety of criteria, none of which, in isolation, was controlling. The Board believes that, collectively, the Trustees have balanced and diverse experience, qualifications, attributes, and skills, which allow the Board to operate effectively in governing the fund and protecting the interests of shareholders. Information about the specific experience, skills, attributes, and qualifications of each Trustee, which in each case led to the Board's conclusion that the Trustee should serve (or continue to serve) as a trustee of the fund, is provided below.
Board Structure and Oversight Function. James C. Curvey is an interested person (as defined in the 1940 Act) and currently serves as Chairman. The Trustees have determined that an interested Chairman is appropriate and benefits shareholders because an interested Chairman has a personal and professional stake in the quality and continuity of services provided to the fund. Independent Trustees exercise their informed business judgment to appoint an individual of their choosing to serve as Chairman, regardless of whether the Trustee happens to be independent or a member of management. The Independent Trustees have determined that they can act independently and effectively without having an Independent Trustee serve as Chairman and that a key structural component for assuring that they are in a position to do so is for the Independent Trustees to constitute a substantial majority for the Board. The Independent Trustees also regularly meet in executive session. Ned C. Lautenbach serves as Chairman of the Independent Trustees and as such (i) acts as a liaison between the Independent Trustees and management with respect to matters important to the Independent Trustees and (ii) with management prepares agendas for Board meetings.
Fidelity funds are overseen by different Boards of Trustees. The fund's Board oversees Fidelity's equity and high income funds and another Board oversees Fidelity's investment-grade bond, money market, and asset allocation funds. The asset allocation funds may invest in Fidelity funds overseen by the fund's Board. The use of separate Boards, each with its own committee structure, allows the Trustees of each group of Fidelity funds to focus on the unique issues of the funds they oversee, including common research, investment, and operational issues. On occasion, the separate Boards establish joint committees to address issues of overlapping consequences for the Fidelity funds overseen by each Board.
The Trustees operate using a system of committees to facilitate the timely and efficient consideration of all matters of importance to the Trustees, the fund, and fund shareholders and to facilitate compliance with legal and regulatory requirements and oversight of the fund's activities and associated risks. The Board, acting through its committees, has charged FMR and its affiliates with (i) identifying events or circumstances the occurrence of which could have demonstrably adverse effects on the fund's business and/or reputation; (ii) implementing processes and controls to lessen the possibility that such events or circumstances occur or to mitigate the effects of such events or circumstances if they do occur; and (iii) creating and maintaining a system designed to evaluate continuously business and market conditions in order to facilitate the identification and implementation processes described in (i) and (ii) above. Because the day-to-day operations and activities of the fund are carried out by or through FMR, its affiliates and other service providers, the fund's exposure to risks is mitigated but not eliminated by the processes overseen by the Trustees. While each of the Board's committees has responsibility for overseeing different aspects of the fund's activities, oversight is exercised primarily through the Operations, Audit, and Compliance Committees. In addition, the Independent Trustees have worked with FMR to enhance the Board's oversight of investment and financial risks, legal and regulatory risks, technology risks, and operational risks, including the development of additional risk reporting to the Board. For example, a working group comprised of Independent Trustees and FMR has worked and continues to work to review the Fidelity funds' valuation-related activities, reporting and risk management. Appropriate personnel, including but not limited to the fund's Chief Compliance Officer (CCO), FMR's internal auditor, the independent accountants, the fund's Treasurer and portfolio management personnel, make periodic reports to the Board's committees, as appropriate, including an annual review of FMR's risk management program for the Fidelity funds. The responsibilities of each standing committee, including their oversight responsibilities, are described further under "Standing Committees of the Fund's Trustees."
Annual Report
The fund's Statement of Additional Information (SAI) includes more information about the Trustees. To request a free copy, call Fidelity at 1-877-208-0098.
Interested Trustees*:
Correspondence intended for each Trustee who is an interested person may be sent to Fidelity Investments, 245 Summer Street, Boston, Massachusetts 02210.
Name, Year of Birth; Principal Occupations and Other Relevant Experience+ |
James C. Curvey (1935) |
Year of Election or Appointment: 2007 Trustee Chairman of the Board of Trustees |
| Mr. Curvey also serves as Trustee of other Fidelity funds. Mr. Curvey is a Director of Fidelity Investments Money Management, Inc. (2009-present), Director of Fidelity Research & Analysis Co. (2009-present) and Director of FMR and FMR Co., Inc. (2007-present). Mr. Curvey is also Vice Chairman (2007-present) and Director of FMR LLC. In addition, Mr. Curvey serves as an Overseer for the Boston Symphony Orchestra and a member of the Trustees of Villanova University. Previously, Mr. Curvey was the Vice Chairman (2006-2007) and Director (2000-2007) of FMR Corp. |
Ronald P. O'Hanley (1957) |
Year of Election or Appointment: 2011 Trustee |
| Mr. O'Hanley also serves as Trustee of other Fidelity funds. He is Director of Fidelity SelectCo, LLC (2013-present), FMR Co., Inc. (2010-present), Director of Fidelity Investments Money Management, Inc. (2010-present), Director of Fidelity Research & Analysis Company (2010-present), President of Fidelity Asset Management and Corporate Services and a Member of Fidelity's Executive Committee (2010-present). Previously, Mr. O'Hanley served as President and Chief Executive Officer of BNY Mellon Asset Management (2007-2010). Mr. O'Hanley also served as Vice Chairman of Bank New York Mellon Corp. and a member of that firm's Executive Committee. Prior to the 2007 merger of The Bank of New York and Mellon Financial Corporation, he was Vice Chairman of Mellon Financial Corporation and President and Chief Executive Officer of Mellon Asset Management. He joined Mellon in February 1997. Mr. O'Hanley currently serves as Chairman of the Boston Public Library Foundation Board of Directors and sits on the Board of Directors of Beth Israel Deaconess Medical Center, the Board of Trustees of the Marine Biological Laboratory and the Advisory Board of the Maxwell School of Citizenship and Public Administration at Syracuse University. Mr. O'Hanley also chairs the Council on Asset Management for the Financial Services Roundtable and is a member of the Board of Directors of Institutional Investor's U.S. Institute. |
* Trustees have been determined to be "Interested Trustees" by virtue of, among other things, their affiliation with the trust or various entities under common control with FMR.
+ The information above includes each Trustee's principal occupation during the last five years and other information relating to the experience, attributes, and skills relevant to each Trustee's qualifications to serve as a Trustee, which led to the conclusion that each Trustee should serve as a Trustee for the fund.
Annual Report
Independent Trustees:
Correspondence intended for each Independent Trustee (that is, the Trustees other than the Interested Trustees) may be sent to Fidelity Investments, P.O. Box 55235, Boston, Massachusetts 02205-5235.
Name, Year of Birth; Principal Occupations and Other Relevant Experience+ |
Dennis J. Dirks (1948) |
Year of Election or Appointment: 2005 Trustee |
| Mr. Dirks also serves as Trustee of other Fidelity funds. Prior to his retirement in May 2003, Mr. Dirks was Chief Operating Officer and a member of the Board of The Depository Trust & Clearing Corporation (DTCC). He also served as President, Chief Operating Officer, and Board member of The Depository Trust Company (DTC) and President and Board member of the National Securities Clearing Corporation (NSCC). In addition, Mr. Dirks served as Chief Executive Officer and Board member of the Government Securities Clearing Corporation, Chief Executive Officer and Board member of the Mortgage-Backed Securities Clearing Corporation, as a Trustee and a member of the Finance Committee of Manhattan College (2005-2008), and as a Trustee and a member of the Finance Committee of AHRC of Nassau County (2006-2008). Mr. Dirks is a member of the Independent Directors Council (IDC) Governing Council (2010-present) and Board of Directors for The Brookville Center for Children's Services, Inc. (2009-present). |
Alan J. Lacy (1953) |
Year of Election or Appointment: 2008 Trustee |
| Mr. Lacy also serves as Trustee of other Fidelity funds. Mr. Lacy serves as Senior Adviser (2007-present) of Oak Hill Capital Partners, L.P. (private equity). Mr. Lacy also served as Chief Executive Officer (2000-2005) and Vice Chairman (2005-2006) of Sears Holdings Corporation and Sears, Roebuck and Co. (retail). In addition, Mr. Lacy serves as a member of the Board of Directors of Dave & Buster's Entertainment, Inc. (restaurant and entertainment complexes, 2010-present), Earth Fare, Inc. (retail grocery, 2012-present), The Hillman Companies, Inc. (hardware wholesalers, 2010-present), and Bristol-Myers Squibb Company (global pharmaceuticals, 2008-present). Mr. Lacy is a member of the Board of Trustees of The National Parks Conservation Association (2006-present). Previously, Mr. Lacy served as Chairman of the Board of Trustees of the National Parks Conservation Association (2008-2011) and as a member of the Board of Directors for the Western Union Company (global money transfer, 2006-2011). |
Ned C. Lautenbach (1944) |
Year of Election or Appointment: 2000 Trustee Chairman of the Independent Trustees |
| Mr. Lautenbach also serves as Trustee of other Fidelity funds. Mr. Lautenbach currently serves as the Lead Director of the Eaton Corporation Board of Directors (diversified industrial, 1997-present). Mr. Lautenbach is Chairman of the Board of Directors of the Philharmonic Center for the Arts in Naples, Florida (2012-present) and a member of the Council on Foreign Relations (1994-present). Previously, Mr. Lautenbach was a Partner/Advisory Partner at Clayton, Dubilier & Rice, LLC (private equity investment, 1998-2010), as well as a Director of Sony Corporation (2006-2007). |
Joseph Mauriello (1944) |
Year of Election or Appointment: 2008 Trustee |
| Mr. Mauriello also serves as Trustee of other Fidelity funds. Prior to his retirement in January 2006, Mr. Mauriello served in numerous senior management positions including Deputy Chairman and Chief Operating Officer (2004-2005), and Vice Chairman of Financial Services (2002-2004) of KPMG LLP US (professional services, 1965-2005). Mr. Mauriello currently serves as a member of the Board of Directors of XL Group plc. (global insurance and re-insurance, 2006-present). Previously, Mr. Mauriello served as a Director of the Hamilton Funds of the Bank of New York (2006-2007) and of Arcadia Resources Inc. (health care services and products, 2007-2012). |
Robert W. Selander (1950) |
Year of Election or Appointment: 2011 Trustee |
| Mr. Selander also serves as Trustee of other Fidelity funds. Previously, Mr. Selander served as a Member of the Advisory Board of other Fidelity funds (2011), and Executive Vice Chairman (2010), Chief Executive Officer (2009-2010), and President and Chief Executive Officer (1997-2009) of Mastercard, Inc. |
Cornelia M. Small (1944) |
Year of Election or Appointment: 2005 Trustee |
| Ms. Small also serves as Trustee of other Fidelity funds. Ms. Small is a member of the Board of Directors (2009-present) and Chair of the Investment Committee (2010-present) of the Teagle Foundation. Ms. Small also serves on the Investment Committee of the Berkshire Taconic Community Foundation (2008-present). Previously, Ms. Small served as Chairperson (2002-2008) and a member of the Investment Committee and Chairperson (2008-2012) and a member of the Board of Trustees of Smith College. In addition, Ms. Small served as Chief Investment Officer, Director of Global Equity Investments, and a member of the Board of Directors of Scudder, Stevens & Clark and Scudder Kemper Investments. |
William S. Stavropoulos (1939) |
Year of Election or Appointment: 2001 Trustee Vice Chairman of the Independent Trustees |
| Mr. Stavropoulos also serves as Trustee of other Fidelity funds. Mr. Stavropoulos serves as President and Founder of the Michigan Baseball Foundation, the Great Lakes Loons (2007-present). Mr. Stavropoulos is Chairman Emeritus of the Board of Directors of The Dow Chemical Company, where he previously served in numerous senior management positions, including President, CEO (1995-2000; 2002-2004), Chairman of the Executive Committee (2000-2006), and as a member of the Board of Directors (1990-2006). Currently, Mr. Stavropoulos is Chairman of the Board of Directors of Univar Inc. (global distributor of commodity and specialty chemicals), a Director of Teradata Corporation (data warehousing and technology solutions), and Maersk Inc. (industrial conglomerate), and a member of the Advisory Board for Metalmark Capital LLC (private equity investment, 2005-present). Mr. Stavropoulos is an operating advisor to Clayton, Dubilier & Rice, LLC (private equity investment). In addition, Mr. Stavropoulos is a member of the University of Notre Dame Advisory Council for the College of Science, a Trustee of the Rollin L. Gerstacker Foundation, and a Director of the Naples Philharmonic Center for the Arts. Previously, Mr. Stavropoulos served as a Director of Chemical Financial Corporation (bank holding company, 1993-2012) and Tyco International, Ltd. (multinational manufacturing and services, 2007-2012). |
David M. Thomas (1949) |
Year of Election or Appointment: 2008 Trustee |
| Mr. Thomas also serves as Trustee of other Fidelity funds. Mr. Thomas serves as Non-Executive Chairman of the Board of Directors of Fortune Brands Home and Security (home and security products, 2011-present), and as a member of the Board of Directors of Interpublic Group of Companies, Inc. (marketing communication, 2004-present). Previously, Mr. Thomas served as Executive Chairman (2005-2006) and Chairman and Chief Executive Officer (2000-2005) of IMS Health, Inc. (pharmaceutical and healthcare information solutions), and a Director of Fortune Brands, Inc. (consumer products, 2000-2011). |
+ The information above includes each Trustee's principal occupation during the last five years and other information relating to the experience, attributes, and skills relevant to each Trustee's qualifications to serve as a Trustee, which led to the conclusion that each Trustee should serve as a Trustee for the fund.
Advisory Board Member and Executive Officers:
Correspondence intended for each executive officer and Peter S. Lynch may be sent to Fidelity Investments, 245 Summer Street, Boston, Massachusetts 02210. Executive officers appear below in alphabetical order.
Name, Year of Birth; Principal Occupation |
Peter S. Lynch (1944) |
Year of Election or Appointment: 2003 Member of the Advisory Board |
| Mr. Lynch also serves as Member of the Advisory Board of other Fidelity funds. Mr. Lynch is Vice Chairman and a Director of FMR and FMR Co., Inc. In addition, Mr. Lynch serves as a Trustee of Boston College and as the Chairman of the Inner-City Scholarship Fund. Previously, Mr. Lynch served on the Special Olympics International Board of Directors (1997-2006). |
Elizabeth Paige Baumann (1968) |
Year of Election or Appointment: 2012 Anti-Money Laundering (AML) Officer |
| Ms. Baumann also serves as AML Officer of other funds. She is Chief AML Officer of FMR LLC (2012-present) and is an employee of Fidelity Investments. Previously, Ms. Baumann served as Vice President and Deputy Anti-Money Laundering Officer (2007-2012). |
William C. Coffey (1969) |
Year of Election or Appointment: 2009 Assistant Secretary |
| Mr. Coffey also serves as Assistant Secretary of other funds. He is Senior Vice President and Deputy General Counsel of FMR LLC (2010-present), and is an employee of Fidelity Investments. Previously, Mr. Coffey served as Vice President and Associate General Counsel of FMR LLC (2005-2009). |
Jonathan Davis (1968) |
Year of Election or Appointment: 2010 Assistant Treasurer |
| Mr. Davis also serves as Assistant Treasurer of other funds. Mr. Davis is an employee of Fidelity Investments. Previously, Mr. Davis served as Vice President and Associate General Counsel of FMR LLC (2003-2010). |
Adrien E. Deberghes (1967) |
Year of Election or Appointment: 2008 Deputy Treasurer |
| Mr. Deberghes also serves as an officer of other funds. He is an employee of Fidelity Investments (2008-present). Prior to joining Fidelity Investments, Mr. Deberghes was Senior Vice President of Mutual Fund Administration at State Street Corporation (2007-2008), Senior Director of Mutual Fund Administration at Investors Bank & Trust (2005-2007), and Director of Finance for Dunkin' Brands (2000-2005). |
Stephanie J. Dorsey (1969) |
Year of Election or Appointment: 2010 Assistant Treasurer |
| Ms. Dorsey also serves as an officer of other funds. She is an employee of Fidelity Investments (2008-present) and has served in other fund officer roles. Prior to joining Fidelity Investments, Ms. Dorsey served as Treasurer (2004-2008) of the JPMorgan Mutual Funds and Vice President (2004-2008) of JPMorgan Chase Bank. |
Scott C. Goebel (1968) |
Year of Election or Appointment: 2008 Secretary and Chief Legal Officer (CLO) |
| Mr. Goebel serves as Secretary and CLO of other funds. Mr. Goebel also serves as Secretary of Fidelity Investments Money Management, Inc. (FIMM) (2010-present) and Fidelity Research and Analysis Company (FRAC) (2010-present); General Counsel, Secretary, and Senior Vice President of FMR (2008-present) and FMR Co., Inc. (2008-present); Chief Legal Officer of Fidelity Management & Research (Hong Kong) Limited (2008-present) and Assistant Secretary of Fidelity Management & Research (Japan) Inc. (2008-present), and Fidelity Management & Research (U.K.) Inc. (2008-present). Previously, Mr. Goebel served as Secretary and CLO of other Fidelity funds (2008-2013), Assistant Secretary of FIMM (2008-2010), FRAC (2008-2010), and certain funds (2007-2008); and as Vice President and Secretary of Fidelity Distributors Corporation (FDC) (2005-2007). Mr. Goebel has been employed by FMR LLC or an affiliate since 2001. |
Joseph A. Hanlon (1968) |
Year of Election or Appointment: 2012 Chief Compliance Officer |
| Mr. Hanlon also serves as Chief Compliance Officer of other funds. Mr. Hanlon serves as Compliance Officer of FMR, FMR Co., Inc., Fidelity Investments Money Management, Inc. (FIMM), Fidelity Research and Analysis Company (FRAC), and Fidelity Management & Research (Hong Kong) (2009-present), as Senior Vice President of the Fidelity Asset Management Division (2009-present), and is an employee of Fidelity Investments. Previously, Mr. Hanlon served as Compliance Officer of Fidelity Management & Research (Japan) Inc. (2009-2013), Strategic Advisers, Inc. (2009-2013), and Fidelity Management & Research (U.K.) Inc. (2009-2013). |
Bruce T. Herring (1965) |
Year of Election or Appointment: 2006 Vice President of certain Equity Funds |
| Mr. Herring also serves as Vice President of other funds. He serves as Chief Investment Officer of Fidelity Global Asset Allocation (GAA) (2013-present), Chief Investment Officer and Director of Fidelity Management & Research (U.K.) Inc. (2010-present), Group Chief Investment Officer of FMR, and President of Fidelity Research & Analysis Company (2010-present). Previously, Mr. Herring served as Vice President (2005-2006) and Senior Vice President (2006-2007) of Fidelity Management & Research Company, Vice President of FMR Co., Inc. (2001-2007), and as a portfolio manager for Fidelity U.S. Equity Funds. |
Brian B. Hogan (1964) |
Year of Election or Appointment: 2009 Vice President |
| Mr. Hogan also serves as Vice President of other funds. Mr. Hogan serves as President of FMR's Equity Division (2009-present). Previously, Mr. Hogan served as Senior Vice President, Equity Research of FMR (2006-2009) and as a portfolio manager. |
Chris Maher (1972) |
Year of Election or Appointment: 2013 Assistant Treasurer |
| Mr. Maher serves as Assistant Treasurer of other funds. Mr. Maher is Vice President of Valuation Oversight and is an employee of Fidelity Investments. Previously, Mr. Maher served as Vice President of Asset Management Compliance (2013), Vice President of FMR's Program Management Group (2010-2013), and Vice President of Valuation Oversight (2008-2010). |
Christine Reynolds (1958) |
Year of Election or Appointment: 2008 Chief Financial Officer |
| Ms. Reynolds also serves as Chief Financial Officer of other funds. Ms. Reynolds became President of Fidelity Pricing and Cash Management Services (FPCMS) in August 2008. Ms. Reynolds served as Chief Operating Officer of FPCMS (2007-2008). Previously, Ms. Reynolds served as President, Treasurer, and Anti-Money Laundering officer of the Fidelity funds (2004-2007). |
Kenneth B. Robins (1969) |
Year of Election or Appointment: 2008 President and Treasurer |
| Mr. Robins also serves as an officer of other funds. Mr. Robins serves as Executive Vice President of Fidelity Investments Money Management, Inc. (FIMM) (2013-present) and is an employee of Fidelity Investments (2004-present). Previously, Mr. Robins served in other fund officer roles. |
Gary W. Ryan (1958) |
Year of Election or Appointment: 2005 Assistant Treasurer |
| Mr. Ryan also serves as Assistant Treasurer of other funds. Mr. Ryan is an employee of Fidelity Investments and has served in other fund officer roles. Previously, Mr. Ryan served as Vice President of Fund Reporting in Fidelity Pricing and Cash Management Services (FPCMS) (1999-2005). |
Stephen Sadoski (1971) |
Year of Election or Appointment: 2012 Deputy Treasurer |
| Mr. Sadoski also serves as Deputy Treasurer of other funds. He is an employee of Fidelity Investments (2012-present) and has served in another fund officer role. Prior to joining Fidelity Investments, Mr. Sadoski served as an assistant chief accountant in the Division of Investment Management of the Securities and Exchange Commission (SEC) (2009-2012) and as a senior manager at Deloitte & Touche LLP (1997-2009). |
Stacie M. Smith (1974) |
Year of Election or Appointment: 2013 Deputy Treasurer |
| Ms. Smith also serves as an officer of other funds. She is an employee of Fidelity Investments (2009-present) and has served in other fund officer roles. Prior to joining Fidelity Investments, Ms. Smith served as Senior Audit Manager of Ernst & Young LLP (1996-2009). |
Renee Stagnone (1975) |
Year of Election or Appointment: 2013 Deputy Treasurer |
| Ms. Stagnone also serves as Deputy Treasurer of other funds. Ms. Stagnone is an employee of Fidelity Investments. |
Joseph F. Zambello (1957) |
Year of Election or Appointment: 2011 Deputy Treasurer |
| Mr. Zambello also serves as Deputy Treasurer of other funds. Mr. Zambello is an employee of Fidelity Investments. Previously, Mr. Zambello served as Vice President of FMR's Program Management Group (2009-2011) and Vice President of the Transfer Agent Oversight Group (2005-2009). |
Annual Report
The Board of Trustees of Advisor International Value Fund voted to pay to shareholders of record at the opening of business on record date, the following distributions per share derived from capital gains realized from sales of portfolio securities, and dividends derived from net investment income:
| Pay Date | Record Date | Dividends | Capital Gains |
Class A | 12/09/13 | 12/06/13 | $0.170 | $0.014 |
| | | | |
Class T | 12/09/13 | 12/06/13 | $0.150 | $0.014 |
| | | | |
Class B | 12/09/13 | 12/06/13 | $0.093 | $0.014 |
| | | | |
Class C | 12/09/13 | 12/06/13 | $0.111 | $0.014 |
A percentage of the dividends distributed during the fiscal year for the following fund may be taken into account as a dividend for the purpose of the maximum rate under section 1(h)(11) of the Internal Revenue Code.
| December 2012 |
Class A | 82% |
Class T | 88% |
Class B | 100% |
Class C | 100% |
The amounts per share which represent income derived from sources within, and taxes paid to, foreign countries or possessions of the United States are as follows:
| Pay Date | Income | Taxes |
Class A | 12/10/12 | $0.179 | $0.0098 |
| | | |
Class T | 12/10/12 | $0.168 | $0.0098 |
| | | |
Class B | 12/10/12 | $0.128 | $0.0098 |
| | | |
Class C | 12/10/12 | $0.145 | $0.0098 |
The fund will notify shareholders in January 2014 of amounts for use in preparing 2013 income tax returns.
Annual Report
Board Approval of Investment Advisory Contracts and Management Fees
Fidelity International Value Fund
Each year, the Board of Trustees, including the Independent Trustees (together, the Board), votes on the renewal of the management contract and sub-advisory agreements (together, the Advisory Contracts) for the fund. The Board, assisted by the advice of fund counsel and Independent Trustees' counsel, requests and considers a broad range of information relevant to the renewal of the Advisory Contracts throughout the year.
The Board meets regularly and, at each of its meetings, covers an extensive agenda of topics and materials and considers factors that are relevant to its annual consideration of the renewal of the fund's Advisory Contracts, including the services and support provided to the fund and its shareholders. The Board has established various standing committees, each composed of and chaired by Independent Trustees with varying backgrounds, to which the Board has assigned specific subject matter responsibilities in order to enhance effective decision-making by the Board. The Board, acting directly and through its Committees, requests and receives information concerning the annual consideration of the renewal of the fund's Advisory Contracts. The Board also meets as needed to consider matters specifically related to the Board's annual consideration of the renewal of Advisory Contracts. Members of the Board may also meet with trustees of other Fidelity funds through ad hoc joint committees to discuss certain matters relevant to the Fidelity funds.
At its July 2013 meeting, the Board, including the Independent Trustees, unanimously determined to renew the fund's Advisory Contracts. In reaching its determination, the Board considered all factors it believed relevant, including (i) the nature, extent, and quality of the services to be provided to the fund and its shareholders (including the investment performance of the fund); (ii) the competitiveness of the fund's management fee and total expense ratio relative to peer funds; (iii) the total costs of the services to be provided by and the profits to be realized by Fidelity from its relationship with the fund; (iv) the extent to which economies of scale exist and would be realized as the fund grows; and (v) whether fee levels reflect these economies of scale, if any, for the benefit of fund shareholders.
In considering whether to renew the Advisory Contracts for the fund, the Board reached a determination, with the assistance of fund counsel and Independent Trustees' counsel and through the exercise of its business judgment, that the renewal of the Advisory Contracts was in the best interests of the fund and its shareholders and that the compensation payable under the Advisory Contracts was fair and reasonable. The Board's decision to renew the Advisory Contracts was not based on any single factor, but rather was based on a comprehensive consideration of all the information provided to the Board at its meetings throughout the year. The Board, in reaching its determination to renew the Advisory Contracts, was aware that shareholders in the fund have a broad range of investment choices available to them, including a wide choice among mutual funds offered by Fidelity's competitors, and that the fund's shareholders, who have the opportunity to review and weigh the disclosure provided by the fund in its prospectus and other public disclosures, have chosen to invest in this fund, which is a part of the Fidelity family of funds.
Annual Report
Nature, Extent, and Quality of Services Provided. The Board considered the staffing within the investment adviser, Fidelity Management & Research Company (FMR), and the sub-advisers (together, the Investment Advisers) as it relates to the fund, including the backgrounds of the fund's investment personnel, and also considered the fund's investment objective, strategies, and related investment philosophy. The Independent Trustees also had discussions with senior management of Fidelity's investment operations and investment groups. The Board considered the structure of the portfolio manager compensation program and whether this structure provides appropriate incentives to act in the best interests of the fund.
Resources Dedicated to Investment Management and Support Services. The Board and the Fund Oversight and Research Committees reviewed the general qualifications and capabilities of the Investment Advisers' investment staff, including its size, education, experience, and resources, as well as the Investment Advisers' approach to recruiting, training, managing, and compensating investment personnel. The Board noted that FMR has continued to increase the resources devoted to non-U.S. offices, including expansion of Fidelity's global investment organization. The Board also noted that Fidelity's analysts have extensive resources, tools and capabilities that allow them to conduct sophisticated quantitative and fundamental analysis, as well as credit analysis of issuers, counterparties and guarantors. Further, the Board believes that Fidelity's investment professionals have sufficient access to global information and data so as to provide competitive investment results over time, and that those professionals also have access to sophisticated tools that permit them to assess portfolio construction and risk and performance attribution characteristics continuously, as well as to transmit new information and research conclusions rapidly around the world. Additionally, in its deliberations, the Board considered the Investment Advisers' trading and risk management capabilities and resources, which are an integral part of the investment management process.
Shareholder and Administrative Services. The Board considered (i) the nature, extent, quality, and cost of advisory, administrative, and shareholder services performed by the Investment Advisers and their affiliates under the Advisory Contracts and under separate agreements covering transfer agency, pricing and bookkeeping, and securities lending services for the fund; (ii) the nature and extent of the supervision of third party service providers, principally custodians and subcustodians; and (iii) the resources devoted to, and the record of compliance with, the fund's compliance policies and procedures. The Board also reviewed the allocation of fund brokerage, including allocations to brokers affiliated with the Investment Advisers, the use of brokerage commissions to pay fund expenses, and the use of "soft" commission dollars to pay for research services.
Annual Report
Board Approval of Investment Advisory Contracts and
Management Fees - continued
The Board noted that the growth of fund assets over time across the complex allows Fidelity to reinvest in the development of services designed to enhance the value or convenience of the Fidelity funds as investment vehicles. These services include 24-hour access to account information and market information through telephone representatives and over the Internet, investor education materials and asset allocation tools, and the expanded availability of Fidelity Investor Centers.
Investment in a Large Fund Family. The Board considered the benefits to shareholders of investing in a Fidelity fund, including the benefits of investing in a fund that is part of a large family of funds offering a variety of investment disciplines and providing a large variety of mutual fund investor services. The Board noted that Fidelity had taken, or had made recommendations that resulted in the Fidelity funds taking, a number of actions over the previous year that benefited particular funds, including (i) continuing to dedicate additional resources to investment research and to the support of the senior management team that oversees asset management; (ii) persisting in efforts to enhance Fidelity's global research capabilities; (iii) launching new funds and making other enhancements to meet client needs for global and income-oriented solutions; (iv) continuing to launch dedicated lower cost underlying funds to meet portfolio construction needs related to expanding underlying fund options for Fidelity funds of funds, specifically for the Freedom Fund product lines; (v) rationalizing product lines and gaining increased efficiencies through the mergers of several funds into other funds; (vi) strengthening Fidelity's index fund offerings by reducing investment minimums and adopting or lowering existing expense caps for certain funds and classes; (vii) enhancing Global Asset Allocation product offerings by launching new funds and strategies, including "open architecture" target date funds that utilize affiliated and unaffiliated sub-advisers; (viii) modifying the eligibility criteria for Institutional Class shares of Advisor funds to increase their marketability to a portion of the defined contribution plan market; (ix) creating a new low-cost retirement share class for certain Advisor funds to appeal to large retirement plans; (x) transitioning the management of certain Fidelity commodity funds to Geode Capital Management LLC, a registered commodity pool operator, while retaining administrative responsibilities for the funds; (xi) reorganizing a number of funds; and (xii) taking steps toward establishing a new Fidelity adviser to manage sector-based funds and products.
Investment Performance. The Board considered whether the fund has operated in accordance with its investment objective, as well as its record of compliance with its investment restrictions and its performance history. The Board noted that there was a portfolio management change for the fund in September 2011.
Annual Report
The Board took into account discussions with the Investment Advisers about fund investment performance that occur at Board meetings throughout the year. In this regard the Board noted that as part of regularly scheduled fund reviews and other reports to the Board on fund performance, the Board periodically considers annualized return information for the fund, for different time periods, measured against a securities market index ("benchmark index") and a peer group of mutual funds with similar objectives ("peer group"). In its evaluation of fund investment performance, the Board gave particular attention to information indicating changes in performance of certain Fidelity funds for specific time periods and the Investment Advisers' explanations for any overperformance or underperformance.
In addition to reviewing absolute and relative fund performance, the Independent Trustees periodically consider the appropriateness of fund performance metrics in evaluating the results achieved. In general, the Independent Trustees believe that fund performance should be evaluated based on net performance (after fees and expenses) of both the highest performing and lowest performing classes, where applicable, compared to appropriate benchmark indices, over appropriate time periods which may include full market cycles, and compared to peer groups, as applicable, over the same periods, taking into account relevant factors including the following: general market conditions; issuer-specific information; tactical opportunities for investment; and fund cash flows and other factors.
The Independent Trustees recognize that shareholders evaluate performance on a net basis over their own holding periods, for which one-, three-, and five-year periods are used as a proxy. For this reason, the performance information reviewed by the Board also included net cumulative calendar year total return information for the fund and an appropriate benchmark index and peer group for the most recent one-, three-, and five-year periods, as shown below. Returns are shown compared to the 25th percentile (top of box) and 75th percentile (bottom of box) of the peer universe. Returns of the benchmark index are "net MA," i.e., adjusted for tax withholding rates applicable to U.S.-based mutual funds organized as Massachusetts business trusts.
Annual Report
Board Approval of Investment Advisory Contracts and
Management Fees - continued
Fidelity International Value Fund

The Board also considered that the fund's management fee is subject to upward or downward adjustment depending upon whether, and to what extent, the fund's investment performance for the performance period exceeds, or is exceeded by, a securities index, thus leading to a performance adjustment for the same period. The Board noted that the performance adjustment provides FMR with a strong economic incentive to seek to achieve superior performance for the fund's shareholders and helps to more closely align the interests of FMR and the fund's shareholders.
Based on its review, the Board concluded that the nature, extent, and quality of services provided to the fund under the Advisory Contracts should benefit the fund's shareholders.
Competitiveness of Management Fee and Total Expense Ratio. The Board considered the fund's management fee and total expense ratio compared to "mapped groups" of competitive funds and classes. Fidelity creates "mapped groups" by combining similar Lipper investment objective categories that have comparable management fee characteristics. Combining Lipper investment objective categories aids the Board's management fee and total expense ratio comparisons by broadening the competitive group used for comparison and by reducing the number of universes to which various Fidelity funds are compared.
Management Fee. The Board considered two proprietary management fee comparisons for the 12-month periods shown in the chart below. The group of Lipper funds used by the Board for management fee comparisons is referred to below as the "Total Mapped Group." The Total Mapped Group comparison focuses on a fund's standing in terms of gross management fees before expense reimbursements or caps, and without giving effect to the fund's performance adjustment, relative to the total universe of funds with comparable investment mandates, regardless of whether their management fee structures also are comparable. Funds with comparable investment mandates offer exposure to similar types of securities. Funds with comparable management fee structures have similar management fee contractual arrangements (e.g., flat rate charged for advisory services, all-inclusive fee rate, etc.). "TMG %" represents the percentage of funds in the Total Mapped Group that had management fees that were lower than the fund's. For example, a TMG % of 16% means that 84% of the funds in the Total Mapped Group had higher management fees than the fund. The "Asset-Size Peer Group" (ASPG) comparison focuses on a fund's standing relative to a subset of non-Fidelity funds within the Total Mapped Group that are similar in size and management fee structure. The ASPG represents at least 15% of the funds in the Total Mapped Group with comparable asset size and management fee structures, subject to a minimum of 50 funds (or all funds in the Total Mapped Group if fewer than 50). Additional information, such as the ASPG quartile in which the fund's management fee ranked and the impact of the fund's performance adjustment, is also included in the chart and considered by the Board.
Annual Report
Fidelity International Value Fund

The Board noted that the fund's management fee ranked below the median of its Total Mapped Group and below the median of its ASPG for 2012. The Board also noted the effect of the fund's negative performance adjustment on the fund's management fee ranking.
Annual Report
Board Approval of Investment Advisory Contracts and
Management Fees - continued
Based on its review, the Board concluded that the fund's management fee is fair and reasonable in light of the services that the fund receives and the other factors considered.
Total Expense Ratio. In its review of each class's total expense ratio, the Board considered the fund's management fee as well as other fund or class expenses, as applicable, such as transfer agent fees, pricing and bookkeeping fees, fund-paid 12b-1 fees, and custodial, legal, and audit fees. The Board also noted the effects of any waivers and reimbursements on fees and expenses, as well as the impact of the fund's performance adjustment. As part of its review, the Board also considered the current and historical total expense ratios of each class of the fund compared to competitive fund median expenses. Each class of the fund is compared to those funds and classes in the Total Mapped Group (used by the Board for management fee comparisons) that have a similar sales load structure.
The Board noted that the total expense ratio of each of Class A, Class B, Institutional Class, and the retail class ranked below its competitive median for 2012 and the total expense ratio of each of Class T and Class C ranked above its competitive median for 2012. The Board considered that, in general, various factors can affect total expense ratios. The Board noted that the total expense ratio of Class T was above the competitive median primarily because of higher 12b-1 fees on Class T. Class T has a higher 12b-1 fee, but a lower front-end sales charge, than traditionally priced front-end sales charge classes. The Board considered that Class T is primarily sold load-waived in the retirement plan market where its 0.50% 12b-1 fee is comparable to competing no-load, higher 12b-1 fee classes designed specifically for retirement plans. The Board noted that the fund offers multiple classes, each of which has a different sales load and 12b-1 fee structure, and that the multiple structures are intended to offer a range of pricing options for the intermediary market. The Board also noted that the total expense ratios of the classes vary primarily by the level of their 12b-1 fees, although differences in transfer agent fees may also cause expenses to vary from class to class.
Fees Charged to Other Fidelity Clients. The Board also considered Fidelity fee structures and other information with respect to clients of FMR and its affiliates, such as other mutual funds advised or subadvised by FMR or its affiliates, pension plan clients, and other institutional clients. The Board noted the findings of the 2013 ad hoc joint committee (created with the board of other Fidelity funds), which reviewed and compared Fidelity's institutional investment advisory business with its business of providing services to the Fidelity funds, including the differences in services provided, fees charged, and costs incurred, as well as competition in their respective marketplaces.
Based on its review of total expense ratios and fees charged to other Fidelity clients, the Board concluded that the total expense ratio of each class of the fund was reasonable, although in some cases above the median of the universe presented for comparison, in light of the services that the fund and its shareholders receive and the other factors considered.
Annual Report
Costs of the Services and Profitability. The Board considered the revenues earned and the expenses incurred by Fidelity in conducting the business of developing, marketing, distributing, managing, administering and servicing the fund and servicing the fund's shareholders. The Board also considered the level of Fidelity's profits in respect of all the Fidelity funds.
On an annual basis, FMR presents to the Board Fidelity's profitability for the fund. Fidelity calculates the profitability for each fund, as well as aggregate profitability for groups of Fidelity funds and all Fidelity funds, using a series of detailed revenue and cost allocation methodologies which originate with the books and records of Fidelity on which Fidelity's audited financial statements are based. The Audit Committee of the Board reviews any significant changes from the prior year's methodologies.
PricewaterhouseCoopers LLP (PwC), independent registered public accounting firm and auditor to Fidelity and certain Fidelity funds, has been engaged annually by the Board as part of the Board's assessment of Fidelity's profitability analysis. PwC's engagement includes the review and assessment of the methodologies used by Fidelity in determining the revenues and expenses attributable to Fidelity's mutual fund business, and completion of agreed-upon procedures surrounding the mathematical accuracy of fund profitability and its conformity to allocation methodologies. After considering PwC's reports issued under the engagement and information provided by Fidelity, the Board concluded that while other allocation methods may also be reasonable, Fidelity's profitability methodologies are reasonable in all material respects.
The Board also reviewed Fidelity's non-fund businesses and fall-out benefits related to the mutual fund business as well as cases where Fidelity's affiliates may benefit from or be related to the fund's business.
The Board considered the costs of the services provided by and the profits realized by Fidelity in connection with the operation of the fund and was satisfied that the profitability was not excessive in the circumstances.
Economies of Scale. The Board considered whether there have been economies of scale in respect of the management of the Fidelity funds, whether the Fidelity funds (including the fund) have appropriately benefited from any such economies of scale, and whether there is potential for realization of any further economies of scale. The Board considered the extent to which the fund will benefit from economies of scale through increased services to the fund, through waivers or reimbursements, or through fee or expense reductions. The Board also noted that in 2009, it and the board of other Fidelity funds created an ad hoc committee (the Economies of Scale Committee) to analyze whether FMR attains economies of scale in respect of the management and servicing of the Fidelity funds, whether the Fidelity funds have appropriately benefited from such economies of scale, and whether there is potential for realization of any further economies of scale.
Annual Report
Board Approval of Investment Advisory Contracts and
Management Fees - continued
The Board recognized that the fund's management contract incorporates a "group fee" structure, which provides for lower group fee rates as total fund assets under FMR's management increase, and for higher group fee rates as total fund assets under FMR's management decrease. FMR calculates the group fee rates based on a tiered asset "breakpoint" schedule that varies based on asset class. The Board considered that the group fee is designed to deliver the benefits of economies of scale to fund shareholders when total Fidelity fund assets increase, even if assets of any particular fund are unchanged or have declined, because some portion of Fidelity's costs are attributable to services provided to all Fidelity funds, and all funds benefit if those costs can be allocated among more assets. The Board concluded that, given the group fee structure, fund shareholders will benefit from lower management fees as assets under FMR's management increase at the fund complex level, regardless of whether Fidelity achieves any such economies of scale.
The Board concluded, taking into account the analysis of the Economies of Scale Committee, that economies of scale, if any, are being appropriately shared between fund shareholders and Fidelity.
Amendment to Description of Group Fee Rate. At its July 2013 meeting, the Board voted to approve an amendment to the fund's management contract to modify the description of the "group fee rate" effective August 1, 2013. The Board noted that under the prior description in the contract, the group fee rate was based on the average net assets of all registered investment companies with which FMR has management contracts. Under the contract's tiered asset breakpoint schedule, the group fee rate is lower as total fund assets under FMR's management increase, and higher as total fund assets under FMR's management decrease. The Board considered that the prior description would have excluded the assets of 64 Fidelity sector funds from the group fee rate calculation once Fidelity SelectCo, LLC, an affiliate of FMR, assumed management responsibilities for those funds. The Board noted that modifying the description of the group fee rate to continue to include the assets of those 64 funds for purposes of determining group fee rate breakpoints would avoid an immediate adverse impact on the group fee rate for any fund.
Additional Information Requested by the Board. In order to develop fully the factual basis for consideration of the Fidelity funds' Advisory Contracts, the Board requested and received additional information on certain topics, including: (i) fund performance trends and Fidelity's long-term strategies for certain funds; (ii) the potential to further rationalize the Fidelity fund lineup with the possibility of achieving savings for the funds and Fidelity; (iii) the methodology with respect to competitive fund data and peer group classifications; (iv) the arrangements with, and performance of, certain sub-advisers on behalf of the Fidelity funds, as well as certain proposed participating affiliate arrangements; (v) the realization of fall-out benefits in certain Fidelity business units; (vi) Fidelity's group fee structures, including the rationale for the individual fee rates of certain categories of funds and the definition of group assets; (vii) trends regarding industry use of performance fee structures and the performance adjustment methodologies applicable to the Fidelity funds; (viii) additional competitive analysis regarding the total expenses for certain classes; and (ix) fund profitability methodology, including Fidelity's cost allocation methodology, and the impact of certain factors on fund profitability results.
Annual Report
Based on its evaluation of all of the conclusions noted above, and after considering all factors it believed relevant, the Board ultimately concluded that the advisory fee structures are fair and reasonable, and that the fund's Advisory Contracts should be renewed.
Annual Report
Investment Adviser
Fidelity Management & Research Company
Boston, MA
Investment Sub-Advisers
FMR Co., Inc.
Fidelity Management & Research
(U.K.) Inc.
Fidelity Management & Research
(Hong Kong) Limited
Fidelity Management & Research
(Japan) Inc.
FIL Investment Advisors
FIL Investment Advisors (U.K.) Limited
FIL Investments (Japan) Limited
General Distributor
Fidelity Distributors Corporation
Smithfield, RI
Transfer and Service Agents
Fidelity Investments Institutional Operations Company, Inc.
Boston, MA
Fidelity Service Company, Inc.
Boston, MA
Custodian
The Northern Trust Company
Chicago, IL
(Fidelity Investment logo)(registered trademark)
AFIV-UANN-1213
1.827496.107
(Fidelity Investment logo)(registered trademark)
Fidelity Advisor®
International Value
Fund - Institutional Class
Annual Report
October 31, 2013
(Fidelity Cover Art)
Institutional Class is
a class of Fidelity®
International Value Fund
Contents
Performance | (Click Here) | How the fund has done over time. |
Management's Discussion of Fund Performance | (Click Here) | The Portfolio Manager's review of fund performance and strategy. |
Shareholder Expense Example | (Click Here) | An example of shareholder expenses. |
Investment Changes | (Click Here) | A summary of major shifts in the fund's investments over the past six months. |
Investments | (Click Here) | A complete list of the fund's investments with their market values. |
Financial Statements | (Click Here) | Statements of assets and liabilities, operations, and changes in net assets, as well as financial highlights. |
Notes | (Click Here) | Notes to financial statements. |
Report of Independent Registered Public Accounting Firm | (Click Here) | |
Trustees and Officers | (Click Here) | |
Distributions | (Click Here) | |
Board Approval of Investment Advisory Contracts and Management Fees | (Click Here) | |
To view a fund's proxy voting guidelines and proxy voting record for the 12-month period ended June 30, visit http://www.fidelity.com/proxyvotingresults or visit the Securities and Exchange Commission's (SEC) web site at http://www.sec.gov. You may also call 1-877-208-0098 to request a free copy of the proxy voting guidelines.
Standard & Poor's, S&P and S&P 500 are registered service marks of The McGraw-Hill Companies, Inc. and have been licensed for use by Fidelity Distributors Corporation.
Other third-party marks appearing herein are the property of their respective owners.
All other marks appearing herein are registered or unregistered trademarks or service marks of FMR LLC or an affiliated company. © 2013 FMR LLC. All rights reserved.
Annual Report
This report and the financial statements contained herein are submitted for the general information of the shareholders of the fund. This report is not authorized for distribution to prospective investors in the fund unless preceded or accompanied by an effective prospectus.
A fund files its complete schedule of portfolio holdings with the SEC for the first and third quarters of each fiscal year on Form N-Q. Forms N-Q are available on the SEC's web site at http://www.sec.gov. A fund's Forms N-Q may be reviewed and copied at the SEC's Public Reference Room in Washington, DC. Information regarding the operation of the SEC's Public Reference Room may be obtained by calling 1-800-SEC-0330. For a complete list of a fund's portfolio holdings, view the most recent holdings listing, semiannual report, or annual report on Fidelity's web site at http://www.fidelity.com, http://www.advisor.fidelity.com, or http://www.401k.com, as applicable.
NOT FDIC INSURED • MAY LOSE VALUE • NO BANK GUARANTEE
Neither the fund nor Fidelity Distributors Corporation is a bank.
Annual Report
Average annual total return reflects the change in the value of an investment, assuming reinvestment of the class' distributions from dividend income and capital gains (the profits earned upon the sale of securities that have grown in value, if any) and assuming a constant rate of performance each year. The $10,000 table and the fund's returns do not reflect the deduction of taxes that a shareholder would pay on fund distributions or the redemption of fund shares. During periods of reimbursement by Fidelity, a fund's total return will be greater than it would be had the reimbursement not occurred. How a fund did yesterday is no guarantee of how it will do tomorrow.
Average Annual Total Returns
Periods ended October 31, 2013 | Past 1
year | Past 5
years | Life of
fund A |
Institutional Class | 25.64% | 11.71% | 1.46% |
A From May 18, 2006.
$10,000 Over Life of Fund
Let's say hypothetically that $10,000 was invested in Fidelity Advisor® International Value Fund - Institutional Class on May 18, 2006, when the fund started. The chart shows how the value of your investment would have changed, and also shows how the MSCI® EAFE® Value Index performed over the same period.

Annual Report
Market Recap: On balance, global equity markets remained upbeat for the 12-month period ending October 31, 2013. The MSCI® ACWI® (All Country World Index) Index gained 23.75% for the period, amid investor preference for higher-risk assets. The period was not without turbulence, however. In the spring and summer, central banks worldwide, especially in the U.S. and China, made clear their intentions to maintain accommodative monetary policies. That stance, combined with modest cyclical improvements around the globe and generally low valuations, underpinned the broad rally in equities. Europe (+32%) shone brightly, with most markets in the region - large and small - registering solid, index-beating gains. Another bright spot was Japan, which, despite a struggling yen and taking a second-half breather, posted a 34% result for the full year. The U.S. - by far the index's biggest constituent - also outperformed the global market with a roughly 28% advance. Meanwhile, Asia-Pacific ex Japan (+14%) lagged, hurt in part by a slowdown in Australia's mining industry as well as currency headwinds. Foreign-exchange and commodity weakness also curbed results in resource-heavy Canada and emerging markets (EM), both of which were up 7%. Country-level EM performance diverged meaningfully for the period, as evidenced by performance in Brazil (-1%), Russia (+12%), India (+1%) and China (+8%).
Comments from Alex Zavratsky, Portfolio Manager of Fidelity Advisor® International Value Fund: For the year, the fund's Institutional Class shares rose 25.64%, trailing the 27.95% gain of the benchmark MSCI® EAFE® Value Index. The fund performed relatively well through the first half of the reporting period when investors generally gravitated towards the high-quality, steady compounders I seek. However, performance took a turn during the second half - specifically in the third quarter - when investors became more bullish on the European recovery. Versus the index, it hurt to largely avoid Germany-based Daimler - the world's third-largest luxury automobile manufacturer. Daimler's stock rose 85% during the past year amid an improving economic environment in Europe. Daimler was not held at period end. By contrast, a non-index investment in Japan-based SoftBank was a winner. The Internet and telecom-services provider saw significant growth during the period. In June, SoftBank completed its protracted takeover of telecom giant Sprint, the U.S.'s third-largest mobile carrier, and sported two consecutive quarters of better-than-expected financial results in the second half of the period. Additionally, the firm stands to benefit from the planned initial public offering of Alibaba, China's - and the world's - biggest Internet retailer, which is about 37% owned by SoftBank.
The views expressed above reflect those of the portfolio manager(s) only through the end of the period as stated on the cover of this report and do not necessarily represent the views of Fidelity or any other person in the Fidelity organization. Any such views are subject to change at any time based upon market or other conditions and Fidelity disclaims any responsibility to update such views. These views may not be relied on as investment advice and, because investment decisions for a Fidelity fund are based on numerous factors, may not be relied on as an indication of trading intent on behalf of any Fidelity fund.
Annual Report
Shareholder Expense Example
As a shareholder of the Fund, you incur two types of costs: (1) transaction costs, including sales charges (loads) on purchase payments or redemption proceeds, redemption fees and (2) ongoing costs, including management fees, distribution and/or service (12b-1) fees and other Fund expenses. This Example is intended to help you understand your ongoing costs (in dollars) of investing in the Fund and to compare these costs with the ongoing costs of investing in other mutual funds.
The Example is based on an investment of $1,000 invested at the beginning of the period and held for the entire period (May 1, 2013 to October 31, 2013).
Actual Expenses
The first line of the accompanying table for each class of the Fund provides information about actual account values and actual expenses. You may use the information in this line, together with the amount you invested, to estimate the expenses that you paid over the period. Simply divide your account value by $1,000.00 (for example, an $8,600 account value divided by $1,000.00 = 8.6), then multiply the result by the number in the first line for a class of the Fund under the heading entitled "Expenses Paid During Period" to estimate the expenses you paid on your account during this period. A small balance maintenance fee of $12.00 that is charged once a year may apply for certain accounts with a value of less than $2,000. This fee is not included in the table below. If it was, the estimate of expenses you paid during the period would be higher, and your ending account value lower, by this amount. In addition, the Fund, as a shareholder in the underlying Fidelity Central Funds, will indirectly bear its pro-rata share of the fees and expenses incurred by the underlying Fidelity Central Funds. These fees and expenses are not included in the Fund's annualized expense ratio used to calculate the expense estimate in the table below.
Hypothetical Example for Comparison Purposes
The second line of the accompanying table for each class of the Fund provides information about hypothetical account values and hypothetical expenses based on a Class' actual expense ratio and an assumed rate of return of 5% per year before expenses, which is not the Class' actual return. The hypothetical account values and expenses may not be used to estimate the actual ending account balance or expenses you paid for the period. You may use this information to compare the ongoing costs of investing in the Fund and other funds. To do so, compare this 5% hypothetical example with the 5% hypothetical examples that appear in the shareholder reports of the other funds. A small balance maintenance fee of $12.00 that is charged once a year may apply for certain accounts with a value of less than $2,000. This fee is not included in the table below. If it was, the estimate of expenses you paid during the period would be higher, and your ending account value lower, by this amount. In addition, the Fund, as a shareholder in the underlying Fidelity Central Funds, will indirectly bear its pro-rata share of the fees and expenses incurred by the underlying Fidelity Central Funds. These fees and expenses are not included in the Fund's annualized expense ratio used to calculate the expense estimate in the table below.
Please note that the expenses shown in the table are meant to highlight your ongoing costs only and do not reflect any transaction costs. Therefore, the second line of the table is useful in comparing ongoing costs only, and will not help you determine the relative total costs of owning different funds. In addition, if these transactional costs were included, your costs would have been higher.
Annual Report
Shareholder Expense Example - continued
| Annualized
Expense Ratio B | Beginning
Account Value
May 1, 2013 | Ending
Account Value
October 31, 2013 | Expenses Paid
During Period*
May 1, 2013
to October 31, 2013 |
Class A | 1.37% | | | |
Actual | | $ 1,000.00 | $ 1,066.70 | $ 7.14 |
HypotheticalA | | $ 1,000.00 | $ 1,018.30 | $ 6.97 |
Class T | 1.64% | | | |
Actual | | $ 1,000.00 | $ 1,065.60 | $ 8.54 |
HypotheticalA | | $ 1,000.00 | $ 1,016.94 | $ 8.34 |
Class B | 2.12% | | | |
Actual | | $ 1,000.00 | $ 1,062.70 | $ 11.02 |
HypotheticalA | | $ 1,000.00 | $ 1,014.52 | $ 10.76 |
Class C | 2.12% | | | |
Actual | | $ 1,000.00 | $ 1,061.80 | $ 11.02 |
HypotheticalA | | $ 1,000.00 | $ 1,014.52 | $ 10.76 |
International Value | 1.03% | | | |
Actual | | $ 1,000.00 | $ 1,069.10 | $ 5.37 |
HypotheticalA | | $ 1,000.00 | $ 1,020.01 | $ 5.24 |
Institutional Class | 1.03% | | | |
Actual | | $ 1,000.00 | $ 1,069.00 | $ 5.37 |
HypotheticalA | | $ 1,000.00 | $ 1,020.01 | $ 5.24 |
A 5% return per year before expenses
B Annualized expense ratio reflects expenses net of applicable fee waivers.
* Expenses are equal to each Class' annualized expense ratio, multiplied by the average account value over the period, multiplied by 184/365 (to reflect the one-half year period).
Annual Report
Investment Changes (Unaudited)
Geographic Diversification (% of fund's net assets) |
As of October 31, 2013 |
 | United Kingdom 24.7% | |
 | Japan 19.0% | |
 | France 15.6% | |
 | Germany 9.1% | |
 | Australia 6.8% | |
 | Switzerland 5.7% | |
 | Netherlands 3.2% | |
 | Spain 3.1% | |
 | United States of America* 2.6% | |
 | Other 10.2% | |

* Includes short-term investments and net other assets (liabilities) |
Percentages are based on country or territory of incorporation and are adjusted for the effect of futures contracts, if applicable. |
As of April 30, 2013 |
| United Kingdom 26.6% | |
| Japan 19.2% | |
| Germany 8.9% | |
| Switzerland 8.6% | |
| Australia 8.3% | |
| France 7.8% | |
| Singapore 3.3% | |
| Spain 2.8% | |
| Netherlands 2.4% | |
| Other* 12.1% | |

* Includes short-term investments and net other assets (liabilities) |
Percentages are based on country or territory of incorporation and are adjusted for the effect of futures contracts, if applicable. |
Asset Allocation as of October 31, 2013 |
| % of fund's
net assets | % of fund's net assets
6 months ago |
Stocks | 98.2 | 97.9 |
Short-Term Investments and Net Other Assets (Liabilities) | 1.8 | 2.1 |
Top Ten Stocks as of October 31, 2013 |
| % of fund's
net assets | % of fund's net assets
6 months ago |
HSBC Holdings PLC sponsored ADR (United Kingdom, Commercial Banks) | 3.7 | 3.6 |
Total SA (France, Oil, Gas & Consumable Fuels) | 3.6 | 0.0 |
Sanofi SA (France, Pharmaceuticals) | 3.4 | 3.7 |
Vodafone Group PLC sponsored ADR (United Kingdom, Wireless Telecommunication Services) | 3.4 | 3.2 |
Royal Dutch Shell PLC Class A sponsored ADR (United Kingdom, Oil, Gas & Consumable Fuels) | 2.6 | 4.0 |
Australia & New Zealand Banking Group Ltd. (Australia, Commercial Banks) | 2.3 | 2.4 |
Westpac Banking Corp. (Australia, Commercial Banks) | 2.2 | 2.7 |
Sumitomo Mitsui Financial Group, Inc. (Japan, Commercial Banks) | 2.2 | 2.5 |
BNP Paribas SA (France, Commercial Banks) | 1.9 | 1.6 |
BASF AG (Germany, Chemicals) | 1.9 | 0.5 |
| 27.2 | |
Market Sectors as of October 31, 2013 |
| % of fund's
net assets | % of fund's net assets
6 months ago |
Financials | 31.7 | 34.8 |
Health Care | 10.7 | 12.1 |
Consumer Discretionary | 10.2 | 8.6 |
Telecommunication Services | 10.2 | 8.5 |
Industrials | 9.2 | 6.3 |
Materials | 7.1 | 6.0 |
Energy | 6.9 | 7.7 |
Consumer Staples | 6.3 | 6.2 |
Information Technology | 3.3 | 2.3 |
Utilities | 2.6 | 5.4 |
Annual Report
Investments October 31, 2013
Showing Percentage of Net Assets
Common Stocks - 96.7% |
| Shares | | Value |
Australia - 6.8% |
Ansell Ltd. | 47,969 | | $ 883,636 |
Australia & New Zealand Banking Group Ltd. | 139,122 | | 4,449,661 |
Telstra Corp. Ltd. | 331,729 | | 1,624,104 |
Transurban Group unit | 143,240 | | 961,221 |
Westfield Group unit | 98,459 | | 1,006,893 |
Westpac Banking Corp. | 135,554 | | 4,393,196 |
TOTAL AUSTRALIA | | 13,318,711 |
Bailiwick of Guernsey - 0.1% |
Resolution Ltd. | 43,079 | | 246,866 |
Bailiwick of Jersey - 1.0% |
Informa PLC | 105,010 | | 942,047 |
Wolseley PLC | 18,760 | | 1,010,982 |
TOTAL BAILIWICK OF JERSEY | | 1,953,029 |
Belgium - 1.3% |
Anheuser-Busch InBev SA NV | 7,400 | | 767,112 |
KBC Groupe SA | 16,551 | | 902,256 |
UCB SA | 11,800 | | 775,759 |
TOTAL BELGIUM | | 2,445,127 |
Bermuda - 0.4% |
Hongkong Land Holdings Ltd. | 129,000 | | 794,640 |
Denmark - 0.6% |
A.P. Moller - Maersk A/S Series B | 126 | | 1,219,114 |
Finland - 1.4% |
Nokia Corp. (a) | 114,033 | | 866,741 |
Sampo Oyj (A Shares) | 40,034 | | 1,896,487 |
TOTAL FINLAND | | 2,763,228 |
France - 15.6% |
Arkema SA | 10,899 | | 1,237,419 |
Atos Origin SA | 15,318 | | 1,307,779 |
BNP Paribas SA | 51,004 | | 3,776,932 |
Cap Gemini SA | 16,693 | | 1,098,115 |
Carrefour SA | 40,136 | | 1,470,266 |
GDF Suez | 78,307 | | 1,949,933 |
Havas SA | 106,875 | | 890,392 |
Kering SA | 4,642 | | 1,054,753 |
Renault SA | 16,119 | | 1,411,838 |
Sanofi SA | 61,770 | | 6,586,117 |
Schneider Electric SA | 7,135 | | 601,112 |
Common Stocks - continued |
| Shares | | Value |
France - continued |
Total SA | 114,528 | | $ 7,026,634 |
Vivendi SA | 81,096 | | 2,058,471 |
TOTAL FRANCE | | 30,469,761 |
Germany - 7.6% |
Allianz SE | 17,093 | | 2,875,474 |
BASF AG | 36,013 | | 3,746,950 |
Bayer AG | 18,190 | | 2,260,807 |
Deutsche Post AG | 53,459 | | 1,809,155 |
Fresenius SE & Co. KGaA | 8,300 | | 1,078,812 |
HeidelbergCement Finance AG | 13,939 | | 1,098,825 |
Siemens AG | 15,408 | | 1,969,024 |
TOTAL GERMANY | | 14,839,047 |
Hong Kong - 0.9% |
Hysan Development Co. Ltd. | 210,000 | | 981,878 |
Wing Hang Bank Ltd. | 57,265 | | 814,695 |
TOTAL HONG KONG | | 1,796,573 |
Italy - 0.2% |
Unione di Banche Italiane ScpA | 68,032 | | 471,089 |
Japan - 19.0% |
AEON Financial Service Co. Ltd. | 13,400 | | 411,517 |
AEON Mall Co. Ltd. | 19,900 | | 565,179 |
Air Water, Inc. | 40,000 | | 571,771 |
Astellas Pharma, Inc. | 17,500 | | 975,562 |
Daikin Industries Ltd. | 13,900 | | 799,714 |
DENSO Corp. | 15,500 | | 745,060 |
Dentsu, Inc. | 20,900 | | 789,648 |
East Japan Railway Co. | 9,600 | | 833,959 |
Hoya Corp. | 53,200 | | 1,275,702 |
Isuzu Motors Ltd. | 124,000 | | 772,220 |
Itochu Corp. | 99,200 | | 1,192,795 |
Japan Exchange Group, Inc. | 23,800 | | 553,306 |
Japan Tobacco, Inc. | 43,400 | | 1,570,372 |
JFE Holdings, Inc. | 40,000 | | 909,388 |
JTEKT Corp. | 61,700 | | 792,122 |
Kansai Electric Power Co., Inc. (a) | 61,200 | | 774,610 |
KDDI Corp. | 32,300 | | 1,749,255 |
Leopalace21 Corp. (a) | 46,800 | | 324,909 |
Mitsubishi Electric Corp. | 95,000 | | 1,044,237 |
MS&AD Insurance Group Holdings, Inc. | 43,000 | | 1,111,866 |
Common Stocks - continued |
| Shares | | Value |
Japan - continued |
Nippon Telegraph & Telephone Corp. | 28,300 | | $ 1,471,043 |
Omron Corp. | 21,900 | | 835,731 |
ORIX Corp. | 102,000 | | 1,766,751 |
Santen Pharmaceutical Co. Ltd. | 18,600 | | 944,243 |
Seven & i Holdings Co., Ltd. | 36,200 | | 1,339,713 |
Seven Bank Ltd. | 168,100 | | 594,949 |
Shinsei Bank Ltd. | 355,000 | | 831,164 |
SoftBank Corp. | 14,900 | | 1,112,716 |
Sumitomo Corp. | 82,000 | | 1,067,091 |
Sumitomo Mitsui Financial Group, Inc. | 89,100 | | 4,306,728 |
Sumitomo Mitsui Trust Holdings, Inc. | 287,000 | | 1,417,518 |
Tokyo Tatemono Co. Ltd. | 71,000 | | 666,548 |
Toyota Motor Corp. | 34,100 | | 2,210,982 |
USS Co. Ltd. | 54,100 | | 792,267 |
TOTAL JAPAN | | 37,120,636 |
Netherlands - 3.2% |
AEGON NV | 77,771 | | 618,815 |
ING Groep NV (Certificaten Van Aandelen) (a) | 103,600 | | 1,316,520 |
Koninklijke Philips Electronics NV | 58,871 | | 2,080,544 |
Royal DSM NV | 16,756 | | 1,269,248 |
Unilever NV (Certificaten Van Aandelen) (Bearer) | 23,931 | | 948,756 |
TOTAL NETHERLANDS | | 6,233,883 |
Norway - 1.1% |
Telenor ASA | 86,977 | | 2,089,301 |
Singapore - 1.7% |
Singapore Telecommunications Ltd. | 604,000 | | 1,837,965 |
United Overseas Bank Ltd. | 89,480 | | 1,501,178 |
TOTAL SINGAPORE | | 3,339,143 |
Spain - 3.1% |
Amadeus IT Holding SA Class A | 25,469 | | 945,778 |
Banco Bilbao Vizcaya Argentaria SA sponsored ADR | 258,286 | | 3,016,780 |
International Consolidated Airlines Group SA CDI (a) | 131,800 | | 735,211 |
Repsol YPF SA | 51,172 | | 1,374,290 |
TOTAL SPAIN | | 6,072,059 |
Sweden - 1.5% |
Svenska Cellulosa AB (SCA) (B Shares) | 36,665 | | 1,041,097 |
Svenska Handelsbanken AB (A Shares) | 40,733 | | 1,845,543 |
TOTAL SWEDEN | | 2,886,640 |
Common Stocks - continued |
| Shares | | Value |
Switzerland - 5.7% |
Novartis AG | 47,615 | | $ 3,695,999 |
Roche Holding AG (participation certificate) | 5,519 | | 1,527,936 |
Swiss Re Ltd. | 25,690 | | 2,256,564 |
Syngenta AG (Switzerland) | 3,374 | | 1,361,803 |
UBS AG (NY Shares) | 119,658 | | 2,316,579 |
TOTAL SWITZERLAND | | 11,158,881 |
United Kingdom - 24.7% |
Barclays PLC | 710,298 | | 2,988,555 |
BHP Billiton PLC | 103,607 | | 3,197,156 |
British American Tobacco PLC (United Kingdom) | 23,760 | | 1,310,893 |
BT Group PLC | 188,458 | | 1,140,290 |
Bunzl PLC | 57,725 | | 1,274,500 |
Compass Group PLC | 99,686 | | 1,433,734 |
GlaxoSmithKline PLC sponsored ADR | 18,675 | | 982,865 |
HSBC Holdings PLC sponsored ADR | 130,948 | | 7,207,381 |
Imperial Tobacco Group PLC | 54,799 | | 2,046,369 |
ITV PLC | 460,796 | | 1,410,446 |
Kingfisher PLC | 228,068 | | 1,380,458 |
Legal & General Group PLC | 607,012 | | 2,105,211 |
National Grid PLC | 188,558 | | 2,369,563 |
Next PLC | 11,900 | | 1,038,931 |
Prudential PLC | 89,236 | | 1,824,944 |
Reed Elsevier PLC | 111,611 | | 1,564,085 |
Rolls-Royce Group PLC | 42,200 | | 778,130 |
Royal Dutch Shell PLC Class A sponsored ADR | 77,296 | | 5,152,551 |
Taylor Wimpey PLC | 405,828 | | 717,076 |
Tesco PLC | 320,338 | | 1,870,640 |
Vodafone Group PLC sponsored ADR | 177,808 | | 6,546,891 |
TOTAL UNITED KINGDOM | | 48,340,669 |
United States of America - 0.8% |
AbbVie, Inc. | 23,011 | | 1,114,883 |
Cabot Corp. | 11,470 | | 534,617 |
TOTAL UNITED STATES OF AMERICA | | 1,649,500 |
TOTAL COMMON STOCKS (Cost $164,698,583) |
189,207,897
|
Nonconvertible Preferred Stocks - 1.5% |
| Shares | | Value |
Germany - 1.5% |
Volkswagen AG
(Cost $2,345,243) | 11,381 | | $ 2,892,718 |
Money Market Funds - 1.8% |
| | | |
Fidelity Cash Central Fund, 0.09% (b)
(Cost $3,487,195) | 3,487,195 | |
3,487,195
|
TOTAL INVESTMENT PORTFOLIO - 100.0% (Cost $170,531,021) | | 195,587,810 |
NET OTHER ASSETS (LIABILITIES) - 0.0% | | 77,461 |
NET ASSETS - 100% | $ 195,665,271 |
Legend |
(a) Non-income producing |
(b) Affiliated fund that is generally available only to investment companies and other accounts managed by Fidelity Investments. The rate quoted is the annualized seven-day yield of the fund at period end. A complete unaudited listing of the fund's holdings as of its most recent quarter end is available upon request. In addition, each Fidelity Central Fund's financial statements, which are not covered by the Fund's Report of Independent Registered Public Accounting Firm, are available on the SEC's website or upon request. |
Affiliated Central Funds |
Information regarding fiscal year to date income earned by the Fund from investments in Fidelity Central Funds is as follows: |
Fund | Income earned |
Fidelity Cash Central Fund | $ 2,240 |
Fidelity Securities Lending Cash Central Fund | 158,210 |
Total | $ 160,450 |
Other Information |
Categorizations in the Schedule of Investments are based on country or territory of incorporation. |
The following is a summary of the inputs used, as of October 31, 2013, involving the Fund's assets and liabilities carried at fair value. The inputs or methodology used for valuing securities may not be an indication of the risk associated with investing in those securities. For more information on valuation inputs, and their aggregation into the levels used in the tables below, please refer to the Investment Valuation section in the accompanying Notes to Financial Statements. |
Valuation Inputs at Reporting Date: |
Description | Total | Level 1 | Level 2 | Level 3 |
Investments in Securities: | | | | |
Equities: | | | | |
Consumer Discretionary | $ 20,046,655 | $ 14,736,478 | $ 5,310,177 | $ - |
Consumer Staples | 12,365,218 | 6,428,372 | 5,936,846 | - |
Energy | 13,553,475 | 6,526,841 | 7,026,634 | - |
Financials | 62,158,572 | 42,859,303 | 19,299,269 | - |
Health Care | 20,826,619 | 8,624,698 | 12,201,921 | - |
Industrials | 18,168,911 | 8,389,425 | 9,779,486 | - |
Information Technology | 6,329,846 | 3,351,672 | 2,978,174 | - |
Materials | 13,927,177 | 7,887,059 | 6,040,118 | - |
Telecommunication Services | 19,630,036 | 14,156,732 | 5,473,304 | - |
Utilities | 5,094,106 | 1,949,933 | 3,144,173 | - |
Money Market Funds | 3,487,195 | 3,487,195 | - | - |
Total Investments in Securities: | $ 195,587,810 | $ 118,397,708 | $ 77,190,102 | $ - |
The following is a summary of transfers between Level 1 and Level 2 for the period ended October 31, 2013. Transfers are assumed to have occurred at the beginning of the period, and are primarily attributable to the valuation techniques used for foreign equity securities, as discussed in the accompanying Notes to Financial Statements: |
Transfers | Total |
Level 1 to Level 2 | $ 11,626,467 |
Level 2 to Level 1 | $ 0 |
See accompanying notes which are an integral part of the financial statements.
Annual Report
Statement of Assets and Liabilities
| October 31, 2013 |
| | |
Assets | | |
Investment in securities, at value - See accompanying schedule: Unaffiliated issuers (cost $167,043,826) | $ 192,100,615 | |
Fidelity Central Funds (cost $3,487,195) | 3,487,195 | |
Total Investments (cost $170,531,021) | | $ 195,587,810 |
Receivable for investments sold | | 945,289 |
Receivable for fund shares sold | | 73,339 |
Dividends receivable | | 654,419 |
Distributions receivable from Fidelity Central Funds | | 351 |
Prepaid expenses | | 630 |
Other receivables | | 10,543 |
Total assets | | 197,272,381 |
| | |
Liabilities | | |
Payable for investments purchased | $ 1,230,443 | |
Payable for fund shares redeemed | 157,688 | |
Accrued management fee | 94,900 | |
Distribution and service plan fees payable | 6,010 | |
Other affiliated payables | 40,392 | |
Other payables and accrued expenses | 77,677 | |
Total liabilities | | 1,607,110 |
| | |
Net Assets | | $ 195,665,271 |
Net Assets consist of: | | |
Paid in capital | | $ 282,926,219 |
Undistributed net investment income | | 3,680,675 |
Accumulated undistributed net realized gain (loss) on investments and foreign currency transactions | | (116,002,753) |
Net unrealized appreciation (depreciation) on investments and assets and liabilities in foreign currencies | | 25,061,130 |
Net Assets | | $ 195,665,271 |
See accompanying notes which are an integral part of the financial statements.
Annual Report
Financial Statements - continued
Statement of Assets and Liabilities - continued
| October 31, 2013 |
| | |
Calculation of Maximum Offering Price Class A:
Net Asset Value and redemption price per share ($6,190,531 ÷ 690,803 shares) | | $ 8.96 |
| | |
Maximum offering price per share (100/94.25 of $8.96) | | $ 9.51 |
Class T:
Net Asset Value and redemption price per share ($3,757,790 ÷ 420,208 shares) | | $ 8.94 |
| | |
Maximum offering price per share (100/96.50 of $8.94) | | $ 9.26 |
Class B:
Net Asset Value and offering price per share ($678,055 ÷ 75,490 shares)A | | $ 8.98 |
| | |
Class C:
Net Asset Value and offering price per share ($3,231,305 ÷ 361,660 shares)A | | $ 8.93 |
| | |
International Value:
Net Asset Value, offering price and redemption price per share ($181,568,150 ÷ 20,236,094 shares) | | $ 8.97 |
| | |
Institutional Class:
Net Asset Value, offering price and redemption price per share ($239,440 ÷ 26,656 shares) | | $ 8.98 |
A Redemption price per share is equal to net asset value less any applicable contingent deferred sales charge.
See accompanying notes which are an integral part of the financial statements.
Annual Report
Statement of Operations
| Year ended October 31, 2013 |
| | |
Investment Income | | |
Dividends | | $ 5,981,397 |
Income from Fidelity Central Funds | | 160,450 |
Income before foreign taxes withheld | | 6,141,847 |
Less foreign taxes withheld | | (388,783) |
Total income | | 5,753,064 |
| | |
Expenses | | |
Management fee
Basic fee | $ 1,176,503 | |
Performance adjustment | (93,277) | |
Transfer agent fees | 370,369 | |
Distribution and service plan fees | 62,780 | |
Accounting and security lending fees | 87,132 | |
Custodian fees and expenses | 93,872 | |
Independent trustees' compensation | 929 | |
Registration fees | 74,322 | |
Audit | 62,420 | |
Legal | 395 | |
Miscellaneous | 1,091 | |
Total expenses before reductions | 1,836,536 | |
Expense reductions | (47,772) | 1,788,764 |
Net investment income (loss) | | 3,964,300 |
Realized and Unrealized Gain (Loss) Net realized gain (loss) on: | | |
Investment securities: | | |
Unaffiliated issuers | 9,459,633 | |
Foreign currency transactions | (62,042) | |
Total net realized gain (loss) | | 9,397,591 |
Change in net unrealized appreciation (depreciation) on: Investment securities | 23,778,218 | |
Assets and liabilities in foreign currencies | 13,304 | |
Total change in net unrealized appreciation (depreciation) | | 23,791,522 |
Net gain (loss) | | 33,189,113 |
Net increase (decrease) in net assets resulting from operations | | $ 37,153,413 |
See accompanying notes which are an integral part of the financial statements.
Annual Report
Financial Statements - continued
Statement of Changes in Net Assets
| Year ended
October 31,
2013 | Year ended
October 31,
2012 |
Increase (Decrease) in Net Assets | | |
Operations | | |
Net investment income (loss) | $ 3,964,300 | $ 4,504,170 |
Net realized gain (loss) | 9,397,591 | (6,022,570) |
Change in net unrealized appreciation (depreciation) | 23,791,522 | 12,827,702 |
Net increase (decrease) in net assets resulting
from operations | 37,153,413 | 11,309,302 |
Distributions to shareholders from net investment income | (4,120,600) | (5,463,877) |
Distributions to shareholders from net realized gain | (786,952) | - |
Total distributions | (4,907,552) | (5,463,877) |
Share transactions - net increase (decrease) | 23,938,130 | (27,953,937) |
Redemption fees | 3,144 | 2,109 |
Total increase (decrease) in net assets | 56,187,135 | (22,106,403) |
| | |
Net Assets | | |
Beginning of period | 139,478,136 | 161,584,539 |
End of period (including undistributed net investment income of $3,680,675 and undistributed net investment income of $3,836,975, respectively) | $ 195,665,271 | $ 139,478,136 |
See accompanying notes which are an integral part of the financial statements.
Annual Report
Financial Highlights - Class A
Years ended October 31, | 2013 | 2012 | 2011 | 2010 | 2009 |
Selected Per-Share Data | | | | | |
Net asset value, beginning of period | $ 7.39 | $ 7.02 | $ 8.22 | $ 7.75 | $ 5.93 |
Income from Investment Operations | | | | | |
Net investment income (loss) C | .17 | .20 | .22 | .15 | .12 |
Net realized and unrealized gain (loss) | 1.64 | .39 | (1.19) | .44 | 1.78 |
Total from investment operations | 1.81 | .59 | (.97) | .59 | 1.90 |
Distributions from net investment income | (.20) | (.22) | (.19) | (.11) | (.08) |
Distributions from net realized gain | (.04) | - | (.03) | (.01) | - |
Total distributions | (.24) | (.22) | (.23) H | (.12) | (.08) |
Redemption fees added to paid in capital C, G | - | - | - | - | - |
Net asset value, end of period | $ 8.96 | $ 7.39 | $ 7.02 | $ 8.22 | $ 7.75 |
Total Return A, B | 25.24% | 8.82% | (12.19)% | 7.60% | 32.71% |
Ratios to Average Net Assets D, F | | | | | |
Expenses before reductions | 1.39% | 1.44% | 1.36% | 1.40% | 1.34% |
Expenses net of fee waivers, if any | 1.39% | 1.44% | 1.36% | 1.40% | 1.34% |
Expenses net of all reductions | 1.36% | 1.41% | 1.34% | 1.38% | 1.32% |
Net investment income (loss) | 2.08% | 2.85% | 2.79% | 1.93% | 1.86% |
Supplemental Data | | | | | |
Net assets, end of period (000 omitted) | $ 6,191 | $ 4,491 | $ 4,668 | $ 4,699 | $ 4,456 |
Portfolio turnover rate E | 79% | 74% | 83% | 43% | 46% |
A Total returns would have been lower if certain expenses had not been reduced during the applicable periods shown.
B Total returns do not include the effect of the sales charges.
C Calculated based on average shares outstanding during the period.
D Fees and expenses of any underlying Fidelity Central Funds are not included in the Fund's expense ratio. The Fund indirectly bears its proportionate share of the expenses of any underlying Fidelity Central Funds.
E Amount does not include the portfolio activity of any underlying Fidelity Central Funds.
F Expense ratios reflect operating expenses of the class. Expenses before reductions do not reflect amounts reimbursed by the investment adviser or reductions from brokerage service arrangements or reductions from other expense offset arrangements and do not represent the amount paid by the class during periods when reimbursements or reductions occur. Expenses net of fee waivers reflect expenses after reimbursement by the investment adviser but prior to reductions from brokerage service arrangements or other expense offset arrangements. Expenses net of all reductions represent the net expenses paid by the class.
G Amount represents less than $.01 per share.
H Total distributions of $.23 per share is comprised of distributions from net investment income of $.191 and distributions from net realized gain of $.034 per share.
See accompanying notes which are an integral part of the financial statements.
Annual Report
Financial Highlights - Class T
Years ended October 31, | 2013 | 2012 | 2011 | 2010 | 2009 |
Selected Per-Share Data | | | | | |
Net asset value, beginning of period | $ 7.38 | $ 7.00 | $ 8.20 | $ 7.73 | $ 5.91 |
Income from Investment Operations | | | | | |
Net investment income (loss) C | .15 | .18 | .20 | .13 | .10 |
Net realized and unrealized gain (loss) | 1.64 | .40 | (1.19) | .44 | 1.77 |
Total from investment operations | 1.79 | .58 | (.99) | .57 | 1.87 |
Distributions from net investment income | (.19) | (.20) | (.17) | (.09) | (.05) |
Distributions from net realized gain | (.04) | - | (.03) | (.01) | - |
Total distributions | (.23) | (.20) | (.21) H | (.10) | (.05) |
Redemption fees added to paid in capital C, G | - | - | - | - | - |
Net asset value, end of period | $ 8.94 | $ 7.38 | $ 7.00 | $ 8.20 | $ 7.73 |
Total Return A, B | 24.86% | 8.60% | (12.42)% | 7.32% | 32.14% |
Ratios to Average Net Assets D, F | | | | | |
Expenses before reductions | 1.66% | 1.71% | 1.63% | 1.67% | 1.60% |
Expenses net of fee waivers, if any | 1.65% | 1.70% | 1.62% | 1.67% | 1.60% |
Expenses net of all reductions | 1.63% | 1.67% | 1.60% | 1.65% | 1.59% |
Net investment income (loss) | 1.81% | 2.58% | 2.52% | 1.65% | 1.59% |
Supplemental Data | | | | | |
Net assets, end of period (000 omitted) | $ 3,758 | $ 2,693 | $ 2,468 | $ 2,276 | $ 2,395 |
Portfolio turnover rate E | 79% | 74% | 83% | 43% | 46% |
A Total returns would have been lower if certain expenses had not been reduced during the applicable periods shown.
B Total returns do not include the effect of the sales charges.
C Calculated based on average shares outstanding during the period.
D Fees and expenses of any underlying Fidelity Central Funds are not included in the Fund's expense ratio. The Fund indirectly bears its proportionate share of the expenses of any underlying Fidelity Central Funds.
E Amount does not include the portfolio activity of any underlying Fidelity Central Funds.
F Expense ratios reflect operating expenses of the class. Expenses before reductions do not reflect amounts reimbursed by the investment adviser or reductions from brokerage service arrangements or reductions from other expense offset arrangements and do not represent the amount paid by the class during periods when reimbursements or reductions occur. Expenses net of fee waivers reflect expenses after reimbursement by the investment adviser but prior to reductions from brokerage service arrangements or other expense offset arrangements. Expenses net of all reductions represent the net expenses paid by the class.
G Amount represents less than $.01 per share.
H Total distributions of $.21 per share is comprised of distributions from net investment income of $.173 and distributions from net realized gain of $.034 per share.
See accompanying notes which are an integral part of the financial statements.
Annual Report
Financial Highlights - Class B
Years ended October 31, | 2013 | 2012 | 2011 | 2010 | 2009 |
Selected Per-Share Data | | | | | |
Net asset value, beginning of period | $ 7.39 | $ 7.00 | $ 8.20 | $ 7.74 | $ 5.88 |
Income from Investment Operations | | | | | |
Net investment income (loss) C | .11 | .14 | .17 | .09 | .07 |
Net realized and unrealized gain (loss) | 1.65 | .41 | (1.20) | .44 | 1.79 |
Total from investment operations | 1.76 | .55 | (1.03) | .53 | 1.86 |
Distributions from net investment income | (.13) | (.16) | (.13) | (.06) | - |
Distributions from net realized gain | (.04) | - | (.03) | (.01) | - |
Total distributions | (.17) | (.16) | (.17) H | (.07) | - |
Redemption fees added to paid in capital C, G | - | - | - | - | - |
Net asset value, end of period | $ 8.98 | $ 7.39 | $ 7.00 | $ 8.20 | $ 7.74 |
Total Return A, B | 24.30% | 8.07% | (12.88)% | 6.82% | 31.63% |
Ratios to Average Net Assets D, F | | | | | |
Expenses before reductions | 2.14% | 2.19% | 2.11% | 2.15% | 2.08% |
Expenses net of fee waivers, if any | 2.14% | 2.19% | 2.11% | 2.15% | 2.08% |
Expenses net of all reductions | 2.11% | 2.16% | 2.09% | 2.13% | 2.07% |
Net investment income (loss) | 1.32% | 2.09% | 2.04% | 1.18% | 1.11% |
Supplemental Data | | | | | |
Net assets, end of period (000 omitted) | $ 678 | $ 691 | $ 901 | $ 1,216 | $ 1,076 |
Portfolio turnover rate E | 79% | 74% | 83% | 43% | 46% |
A Total returns would have been lower if certain expenses had not been reduced during the applicable periods shown.
B Total returns do not include the effect of the contingent deferred sales charge.
C Calculated based on average shares outstanding during the period.
D Fees and expenses of any underlying Fidelity Central Funds are not included in the Fund's expense ratio. The Fund indirectly bears its proportionate share of the expenses of any underlying Fidelity Central Funds.
E Amount does not include the portfolio activity of any underlying Fidelity Central Funds.
F Expense ratios reflect operating expenses of the class. Expenses before reductions do not reflect amounts reimbursed by the investment adviser or reductions from brokerage service arrangements or reductions from other expense offset arrangements and do not represent the amount paid by the class during periods when reimbursements or reductions occur. Expenses net of fee waivers reflect expenses after reimbursement by the investment adviser but prior to reductions from brokerage service arrangements or other expense offset arrangements. Expenses net of all reductions represent the net expenses paid by the class.
G Amount represents less than $.01 per share.
H Total distributions of $.17 per share is comprised of distributions from net investment income of $.131 and distributions from net realized gain of $.034 per share.
See accompanying notes which are an integral part of the financial statements.
Annual Report
Financial Highlights - Class C
Years ended October 31, | 2013 | 2012 | 2011 | 2010 | 2009 |
Selected Per-Share Data | | | | | |
Net asset value, beginning of period | $ 7.38 | $ 7.00 | $ 8.20 | $ 7.73 | $ 5.88 |
Income from Investment Operations | | | | | |
Net investment income (loss) C | .11 | .14 | .16 | .09 | .07 |
Net realized and unrealized gain (loss) | 1.63 | .41 | (1.19) | .44 | 1.78 |
Total from investment operations | 1.74 | .55 | (1.03) | .53 | 1.85 |
Distributions from net investment income | (.15) | (.17) | (.14) | (.05) | - |
Distributions from net realized gain | (.04) | - | (.03) | (.01) | - |
Total distributions | (.19) | (.17) | (.17) | (.06) | - |
Redemption fees added to paid in capital C, G | - | - | - | - | - |
Net asset value, end of period | $ 8.93 | $ 7.38 | $ 7.00 | $ 8.20 | $ 7.73 |
Total Return A, B | 24.17% | 8.12% | (12.84)% | 6.84% | 31.46% |
Ratios to Average Net Assets D, F | | | | | |
Expenses before reductions | 2.14% | 2.19% | 2.12% | 2.15% | 2.08% |
Expenses net of fee waivers, if any | 2.14% | 2.19% | 2.11% | 2.15% | 2.08% |
Expenses net of all reductions | 2.11% | 2.16% | 2.09% | 2.13% | 2.06% |
Net investment income (loss) | 1.33% | 2.09% | 2.04% | 1.18% | 1.12% |
Supplemental Data | | | | | |
Net assets, end of period (000 omitted) | $ 3,231 | $ 2,249 | $ 2,108 | $ 2,123 | $ 2,108 |
Portfolio turnover rate E | 79% | 74% | 83% | 43% | 46% |
A Total returns would have been lower if certain expenses had not been reduced during the applicable periods shown.
B Total returns do not include the effect of the contingent deferred sales charge.
C Calculated based on average shares outstanding during the period.
D Fees and expenses of any underlying Fidelity Central Funds are not included in the Fund's expense ratio. The Fund indirectly bears its proportionate share of the expenses of any underlying Fidelity Central Funds.
E Amount does not include the portfolio activity of any underlying Fidelity Central Funds.
F Expense ratios reflect operating expenses of the class. Expenses before reductions do not reflect amounts reimbursed by the investment adviser or reductions from brokerage service arrangements or reductions from other expense offset arrangements and do not represent the amount paid by the class during periods when reimbursements or reductions occur. Expenses net of fee waivers reflect expenses after reimbursement by the investment adviser but prior to reductions from brokerage service arrangements or other expense offset arrangements. Expenses net of all reductions represent the net expenses paid by the class.
G Amount represents less than $.01 per share.
See accompanying notes which are an integral part of the financial statements.
Annual Report
Financial Highlights - International Value
Years ended October 31, | 2013 | 2012 | 2011 | 2010 | 2009 |
Selected Per-Share Data | | | | | |
Net asset value, beginning of period | $ 7.40 | $ 7.03 | $ 8.23 | $ 7.75 | $ 5.95 |
Income from Investment Operations | | | | | |
Net investment income (loss) B | .19 | .22 | .25 | .17 | .13 |
Net realized and unrealized gain (loss) | 1.65 | .40 | (1.20) | .44 | 1.78 |
Total from investment operations | 1.84 | .62 | (.95) | .61 | 1.91 |
Distributions from net investment income | (.22) | (.25) | (.22) | (.13) | (.11) |
Distributions from net realized gain | (.04) | - | (.03) | (.01) | - |
Total distributions | (.27) H | (.25) | (.25) | (.13) G | (.11) |
Redemption fees added to paid in capital B, F | - | - | - | - | - |
Net asset value, end of period | $ 8.97 | $ 7.40 | $ 7.03 | $ 8.23 | $ 7.75 |
Total Return A | 25.57% | 9.19% | (11.91)% | 7.95% | 33.09% |
Ratios to Average Net Assets C, E | | | | | |
Expenses before reductions | 1.05% | 1.13% | 1.04% | 1.09% | 1.07% |
Expenses net of fee waivers, if any | 1.05% | 1.13% | 1.03% | 1.09% | 1.07% |
Expenses net of all reductions | 1.02% | 1.10% | 1.01% | 1.08% | 1.06% |
Net investment income (loss) | 2.41% | 3.16% | 3.11% | 2.23% | 2.12% |
Supplemental Data | | | | | |
Net assets, end of period (000 omitted) | $ 181,568 | $ 128,983 | $ 150,967 | $ 163,090 | $ 180,447 |
Portfolio turnover rate D | 79% | 74% | 83% | 43% | 46% |
A Total returns would have been lower if certain expenses had not been reduced during the applicable periods shown.
B Calculated based on average shares outstanding during the period.
C Fees and expenses of any underlying Fidelity Central Funds are not included in the Fund's expense ratio. The Fund indirectly bears its proportionate share of the expenses of any underlying Fidelity Central Funds.
D Amount does not include the portfolio activity of any underlying Fidelity Central Funds.
E Expense ratios reflect operating expenses of the class. Expenses before reductions do not reflect amounts reimbursed by the investment adviser or reductions from brokerage service arrangements or reductions from other expense offset arrangements and do not represent the amount paid by the class during periods when reimbursements or reductions occur. Expenses net of fee waivers reflect expenses after reimbursement by the investment adviser but prior to reductions from brokerage service arrangements or other expense offset arrangements. Expenses net of all reductions represent the net expenses paid by the class.
F Amount represents less than $.01 per share.
G Total distributions of $.13 per share is comprised of distributions from net investment income of $.129 and distributions from net realized gain of $.005 per share.
H Total distributions of $.27 per share is comprised of distributions from net investment income of $.223 and distributions from net realized gain of $.042 per share.
See accompanying notes which are an integral part of the financial statements.
Annual Report
Financial Highlights - Institutional Class
Years ended October 31, | 2013 | 2012 | 2011 | 2010 | 2009 |
Selected Per-Share Data | | | | | |
Net asset value, beginning of period | $ 7.41 | $ 7.04 | $ 8.24 | $ 7.76 | $ 5.96 |
Income from Investment Operations | | | | | |
Net investment income (loss) B | .19 | .22 | .25 | .18 | .14 |
Net realized and unrealized gain (loss) | 1.65 | .40 | (1.19) | .44 | 1.78 |
Total from investment operations | 1.84 | .62 | (.94) | .62 | 1.92 |
Distributions from net investment income | (.23) | (.25) | (.22) | (.14) | (.12) |
Distributions from net realized gain | (.04) | - | (.03) | (.01) | - |
Total distributions | (.27) | (.25) | (.26) H | (.14) G | (.12) |
Redemption fees added to paid in capital B, F | - | - | - | - | - |
Net asset value, end of period | $ 8.98 | $ 7.41 | $ 7.04 | $ 8.24 | $ 7.76 |
Total Return A | 25.64% | 9.22% | (11.83)% | 8.05% | 33.06% |
Ratios to Average Net Assets C, E | | | | | |
Expenses before reductions | 1.07% | 1.10% | .98% | .98% | .93% |
Expenses net of fee waivers, if any | 1.07% | 1.10% | .98% | .98% | .93% |
Expenses net of all reductions | 1.04% | 1.07% | .96% | .97% | .92% |
Net investment income (loss) | 2.39% | 3.18% | 3.17% | 2.34% | 2.26% |
Supplemental Data | | | | | |
Net assets, end of period (000 omitted) | $ 239 | $ 372 | $ 473 | $ 519 | $ 814 |
Portfolio turnover rate D | 79% | 74% | 83% | 43% | 46% |
A Total returns would have been lower if certain expenses had not been reduced during the applicable periods shown.
B Calculated based on average shares outstanding during the period.
C Fees and expenses of any underlying Fidelity Central Funds are not included in the Fund's expense ratio. The Fund indirectly bears its proportionate share of the expenses of any underlying Fidelity Central Funds.
D Amount does not include the portfolio activity of any underlying Fidelity Central Funds.
E Expense ratios reflect operating expenses of the class. Expenses before reductions do not reflect amounts reimbursed by the investment adviser or reductions from brokerage service arrangements or reductions from other expense offset arrangements and do not represent the amount paid by the class during periods when reimbursements or reductions occur. Expenses net of fee waivers reflect expenses after reimbursement by the investment adviser but prior to reductions from brokerage service arrangements or other expense offset arrangements. Expenses net of all reductions represent the net expenses paid by the class.
F Amount represents less than $.01 per share.
G Total distributions of $.14 per share is comprised of distributions from net investment income of $.137 and distributions from net realized gain of $.005 per share.
H Total distributions of $.26 per share is comprised of distributions from net investment income of $.221 and distributions from net realized gain of $.034 per share.
See accompanying notes which are an integral part of the financial statements.
Annual Report
Notes to Financial Statements
For the period ended October 31, 2013
1. Organization.
Fidelity International Value Fund (the Fund) is a fund of Fidelity Investment Trust (the Trust) and is authorized to issue an unlimited number of shares. The Trust is registered under the Investment Company Act of 1940, as amended (the 1940 Act), as an open-end management investment company organized as a Massachusetts business trust. The Fund offers Class A, Class T, Class C, International Value and Institutional Class shares, each of which, along with Class B shares, has equal rights as to assets and voting privileges. Class B shares are closed to new accounts and additional purchases, except for exchanges and reinvestments. Each class has exclusive voting rights with respect to matters that affect that class. Class B shares will automatically convert to Class A shares after a holding period of seven years from the initial date of purchase.
2. Investments in Fidelity Central Funds.
The Fund invests in Fidelity Central Funds, which are open-end investment companies generally available only to other investment companies and accounts managed by Fidelity Management & Research Company (FMR) and its affiliates. The Fund's Schedule of Investments lists each of the Fidelity Central Funds held as of period end, if any, as an investment of the Fund, but does not include the underlying holdings of each Fidelity Central Fund. As an Investing Fund, the Fund indirectly bears its proportionate share of the expenses of the underlying Fidelity Central Funds.
The Money Market Central Funds seek preservation of capital and current income and are managed by Fidelity Investments Money Management, Inc. (FIMM), an affiliate of FMR.
A complete unaudited list of holdings for each Fidelity Central Fund is available upon request or at the Securities and Exchange Commission (the SEC) website at www.sec.gov. In addition, the financial statements of the Fidelity Central Funds, which are not covered by the Fund's Report of Independent Registered Public Accounting Firm, are available on the SEC website or upon request.
3. Significant Accounting Policies.
The financial statements have been prepared in conformity with accounting principles generally accepted in the United States of America (GAAP), which require management to make certain estimates and assumptions at the date of the financial statements. Actual results could differ from those estimates. Subsequent events, if any, through the date that the financial statements were issued have been evaluated in the preparation of
Annual Report
3. Significant Accounting Policies - continued
the financial statements. The following summarizes the significant accounting policies of the Fund:
Investment Valuation. Investments are valued as of 4:00 p.m. Eastern time on the last calendar day of the period. In accordance with valuation policies and procedures approved by the Board of Trustees (the Board), the Fund attempts to obtain prices from one or more third party pricing vendors or brokers to value its investments. When current market prices, quotations or currency exchange rates are not readily available or reliable, investments will be fair valued in good faith by the FMR Fair Value Committee (the Committee), in accordance with procedures adopted by the Board. Factors used in determining fair value vary by investment type and may include market or investment specific events. The frequency with which these procedures are used cannot be predicted and they may be utilized to a significant extent. The Committee oversees the Fund's valuation policies and procedures and is responsible for approving and reporting to the Board all fair value determinations.
The Fund categorizes the inputs to valuation techniques used to value its investments into a disclosure hierarchy consisting of three levels as shown below:
Level 1 - quoted prices in active markets for identical investments
Level 2 - other significant observable inputs (including quoted prices for similar investments, interest rates, prepayment speeds, etc.)
Level 3 - unobservable inputs (including the Fund's own assumptions based on the best information available)
Valuation techniques used to value the Fund's investments by major category are as follows:
Equity securities, including restricted securities, for which market quotations are readily available, are valued at the last reported sale price or official closing price as reported by a third party pricing vendor on the primary market or exchange on which they are traded and are categorized as Level 1 in the hierarchy. In the event there were no sales during the day or closing prices are not available, securities are valued at the last quoted bid price or may be valued using the last available price and are generally categorized as Level 2 in the hierarchy. For foreign equity securities, when market or security specific events arise, comparisons to the valuation of American Depositary Receipts (ADRs), futures contracts, Exchange-Traded Funds (ETFs) and certain indexes as well as quoted prices for similar securities may be used and would be categorized as Level 2 in the hierarchy. Utilizing these techniques may result in transfers between Level 1 and Level 2. For equity securities, including restricted securities, where observable inputs are
Annual Report
Notes to Financial Statements - continued
3. Significant Accounting Policies - continued
Investment Valuation - continued
limited, assumptions about market activity and risk are used and these securities may be categorized as Level 3 in the hierarchy.
Investments in open-end mutual funds, including the Fidelity Central Funds, are valued at their closing net asset value (NAV) each business day and are categorized as Level 1 in the hierarchy.
Changes in valuation techniques may result in transfers in or out of an assigned level within the disclosure hierarchy. The aggregate value of investments by input level, as of October 31, 2013, including information on transfers between Levels 1 and 2, is included at the end of the Fund's Schedule of Investments.
Foreign Currency. The Fund may use foreign currency contracts to facilitate transactions in foreign-denominated securities. Gains and losses from these transactions may arise from changes in the value of the foreign currency or if the counterparties do not perform under the contracts' terms.
Foreign-denominated assets, including investment securities, and liabilities are translated into U.S. dollars at the exchange rates at period end. Purchases and sales of investment securities, income and dividends received and expenses denominated in foreign currencies are translated into U.S. dollars at the exchange rate in effect on the transaction date.
The effects of exchange rate fluctuations on investments are included with the net realized and unrealized gain (loss) on investment securities. Other foreign currency transactions resulting in realized and unrealized gain (loss) are disclosed separately.
Investment Transactions and Income. For financial reporting purposes, the Fund's investment holdings and NAV include trades executed through the end of the last business day of the period. The NAV per share for processing shareholder transactions is calculated as of the close of business of the New York Stock Exchange (NYSE), normally 4:00 p.m. Eastern time and includes trades executed through the end of the prior business day. Gains and losses on securities sold are determined on the basis of identified cost and may include proceeds received from litigation. Dividend income is recorded on the ex-dividend date, except for certain dividends from foreign securities where the ex-dividend date may have passed, which are recorded as soon as the Fund is informed of the ex-dividend date. Non-cash dividends included in dividend income, if any, are recorded at the fair market value of the securities received. Interest income and distributions from the Fidelity Central Funds are accrued as earned. Investment income is recorded net of foreign taxes withheld where recovery of such taxes is uncertain.
Annual Report
3. Significant Accounting Policies - continued
Class Allocations and Expenses. Investment income, realized and unrealized capital gains and losses, common expenses of the Fund, and certain fund-level expense reductions, if any, are allocated daily on a pro-rata basis to each class based on the relative net assets of each class to the total net assets of the Fund. Each class differs with respect to transfer agent and distribution and service plan fees incurred. Certain expense reductions may also differ by class. For the reporting period, the allocated portion of income and expenses to each class as a percent of its average net assets may vary due to the timing of recording these transactions in relation to fluctuating net assets of the classes. Expenses directly attributable to a fund are charged to that fund. Expenses attributable to more than one fund are allocated among the respective funds on the basis of relative net assets or other appropriate methods. Expense estimates are accrued in the period to which they relate and adjustments are made when actual amounts are known.
Income Tax Information and Distributions to Shareholders. Each year, the Fund intends to qualify as a regulated investment company under Subchapter M of the Internal Revenue Code, including distributing substantially all of its taxable income and realized gains. As a result, no provision for U.S. Federal income taxes is required. As of October 31, 2013, the Fund did not have any unrecognized tax benefits in the financial statements; nor is the Fund aware of any tax positions for which it is reasonably possible that the total amounts of unrecognized tax benefits will significantly change in the next twelve months. The Fund files a U.S. federal tax return, in addition to state and local tax returns as required. The Fund's federal income tax returns are subject to examination by the Internal Revenue Service (IRS) for a period of three fiscal years after they are filed. State and local tax returns may be subject to examination for an additional fiscal year depending on the jurisdiction. Foreign taxes are provided for based on the Fund's understanding of the tax rules and rates that exist in the foreign markets in which it invests.
Distributions are declared and recorded on the ex-dividend date. Income dividends and capital gain distributions are declared separately for each class. Income and capital gain distributions are determined in accordance with income tax regulations, which may differ from GAAP.
Capital accounts within the financial statements are adjusted for permanent book-tax differences. These adjustments have no impact on net assets or the results of operations. Temporary book-tax differences will reverse in a subsequent period.
Book-tax differences are primarily due to foreign currency transactions, passive foreign investment companies (PFIC), capital loss carryforwards and losses deferred due to wash sales.
Annual Report
Notes to Financial Statements - continued
3. Significant Accounting Policies - continued
Income Tax Information and Distributions to Shareholders - continued
The federal tax cost of investment securities and unrealized appreciation (depreciation) as of period end were as follows:
Gross unrealized appreciation | $ 28,874,674 |
Gross unrealized depreciation | (4,985,981) |
Net unrealized appreciation (depreciation) on securities and other investments | $ 23,888,693 |
| |
Tax Cost | $ 171,699,117 |
The tax-based components of distributable earnings as of period end were as follows:
Undistributed ordinary income | $ 3,934,281 |
Capital loss carryforward | $ (115,088,265) |
Net unrealized appreciation (depreciation) | $ 23,893,034 |
Capital loss carryforwards are only available to offset future capital gains of the Fund to the extent provided by regulations and may be limited. Under the Regulated Investment Company Modernization Act of 2010 (the Act), the Fund is permitted to carry forward capital losses incurred in taxable years beginning after December 22, 2010 for an unlimited period and such capital losses are required to be used prior to any losses that expire. The capital loss carryforward information presented below, including any applicable limitation, is estimated as of fiscal period end and is subject to adjustment.
Fiscal year of expiration | |
2016 | $ (14,771,177) |
2017 | (65,376,972) |
2018 | (3,571,319) |
2019 | (31,368,797) |
Total with expiration | $ (115,088,265) |
The tax character of distributions paid was as follows:
| October 31, 2013 | October 31, 2012 |
Ordinary Income | $ 4,907,552 | $ 5,463,877 |
Short-Term Trading (Redemption) Fees. Shares held by investors in the Fund less than 30 days may have been subject to a redemption fee equal to 1.00% of the net asset value of shares redeemed. All redemption fees, which reduce the proceeds of the shareholder redemption, are retained by the Fund and accounted for as an addition to paid in capital.
Annual Report
4. Purchases and Sales of Investments.
Purchases and sales of securities, other than short-term securities, aggregated $150,085,429 and $129,207,208, respectively.
5. Fees and Other Transactions with Affiliates.
Management Fee. FMR and its affiliates provide the Fund with investment management related services for which the Fund pays a monthly management fee. The management fee is the sum of an individual fund fee rate that is based on an annual rate of .45% of the Fund's average net assets and an annualized group fee rate that averaged .25% during the period. The group fee rate is based upon the average net assets of all the mutual funds advised by FMR, including any mutual funds previously advised by FMR that are currently advised by Fidelity SelectCo, LLC, an affiliate of FMR. The group fee rate decreases as assets under management increase and increases as assets under management decrease. In addition, the management fee is subject to a performance adjustment (up to a maximum of ± .20% of the Fund's average net assets over a 36 month performance period). The upward or downward adjustment to the management fee is based on the relative investment performance of International Value as compared to an appropriate benchmark index over the same 36 month performance period. For the reporting period, the total annual management fee rate, including the performance adjustment, was .65% of the Fund's average net assets. The performance adjustment included in the management fee rate may be higher or lower than the maximum performance adjustment rate due to the difference between the average net assets for the reporting and performance periods.
Distribution and Service Plan Fees. In accordance with Rule 12b-1 of the 1940 Act, the Fund has adopted separate Distribution and Service Plans for each class of shares. Certain classes pay Fidelity Distributors Corporation (FDC), an affiliate of FMR, separate Distribution and Service Fees, each of which is based on an annual percentage of each class' average net assets. In addition, FDC may pay financial intermediaries for selling shares of the Fund and providing shareholder support services. For the period, the Distribution and Service Fee rates, total fees and amounts retained by FDC were as follows:
| Distribution
Fee | Service
Fee | Total Fees | Retained
by FDC |
Class A | -% | .25% | $ 13,148 | $ 2,395 |
Class T | .25% | .25% | 15,589 | 2,306 |
Class B | .75% | .25% | 6,888 | 5,482 |
Class C | .75% | .25% | 27,155 | 8,369 |
| | | $ 62,780 | $ 18,552 |
Annual Report
Notes to Financial Statements - continued
5. Fees and Other Transactions with Affiliates - continued
Sales Load. FDC may receive a front-end sales charge of up to 5.75% for selling Class A shares and 3.50% for selling Class T shares, some of which is paid to financial intermediaries for selling shares of the Fund. Depending on the holding period, FDC may receive contingent deferred sales charges levied on Class A, Class T, Class B, and Class C redemptions. The deferred sales charges range from 5.00% to 1.00% for Class B shares, 1.00% for Class C shares, 1.00% for certain purchases of Class A shares and .25% for certain purchases of Class T shares.
For the period, sales charge amounts retained by FDC were as follows:
| Retained
by FDC |
Class A | $ 3,932 |
Class T | 1,030 |
Class B* | 1,552 |
Class C* | 514 |
| $ 7,028 |
* When Class B and Class C shares are initially sold, FDC pays commissions from its own resources to financial intermediaries through which the sales
are made.
Transfer Agent Fees. Fidelity Investments Institutional Operations Company, Inc., (FIIOC), an affiliate of FMR, is the transfer, dividend disbursing and shareholder servicing agent for each class of the Fund. FIIOC receives account fees and asset-based fees that vary according to the account size and type of account of the shareholders of the respective classes of the Fund. FIIOC pays for typesetting, printing and mailing of shareholder reports, except proxy statements.
For the period, transfer agent fees for each class were as follows:
| Amount | % of
Average
Net Assets |
Class A | $ 15,780 | .30 |
Class T | 9,962 | .32 |
Class B | 2,081 | .30 |
Class C | 8,174 | .30 |
International Value | 333,690 | .21 |
Institutional Class | 682 | .23 |
| $ 370,369 | |
Accounting and Security Lending Fees. Fidelity Service Company, Inc. (FSC), an affiliate of FMR, maintains the Fund's accounting records. The accounting fee is based on the level of average net assets for each month. Under a separate contract, FSC
Annual Report
5. Fees and Other Transactions with Affiliates - continued
Accounting and Security Lending Fees - continued
administers the security lending program. The security lending fee is based on the number and duration of lending transactions.
Brokerage Commissions. The Fund placed a portion of its portfolio transactions with brokerage firms which are affiliates of the investment adviser. Brokerage commissions are included in net realized gain (loss) and change in net unrealized appreciation (depreciation) in the Statement of Operations. The commissions paid to these affiliated firms were $199 for the period.
6. Committed Line of Credit.
The Fund participates with other funds managed by FMR or an affiliate in a $4.25 billion credit facility (the "line of credit") to be utilized for temporary or emergency purposes to fund shareholder redemptions or for other short-term liquidity purposes. The Fund has agreed to pay commitment fees on its pro-rata portion of the line of credit, which amounted to $349 and is reflected in Miscellaneous expenses on the Statement of Operations. During the period, there were no borrowings on this line of credit.
7. Security Lending.
The Fund lends portfolio securities through a lending agent from time to time in order to earn additional income. For equity securities, a lending agent is used and may loan securities to certain qualified borrowers, including Fidelity Capital Markets (FCM), a broker-dealer affiliated with the Fund. On the settlement date of the loan, the Fund receives collateral (in the form of U.S. Treasury obligations, letters of credit and/or cash) against the loaned securities and maintains collateral in an amount not less than 100% of the market value of the loaned securities during the period of the loan. The market value of the loaned securities is determined at the close of business of the Fund and any additional required collateral is delivered to the Fund on the next business day. If the borrower defaults on its obligation to return the securities loaned because of insolvency or other reasons, the Fund may apply collateral received from the borrower against the obligation. The Fund may experience delays and costs in recovering the securities loaned. Any cash collateral received is invested in the Fidelity Securities Lending Cash Central Fund. At period end, there were no security loans outstanding. Security lending income represents the income earned on investing cash collateral, less rebates paid to borrowers and any lending agent fees associated with the loan, plus any premium payments received for lending certain types of securities. Security lending income is presented in the Statement of Operations as a component of income from Fidelity Central Funds. Total security lending income during the period amounted to $158,210. During the period, there were no securities loaned to FCM.
Annual Report
Notes to Financial Statements - continued
8. Expense Reductions.
Commissions paid to certain brokers with whom FMR, or its affiliates, places trades on behalf of the Fund include an amount in addition to trade execution, which may be rebated back to the Fund to offset certain expenses. This amount totaled $47,222 for the period.
In addition, FMR reimbursed a portion of the Fund's operating expenses during the period in the amount of $550.
9. Distributions to Shareholders.
Distributions to shareholders of each class were as follows:
Years ended October 31, | 2013 | 2012 |
From net investment income | | |
Class A | $ 121,166 | $ 143,989 |
Class T | 67,016 | 67,838 |
Class B | 11,860 | 19,758 |
Class C | 47,865 | 50,970 |
International Value | 3,862,005 | 5,163,324 |
Institutional Class | 10,688 | 17,998 |
Total | $ 4,120,600 | $ 5,463,877 |
From net realized gain | | |
Class A | $ 25,318 | $ - |
Class T | 15,214 | - |
Class B | 3,861 | - |
Class C | 13,226 | - |
International Value | 727,373 | - |
Institutional Class | 1,960 | - |
Total | $ 786,952 | $ - |
10. Share Transactions.
Transactions for each class of shares were as follows:
| Shares | Dollars |
Years ended October 31, | 2013 | 2012 | 2013 | 2012 |
Class A | | | | |
Shares sold | 221,312 | 186,877 | $ 1,773,149 | $ 1,294,428 |
Reinvestment of distributions | 17,344 | 19,578 | 128,001 | 128,823 |
Shares redeemed | (155,517) | (263,913) | (1,235,132) | (1,814,670) |
Net increase (decrease) | 83,139 | (57,458) | $ 666,018 | $ (391,419) |
Class T | | | | |
Shares sold | 91,084 | 87,833 | $ 741,140 | $ 599,355 |
Reinvestment of distributions | 11,018 | 10,069 | 81,425 | 66,355 |
Shares redeemed | (46,826) | (85,446) | (371,734) | (585,214) |
Net increase (decrease) | 55,276 | 12,456 | $ 450,831 | $ 80,496 |
Annual Report
10. Share Transactions - continued
| Shares | Dollars |
Years ended October 31, | 2013 | 2012 | 2013 | 2012 |
Class B | | | | |
Shares sold | 6,334 | 2,850 | $ 51,789 | $ 19,157 |
Reinvestment of distributions | 1,746 | 2,474 | 13,011 | 16,400 |
Shares redeemed | (26,098) | (40,532) | (212,223) | (279,913) |
Net increase (decrease) | (18,018) | (35,208) | $ (147,423) | $ (244,356) |
Class C | | | | |
Shares sold | 93,011 | 72,761 | $ 748,735 | $ 498,768 |
Reinvestment of distributions | 7,487 | 6,699 | 55,475 | 44,283 |
Shares redeemed | (43,711) | (75,717) | (352,531) | (522,498) |
Net increase (decrease) | 56,787 | 3,743 | $ 451,679 | $ 20,553 |
International Value | | | | |
Shares sold | 6,308,136 | 2,278,492 | $ 51,241,221 | $ 15,694,819 |
Reinvestment of distributions | 602,705 | 762,294 | 4,441,937 | 5,008,269 |
Shares redeemed | (4,113,021) | (7,089,505) | (32,981,230) | (48,008,194) |
Net increase (decrease) | 2,797,820 | (4,048,719) | $ 22,701,928 | $ (27,305,106) |
Institutional Class | | | | |
Shares sold | 6,984 | 18,483 | $ 56,532 | $ 132,098 |
Reinvestment of distributions | 1,136 | 1,234 | 8,383 | 8,117 |
Shares redeemed | (31,601) | (36,776) | (249,818) | (254,320) |
Net increase (decrease) | (23,481) | (17,059) | $ (184,903) | $ (114,105) |
11. Other.
The Fund's organizational documents provide former and current trustees and officers with a limited indemnification against liabilities arising in connection with the performance of their duties to the Fund. In the normal course of business, the Fund may also enter into contracts that provide general indemnifications. The Fund's maximum exposure under these arrangements is unknown as this would be dependent on future claims that may be made against the Fund. The risk of material loss from such claims is considered remote.
At the end of the period, Strategic Advisers International II Fund and VIP FundsManager 60% Portfolio were the owners of record of approximately 25% and 14%, respectively, of the total outstanding shares of the Fund.
Mutual funds managed by FMR or its affiliates were owners of record, in the aggregate, of approximately 46% of the total outstanding shares of the Fund.
Annual Report
To the Trustees of Fidelity Investment Trust and Shareholders of Fidelity International Value Fund:
We have audited the accompanying statement of assets and liabilities of Fidelity International Value Fund (the Fund), a fund of Fidelity Investment Trust, including the schedule of investments, as of October 31, 2013, and the related statement of operations for the year then ended, the statement of changes in net assets for each of the two years in the period then ended, and the financial highlights for each of the five years in the period then ended. These financial statements and financial highlights are the responsibility of the Fund's management. Our responsibility is to express an opinion on these financial statements and financial highlights based on our audits.
We conducted our audits in accordance with the standards of the Public Company Accounting Oversight Board (United States). Those standards require that we plan and perform the audit to obtain reasonable assurance about whether the financial statements and financial highlights are free of material misstatement. The Fund is not required to have, nor were we engaged to perform, an audit of its internal control over financial reporting. Our audits included consideration of internal control over financial reporting as a basis for designing audit procedures that are appropriate in the circumstances, but not for the purpose of expressing an opinion on the effectiveness of the Fund's internal control over financial reporting. Accordingly, we express no such opinion. An audit also includes examining, on a test basis, evidence supporting the amounts and disclosures in the financial statements, assessing the accounting principles used and significant estimates made by management, as well as evaluating the overall financial statement presentation. Our procedures included confirmation of securities owned as of October 31, 2013, by correspondence with the custodians and brokers; where replies were not received from brokers, we performed other auditing procedures. We believe that our audits provide a reasonable basis for our opinion.
In our opinion, the financial statements and financial highlights referred to above present fairly, in all material respects, the financial position of Fidelity International Value Fund as of October 31, 2013, the results of its operations for the year then ended, the changes in its net assets for each of the two years in the period then ended, and the financial highlights for each of the five years in the period then ended, in conformity with accounting principles generally accepted in the United States of America.
DELOITTE & TOUCHE LLP
Boston, Massachusetts
December 6, 2013
Annual Report
The Trustees, Member of the Advisory Board, and executive officers of the trust and fund, as applicable, are listed below. The Board of Trustees governs the fund and is responsible for protecting the interests of shareholders. The Trustees are experienced executives who meet periodically throughout the year to oversee the fund's activities, review contractual arrangements with companies that provide services to the fund, oversee management of the risks associated with such activities and contractual arrangements, and review the fund's performance. Except for James C. Curvey, Ned C. Lautenbach, Ronald P. O'Hanley, and William S. Stavropoulos, each of the Trustees oversees 171 funds. Mr. Curvey oversees 394 funds. Mr. Lautenbach, Mr. O'Hanley, and Mr. Stavropoulos each oversees 245 funds.
The Trustees hold office without limit in time except that (a) any Trustee may resign; (b) any Trustee may be removed by written instrument, signed by at least two-thirds of the number of Trustees prior to such removal; (c) any Trustee who requests to be retired or who has become incapacitated by illness or injury may be retired by written instrument signed by a majority of the other Trustees; and (d) any Trustee may be removed at any special meeting of shareholders by a two-thirds vote of the outstanding voting securities of the trust. Each Trustee who is not an interested person of the trust and the fund (as defined in the 1940 Act) (Independent Trustee), shall retire not later than the last day of the calendar year in which his or her 75th birthday occurs. The Independent Trustees may waive this mandatory retirement age policy with respect to individual Trustees. The executive officers and Advisory Board Member hold office without limit in time, except that any officer and Advisory Board Member may resign or may be removed by a vote of a majority of the Trustees at any regular meeting or any special meeting of the Trustees. Except as indicated, each individual has held the office shown or other offices in the same company for the past five years.
Experience, Skills, Attributes, and Qualifications of the Fund's Trustees. The Governance and Nominating Committee has adopted a statement of policy that describes the experience, qualifications, attributes, and skills that are necessary and desirable for potential Independent Trustee candidates (Statement of Policy). The Board believes that each Trustee satisfied at the time he or she was initially elected or appointed a Trustee, and continues to satisfy, the standards contemplated by the Statement of Policy. The Governance and Nominating Committee also engages professional search firms to help identify potential Independent Trustee candidates who have the experience, qualifications, attributes, and skills consistent with the Statement of Policy. From time to time, additional criteria based on the composition and skills of the current Independent Trustees, as well as experience or skills that may be appropriate in light of future changes to board composition, business conditions, and regulatory or other developments, have also been considered by the professional search firms and the Governance and Nominating Committee. In addition, the Board takes into account the Trustees' commitment and participation in Board and committee meetings, as well as their leadership of standing and ad hoc committees throughout their tenure.
Annual Report
Trustees and Officers - continued
In determining that a particular Trustee was and continues to be qualified to serve as a Trustee, the Board has considered a variety of criteria, none of which, in isolation, was controlling. The Board believes that, collectively, the Trustees have balanced and diverse experience, qualifications, attributes, and skills, which allow the Board to operate effectively in governing the fund and protecting the interests of shareholders. Information about the specific experience, skills, attributes, and qualifications of each Trustee, which in each case led to the Board's conclusion that the Trustee should serve (or continue to serve) as a trustee of the fund, is provided below.
Board Structure and Oversight Function. James C. Curvey is an interested person (as defined in the 1940 Act) and currently serves as Chairman. The Trustees have determined that an interested Chairman is appropriate and benefits shareholders because an interested Chairman has a personal and professional stake in the quality and continuity of services provided to the fund. Independent Trustees exercise their informed business judgment to appoint an individual of their choosing to serve as Chairman, regardless of whether the Trustee happens to be independent or a member of management. The Independent Trustees have determined that they can act independently and effectively without having an Independent Trustee serve as Chairman and that a key structural component for assuring that they are in a position to do so is for the Independent Trustees to constitute a substantial majority for the Board. The Independent Trustees also regularly meet in executive session. Ned C. Lautenbach serves as Chairman of the Independent Trustees and as such (i) acts as a liaison between the Independent Trustees and management with respect to matters important to the Independent Trustees and (ii) with management prepares agendas for Board meetings.
Fidelity funds are overseen by different Boards of Trustees. The fund's Board oversees Fidelity's equity and high income funds and another Board oversees Fidelity's investment-grade bond, money market, and asset allocation funds. The asset allocation funds may invest in Fidelity funds overseen by the fund's Board. The use of separate Boards, each with its own committee structure, allows the Trustees of each group of Fidelity funds to focus on the unique issues of the funds they oversee, including common research, investment, and operational issues. On occasion, the separate Boards establish joint committees to address issues of overlapping consequences for the Fidelity funds overseen by each Board.
The Trustees operate using a system of committees to facilitate the timely and efficient consideration of all matters of importance to the Trustees, the fund, and fund shareholders and to facilitate compliance with legal and regulatory requirements and oversight of the fund's activities and associated risks. The Board, acting through its committees, has charged FMR and its affiliates with (i) identifying events or circumstances the occurrence of which could have demonstrably adverse effects on the fund's business and/or reputation; (ii) implementing processes and controls to lessen the possibility that such events or circumstances occur or to mitigate the effects of such events or circumstances if they do occur; and (iii) creating and maintaining a system designed to evaluate continuously business and market conditions in order to facilitate the identification and implementation processes described in (i) and (ii) above. Because the day-to-day operations and activities of the fund are carried out by or through FMR, its affiliates and other service providers, the fund's exposure to risks is mitigated but not eliminated by the processes overseen by the Trustees. While each of the Board's committees has responsibility for overseeing different aspects of the fund's activities, oversight is exercised primarily through the Operations, Audit, and Compliance Committees. In addition, the Independent Trustees have worked with FMR to enhance the Board's oversight of investment and financial risks, legal and regulatory risks, technology risks, and operational risks, including the development of additional risk reporting to the Board. For example, a working group comprised of Independent Trustees and FMR has worked and continues to work to review the Fidelity funds' valuation-related activities, reporting and risk management. Appropriate personnel, including but not limited to the fund's Chief Compliance Officer (CCO), FMR's internal auditor, the independent accountants, the fund's Treasurer and portfolio management personnel, make periodic reports to the Board's committees, as appropriate, including an annual review of FMR's risk management program for the Fidelity funds. The responsibilities of each standing committee, including their oversight responsibilities, are described further under "Standing Committees of the Fund's Trustees."
Annual Report
The fund's Statement of Additional Information (SAI) includes more information about the Trustees. To request a free copy, call Fidelity at 1-877-208-0098.
Interested Trustees*:
Correspondence intended for each Trustee who is an interested person may be sent to Fidelity Investments, 245 Summer Street, Boston, Massachusetts 02210.
Name, Year of Birth; Principal Occupations and Other Relevant Experience+ |
James C. Curvey (1935) |
Year of Election or Appointment: 2007 Trustee Chairman of the Board of Trustees |
| Mr. Curvey also serves as Trustee of other Fidelity funds. Mr. Curvey is a Director of Fidelity Investments Money Management, Inc. (2009-present), Director of Fidelity Research & Analysis Co. (2009-present) and Director of FMR and FMR Co., Inc. (2007-present). Mr. Curvey is also Vice Chairman (2007-present) and Director of FMR LLC. In addition, Mr. Curvey serves as an Overseer for the Boston Symphony Orchestra and a member of the Trustees of Villanova University. Previously, Mr. Curvey was the Vice Chairman (2006-2007) and Director (2000-2007) of FMR Corp. |
Ronald P. O'Hanley (1957) |
Year of Election or Appointment: 2011 Trustee |
| Mr. O'Hanley also serves as Trustee of other Fidelity funds. He is Director of Fidelity SelectCo, LLC (2013-present), FMR Co., Inc. (2010-present), Director of Fidelity Investments Money Management, Inc. (2010-present), Director of Fidelity Research & Analysis Company (2010-present), President of Fidelity Asset Management and Corporate Services and a Member of Fidelity's Executive Committee (2010-present). Previously, Mr. O'Hanley served as President and Chief Executive Officer of BNY Mellon Asset Management (2007-2010). Mr. O'Hanley also served as Vice Chairman of Bank New York Mellon Corp. and a member of that firm's Executive Committee. Prior to the 2007 merger of The Bank of New York and Mellon Financial Corporation, he was Vice Chairman of Mellon Financial Corporation and President and Chief Executive Officer of Mellon Asset Management. He joined Mellon in February 1997. Mr. O'Hanley currently serves as Chairman of the Boston Public Library Foundation Board of Directors and sits on the Board of Directors of Beth Israel Deaconess Medical Center, the Board of Trustees of the Marine Biological Laboratory and the Advisory Board of the Maxwell School of Citizenship and Public Administration at Syracuse University. Mr. O'Hanley also chairs the Council on Asset Management for the Financial Services Roundtable and is a member of the Board of Directors of Institutional Investor's U.S. Institute. |
* Trustees have been determined to be "Interested Trustees" by virtue of, among other things, their affiliation with the trust or various entities under common control with FMR.
+ The information above includes each Trustee's principal occupation during the last five years and other information relating to the experience, attributes, and skills relevant to each Trustee's qualifications to serve as a Trustee, which led to the conclusion that each Trustee should serve as a Trustee for the fund.
Annual Report
Independent Trustees:
Correspondence intended for each Independent Trustee (that is, the Trustees other than the Interested Trustees) may be sent to Fidelity Investments, P.O. Box 55235, Boston, Massachusetts 02205-5235.
Name, Year of Birth; Principal Occupations and Other Relevant Experience+ |
Dennis J. Dirks (1948) |
Year of Election or Appointment: 2005 Trustee |
| Mr. Dirks also serves as Trustee of other Fidelity funds. Prior to his retirement in May 2003, Mr. Dirks was Chief Operating Officer and a member of the Board of The Depository Trust & Clearing Corporation (DTCC). He also served as President, Chief Operating Officer, and Board member of The Depository Trust Company (DTC) and President and Board member of the National Securities Clearing Corporation (NSCC). In addition, Mr. Dirks served as Chief Executive Officer and Board member of the Government Securities Clearing Corporation, Chief Executive Officer and Board member of the Mortgage-Backed Securities Clearing Corporation, as a Trustee and a member of the Finance Committee of Manhattan College (2005-2008), and as a Trustee and a member of the Finance Committee of AHRC of Nassau County (2006-2008). Mr. Dirks is a member of the Independent Directors Council (IDC) Governing Council (2010-present) and Board of Directors for The Brookville Center for Children's Services, Inc. (2009-present). |
Alan J. Lacy (1953) |
Year of Election or Appointment: 2008 Trustee |
| Mr. Lacy also serves as Trustee of other Fidelity funds. Mr. Lacy serves as Senior Adviser (2007-present) of Oak Hill Capital Partners, L.P. (private equity). Mr. Lacy also served as Chief Executive Officer (2000-2005) and Vice Chairman (2005-2006) of Sears Holdings Corporation and Sears, Roebuck and Co. (retail). In addition, Mr. Lacy serves as a member of the Board of Directors of Dave & Buster's Entertainment, Inc. (restaurant and entertainment complexes, 2010-present), Earth Fare, Inc. (retail grocery, 2012-present), The Hillman Companies, Inc. (hardware wholesalers, 2010-present), and Bristol-Myers Squibb Company (global pharmaceuticals, 2008-present). Mr. Lacy is a member of the Board of Trustees of The National Parks Conservation Association (2006-present). Previously, Mr. Lacy served as Chairman of the Board of Trustees of the National Parks Conservation Association (2008-2011) and as a member of the Board of Directors for the Western Union Company (global money transfer, 2006-2011). |
Ned C. Lautenbach (1944) |
Year of Election or Appointment: 2000 Trustee Chairman of the Independent Trustees |
| Mr. Lautenbach also serves as Trustee of other Fidelity funds. Mr. Lautenbach currently serves as the Lead Director of the Eaton Corporation Board of Directors (diversified industrial, 1997-present). Mr. Lautenbach is Chairman of the Board of Directors of the Philharmonic Center for the Arts in Naples, Florida (2012-present) and a member of the Council on Foreign Relations (1994-present). Previously, Mr. Lautenbach was a Partner/Advisory Partner at Clayton, Dubilier & Rice, LLC (private equity investment, 1998-2010), as well as a Director of Sony Corporation (2006-2007). |
Joseph Mauriello (1944) |
Year of Election or Appointment: 2008 Trustee |
| Mr. Mauriello also serves as Trustee of other Fidelity funds. Prior to his retirement in January 2006, Mr. Mauriello served in numerous senior management positions including Deputy Chairman and Chief Operating Officer (2004-2005), and Vice Chairman of Financial Services (2002-2004) of KPMG LLP US (professional services, 1965-2005). Mr. Mauriello currently serves as a member of the Board of Directors of XL Group plc. (global insurance and re-insurance, 2006-present). Previously, Mr. Mauriello served as a Director of the Hamilton Funds of the Bank of New York (2006-2007) and of Arcadia Resources Inc. (health care services and products, 2007-2012). |
Robert W. Selander (1950) |
Year of Election or Appointment: 2011 Trustee |
| Mr. Selander also serves as Trustee of other Fidelity funds. Previously, Mr. Selander served as a Member of the Advisory Board of other Fidelity funds (2011), and Executive Vice Chairman (2010), Chief Executive Officer (2009-2010), and President and Chief Executive Officer (1997-2009) of Mastercard, Inc. |
Cornelia M. Small (1944) |
Year of Election or Appointment: 2005 Trustee |
| Ms. Small also serves as Trustee of other Fidelity funds. Ms. Small is a member of the Board of Directors (2009-present) and Chair of the Investment Committee (2010-present) of the Teagle Foundation. Ms. Small also serves on the Investment Committee of the Berkshire Taconic Community Foundation (2008-present). Previously, Ms. Small served as Chairperson (2002-2008) and a member of the Investment Committee and Chairperson (2008-2012) and a member of the Board of Trustees of Smith College. In addition, Ms. Small served as Chief Investment Officer, Director of Global Equity Investments, and a member of the Board of Directors of Scudder, Stevens & Clark and Scudder Kemper Investments. |
William S. Stavropoulos (1939) |
Year of Election or Appointment: 2001 Trustee Vice Chairman of the Independent Trustees |
| Mr. Stavropoulos also serves as Trustee of other Fidelity funds. Mr. Stavropoulos serves as President and Founder of the Michigan Baseball Foundation, the Great Lakes Loons (2007-present). Mr. Stavropoulos is Chairman Emeritus of the Board of Directors of The Dow Chemical Company, where he previously served in numerous senior management positions, including President, CEO (1995-2000; 2002-2004), Chairman of the Executive Committee (2000-2006), and as a member of the Board of Directors (1990-2006). Currently, Mr. Stavropoulos is Chairman of the Board of Directors of Univar Inc. (global distributor of commodity and specialty chemicals), a Director of Teradata Corporation (data warehousing and technology solutions), and Maersk Inc. (industrial conglomerate), and a member of the Advisory Board for Metalmark Capital LLC (private equity investment, 2005-present). Mr. Stavropoulos is an operating advisor to Clayton, Dubilier & Rice, LLC (private equity investment). In addition, Mr. Stavropoulos is a member of the University of Notre Dame Advisory Council for the College of Science, a Trustee of the Rollin L. Gerstacker Foundation, and a Director of the Naples Philharmonic Center for the Arts. Previously, Mr. Stavropoulos served as a Director of Chemical Financial Corporation (bank holding company, 1993-2012) and Tyco International, Ltd. (multinational manufacturing and services, 2007-2012). |
David M. Thomas (1949) |
Year of Election or Appointment: 2008 Trustee |
| Mr. Thomas also serves as Trustee of other Fidelity funds. Mr. Thomas serves as Non-Executive Chairman of the Board of Directors of Fortune Brands Home and Security (home and security products, 2011-present), and as a member of the Board of Directors of Interpublic Group of Companies, Inc. (marketing communication, 2004-present). Previously, Mr. Thomas served as Executive Chairman (2005-2006) and Chairman and Chief Executive Officer (2000-2005) of IMS Health, Inc. (pharmaceutical and healthcare information solutions), and a Director of Fortune Brands, Inc. (consumer products, 2000-2011). |
+ The information above includes each Trustee's principal occupation during the last five years and other information relating to the experience, attributes, and skills relevant to each Trustee's qualifications to serve as a Trustee, which led to the conclusion that each Trustee should serve as a Trustee for the fund.
Advisory Board Member and Executive Officers:
Correspondence intended for each executive officer and Peter S. Lynch may be sent to Fidelity Investments, 245 Summer Street, Boston, Massachusetts 02210. Executive officers appear below in alphabetical order.
Name, Year of Birth; Principal Occupation |
Peter S. Lynch (1944) |
Year of Election or Appointment: 2003 Member of the Advisory Board |
| Mr. Lynch also serves as Member of the Advisory Board of other Fidelity funds. Mr. Lynch is Vice Chairman and a Director of FMR and FMR Co., Inc. In addition, Mr. Lynch serves as a Trustee of Boston College and as the Chairman of the Inner-City Scholarship Fund. Previously, Mr. Lynch served on the Special Olympics International Board of Directors (1997-2006). |
Elizabeth Paige Baumann (1968) |
Year of Election or Appointment: 2012 Anti-Money Laundering (AML) Officer |
| Ms. Baumann also serves as AML Officer of other funds. She is Chief AML Officer of FMR LLC (2012-present) and is an employee of Fidelity Investments. Previously, Ms. Baumann served as Vice President and Deputy Anti-Money Laundering Officer (2007-2012). |
William C. Coffey (1969) |
Year of Election or Appointment: 2009 Assistant Secretary |
| Mr. Coffey also serves as Assistant Secretary of other funds. He is Senior Vice President and Deputy General Counsel of FMR LLC (2010-present), and is an employee of Fidelity Investments. Previously, Mr. Coffey served as Vice President and Associate General Counsel of FMR LLC (2005-2009). |
Jonathan Davis (1968) |
Year of Election or Appointment: 2010 Assistant Treasurer |
| Mr. Davis also serves as Assistant Treasurer of other funds. Mr. Davis is an employee of Fidelity Investments. Previously, Mr. Davis served as Vice President and Associate General Counsel of FMR LLC (2003-2010). |
Adrien E. Deberghes (1967) |
Year of Election or Appointment: 2008 Deputy Treasurer |
| Mr. Deberghes also serves as an officer of other funds. He is an employee of Fidelity Investments (2008-present). Prior to joining Fidelity Investments, Mr. Deberghes was Senior Vice President of Mutual Fund Administration at State Street Corporation (2007-2008), Senior Director of Mutual Fund Administration at Investors Bank & Trust (2005-2007), and Director of Finance for Dunkin' Brands (2000-2005). |
Stephanie J. Dorsey (1969) |
Year of Election or Appointment: 2010 Assistant Treasurer |
| Ms. Dorsey also serves as an officer of other funds. She is an employee of Fidelity Investments (2008-present) and has served in other fund officer roles. Prior to joining Fidelity Investments, Ms. Dorsey served as Treasurer (2004-2008) of the JPMorgan Mutual Funds and Vice President (2004-2008) of JPMorgan Chase Bank. |
Scott C. Goebel (1968) |
Year of Election or Appointment: 2008 Secretary and Chief Legal Officer (CLO) |
| Mr. Goebel serves as Secretary and CLO of other funds. Mr. Goebel also serves as Secretary of Fidelity Investments Money Management, Inc. (FIMM) (2010-present) and Fidelity Research and Analysis Company (FRAC) (2010-present); General Counsel, Secretary, and Senior Vice President of FMR (2008-present) and FMR Co., Inc. (2008-present); Chief Legal Officer of Fidelity Management & Research (Hong Kong) Limited (2008-present) and Assistant Secretary of Fidelity Management & Research (Japan) Inc. (2008-present), and Fidelity Management & Research (U.K.) Inc. (2008-present). Previously, Mr. Goebel served as Secretary and CLO of other Fidelity funds (2008-2013), Assistant Secretary of FIMM (2008-2010), FRAC (2008-2010), and certain funds (2007-2008); and as Vice President and Secretary of Fidelity Distributors Corporation (FDC) (2005-2007). Mr. Goebel has been employed by FMR LLC or an affiliate since 2001. |
Joseph A. Hanlon (1968) |
Year of Election or Appointment: 2012 Chief Compliance Officer |
| Mr. Hanlon also serves as Chief Compliance Officer of other funds. Mr. Hanlon serves as Compliance Officer of FMR, FMR Co., Inc., Fidelity Investments Money Management, Inc. (FIMM), Fidelity Research and Analysis Company (FRAC), and Fidelity Management & Research (Hong Kong) (2009-present), as Senior Vice President of the Fidelity Asset Management Division (2009-present), and is an employee of Fidelity Investments. Previously, Mr. Hanlon served as Compliance Officer of Fidelity Management & Research (Japan) Inc. (2009-2013), Strategic Advisers, Inc. (2009-2013), and Fidelity Management & Research (U.K.) Inc. (2009-2013). |
Bruce T. Herring (1965) |
Year of Election or Appointment: 2006 Vice President of certain Equity Funds |
| Mr. Herring also serves as Vice President of other funds. He serves as Chief Investment Officer of Fidelity Global Asset Allocation (GAA) (2013-present), Chief Investment Officer and Director of Fidelity Management & Research (U.K.) Inc. (2010-present), Group Chief Investment Officer of FMR, and President of Fidelity Research & Analysis Company (2010-present). Previously, Mr. Herring served as Vice President (2005-2006) and Senior Vice President (2006-2007) of Fidelity Management & Research Company, Vice President of FMR Co., Inc. (2001-2007), and as a portfolio manager for Fidelity U.S. Equity Funds. |
Brian B. Hogan (1964) |
Year of Election or Appointment: 2009 Vice President |
| Mr. Hogan also serves as Vice President of other funds. Mr. Hogan serves as President of FMR's Equity Division (2009-present). Previously, Mr. Hogan served as Senior Vice President, Equity Research of FMR (2006-2009) and as a portfolio manager. |
Chris Maher (1972) |
Year of Election or Appointment: 2013 Assistant Treasurer |
| Mr. Maher serves as Assistant Treasurer of other funds. Mr. Maher is Vice President of Valuation Oversight and is an employee of Fidelity Investments. Previously, Mr. Maher served as Vice President of Asset Management Compliance (2013), Vice President of FMR's Program Management Group (2010-2013), and Vice President of Valuation Oversight (2008-2010). |
Christine Reynolds (1958) |
Year of Election or Appointment: 2008 Chief Financial Officer |
| Ms. Reynolds also serves as Chief Financial Officer of other funds. Ms. Reynolds became President of Fidelity Pricing and Cash Management Services (FPCMS) in August 2008. Ms. Reynolds served as Chief Operating Officer of FPCMS (2007-2008). Previously, Ms. Reynolds served as President, Treasurer, and Anti-Money Laundering officer of the Fidelity funds (2004-2007). |
Kenneth B. Robins (1969) |
Year of Election or Appointment: 2008 President and Treasurer |
| Mr. Robins also serves as an officer of other funds. Mr. Robins serves as Executive Vice President of Fidelity Investments Money Management, Inc. (FIMM) (2013-present) and is an employee of Fidelity Investments (2004-present). Previously, Mr. Robins served in other fund officer roles. |
Gary W. Ryan (1958) |
Year of Election or Appointment: 2005 Assistant Treasurer |
| Mr. Ryan also serves as Assistant Treasurer of other funds. Mr. Ryan is an employee of Fidelity Investments and has served in other fund officer roles. Previously, Mr. Ryan served as Vice President of Fund Reporting in Fidelity Pricing and Cash Management Services (FPCMS) (1999-2005). |
Stephen Sadoski (1971) |
Year of Election or Appointment: 2012 Deputy Treasurer |
| Mr. Sadoski also serves as Deputy Treasurer of other funds. He is an employee of Fidelity Investments (2012-present) and has served in another fund officer role. Prior to joining Fidelity Investments, Mr. Sadoski served as an assistant chief accountant in the Division of Investment Management of the Securities and Exchange Commission (SEC) (2009-2012) and as a senior manager at Deloitte & Touche LLP (1997-2009). |
Stacie M. Smith (1974) |
Year of Election or Appointment: 2013 Deputy Treasurer |
| Ms. Smith also serves as an officer of other funds. She is an employee of Fidelity Investments (2009-present) and has served in other fund officer roles. Prior to joining Fidelity Investments, Ms. Smith served as Senior Audit Manager of Ernst & Young LLP (1996-2009). |
Renee Stagnone (1975) |
Year of Election or Appointment: 2013 Deputy Treasurer |
| Ms. Stagnone also serves as Deputy Treasurer of other funds. Ms. Stagnone is an employee of Fidelity Investments. |
Joseph F. Zambello (1957) |
Year of Election or Appointment: 2011 Deputy Treasurer |
| Mr. Zambello also serves as Deputy Treasurer of other funds. Mr. Zambello is an employee of Fidelity Investments. Previously, Mr. Zambello served as Vice President of FMR's Program Management Group (2009-2011) and Vice President of the Transfer Agent Oversight Group (2005-2009). |
Annual Report
The Board of Trustees of Fidelity International Value Fund voted to pay to shareholders of record at the opening of business on record date, the following distributions per share derived from capital gains realized from sales of portfolio securities, and dividends derived from net investment income:
| Pay Date | Record Date | Dividends | Capital Gains |
Institutional Class | 12/09/13 | 12/06/13 | $0.191 | $0.014 |
Institutional Class designates 74% of the dividends distributed in December during the fiscal year as amounts which may be taken into account as a dividend for purposes of the maximum rate under section 1(h)(11) of the Internal Revenue Code.
The amounts per share which represent income derived from sources within, and taxes paid to, foreign countries or possessions of the United States are as follows:
| Pay Date | Income | Taxes |
Institutional Class | 12/10/12 | $0.199 | $0.0098 |
The fund will notify shareholders in January 2014 of amounts for use in preparing 2013 income tax returns.
Annual Report
Board Approval of Investment Advisory Contracts and Management Fees
Fidelity International Value Fund
Each year, the Board of Trustees, including the Independent Trustees (together, the Board), votes on the renewal of the management contract and sub-advisory agreements (together, the Advisory Contracts) for the fund. The Board, assisted by the advice of fund counsel and Independent Trustees' counsel, requests and considers a broad range of information relevant to the renewal of the Advisory Contracts throughout the year.
The Board meets regularly and, at each of its meetings, covers an extensive agenda of topics and materials and considers factors that are relevant to its annual consideration of the renewal of the fund's Advisory Contracts, including the services and support provided to the fund and its shareholders. The Board has established various standing committees, each composed of and chaired by Independent Trustees with varying backgrounds, to which the Board has assigned specific subject matter responsibilities in order to enhance effective decision-making by the Board. The Board, acting directly and through its Committees, requests and receives information concerning the annual consideration of the renewal of the fund's Advisory Contracts. The Board also meets as needed to consider matters specifically related to the Board's annual consideration of the renewal of Advisory Contracts. Members of the Board may also meet with trustees of other Fidelity funds through ad hoc joint committees to discuss certain matters relevant to the Fidelity funds.
At its July 2013 meeting, the Board, including the Independent Trustees, unanimously determined to renew the fund's Advisory Contracts. In reaching its determination, the Board considered all factors it believed relevant, including (i) the nature, extent, and quality of the services to be provided to the fund and its shareholders (including the investment performance of the fund); (ii) the competitiveness of the fund's management fee and total expense ratio relative to peer funds; (iii) the total costs of the services to be provided by and the profits to be realized by Fidelity from its relationship with the fund; (iv) the extent to which economies of scale exist and would be realized as the fund grows; and (v) whether fee levels reflect these economies of scale, if any, for the benefit of fund shareholders.
In considering whether to renew the Advisory Contracts for the fund, the Board reached a determination, with the assistance of fund counsel and Independent Trustees' counsel and through the exercise of its business judgment, that the renewal of the Advisory Contracts was in the best interests of the fund and its shareholders and that the compensation payable under the Advisory Contracts was fair and reasonable. The Board's decision to renew the Advisory Contracts was not based on any single factor, but rather was based on a comprehensive consideration of all the information provided to the Board at its meetings throughout the year. The Board, in reaching its determination to renew the Advisory Contracts, was aware that shareholders in the fund have a broad range of investment choices available to them, including a wide choice among mutual funds offered by Fidelity's competitors, and that the fund's shareholders, who have the opportunity to review and weigh the disclosure provided by the fund in its prospectus and other public disclosures, have chosen to invest in this fund, which is a part of the Fidelity family of funds.
Annual Report
Nature, Extent, and Quality of Services Provided. The Board considered the staffing within the investment adviser, Fidelity Management & Research Company (FMR), and the sub-advisers (together, the Investment Advisers) as it relates to the fund, including the backgrounds of the fund's investment personnel, and also considered the fund's investment objective, strategies, and related investment philosophy. The Independent Trustees also had discussions with senior management of Fidelity's investment operations and investment groups. The Board considered the structure of the portfolio manager compensation program and whether this structure provides appropriate incentives to act in the best interests of the fund.
Resources Dedicated to Investment Management and Support Services. The Board and the Fund Oversight and Research Committees reviewed the general qualifications and capabilities of the Investment Advisers' investment staff, including its size, education, experience, and resources, as well as the Investment Advisers' approach to recruiting, training, managing, and compensating investment personnel. The Board noted that FMR has continued to increase the resources devoted to non-U.S. offices, including expansion of Fidelity's global investment organization. The Board also noted that Fidelity's analysts have extensive resources, tools and capabilities that allow them to conduct sophisticated quantitative and fundamental analysis, as well as credit analysis of issuers, counterparties and guarantors. Further, the Board believes that Fidelity's investment professionals have sufficient access to global information and data so as to provide competitive investment results over time, and that those professionals also have access to sophisticated tools that permit them to assess portfolio construction and risk and performance attribution characteristics continuously, as well as to transmit new information and research conclusions rapidly around the world. Additionally, in its deliberations, the Board considered the Investment Advisers' trading and risk management capabilities and resources, which are an integral part of the investment management process.
Shareholder and Administrative Services. The Board considered (i) the nature, extent, quality, and cost of advisory, administrative, and shareholder services performed by the Investment Advisers and their affiliates under the Advisory Contracts and under separate agreements covering transfer agency, pricing and bookkeeping, and securities lending services for the fund; (ii) the nature and extent of the supervision of third party service providers, principally custodians and subcustodians; and (iii) the resources devoted to, and the record of compliance with, the fund's compliance policies and procedures. The Board also reviewed the allocation of fund brokerage, including allocations to brokers affiliated with the Investment Advisers, the use of brokerage commissions to pay fund expenses, and the use of "soft" commission dollars to pay for research services.
Annual Report
Board Approval of Investment Advisory Contracts and
Management Fees - continued
The Board noted that the growth of fund assets over time across the complex allows Fidelity to reinvest in the development of services designed to enhance the value or convenience of the Fidelity funds as investment vehicles. These services include 24-hour access to account information and market information through telephone representatives and over the Internet, investor education materials and asset allocation tools, and the expanded availability of Fidelity Investor Centers.
Investment in a Large Fund Family. The Board considered the benefits to shareholders of investing in a Fidelity fund, including the benefits of investing in a fund that is part of a large family of funds offering a variety of investment disciplines and providing a large variety of mutual fund investor services. The Board noted that Fidelity had taken, or had made recommendations that resulted in the Fidelity funds taking, a number of actions over the previous year that benefited particular funds, including (i) continuing to dedicate additional resources to investment research and to the support of the senior management team that oversees asset management; (ii) persisting in efforts to enhance Fidelity's global research capabilities; (iii) launching new funds and making other enhancements to meet client needs for global and income-oriented solutions; (iv) continuing to launch dedicated lower cost underlying funds to meet portfolio construction needs related to expanding underlying fund options for Fidelity funds of funds, specifically for the Freedom Fund product lines; (v) rationalizing product lines and gaining increased efficiencies through the mergers of several funds into other funds; (vi) strengthening Fidelity's index fund offerings by reducing investment minimums and adopting or lowering existing expense caps for certain funds and classes; (vii) enhancing Global Asset Allocation product offerings by launching new funds and strategies, including "open architecture" target date funds that utilize affiliated and unaffiliated sub-advisers; (viii) modifying the eligibility criteria for Institutional Class shares of Advisor funds to increase their marketability to a portion of the defined contribution plan market; (ix) creating a new low-cost retirement share class for certain Advisor funds to appeal to large retirement plans; (x) transitioning the management of certain Fidelity commodity funds to Geode Capital Management LLC, a registered commodity pool operator, while retaining administrative responsibilities for the funds; (xi) reorganizing a number of funds; and (xii) taking steps toward establishing a new Fidelity adviser to manage sector-based funds and products.
Investment Performance. The Board considered whether the fund has operated in accordance with its investment objective, as well as its record of compliance with its investment restrictions and its performance history. The Board noted that there was a portfolio management change for the fund in September 2011.
Annual Report
The Board took into account discussions with the Investment Advisers about fund investment performance that occur at Board meetings throughout the year. In this regard the Board noted that as part of regularly scheduled fund reviews and other reports to the Board on fund performance, the Board periodically considers annualized return information for the fund, for different time periods, measured against a securities market index ("benchmark index") and a peer group of mutual funds with similar objectives ("peer group"). In its evaluation of fund investment performance, the Board gave particular attention to information indicating changes in performance of certain Fidelity funds for specific time periods and the Investment Advisers' explanations for any overperformance or underperformance.
In addition to reviewing absolute and relative fund performance, the Independent Trustees periodically consider the appropriateness of fund performance metrics in evaluating the results achieved. In general, the Independent Trustees believe that fund performance should be evaluated based on net performance (after fees and expenses) of both the highest performing and lowest performing classes, where applicable, compared to appropriate benchmark indices, over appropriate time periods which may include full market cycles, and compared to peer groups, as applicable, over the same periods, taking into account relevant factors including the following: general market conditions; issuer-specific information; tactical opportunities for investment; and fund cash flows and other factors.
The Independent Trustees recognize that shareholders evaluate performance on a net basis over their own holding periods, for which one-, three-, and five-year periods are used as a proxy. For this reason, the performance information reviewed by the Board also included net cumulative calendar year total return information for the fund and an appropriate benchmark index and peer group for the most recent one-, three-, and five-year periods, as shown below. Returns are shown compared to the 25th percentile (top of box) and 75th percentile (bottom of box) of the peer universe. Returns of the benchmark index are "net MA," i.e., adjusted for tax withholding rates applicable to U.S.-based mutual funds organized as Massachusetts business trusts.
Annual Report
Board Approval of Investment Advisory Contracts and
Management Fees - continued
Fidelity International Value Fund
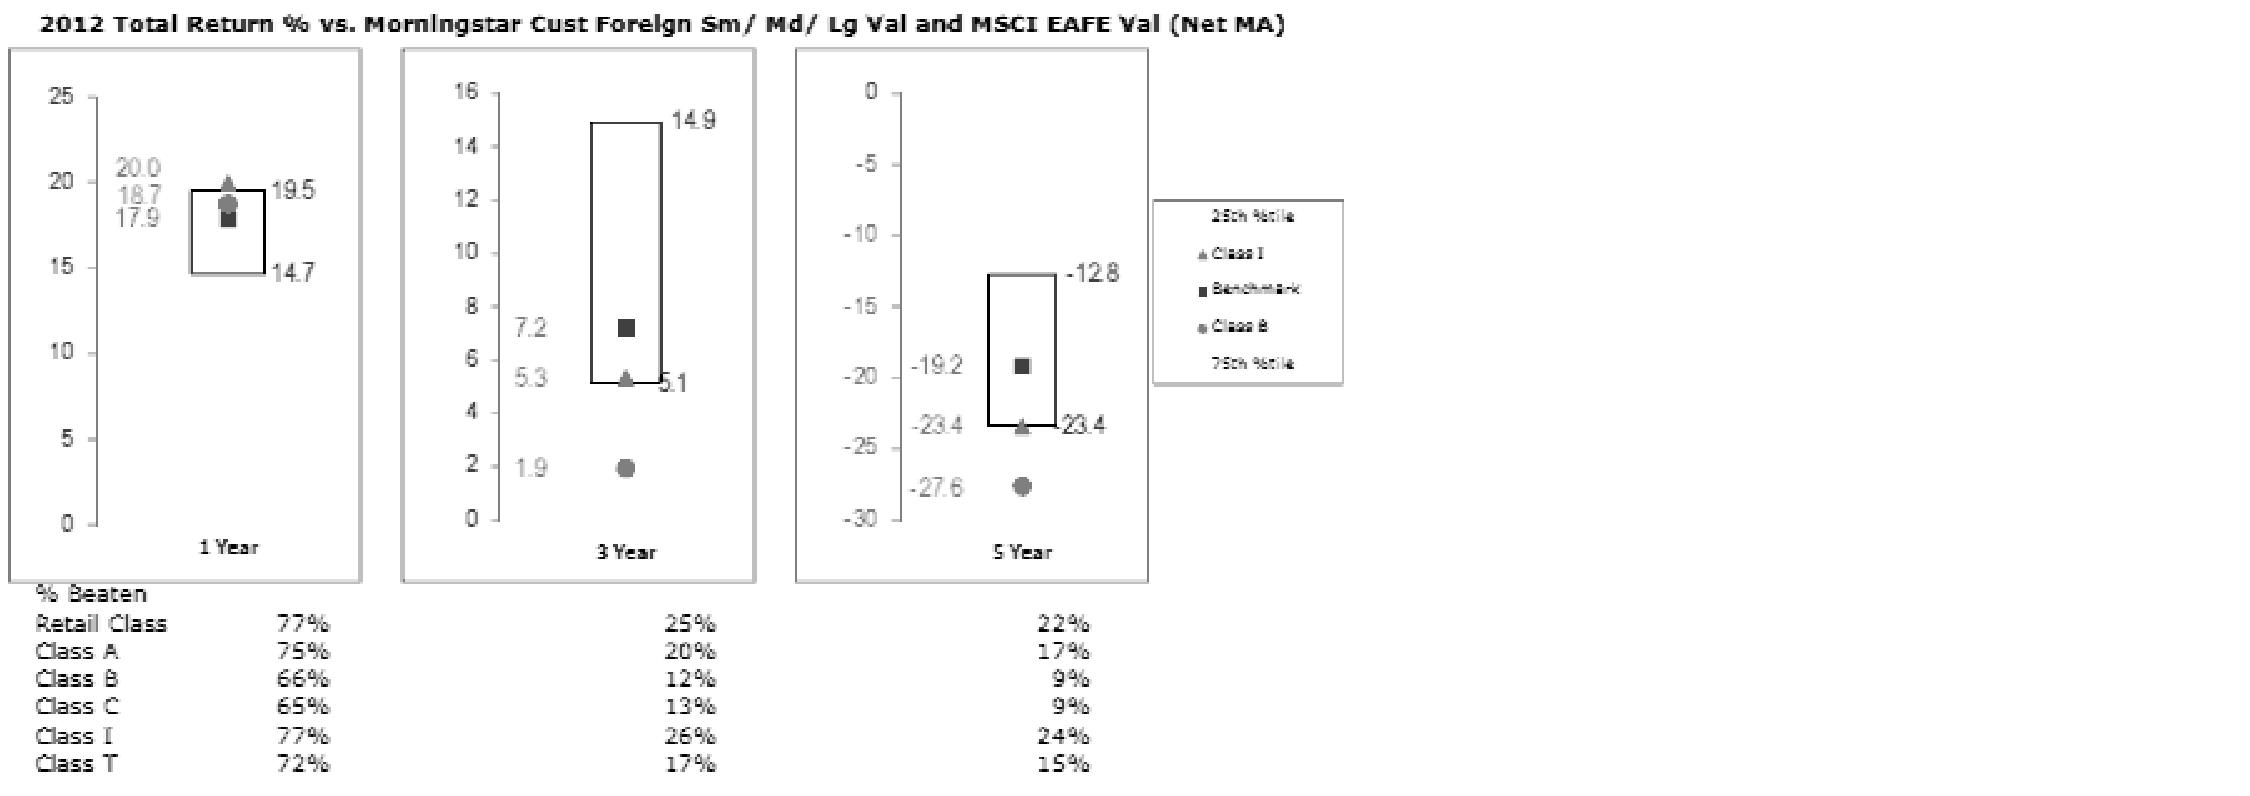
The Board also considered that the fund's management fee is subject to upward or downward adjustment depending upon whether, and to what extent, the fund's investment performance for the performance period exceeds, or is exceeded by, a securities index, thus leading to a performance adjustment for the same period. The Board noted that the performance adjustment provides FMR with a strong economic incentive to seek to achieve superior performance for the fund's shareholders and helps to more closely align the interests of FMR and the fund's shareholders.
Based on its review, the Board concluded that the nature, extent, and quality of services provided to the fund under the Advisory Contracts should benefit the fund's shareholders.
Competitiveness of Management Fee and Total Expense Ratio. The Board considered the fund's management fee and total expense ratio compared to "mapped groups" of competitive funds and classes. Fidelity creates "mapped groups" by combining similar Lipper investment objective categories that have comparable management fee characteristics. Combining Lipper investment objective categories aids the Board's management fee and total expense ratio comparisons by broadening the competitive group used for comparison and by reducing the number of universes to which various Fidelity funds are compared.
Management Fee. The Board considered two proprietary management fee comparisons for the 12-month periods shown in the chart below. The group of Lipper funds used by the Board for management fee comparisons is referred to below as the "Total Mapped Group." The Total Mapped Group comparison focuses on a fund's standing in terms of gross management fees before expense reimbursements or caps, and without giving effect to the fund's performance adjustment, relative to the total universe of funds with comparable investment mandates, regardless of whether their management fee structures also are comparable. Funds with comparable investment mandates offer exposure to similar types of securities. Funds with comparable management fee structures have similar management fee contractual arrangements (e.g., flat rate charged for advisory services, all-inclusive fee rate, etc.). "TMG %" represents the percentage of funds in the Total Mapped Group that had management fees that were lower than the fund's. For example, a TMG % of 16% means that 84% of the funds in the Total Mapped Group had higher management fees than the fund. The "Asset-Size Peer Group" (ASPG) comparison focuses on a fund's standing relative to a subset of non-Fidelity funds within the Total Mapped Group that are similar in size and management fee structure. The ASPG represents at least 15% of the funds in the Total Mapped Group with comparable asset size and management fee structures, subject to a minimum of 50 funds (or all funds in the Total Mapped Group if fewer than 50). Additional information, such as the ASPG quartile in which the fund's management fee ranked and the impact of the fund's performance adjustment, is also included in the chart and considered by the Board.
Annual Report
Fidelity International Value Fund
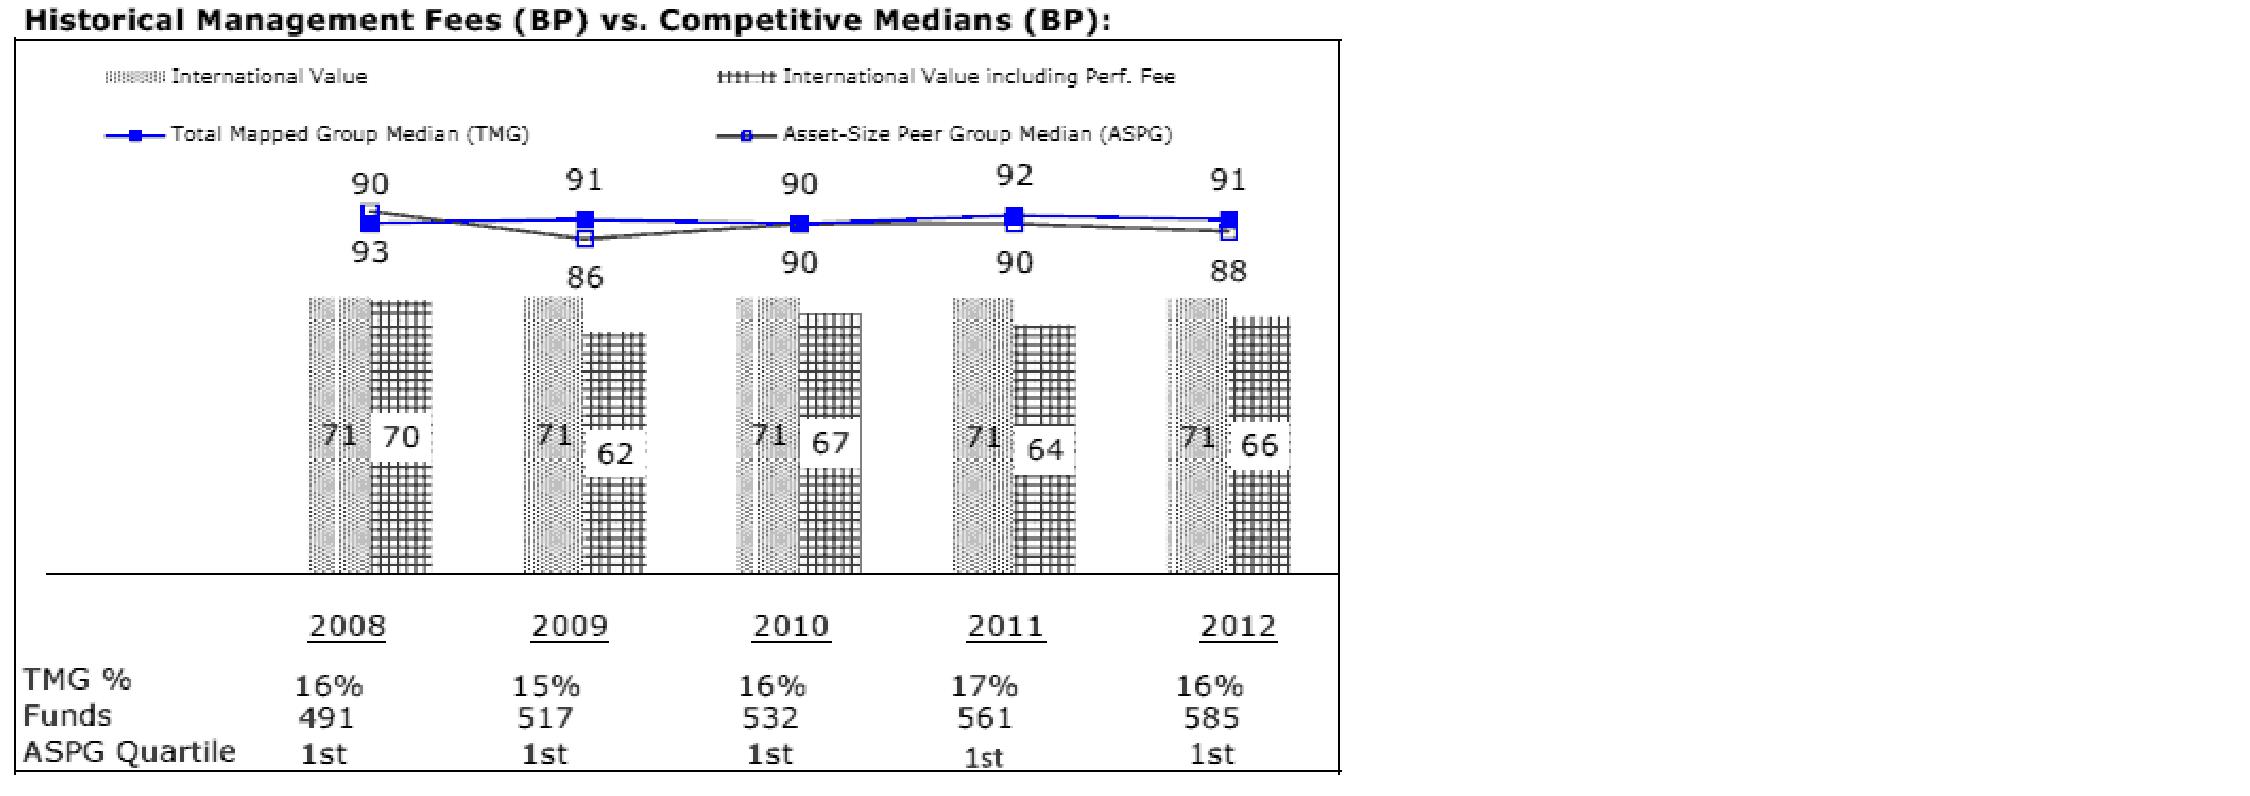
The Board noted that the fund's management fee ranked below the median of its Total Mapped Group and below the median of its ASPG for 2012. The Board also noted the effect of the fund's negative performance adjustment on the fund's management fee ranking.
Annual Report
Board Approval of Investment Advisory Contracts and
Management Fees - continued
Based on its review, the Board concluded that the fund's management fee is fair and reasonable in light of the services that the fund receives and the other factors considered.
Total Expense Ratio. In its review of each class's total expense ratio, the Board considered the fund's management fee as well as other fund or class expenses, as applicable, such as transfer agent fees, pricing and bookkeeping fees, fund-paid 12b-1 fees, and custodial, legal, and audit fees. The Board also noted the effects of any waivers and reimbursements on fees and expenses, as well as the impact of the fund's performance adjustment. As part of its review, the Board also considered the current and historical total expense ratios of each class of the fund compared to competitive fund median expenses. Each class of the fund is compared to those funds and classes in the Total Mapped Group (used by the Board for management fee comparisons) that have a similar sales load structure.
The Board noted that the total expense ratio of each of Class A, Class B, Institutional Class, and the retail class ranked below its competitive median for 2012 and the total expense ratio of each of Class T and Class C ranked above its competitive median for 2012. The Board considered that, in general, various factors can affect total expense ratios. The Board noted that the total expense ratio of Class T was above the competitive median primarily because of higher 12b-1 fees on Class T. Class T has a higher 12b-1 fee, but a lower front-end sales charge, than traditionally priced front-end sales charge classes. The Board considered that Class T is primarily sold load-waived in the retirement plan market where its 0.50% 12b-1 fee is comparable to competing no-load, higher 12b-1 fee classes designed specifically for retirement plans. The Board noted that the fund offers multiple classes, each of which has a different sales load and 12b-1 fee structure, and that the multiple structures are intended to offer a range of pricing options for the intermediary market. The Board also noted that the total expense ratios of the classes vary primarily by the level of their 12b-1 fees, although differences in transfer agent fees may also cause expenses to vary from class to class.
Fees Charged to Other Fidelity Clients. The Board also considered Fidelity fee structures and other information with respect to clients of FMR and its affiliates, such as other mutual funds advised or subadvised by FMR or its affiliates, pension plan clients, and other institutional clients. The Board noted the findings of the 2013 ad hoc joint committee (created with the board of other Fidelity funds), which reviewed and compared Fidelity's institutional investment advisory business with its business of providing services to the Fidelity funds, including the differences in services provided, fees charged, and costs incurred, as well as competition in their respective marketplaces.
Based on its review of total expense ratios and fees charged to other Fidelity clients, the Board concluded that the total expense ratio of each class of the fund was reasonable, although in some cases above the median of the universe presented for comparison, in light of the services that the fund and its shareholders receive and the other factors considered.
Annual Report
Costs of the Services and Profitability. The Board considered the revenues earned and the expenses incurred by Fidelity in conducting the business of developing, marketing, distributing, managing, administering and servicing the fund and servicing the fund's shareholders. The Board also considered the level of Fidelity's profits in respect of all the Fidelity funds.
On an annual basis, FMR presents to the Board Fidelity's profitability for the fund. Fidelity calculates the profitability for each fund, as well as aggregate profitability for groups of Fidelity funds and all Fidelity funds, using a series of detailed revenue and cost allocation methodologies which originate with the books and records of Fidelity on which Fidelity's audited financial statements are based. The Audit Committee of the Board reviews any significant changes from the prior year's methodologies.
PricewaterhouseCoopers LLP (PwC), independent registered public accounting firm and auditor to Fidelity and certain Fidelity funds, has been engaged annually by the Board as part of the Board's assessment of Fidelity's profitability analysis. PwC's engagement includes the review and assessment of the methodologies used by Fidelity in determining the revenues and expenses attributable to Fidelity's mutual fund business, and completion of agreed-upon procedures surrounding the mathematical accuracy of fund profitability and its conformity to allocation methodologies. After considering PwC's reports issued under the engagement and information provided by Fidelity, the Board concluded that while other allocation methods may also be reasonable, Fidelity's profitability methodologies are reasonable in all material respects.
The Board also reviewed Fidelity's non-fund businesses and fall-out benefits related to the mutual fund business as well as cases where Fidelity's affiliates may benefit from or be related to the fund's business.
The Board considered the costs of the services provided by and the profits realized by Fidelity in connection with the operation of the fund and was satisfied that the profitability was not excessive in the circumstances.
Economies of Scale. The Board considered whether there have been economies of scale in respect of the management of the Fidelity funds, whether the Fidelity funds (including the fund) have appropriately benefited from any such economies of scale, and whether there is potential for realization of any further economies of scale. The Board considered the extent to which the fund will benefit from economies of scale through increased services to the fund, through waivers or reimbursements, or through fee or expense reductions. The Board also noted that in 2009, it and the board of other Fidelity funds created an ad hoc committee (the Economies of Scale Committee) to analyze whether FMR attains economies of scale in respect of the management and servicing of the Fidelity funds, whether the Fidelity funds have appropriately benefited from such economies of scale, and whether there is potential for realization of any further economies of scale.
Annual Report
Board Approval of Investment Advisory Contracts and
Management Fees - continued
The Board recognized that the fund's management contract incorporates a "group fee" structure, which provides for lower group fee rates as total fund assets under FMR's management increase, and for higher group fee rates as total fund assets under FMR's management decrease. FMR calculates the group fee rates based on a tiered asset "breakpoint" schedule that varies based on asset class. The Board considered that the group fee is designed to deliver the benefits of economies of scale to fund shareholders when total Fidelity fund assets increase, even if assets of any particular fund are unchanged or have declined, because some portion of Fidelity's costs are attributable to services provided to all Fidelity funds, and all funds benefit if those costs can be allocated among more assets. The Board concluded that, given the group fee structure, fund shareholders will benefit from lower management fees as assets under FMR's management increase at the fund complex level, regardless of whether Fidelity achieves any such economies of scale.
The Board concluded, taking into account the analysis of the Economies of Scale Committee, that economies of scale, if any, are being appropriately shared between fund shareholders and Fidelity.
Amendment to Description of Group Fee Rate. At its July 2013 meeting, the Board voted to approve an amendment to the fund's management contract to modify the description of the "group fee rate" effective August 1, 2013. The Board noted that under the prior description in the contract, the group fee rate was based on the average net assets of all registered investment companies with which FMR has management contracts. Under the contract's tiered asset breakpoint schedule, the group fee rate is lower as total fund assets under FMR's management increase, and higher as total fund assets under FMR's management decrease. The Board considered that the prior description would have excluded the assets of 64 Fidelity sector funds from the group fee rate calculation once Fidelity SelectCo, LLC, an affiliate of FMR, assumed management responsibilities for those funds. The Board noted that modifying the description of the group fee rate to continue to include the assets of those 64 funds for purposes of determining group fee rate breakpoints would avoid an immediate adverse impact on the group fee rate for any fund.
Additional Information Requested by the Board. In order to develop fully the factual basis for consideration of the Fidelity funds' Advisory Contracts, the Board requested and received additional information on certain topics, including: (i) fund performance trends and Fidelity's long-term strategies for certain funds; (ii) the potential to further rationalize the Fidelity fund lineup with the possibility of achieving savings for the funds and Fidelity; (iii) the methodology with respect to competitive fund data and peer group classifications; (iv) the arrangements with, and performance of, certain sub-advisers on behalf of the Fidelity funds, as well as certain proposed participating affiliate arrangements; (v) the realization of fall-out benefits in certain Fidelity business units; (vi) Fidelity's group fee structures, including the rationale for the individual fee rates of certain categories of funds and the definition of group assets; (vii) trends regarding industry use of performance fee structures and the performance adjustment methodologies applicable to the Fidelity funds; (viii) additional competitive analysis regarding the total expenses for certain classes; and (ix) fund profitability methodology, including Fidelity's cost allocation methodology, and the impact of certain factors on fund profitability results.
Annual Report
Based on its evaluation of all of the conclusions noted above, and after considering all factors it believed relevant, the Board ultimately concluded that the advisory fee structures are fair and reasonable, and that the fund's Advisory Contracts should be renewed.
Annual Report
Investment Adviser
Fidelity Management & Research Company
Boston, MA
Investment Sub-Advisers
FMR Co., Inc.
Fidelity Management & Research
(U.K.) Inc.
Fidelity Management & Research
(Hong Kong) Limited
Fidelity Management & Research
(Japan) Inc.
FIL Investment Advisors
FIL Investment Advisors (U.K.) Limited
FIL Investments (Japan) Limited
General Distributor
Fidelity Distributors Corporation
Smithfield, RI
Transfer and Service Agents
Fidelity Investments Institutional Operations Company, Inc.
Boston, MA
Fidelity Service Company, Inc.
Boston, MA
Custodian
The Northern Trust Company
Chicago, IL
(Fidelity Investment logo)(registered trademark)
AFIVI-UANN-1213
1.827488.107
Fidelity®
Total International Equity
Fund
Annual Report
October 31, 2013
(Fidelity Cover Art)
Contents
Performance | (Click Here) | How the fund has done over time. |
Management's Discussion of Fund Performance | (Click Here) | The Portfolio Manager's review of fund performance and strategy. |
Shareholder Expense Example | (Click Here) | An example of shareholder expenses. |
Investment Changes | (Click Here) | A summary of major shifts in the fund's investments over the past six months. |
Investments | (Click Here) | A complete list of the fund's investments with their market values. |
Financial Statements | (Click Here) | Statements of assets and liabilities, operations, and changes in net assets, as well as financial highlights. |
Notes | (Click Here) | Notes to the financial statements. |
Report of Independent Registered Public Accounting Firm | (Click Here) | |
Trustees and Officers | (Click Here) | |
Distributions | (Click Here) | |
Board Approval of Investment Advisory Contracts and Management Fees | (Click Here) | |
To view a fund's proxy voting guidelines and proxy voting record for the 12-month period ended June 30, visit http://www.fidelity.com/proxyvotingresults or visit the Securities and Exchange Commission's (SEC) web site at http://www.sec.gov. You may also call 1-800-544-8544 to request a free copy of the proxy voting guidelines.
Standard & Poor's, S&P and S&P 500 are registered service marks of The McGraw-Hill Companies, Inc. and have been licensed for use by Fidelity Distributors Corporation.
Other third-party marks appearing herein are the property of their respective owners.
All other marks appearing herein are registered or unregistered trademarks or service marks of FMR LLC or an affiliated company. © 2013 FMR LLC. All rights reserved.
Annual Report
This report and the financial statements contained herein are submitted for the general information of the shareholders of the fund. This report is not authorized for distribution to prospective investors in the fund unless preceded or accompanied by an effective prospectus.
A fund files its complete schedule of portfolio holdings with the SEC for the first and third quarters of each fiscal year on Form N-Q. Forms N-Q are available on the SEC's web site at http://www.sec.gov. A fund's Forms N-Q may be reviewed and copied at the SEC's Public Reference Room in Washington, DC. Information regarding the operation of the SEC's Public Reference Room may be obtained by calling 1-800-SEC-0330. For a complete list of a fund's portfolio holdings, view the most recent holdings listing, semiannual report, or annual report on Fidelity's web site at http://www.fidelity.com, http://www.advisor.fidelity.com, or http://www.401k.com, as applicable.
NOT FDIC INSURED • MAY LOSE VALUE • NO BANK GUARANTEE
Neither the fund nor Fidelity Distributors Corporation is a bank.
Annual Report
Average annual total return reflects the change in the value of an investment, assuming reinvestment of the class' distributions from dividend income and capital gains (the profits earned upon the sale of securities that have grown in value, if any) and assuming a constant rate of performance each year. The $10,000 table and the fund's returns do not reflect the deduction of taxes that a shareholder would pay on fund distributions or the redemption of fund shares. During periods of reimbursement by Fidelity, a fund's total return will be greater than it would be had the reimbursement not occurred. How a fund did yesterday is no guarantee of how it will do tomorrow.
Average Annual Total Returns
Periods ended October 31, 2013 | Past 1
year | Past 5
years | Life of
fund A |
Fidelity® Total International Equity Fund | 19.48% | 13.86% | -1.02% |
A From November 1, 2007.
$10,000 Over Life of Fund
Let's say hypothetically that $10,000 was invested in Fidelity® Total International Equity Fund, a class of the fund, on November 1, 2007, when the fund started. The chart shows how the value of your investment would have changed, and also shows how the MSCI® ACWI® (All Country World Index) ex USA Index performed over the same period.
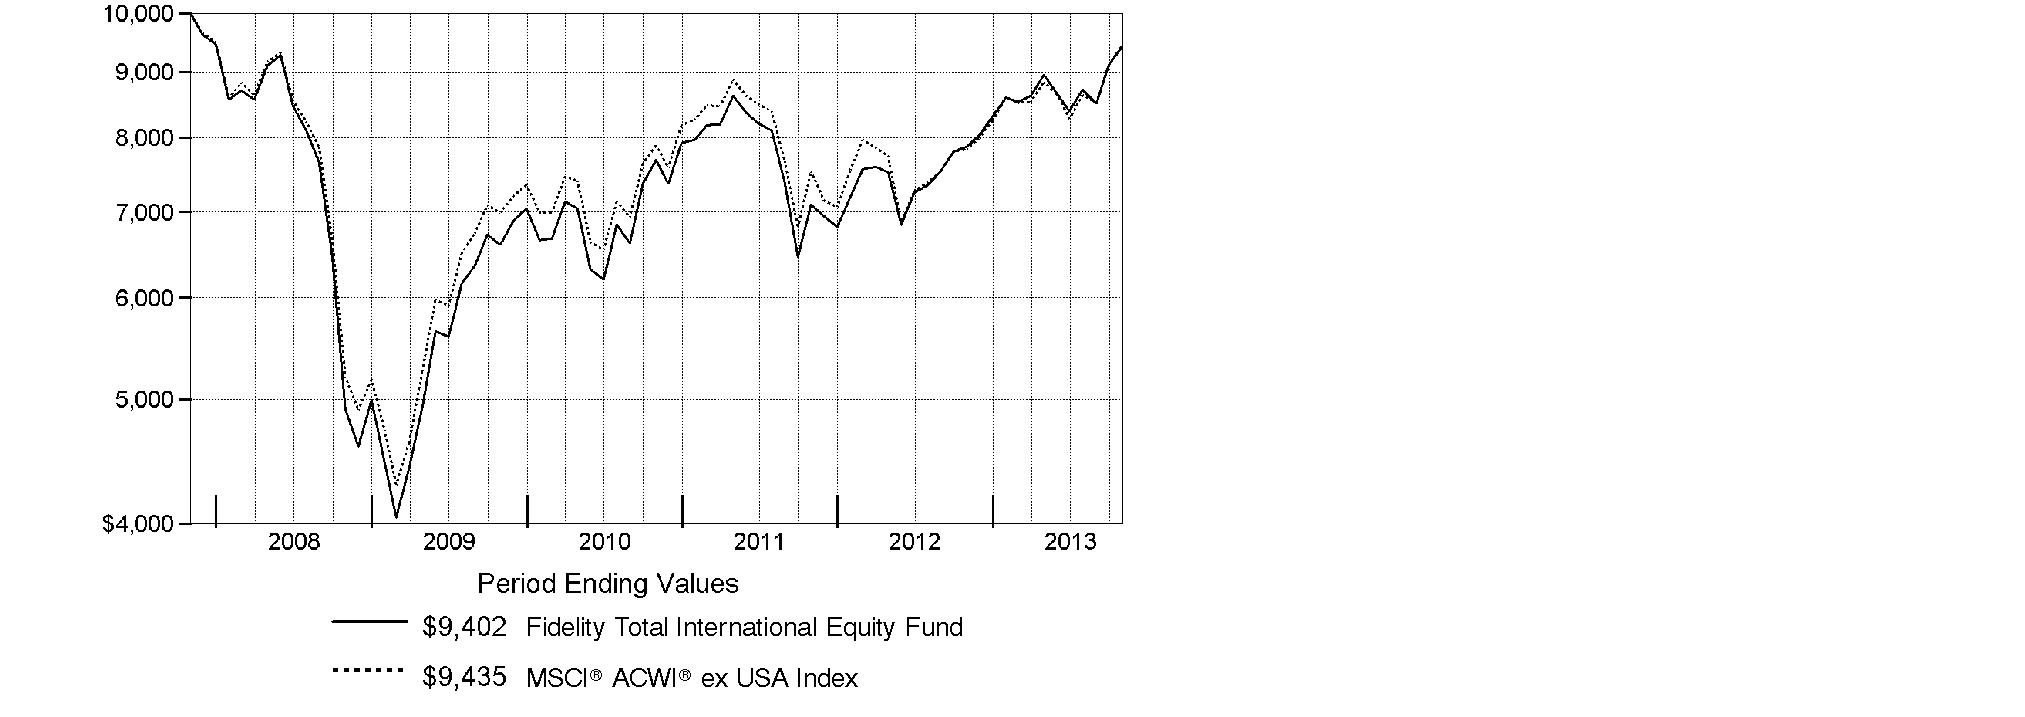
Annual Report
Market Recap: On balance, global equity markets remained upbeat for the 12-month period ending October 31, 2013. The MSCI® ACWI® (All Country World Index) Index gained 23.75% for the period, amid investor preference for higher-risk assets. The period was not without turbulence, however. In the spring and summer, central banks worldwide, especially in the U.S. and China, made clear their intentions to maintain accommodative monetary policies. That stance, combined with modest cyclical improvements around the globe and generally low valuations, underpinned the broad rally in equities. Europe (+32%) shone brightly, with most markets in the region - large and small - registering solid, index-beating gains. Another bright spot was Japan, which, despite a struggling yen and taking a second-half breather, posted a 34% result for the full year. The U.S. - by far the index's biggest constituent - also outperformed the global market with a roughly 28% advance. Meanwhile, Asia-Pacific ex Japan (+14%) lagged, hurt in part by a slowdown in Australia's mining industry as well as currency headwinds. Foreign-exchange and commodity weakness also curbed results in resource-heavy Canada and emerging markets (EM), both of which were up 7%. Country-level EM performance diverged meaningfully for the period, as evidenced by performance in Brazil (-1%), Russia (+12%), India (+1%) and China (+8%).
Comments from Jed Weiss, Co-Portfolio Manager of Fidelity® Total International Equity Fund: For the year, the fund's Retail Class shares gained 19.48%, trailing the 20.42% advance the MSCI® ACWI® (All Country World Index) ex USA Index. On a relative basis, the fund was hurt the most by disappointing stock selection in Europe ex U.K. On the positive side, the fund's investments in U.S.-based companies proved helpful, as did a big underweighting in poor-performing Canada. On an individual basis, the biggest relative detractor was Japanese automaker Toyota Motor, a strong-performing benchmark component we mostly avoided. Instead, we opted to hold DENSO, a Japanese auto-parts supplier, and its relative contribution offset some of the negative impact from our Toyota underweighting. Several of the fund's notable detractors were emerging-markets stocks, including South Africa-based gold miner AngloGold Ashanti - which we sold in May - and China Food, an out-of-index bottler of Coca-Cola beverages in China, as well as a distributor of wine. On the positive side, Dutch semiconductor company ASML Holding, a dominant player in the market for lithography, was a strong relative contributor, as was Sands China, a Hong Kong-listed casino operator.
The views expressed above reflect those of the portfolio manager(s) only through the end of the period as stated on the cover of this report and do not necessarily represent the views of Fidelity or any other person in the Fidelity organization. Any such views are subject to change at any time based upon market or other conditions and Fidelity disclaims any responsibility to update such views. These views may not be relied on as investment advice and, because investment decisions for a Fidelity fund are based on numerous factors, may not be relied on as an indication of trading intent on behalf of any Fidelity fund.
Annual Report
Shareholder Expense Example
As a shareholder of the Fund, you incur two types of costs: (1) transaction costs, including sales charges (loads) on purchase payments or redemption proceeds, redemption fees and (2) ongoing costs, including management fees, distribution and/or service (12b-1) fees and other Fund expenses. This Example is intended to help you understand your ongoing costs (in dollars) of investing in the Fund and to compare these costs with the ongoing costs of investing in other mutual funds.
The Example is based on an investment of $1,000 invested at the beginning of the period and held for the entire period (May 1, 2013 to October 31, 2013).
Actual Expenses
The first line of the accompanying table for each class of the Fund provides information about actual account values and actual expenses. You may use the information in this line, together with the amount you invested, to estimate the expenses that you paid over the period. Simply divide your account value by $1,000.00 (for example, an $8,600 account value divided by $1,000.00 = 8.6), then multiply the result by the number in the first line for a class of the Fund under the heading entitled "Expenses Paid During Period" to estimate the expenses you paid on your account during this period. A small balance maintenance fee of $12.00 that is charged once a year may apply for certain accounts with a value of less than $2,000. This fee is not included in the table below. If it was, the estimate of expenses you paid during the period would be higher, and your ending account value lower, by this amount. In addition, the Fund, as a shareholder in the underlying Fidelity Central Funds, will indirectly bear its pro-rata share of the fees and expenses incurred by the underlying Fidelity Central Funds. These fees and expenses are not included in the Fund's annualized expense ratio used to calculate the expense estimate in the table below.
Hypothetical Example for Comparison Purposes
The second line of the accompanying table for each class of the Fund provides information about hypothetical account values and hypothetical expenses based on a Class' actual expense ratio and an assumed rate of return of 5% per year before expenses, which is not the Class' actual return. The hypothetical account values and expenses may not be used to estimate the actual ending account balance or expenses you paid for the period. You may use this information to compare the ongoing costs of investing in the Fund and other funds. To do so, compare this 5% hypothetical example with the 5% hypothetical examples that appear in the shareholder reports of the other funds. A small balance maintenance fee of $12.00 that is charged once a year may apply for certain accounts with a value of less than $2,000. This fee is not included in the table below. If it was, the estimate of expenses you paid during the period would be higher, and your ending account value lower, by this amount. In addition, the Fund, as a shareholder in the underlying Fidelity Central Funds, will indirectly bear its pro-rata share of the fees and expenses incurred by the underlying Fidelity Central Funds. These fees and expenses are not included in the Fund's annualized expense ratio used to calculate the expense estimate in the table below.
Please note that the expenses shown in the table are meant to highlight your ongoing costs only and do not reflect any transaction costs. Therefore, the second line of the table is useful in comparing ongoing costs only, and will not help you determine the relative total costs of owning different funds. In addition, if these transactional costs were included, your costs would have been higher.
Annual Report
Shareholder Expense Example - continued
| Annualized
Expense RatioB | Beginning
Account Value
May 1, 2013 | Ending
Account Value
October 31, 2013 | Expenses Paid
During Period*
May 1, 2013
to October 31, 2013 |
Class A | 1.45% | | | |
Actual | | $ 1,000.00 | $ 1,048.20 | $ 7.49 |
HypotheticalA | | $ 1,000.00 | $ 1,017.90 | $ 7.38 |
Class T | 1.70% | | | |
Actual | | $ 1,000.00 | $ 1,047.90 | $ 8.78 |
HypotheticalA | | $ 1,000.00 | $ 1,016.64 | $ 8.64 |
Class B | 2.19% | | | |
Actual | | $ 1,000.00 | $ 1,044.00 | $ 11.28 |
HypotheticalA | | $ 1,000.00 | $ 1,014.17 | $ 11.12 |
Class C | 2.20% | | | |
Actual | | $ 1,000.00 | $ 1,045.50 | $ 11.34 |
HypotheticalA | | $ 1,000.00 | $ 1,014.12 | $ 11.17 |
Total International Equity | 1.10% | | | |
Actual | | $ 1,000.00 | $ 1,050.70 | $ 5.69 |
HypotheticalA | | $ 1,000.00 | $ 1,019.66 | $ 5.60 |
Institutional Class | 1.20% | | | |
Actual | | $ 1,000.00 | $ 1,050.90 | $ 6.20 |
HypotheticalA | | $ 1,000.00 | $ 1,019.16 | $ 6.11 |
A 5% return per year before expenses
B Annualized expense ratio reflects expenses net of applicable fee waivers.
* Expenses are equal to each Class' annualized expense ratio, multiplied by the average account value over the period, multiplied by 184/365 (to reflect the one-half year period).
Annual Report
Investment Changes (Unaudited)
Geographic Diversification (% of fund's net assets) |
As of October 31, 2013 |
 | United Kingdom 16.7% | |
 | Japan 14.4% | |
 | United States of America* 7.3% | |
 | France 7.1% | |
 | Switzerland 6.8% | |
 | Germany 5.2% | |
 | Australia 3.8% | |
 | India 3.0% | |
 | Korea (South) 2.7% | |
 | Other 33.0% | |

Percentages are based on country or territory of incorporation and are adjusted for the effect of futures contracts, if applicable. |
* Includes Short-Term Investments and Net Other Assets (Liabilities) |
As of April 30, 2013 |
| United Kingdom 17.0% | |
| Japan 12.6% | |
| United States of America* 7.8% | |
| Switzerland 6.9% | |
| Germany 4.6% | |
| Australia 4.5% | |
| France 4.3% | |
| Taiwan 3.9% | |
| India 3.1% | |
| Other 35.3% | |

Percentages are based on country or territory of incorporation and are adjusted for the effect of futures contracts, if applicable. |
* Includes Short-Term Investments and Net Other Assets (Liabilities) |
Asset Allocation as of October 31, 2013 |
| % of fund's
net assets | % of fund's net assets
6 months ago |
Stocks | 98.4 | 97.7 |
Short-Term Investments and Net Other Assets (Liabilities) | 1.6 | 2.3 |
Top Ten Stocks as of October 31, 2013 |
| % of fund's
net assets | % of fund's net assets
6 months ago |
Nestle SA (Switzerland, Food Products) | 1.6 | 1.9 |
Roche Holding AG (participation certificate) (Switzerland, Pharmaceuticals) | 1.5 | 1.3 |
Sanofi SA (France, Pharmaceuticals) | 1.5 | 1.6 |
Anheuser-Busch InBev SA NV (Belgium, Beverages) | 1.4 | 1.2 |
HSBC Holdings PLC sponsored ADR (United Kingdom, Commercial Banks) | 1.3 | 1.4 |
Total SA (France, Oil, Gas & Consumable Fuels) | 1.3 | 0.0 |
UBS AG (NY Shares) (Switzerland, Capital Markets) | 1.3 | 1.0 |
DENSO Corp. (Japan, Auto Components) | 1.2 | 1.1 |
Vodafone Group PLC sponsored ADR (United Kingdom, Wireless Telecommunication Services) | 1.2 | 1.2 |
Novartis AG (Switzerland, Pharmaceuticals) | 1.1 | 1.1 |
| 13.4 | |
Market Sectors as of October 31, 2013 |
| % of fund's
net assets | % of fund's net assets
6 months ago |
Financials | 24.3 | 22.5 |
Consumer Staples | 13.8 | 14.8 |
Consumer Discretionary | 13.2 | 11.9 |
Industrials | 12.9 | 12.6 |
Health Care | 9.3 | 9.3 |
Materials | 6.3 | 7.6 |
Telecommunication Services | 5.9 | 4.4 |
Information Technology | 5.9 | 6.3 |
Energy | 4.5 | 5.1 |
Utilities | 2.3 | 3.2 |
Annual Report
Investments October 31, 2013
Showing Percentage of Net Assets
Common Stocks - 97.6% |
| Shares | | Value |
Australia - 3.8% |
Ansell Ltd. | 31,550 | | $ 581,182 |
Australia & New Zealand Banking Group Ltd. | 89,158 | | 2,851,618 |
Coca-Cola Amatil Ltd. | 85,155 | | 1,038,247 |
CSL Ltd. | 33,066 | | 2,172,037 |
Imdex Ltd. | 41,667 | | 28,355 |
Ramsay Health Care Ltd. | 2,307 | | 84,602 |
RCG Corp. Ltd. | 60,000 | | 41,965 |
Sydney Airport unit | 173,635 | | 687,626 |
Telstra Corp. Ltd. | 217,906 | | 1,066,841 |
Transurban Group unit | 170,303 | | 1,142,829 |
Westfield Group unit | 64,761 | | 662,280 |
Westpac Banking Corp. | 89,139 | | 2,888,923 |
TOTAL AUSTRALIA | | 13,246,505 |
Austria - 0.5% |
Andritz AG | 24,961 | | 1,537,626 |
Zumtobel AG | 3,700 | | 66,137 |
TOTAL AUSTRIA | | 1,603,763 |
Bailiwick of Guernsey - 0.0% |
Resolution Ltd. | 28,414 | | 162,828 |
Bailiwick of Jersey - 0.6% |
Informa PLC | 157,001 | | 1,408,460 |
Wolseley PLC | 12,400 | | 668,239 |
TOTAL BAILIWICK OF JERSEY | | 2,076,699 |
Belgium - 2.3% |
Anheuser-Busch InBev SA NV | 47,671 | | 4,941,754 |
Gimv NV | 1,919 | | 97,186 |
KBC Ancora (a) | 3,381 | | 110,127 |
KBC Groupe SA | 29,097 | | 1,586,184 |
UCB SA | 7,688 | | 505,426 |
Umicore SA | 17,794 | | 848,855 |
TOTAL BELGIUM | | 8,089,532 |
Bermuda - 1.9% |
China Foods Ltd. | 1,106,000 | | 502,144 |
Credicorp Ltd. | 7,500 | | 1,024,500 |
Dairy Farm International Holdings Ltd. | 45,900 | | 520,047 |
Hongkong Land Holdings Ltd. | 87,000 | | 535,920 |
Lazard Ltd. Class A | 15,900 | | 614,535 |
Li & Fung Ltd. | 342,000 | | 483,467 |
Common Stocks - continued |
| Shares | | Value |
Bermuda - continued |
Shangri-La Asia Ltd. | 414,000 | | $ 758,261 |
Texwinca Holdings Ltd. | 806,000 | | 824,401 |
Trinity Ltd. | 930,000 | | 347,865 |
Yue Yuen Industrial (Holdings) Ltd. | 339,000 | | 931,343 |
TOTAL BERMUDA | | 6,542,483 |
Brazil - 2.2% |
Arezzo Industria e Comercio SA | 2,500 | | 37,385 |
Banco Bradesco SA | 77,610 | | 1,244,074 |
BM&F Bovespa SA | 150,900 | | 850,758 |
BTG Pactual Participations Ltd. unit | 47,700 | | 638,143 |
Companhia de Bebidas das Americas (AmBev) | 300 | | 11,175 |
Fleury SA | 67,700 | | 524,326 |
Hypermarcas SA | 84,400 | | 736,550 |
Iguatemi Empresa de Shopping Centers SA | 50,500 | | 580,473 |
Souza Cruz SA | 61,400 | | 664,102 |
Telefonica Brasil SA | 28,500 | | 561,553 |
Terna Participacoes SA unit | 51,600 | | 500,982 |
Tractebel Energia SA | 46,900 | | 797,648 |
Weg SA | 48,000 | | 623,516 |
TOTAL BRAZIL | | 7,770,685 |
British Virgin Islands - 0.0% |
Gem Diamonds Ltd. (a) | 18,923 | | 48,394 |
Canada - 0.1% |
Pason Systems, Inc. | 6,400 | | 133,015 |
ShawCor Ltd. Class A | 1,500 | | 63,056 |
TAG Oil Ltd. (a)(c) | 9,800 | | 39,852 |
TOTAL CANADA | | 235,923 |
Cayman Islands - 1.6% |
Ginko International Co. Ltd. | 20,000 | | 381,179 |
Gourmet Master Co. Ltd. | 96,000 | | 639,239 |
Hengan International Group Co. Ltd. | 50,000 | | 612,344 |
Lifestyle International Holdings Ltd. | 51,000 | | 111,170 |
Sands China Ltd. | 281,400 | | 1,999,889 |
SITC International Holdings Co. Ltd. | 1,087,000 | | 459,868 |
Wynn Macau Ltd. | 355,200 | | 1,362,982 |
TOTAL CAYMAN ISLANDS | | 5,566,671 |
Chile - 1.5% |
Cencosud SA | 175,326 | | 715,303 |
Common Stocks - continued |
| Shares | | Value |
Chile - continued |
Compania Cervecerias Unidas SA sponsored ADR | 35,855 | | $ 956,970 |
Embotelladora Andina SA sponsored ADR | 18,000 | | 615,600 |
Empresa Nacional de Telecomunicaciones SA (ENTEL) | 46,696 | | 718,603 |
Inversiones Aguas Metropolitanas SA | 254,947 | | 472,815 |
Parque Arauco SA | 285,766 | | 551,728 |
Quinenco SA | 275,436 | | 736,647 |
Quinenco SA rights 11/5/13 (a) | 65,950 | | 25,749 |
Sociedad Matriz SAAM SA | 5,792,804 | | 582,277 |
TOTAL CHILE | | 5,375,692 |
China - 0.7% |
China Communications Services Corp. Ltd. (H Shares) | 790,000 | | 484,006 |
China Pacific Insurance Group Co. Ltd. (H Shares) | 185,800 | | 671,018 |
China Telecom Corp. Ltd. (H Shares) | 1,202,000 | | 627,871 |
Shandong Weigao Medical Polymer Co. Ltd. (H Shares) | 536,000 | | 503,299 |
TOTAL CHINA | | 2,286,194 |
Denmark - 0.9% |
A.P. Moller - Maersk A/S Series B | 81 | | 783,716 |
Jyske Bank A/S (Reg.) (a) | 1,654 | | 93,370 |
Novo Nordisk A/S Series B sponsored ADR | 14,000 | | 2,333,380 |
Spar Nord Bank A/S (a) | 11,331 | | 101,073 |
TOTAL DENMARK | | 3,311,539 |
Finland - 1.0% |
Nokia Corp. (a) | 77,916 | | 592,223 |
Nokian Tyres PLC | 29,458 | | 1,490,673 |
Sampo Oyj (A Shares) | 26,099 | | 1,236,359 |
Tikkurila Oyj | 3,580 | | 92,792 |
TOTAL FINLAND | | 3,412,047 |
France - 7.1% |
Arkema SA | 7,278 | | 826,308 |
Atos Origin SA | 10,134 | | 865,193 |
BNP Paribas SA | 33,579 | | 2,486,582 |
Cap Gemini SA | 11,002 | | 723,744 |
Carrefour SA | 26,773 | | 980,751 |
Danone SA | 18,480 | | 1,370,482 |
GDF Suez | 51,369 | | 1,279,146 |
Havas SA | 70,377 | | 586,322 |
Kering SA | 3,113 | | 707,334 |
Laurent-Perrier Group SA | 859 | | 80,254 |
Remy Cointreau SA | 6,481 | | 639,553 |
Common Stocks - continued |
| Shares | | Value |
France - continued |
Renault SA | 10,870 | | $ 952,086 |
Safran SA | 21,914 | | 1,400,657 |
Saft Groupe SA | 2,521 | | 80,027 |
Sanofi SA | 49,051 | | 5,229,976 |
Schneider Electric SA | 4,741 | | 399,422 |
Total SA | 74,087 | | 4,545,458 |
Vetoquinol SA | 1,500 | | 59,714 |
Virbac SA | 410 | | 82,472 |
Vivendi SA | 52,852 | | 1,341,550 |
TOTAL FRANCE | | 24,637,031 |
Germany - 4.6% |
Allianz SE | 11,227 | | 1,888,665 |
alstria office REIT-AG | 2,900 | | 36,768 |
BASF AG | 23,711 | | 2,466,996 |
Bayer AG | 25,993 | | 3,230,629 |
Bilfinger Berger AG | 1,120 | | 124,346 |
CompuGROUP Holding AG | 4,546 | | 118,478 |
CTS Eventim AG | 4,483 | | 218,820 |
Deutsche Bank AG | 10,780 | | 520,988 |
Deutsche Bank AG (NY Shares) | 300 | | 14,496 |
Deutsche Post AG | 34,917 | | 1,181,658 |
Fielmann AG | 1,079 | | 120,717 |
Fresenius SE & Co. KGaA | 5,500 | | 714,876 |
HeidelbergCement Finance AG | 9,123 | | 719,175 |
Linde AG | 14,649 | | 2,783,561 |
Siemens AG | 10,138 | | 1,295,558 |
Siemens AG sponsored ADR | 4,769 | | 610,480 |
TOTAL GERMANY | | 16,046,211 |
Greece - 0.0% |
Titan Cement Co. SA (Reg.) (a) | 3,444 | | 93,989 |
Hong Kong - 1.4% |
China Insurance International Holdings Co. Ltd. (a) | 717,800 | | 1,120,261 |
Dah Chong Hong Holdings Ltd. | 630,000 | | 534,683 |
Hang Lung Properties Ltd. | 261,000 | | 860,125 |
HKT Trust / HKT Ltd. unit | 641,000 | | 594,452 |
Hysan Development Co. Ltd. | 140,000 | | 654,585 |
Lenovo Group Ltd. | 628,000 | | 672,307 |
Wing Hang Bank Ltd. | 37,562 | | 534,385 |
TOTAL HONG KONG | | 4,970,798 |
Common Stocks - continued |
| Shares | | Value |
Hungary - 0.2% |
Richter Gedeon PLC | 38,800 | | $ 737,790 |
India - 3.0% |
Bank of Baroda | 49,621 | | 517,677 |
Cipla Ltd. | 86,552 | | 580,347 |
Container Corp. of India Ltd. | 44,711 | | 549,201 |
Grasim Industries Ltd. | 15,533 | | 730,141 |
Housing Development Finance Corp. Ltd. | 120,022 | | 1,665,338 |
IDFC Ltd. | 457,281 | | 784,718 |
Infosys Ltd. | 23,850 | | 1,271,037 |
Jyothy Laboratories Ltd. (a) | 32,119 | | 96,580 |
Kotak Mahindra Bank Ltd. | 54,534 | | 665,879 |
Larsen & Toubro Ltd. | 62,294 | | 984,286 |
NTPC Ltd. | 524,093 | | 1,268,049 |
Prestige Estates Projects Ltd. (a) | 272,850 | | 633,377 |
Punjab National Bank | 57,188 | | 530,472 |
TOTAL INDIA | | 10,277,102 |
Indonesia - 0.5% |
PT Bank Rakyat Indonesia Tbk | 821,000 | | 575,371 |
PT Semen Gresik (Persero) Tbk | 438,500 | | 558,212 |
PT Wijaya Karya Persero Tbk | 3,288,500 | | 560,114 |
TOTAL INDONESIA | | 1,693,697 |
Ireland - 0.7% |
CRH PLC sponsored ADR | 39,729 | | 972,566 |
FBD Holdings PLC | 5,372 | | 115,972 |
James Hardie Industries PLC: | | | |
CDI | 8,082 | | 83,491 |
sponsored ADR | 24,355 | | 1,268,408 |
TOTAL IRELAND | | 2,440,437 |
Israel - 0.2% |
Azrieli Group | 14,096 | | 453,311 |
Ituran Location & Control Ltd. | 2,761 | | 50,526 |
Strauss Group Ltd. | 2,359 | | 41,664 |
TOTAL ISRAEL | | 545,501 |
Italy - 0.5% |
Azimut Holding SpA | 8,114 | | 206,124 |
Beni Stabili SpA SIIQ | 145,810 | | 100,175 |
Interpump Group SpA | 53,591 | | 596,658 |
Common Stocks - continued |
| Shares | | Value |
Italy - continued |
Prada SpA | 68,900 | | $ 671,848 |
Unione di Banche Italiane ScpA | 44,737 | | 309,782 |
TOTAL ITALY | | 1,884,587 |
Japan - 14.4% |
AEON Financial Service Co. Ltd. | 8,800 | | 270,250 |
AEON Mall Co. Ltd. | 36,130 | | 1,026,127 |
Air Water, Inc. | 29,500 | | 421,681 |
Anicom Holdings, Inc. (a) | 2,500 | | 29,626 |
Aozora Bank Ltd. | 243,000 | | 706,409 |
ARNEST ONE Corp. | 2,300 | | 63,061 |
Artnature, Inc. | 4,000 | | 85,376 |
Asahi Co. Ltd. | 4,000 | | 67,805 |
Astellas Pharma, Inc. | 11,700 | | 652,233 |
Autobacs Seven Co. Ltd. | 27,400 | | 399,505 |
Azbil Corp. | 4,200 | | 101,197 |
Coca-Cola Central Japan Co. Ltd. | 3,800 | | 67,300 |
Cosmos Pharmaceutical Corp. | 700 | | 85,281 |
Daikin Industries Ltd. | 9,300 | | 535,061 |
Daikokutenbussan Co. Ltd. | 5,000 | | 150,040 |
DENSO Corp. | 88,900 | | 4,273,282 |
Dentsu, Inc. | 14,400 | | 544,064 |
East Japan Railway Co. | 10,400 | | 903,455 |
Fanuc Corp. | 6,800 | | 1,090,772 |
Fast Retailing Co. Ltd. | 3,900 | | 1,312,786 |
FCC Co. Ltd. | 6,800 | | 155,345 |
GCA Savvian Group Corp. | 4,700 | | 51,811 |
Glory Ltd. | 2,000 | | 49,594 |
Goldcrest Co. Ltd. | 6,260 | | 167,479 |
Hajime Construction Co. Ltd. | 400 | | 27,581 |
Harmonic Drive Systems, Inc. | 3,000 | | 64,584 |
Hoya Corp. | 35,500 | | 851,268 |
Isuzu Motors Ltd. | 82,000 | | 510,662 |
Itochu Corp. | 66,200 | | 795,999 |
Iwatsuka Confectionary Co. Ltd. | 1,200 | | 61,891 |
Japan Exchange Group, Inc. | 15,600 | | 362,671 |
Japan Tobacco, Inc. | 66,500 | | 2,406,215 |
JFE Holdings, Inc. | 26,300 | | 597,922 |
JTEKT Corp. | 41,200 | | 528,937 |
Kamigumi Co. Ltd. | 6,000 | | 52,190 |
Kansai Electric Power Co., Inc. (a) | 40,900 | | 517,672 |
KDDI Corp. | 21,200 | | 1,148,118 |
Common Stocks - continued |
| Shares | | Value |
Japan - continued |
Keyence Corp. | 5,921 | | $ 2,537,681 |
Kobayashi Pharmaceutical Co. Ltd. | 1,600 | | 89,586 |
Kyoto Kimono Yuzen Co. Ltd. | 2,800 | | 29,424 |
Lasertec Corp. (a) | 5,500 | | 56,820 |
Leopalace21 Corp. (a) | 31,800 | | 220,772 |
Meiko Network Japan Co. Ltd. | 2,700 | | 31,169 |
Miraial Co. Ltd. | 2,400 | | 38,930 |
Mitsubishi Electric Corp. | 62,000 | | 681,502 |
Mitsui Fudosan Co. Ltd. | 59,000 | | 1,954,428 |
MS&AD Insurance Group Holdings, Inc. | 29,400 | | 760,206 |
Nabtesco Corp. | 3,000 | | 73,223 |
Nagaileben Co. Ltd. | 5,100 | | 84,161 |
ND Software Co. Ltd. | 2,000 | | 35,876 |
Nihon M&A Center, Inc. | 2,300 | | 177,389 |
Nihon Parkerizing Co. Ltd. | 7,000 | | 136,745 |
Nippon Seiki Co. Ltd. | 7,000 | | 114,127 |
Nippon Telegraph & Telephone Corp. | 18,600 | | 966,834 |
Nomura Holdings, Inc. | 44,400 | | 327,984 |
NS Tool Co. Ltd. | 1,900 | | 32,362 |
Obic Co. Ltd. | 3,800 | | 119,330 |
Omron Corp. | 14,600 | | 557,154 |
ORIX Corp. | 67,100 | | 1,162,245 |
OSG Corp. | 10,200 | | 165,002 |
Santen Pharmaceutical Co. Ltd. | 12,800 | | 649,801 |
Seven & i Holdings Co., Ltd. | 24,100 | | 891,908 |
Seven Bank Ltd. | 339,600 | | 1,201,931 |
Shinsei Bank Ltd. | 552,000 | | 1,292,401 |
SHO-BOND Holdings Co. Ltd. | 17,200 | | 805,430 |
Shoei Co. Ltd. | 5,900 | | 55,432 |
SoftBank Corp. | 39,800 | | 2,972,221 |
Software Service, Inc. | 1,000 | | 37,598 |
Sumitomo Corp. | 54,800 | | 713,129 |
Sumitomo Mitsui Financial Group, Inc. | 57,200 | | 2,764,813 |
Sumitomo Mitsui Trust Holdings, Inc. | 192,000 | | 948,305 |
Techno Medica Co. Ltd. | 1,800 | | 39,199 |
The Nippon Synthetic Chemical Industry Co. Ltd. | 11,000 | | 106,054 |
Tocalo Co. Ltd. | 2,800 | | 45,843 |
Tokyo Tatemono Co. Ltd. | 47,000 | | 441,236 |
Toyota Motor Corp. | 22,000 | | 1,426,440 |
Tsutsumi Jewelry Co. Ltd. | 2,000 | | 48,731 |
Unicharm Corp. | 11,400 | | 732,210 |
USS Co. Ltd. | 163,500 | | 2,394,375 |
Common Stocks - continued |
| Shares | | Value |
Japan - continued |
Workman Co. Ltd. | 2,000 | | $ 78,379 |
Yamato Kogyo Co. Ltd. | 25,500 | | 945,137 |
TOTAL JAPAN | | 50,078,773 |
Korea (South) - 2.7% |
Coway Co. Ltd. | 2,497 | | 142,581 |
E-Mart Co. Ltd. | 5,451 | | 1,304,607 |
Kiwoom Securities Co. Ltd. | 13,501 | | 707,311 |
Korea Electric Power Corp. (a) | 32,950 | | 879,523 |
Korea Plant Service & Engineering Co. Ltd. | 18,239 | | 924,598 |
KT Corp. | 25,930 | | 856,618 |
LG Corp. | 17,494 | | 1,033,538 |
LG Household & Health Care Ltd. | 1,560 | | 809,927 |
NICE Holdings Co. Ltd. | 5,000 | | 61,011 |
NICE Information Service Co. Ltd. | 12,000 | | 34,600 |
Samsung Fire & Marine Insurance Co. Ltd. | 3,292 | | 769,275 |
Shinhan Financial Group Co. Ltd. | 30,630 | | 1,334,912 |
TK Corp. (a) | 27,242 | | 553,167 |
TOTAL KOREA (SOUTH) | | 9,411,668 |
Luxembourg - 0.3% |
Millicom International Cellular SA (depository receipt) | 10,000 | | 922,061 |
Malaysia - 0.4% |
Axiata Group Bhd | 104,300 | | 227,005 |
Public Bank Bhd | 71,500 | | 414,526 |
YTL Corp. Bhd | 1,298,600 | | 678,818 |
TOTAL MALAYSIA | | 1,320,349 |
Mexico - 0.9% |
Bolsa Mexicana de Valores S.A.B. de CV | 221,300 | | 527,500 |
Consorcio ARA S.A.B. de CV (a) | 1,492,555 | | 583,420 |
Fomento Economico Mexicano S.A.B. de CV sponsored ADR | 12,233 | | 1,141,339 |
Grupo Televisa SA de CV | 162,300 | | 991,420 |
TOTAL MEXICO | | 3,243,679 |
Netherlands - 2.0% |
Aalberts Industries NV | 7,600 | | 227,429 |
AEGON NV | 51,215 | | 407,512 |
ASM International NV (depositary receipt) | 1,950 | | 64,389 |
ASML Holding NV | 12,776 | | 1,209,121 |
Heijmans NV (Certificaten Van Aandelen) | 8,481 | | 112,836 |
ING Groep NV (Certificaten Van Aandelen) (a) | 148,405 | | 1,885,890 |
Common Stocks - continued |
| Shares | | Value |
Netherlands - continued |
Koninklijke Philips Electronics NV | 38,309 | | $ 1,353,868 |
Royal DSM NV | 11,256 | | 852,629 |
Unilever NV (Certificaten Van Aandelen) (Bearer) | 16,000 | | 634,328 |
VastNed Retail NV | 2,215 | | 102,418 |
TOTAL NETHERLANDS | | 6,850,420 |
Nigeria - 0.1% |
Guaranty Trust Bank PLC | 3,130,003 | | 498,672 |
Norway - 0.4% |
Telenor ASA | 56,208 | | 1,350,189 |
Philippines - 0.4% |
Jollibee Food Corp. | 14,560 | | 59,770 |
Security Bank Corp. | 165,970 | | 533,838 |
SM Investments Corp. | 32,910 | | 651,879 |
TOTAL PHILIPPINES | | 1,245,487 |
Poland - 0.2% |
Warsaw Stock Exchange | 49,938 | | 723,046 |
Portugal - 0.5% |
Jeronimo Martins SGPS SA | 98,869 | | 1,826,998 |
Russia - 0.1% |
Moscow Exchange MICEX-RTS OAO | 184,700 | | 352,747 |
Singapore - 0.8% |
Ezion Holdings Ltd. | 269,000 | | 485,075 |
Singapore Telecommunications Ltd. | 394,000 | | 1,198,937 |
United Overseas Bank Ltd. | 58,746 | | 985,563 |
TOTAL SINGAPORE | | 2,669,575 |
South Africa - 2.3% |
African Bank Investments Ltd. | 410,106 | | 694,489 |
Bidvest Group Ltd. | 31,600 | | 842,698 |
Clicks Group Ltd. | 118,211 | | 736,556 |
Nampak Ltd. | 25,130 | | 83,110 |
Naspers Ltd. Class N | 9,700 | | 907,314 |
Remgro Ltd. | 31,700 | | 645,447 |
Sasol Ltd. | 18,500 | | 945,310 |
Shoprite Holdings Ltd. | 48,300 | | 884,327 |
Standard Bank Group Ltd. | 83,671 | | 1,062,854 |
Tiger Brands Ltd. | 35,300 | | 1,034,447 |
TOTAL SOUTH AFRICA | | 7,836,552 |
Common Stocks - continued |
| Shares | | Value |
Spain - 1.9% |
Amadeus IT Holding SA Class A | 17,157 | | $ 637,116 |
Banco Bilbao Vizcaya Argentaria SA sponsored ADR | 169,876 | | 1,984,152 |
Grifols SA | 1,546 | | 63,403 |
Inditex SA | 12,680 | | 2,083,169 |
International Consolidated Airlines Group SA CDI (a) | 86,600 | | 483,075 |
Prosegur Compania de Seguridad SA (Reg.) | 74,476 | | 442,905 |
Repsol YPF SA | 33,855 | | 909,220 |
TOTAL SPAIN | | 6,603,040 |
Sweden - 2.7% |
ASSA ABLOY AB (B Shares) | 30,400 | | 1,509,198 |
Atlas Copco AB (A Shares) | 51,459 | | 1,427,817 |
Fagerhult AB | 13,985 | | 429,474 |
H&M Hennes & Mauritz AB (B Shares) | 40,086 | | 1,732,098 |
Intrum Justitia AB | 25,963 | | 691,139 |
SKF AB (B Shares) | 32,800 | | 869,092 |
Svenska Cellulosa AB (SCA) (B Shares) | 24,176 | | 686,474 |
Svenska Handelsbanken AB (A Shares) | 42,293 | | 1,916,224 |
Swedish Match Co. AB | 3,900 | | 128,675 |
TOTAL SWEDEN | | 9,390,191 |
Switzerland - 6.8% |
Credit Suisse Group | 16,189 | | 503,607 |
Nestle SA | 78,360 | | 5,656,343 |
Novartis AG | 47,854 | | 3,714,551 |
Roche Holding AG (participation certificate) | 18,964 | | 5,250,187 |
Schindler Holding AG: | | | |
(participation certificate) | 5,270 | | 747,505 |
(Reg.) | 2,001 | | 284,487 |
Swatch Group AG (Bearer) | 960 | | 614,184 |
Swiss Re Ltd. | 16,910 | | 1,485,344 |
Syngenta AG (Switzerland) | 2,230 | | 900,065 |
UBS AG (NY Shares) | 225,197 | | 4,359,814 |
Zehnder Group AG | 1,363 | | 64,218 |
TOTAL SWITZERLAND | | 23,580,305 |
Taiwan - 1.7% |
Chroma ATE, Inc. | 325,116 | | 691,431 |
CTCI Corp. | 353,000 | | 616,416 |
E.SUN Financial Holdings Co. Ltd. | 1,122,485 | | 749,340 |
King Slide Works Co. Ltd. | 48,000 | | 423,985 |
Standard Foods Corp. | 18,550 | | 56,718 |
Taiwan Semiconductor Manufacturing Co. Ltd. | 536,035 | | 1,971,867 |
Common Stocks - continued |
| Shares | | Value |
Taiwan - continued |
Unified-President Enterprises Corp. | 540,988 | | $ 1,029,228 |
Wowprime Corp. | 31,200 | | 516,202 |
TOTAL TAIWAN | | 6,055,187 |
Turkey - 1.3% |
Albaraka Turk Katilim Bankasi A/S (a) | 113,907 | | 101,568 |
Anadolu Efes Biracilik Ve Malt Sanayii A/S | 57,000 | | 728,115 |
Coca-Cola Icecek A/S | 35,589 | | 1,020,649 |
Enka Insaat ve Sanayi A/S | 254,062 | | 743,255 |
Tupras Turkiye Petrol Rafinelleri A/S | 22,313 | | 506,339 |
Turkiye Garanti Bankasi A/S | 313,143 | | 1,261,200 |
TOTAL TURKEY | | 4,361,126 |
United Kingdom - 16.7% |
Babcock International Group PLC | 49,400 | | 1,009,902 |
Barclays PLC | 467,229 | | 1,965,850 |
Barclays PLC sponsored ADR | 48,333 | | 812,478 |
Bellway PLC | 5,928 | | 142,955 |
Berendsen PLC | 7,328 | | 114,031 |
BG Group PLC | 103,727 | | 2,118,033 |
BHP Billiton PLC | 68,221 | | 2,105,198 |
BHP Billiton PLC ADR | 15,600 | | 961,584 |
British American Tobacco PLC (United Kingdom) | 15,840 | | 873,929 |
Britvic PLC | 9,817 | | 98,379 |
BT Group PLC | 124,647 | | 754,193 |
Bunzl PLC | 39,057 | | 862,332 |
Compass Group PLC | 65,914 | | 948,008 |
Dechra Pharmaceuticals PLC | 9,000 | | 99,571 |
Derwent London PLC | 2,000 | | 80,298 |
Elementis PLC | 32,808 | | 136,298 |
Fenner PLC | 8,953 | | 57,421 |
GlaxoSmithKline PLC sponsored ADR | 53,397 | | 2,810,284 |
Great Portland Estates PLC | 17,772 | | 163,280 |
Hilton Food Group PLC | 4,200 | | 28,823 |
HSBC Holdings PLC sponsored ADR | 84,258 | | 4,637,560 |
Imperial Tobacco Group PLC | 35,990 | | 1,343,981 |
InterContinental Hotel Group PLC ADR | 54,247 | | 1,592,149 |
ITV PLC | 304,819 | | 933,018 |
Johnson Matthey PLC | 29,077 | | 1,400,527 |
Kingfisher PLC | 152,227 | | 921,405 |
Legal & General Group PLC | 392,124 | | 1,359,947 |
Meggitt PLC | 14,735 | | 135,259 |
Common Stocks - continued |
| Shares | | Value |
United Kingdom - continued |
National Grid PLC | 122,891 | | $ 1,544,342 |
Next PLC | 7,800 | | 680,980 |
Persimmon PLC | 4,537 | | 92,024 |
Prudential PLC | 176,390 | | 3,607,310 |
Reckitt Benckiser Group PLC | 26,051 | | 2,025,018 |
Reed Elsevier PLC | 74,513 | | 1,044,204 |
Rexam PLC | 86,188 | | 717,917 |
Rolls-Royce Group PLC | 127,052 | | 2,342,725 |
Rotork PLC | 22,403 | | 1,028,417 |
Royal Dutch Shell PLC Class A sponsored ADR | 50,889 | | 3,392,261 |
SABMiller PLC | 45,563 | | 2,377,233 |
Serco Group PLC | 101,845 | | 909,571 |
Shaftesbury PLC | 49,537 | | 471,800 |
Spectris PLC | 5,170 | | 191,655 |
Spirax-Sarco Engineering PLC | 4,807 | | 224,906 |
Standard Chartered PLC (United Kingdom) | 76,604 | | 1,841,789 |
Taylor Wimpey PLC | 270,787 | | 478,466 |
Ted Baker PLC | 2,575 | | 70,478 |
Tesco PLC | 211,773 | | 1,236,666 |
Tullow Oil PLC | 35,500 | | 536,478 |
Ultra Electronics Holdings PLC | 5,001 | | 155,080 |
Unite Group PLC | 76,402 | | 485,112 |
Vodafone Group PLC sponsored ADR | 114,232 | | 4,206,022 |
TOTAL UNITED KINGDOM | | 58,127,147 |
United States of America - 5.7% |
AbbVie, Inc. | 15,329 | | 742,690 |
ANSYS, Inc. (a) | 400 | | 34,980 |
Autoliv, Inc. | 17,254 | | 1,539,574 |
Berkshire Hathaway, Inc. Class B (a) | 4,316 | | 496,685 |
BorgWarner, Inc. | 13,097 | | 1,350,694 |
BPZ Energy, Inc. (a) | 15,547 | | 31,249 |
Broadridge Financial Solutions, Inc. | 1,140 | | 40,082 |
Cabot Corp. | 7,508 | | 349,948 |
Cummins, Inc. | 6,191 | | 786,381 |
Dril-Quip, Inc. (a) | 1,070 | | 125,639 |
Evercore Partners, Inc. Class A | 2,160 | | 109,015 |
FMC Technologies, Inc. (a) | 10,803 | | 546,092 |
Google, Inc. Class A (a) | 600 | | 618,348 |
Greenhill & Co., Inc. | 1,420 | | 72,846 |
Kansas City Southern | 517 | | 62,826 |
Kennedy-Wilson Holdings, Inc. | 5,183 | | 103,867 |
Common Stocks - continued |
| Shares | | Value |
United States of America - continued |
KLA-Tencor Corp. | 8,500 | | $ 557,600 |
Martin Marietta Materials, Inc. | 7,780 | | 763,140 |
MasterCard, Inc. Class A | 2,409 | | 1,727,494 |
Mead Johnson Nutrition Co. Class A | 16,700 | | 1,363,722 |
Mohawk Industries, Inc. (a) | 6,035 | | 799,155 |
National Oilwell Varco, Inc. | 9,546 | | 774,944 |
Oceaneering International, Inc. | 1,250 | | 107,350 |
Philip Morris International, Inc. | 10,000 | | 891,200 |
PriceSmart, Inc. | 8,085 | | 919,992 |
ResMed, Inc. | 15,420 | | 797,831 |
Sohu.com, Inc. (a) | 5,600 | | 374,976 |
Solera Holdings, Inc. | 12,873 | | 723,720 |
SS&C Technologies Holdings, Inc. (a) | 19,854 | | 780,262 |
Union Pacific Corp. | 3,900 | | 590,460 |
Visa, Inc. Class A | 8,601 | | 1,691,559 |
TOTAL UNITED STATES OF AMERICA | | 19,874,321 |
TOTAL COMMON STOCKS (Cost $279,749,091) |
339,377,631
|
Nonconvertible Preferred Stocks - 0.8% |
| | | |
Brazil - 0.2% |
Banco ABC Brasil SA | 5,994 | | 36,897 |
Klabin SA (PN) (non-vtg.) | 124,100 | | 659,222 |
TOTAL BRAZIL | | 696,119 |
Germany - 0.6% |
Sartorius AG (non-vtg.) | 800 | | 84,398 |
Volkswagen AG | 7,390 | | 1,878,322 |
TOTAL GERMANY | | 1,962,720 |
United Kingdom - 0.0% |
Rolls-Royce Group PLC Series C | 8,544,272 | | 13,700 |
TOTAL NONCONVERTIBLE PREFERRED STOCKS (Cost $2,154,229) |
2,672,539
|
Money Market Funds - 1.2% |
| Shares | | Value |
Fidelity Cash Central Fund, 0.09% (b)
(Cost $4,180,055) | 4,180,055 | | $ 4,180,055 |
TOTAL INVESTMENT PORTFOLIO - 99.6% (Cost $286,083,375) | | 346,230,225 |
NET OTHER ASSETS (LIABILITIES) - 0.4% | | 1,255,209 |
NET ASSETS - 100% | $ 347,485,434 |
Legend |
(a) Non-income producing |
(b) Affiliated fund that is generally available only to investment companies and other accounts managed by Fidelity Investments. The rate quoted is the annualized seven-day yield of the fund at period end. A complete unaudited listing of the fund's holdings as of its most recent quarter end is available upon request. In addition, each Fidelity Central Fund's financial statements, which are not covered by the Fund's Report of Independent Registered Public Accounting Firm, are available on the SEC's website or upon request. |
(c) Security or a portion of the security purchased on a delayed delivery or when-issued basis. |
Affiliated Central Funds |
Information regarding fiscal year to date income earned by the Fund from investments in Fidelity Central Funds is as follows: |
Fund | Income earned |
Fidelity Cash Central Fund | $ 7,651 |
Fidelity Securities Lending Cash Central Fund | 117,973 |
Total | $ 125,624 |
Other Information |
Categorizations in the Schedule of Investments are based on country or territory of incorporation. |
The following is a summary of the inputs used, as of October 31, 2013, involving the Fund's assets and liabilities carried at fair value. The inputs or methodology used for valuing securities may not be an indication of the risk associated with investing in those securities. For more information on valuation inputs, and their aggregation into the levels used in the tables below, please refer to the Investment Valuation section in the accompanying Notes to Financial Statements. |
Valuation Inputs at Reporting Date: |
Description | Total | Level 1 | Level 2 | Level 3 |
Investments in Securities: | | | | |
Equities: | | | | |
Consumer Discretionary | $ 45,862,668 | $ 34,330,500 | $ 11,441,526 | $ 90,642 |
Consumer Staples | 47,931,001 | 31,254,840 | 16,676,161 | - |
Energy | 15,259,371 | 9,768,603 | 5,490,768 | - |
Financials | 85,212,436 | 60,767,201 | 24,445,235 | - |
Health Care | 32,901,496 | 22,458,101 | 10,443,395 | - |
Industrials | 44,536,699 | 35,172,801 | 9,363,898 | - |
Information Technology | 19,752,010 | 11,654,503 | 8,097,507 | - |
Materials | 22,658,420 | 16,715,477 | 5,942,943 | - |
Telecommunication Services | 19,997,074 | 12,671,219 | 7,325,855 | - |
Utilities | 7,938,995 | 4,997,458 | 2,941,537 | - |
Money Market Funds | 4,180,055 | 4,180,055 | - | - |
Total Investments in Securities: | $ 346,230,225 | $ 243,970,758 | $ 102,168,825 | $ 90,642 |
The following is a summary of transfers between Level 1 and Level 2 for the period ended October 31, 2013. Transfers are assumed to have occurred at the beginning of the period, and are primarily attributable to the valuation techniques used for foreign equity securities, as discussed in the accompanying Notes to Financial Statements: |
Transfers | Total |
Level 1 to Level 2 | $ 27,446,870 |
Level 2 to Level 1 | $ 0 |
See accompanying notes which are an integral part of the financial statements.
Annual Report
Statement of Assets and Liabilities
| October 31, 2013 |
| | |
Assets | | |
Investment in securities, at value - See accompanying schedule: Unaffiliated issuers (cost $281,903,320) | $ 342,050,170 | |
Fidelity Central Funds (cost $4,180,055) | 4,180,055 | |
Total Investments (cost $286,083,375) | | $ 346,230,225 |
Cash | | 98,120 |
Foreign currency held at value (cost $48,734) | | 48,356 |
Receivable for investments sold | | 5,463,171 |
Receivable for fund shares sold | | 129,490 |
Dividends receivable | | 652,586 |
Distributions receivable from Fidelity Central Funds | | 461 |
Prepaid expenses | | 1,143 |
Receivable from investment adviser for expense reductions | | 1,873 |
Other receivables | | 19,410 |
Total assets | | 352,644,835 |
| | |
Liabilities | | |
Payable for investments purchased
Regular delivery | $ 4,152,032 | |
Delayed delivery | 3,376 | |
Payable for fund shares redeemed | 510,377 | |
Accrued management fee | 211,644 | |
Distribution and service plan fees payable | 8,092 | |
Other affiliated payables | 52,427 | |
Other payables and accrued expenses | 221,453 | |
Total liabilities | | 5,159,401 |
| | |
Net Assets | | $ 347,485,434 |
Net Assets consist of: | | |
Paid in capital | | $ 304,386,459 |
Undistributed net investment income | | 4,647,078 |
Accumulated undistributed net realized gain (loss) on investments and foreign currency transactions | | (21,575,548) |
Net unrealized appreciation (depreciation) on investments and assets and liabilities in foreign currencies | | 60,027,445 |
Net Assets | | $ 347,485,434 |
See accompanying notes which are an integral part of the financial statements.
Annual Report
Statement of Assets and Liabilities - continued
| October 31, 2013 |
| | |
Calculation of Maximum Offering Price Class A:
Net Asset Value and redemption price per share ($9,033,736 ÷ 1,091,791 shares) | | $ 8.27 |
| | |
Maximum offering price per share (100/94.25 of $8.27) | | $ 8.77 |
Class T:
Net Asset Value and redemption price per share ($7,908,968 ÷ 950,538 shares) | | $ 8.32 |
| | |
Maximum offering price per share (100/96.50 of $8.32) | | $ 8.62 |
Class B:
Net Asset Value and offering price per share ($191,605 ÷ 23,044 shares)A | | $ 8.31 |
| | |
Class C:
Net Asset Value and offering price per share ($3,584,459 ÷ 433,098 shares)A | | $ 8.28 |
| | |
Total International Equity:
Net Asset Value, offering price and redemption price per share ($324,394,605 ÷ 39,121,493 shares) | | $ 8.29 |
| | |
Institutional Class:
Net Asset Value, offering price and redemption price per share ($2,372,061 ÷ 287,233 shares) | | $ 8.26 |
A Redemption price per share is equal to net asset value less any applicable contingent deferred sales charge.
See accompanying notes which are an integral part of the financial statements.
Annual Report
Financial Statements - continued
Statement of Operations
| Year ended October 31, 2013 |
| | |
Investment Income | | |
Dividends | | $ 9,425,071 |
Interest | | 291 |
Income from Fidelity Central Funds | | 125,624 |
Income before foreign taxes withheld | | 9,550,986 |
Less foreign taxes withheld | | (700,335) |
Total income | | 8,850,651 |
| | |
Expenses | | |
Management fee
Basic fee | $ 2,364,132 | |
Performance adjustment | 228,686 | |
Transfer agent fees | 478,126 | |
Distribution and service plan fees | 79,485 | |
Accounting and security lending fees | 174,309 | |
Custodian fees and expenses | 273,120 | |
Independent trustees' compensation | 1,910 | |
Registration fees | 73,943 | |
Audit | 93,320 | |
Legal | 893 | |
Miscellaneous | 2,714 | |
Total expenses before reductions | 3,770,638 | |
Expense reductions | (85,967) | 3,684,671 |
Net investment income (loss) | | 5,165,980 |
Realized and Unrealized Gain (Loss) Net realized gain (loss) on: | | |
Investment securities: | | |
Unaffiliated issuers | 8,824,925 | |
Foreign currency transactions | (119,832) | |
Futures contracts | (175,371) | |
Total net realized gain (loss) | | 8,529,722 |
Change in net unrealized appreciation (depreciation) on: Investment securities (net of increase in deferred foreign taxes of $90,453) | 44,707,928 | |
Assets and liabilities in foreign currencies | 18,535 | |
Total change in net unrealized appreciation (depreciation) | | 44,726,463 |
Net gain (loss) | | 53,256,185 |
Net increase (decrease) in net assets resulting from operations | | $ 58,422,165 |
See accompanying notes which are an integral part of the financial statements.
Annual Report
Statement of Changes in Net Assets
| Year ended
October 31,
2013 | Year ended
October 31,
2012 |
Increase (Decrease) in Net Assets | | |
Operations | | |
Net investment income (loss) | $ 5,165,980 | $ 5,615,371 |
Net realized gain (loss) | 8,529,722 | 9,140,393 |
Change in net unrealized appreciation (depreciation) | 44,726,463 | 20,537,189 |
Net increase (decrease) in net assets resulting
from operations | 58,422,165 | 35,292,953 |
Distributions to shareholders from net investment income | (5,845,552) | (1,867,192) |
Distributions to shareholders from net realized gain | (9,769,201) | - |
Total distributions | (15,614,753) | (1,867,192) |
Share transactions - net increase (decrease) | 10,109,727 | 122,647,348 |
Redemption fees | 2,498 | 3,128 |
Total increase (decrease) in net assets | 52,919,637 | 156,076,237 |
| | |
Net Assets | | |
Beginning of period | 294,565,797 | 138,489,560 |
End of period (including undistributed net investment income of $4,647,078 and undistributed net investment income of $5,300,982, respectively) | $ 347,485,434 | $ 294,565,797 |
See accompanying notes which are an integral part of the financial statements.
Annual Report
Financial Highlights - Class A
Years ended October 31, | 2013 | 2012 | 2011 | 2010 | 2009 |
Selected Per-Share Data | | | | | |
Net asset value, beginning of period | $ 7.31 | $ 6.67 | $ 7.36 | $ 6.40 | $ 4.90 |
Income from Investment Operations | | | | | |
Net investment income (loss) C | .09 | .13 | .11 | .08 | .06 |
Net realized and unrealized gain (loss) | 1.24 | .59 | (.69) | .95 | 1.55 |
Total from investment operations | 1.33 | .72 | (.58) | 1.03 | 1.61 |
Distributions from net investment income | (.13) | (.08) | (.09) | (.04) | (.11) |
Distributions from net realized gain | (.25) | - | (.02) | (.03) | - |
Total distributions | (.37) H | (.08) | (.11) | (.07) | (.11) |
Redemption fees added to paid in capital C, G | - | - | - | - | - |
Net asset value, end of period | $ 8.27 | $ 7.31 | $ 6.67 | $ 7.36 | $ 6.40 |
Total Return A, B | 19.00% | 10.88% | (8.03)% | 16.17% | 33.87% |
Ratios to Average Net Assets D, F | | | | | |
Expenses before reductions | 1.50% | 1.57% | 1.73% | 2.02% | 2.09% |
Expenses net of fee waivers, if any | 1.45% | 1.45% | 1.45% | 1.50% | 1.50% |
Expenses net of all reductions | 1.43% | 1.42% | 1.42% | 1.47% | 1.47% |
Net investment income (loss) | 1.21% | 1.88% | 1.44% | 1.15% | 1.13% |
Supplemental Data | | | | | |
Net assets, end of period (000 omitted) | $ 9,034 | $ 5,767 | $ 4,307 | $ 5,029 | $ 3,727 |
Portfolio turnover rate E | 89% | 110% | 75% | 67% | 98% |
A Total returns would have been lower if certain expenses had not been reduced during the applicable periods shown.
B Total returns do not include the effect of the sales charges.
C Calculated based on average shares outstanding during the period.
D Fees and expenses of any underlying Fidelity Central Funds are not included in the Fund's expense ratio. The Fund indirectly bears its proportionate share of the expenses of any underlying Fidelity Central Funds.
E Amount does not include the portfolio activity of any underlying Fidelity Central Funds.
F Expense ratios reflect operating expenses of the class. Expenses before reductions do not reflect amounts reimbursed by the investment adviser or reductions from brokerage service arrangements or reductions from other expense offset arrangements and do not represent the amount paid by the class during periods when reimbursements or reductions occur. Expenses net of fee waivers reflect expenses after reimbursement by the investment adviser but prior to reductions from brokerage service arrangements or other expense offset arrangements. Expenses net of all reductions represent the net expenses paid by the class.
G Amount represents less than $.01 per share.
H Total distributions of $.37 per share is comprised of distributions from net investment income of $.126 and distributions from net realized gain of $.245 per share.
See accompanying notes which are an integral part of the financial statements.
Annual Report
Financial Highlights - Class T
Years ended October 31, | 2013 | 2012 | 2011 | 2010 | 2009 |
Selected Per-Share Data | | | | | |
Net asset value, beginning of period | $ 7.37 | $ 6.73 | $ 7.41 | $ 6.40 | $ 4.88 |
Income from Investment Operations | | | | | |
Net investment income (loss) C | .07 | .11 | .09 | .06 | .04 |
Net realized and unrealized gain (loss) | 1.25 | .59 | (.68) | .95 | 1.57 |
Total from investment operations | 1.32 | .70 | (.59) | 1.01 | 1.61 |
Distributions from net investment income | (.13) | (.06) | (.07) | - | (.09) |
Distributions from net realized gain | (.25) | - | (.02) | - | - |
Total distributions | (.37) H | (.06) | (.09) | - | (.09) |
Redemption fees added to paid in capital C, G | - | - | - | - | - |
Net asset value, end of period | $ 8.32 | $ 7.37 | $ 6.73 | $ 7.41 | $ 6.40 |
Total Return A, B | 18.73% | 10.52% | (8.08)% | 15.78% | 33.74% |
Ratios to Average Net Assets D, F | | | | | |
Expenses before reductions | 1.75% | 1.84% | 2.02% | 2.31% | 2.34% |
Expenses net of fee waivers, if any | 1.70% | 1.70% | 1.70% | 1.75% | 1.75% |
Expenses net of all reductions | 1.67% | 1.67% | 1.67% | 1.72% | 1.72% |
Net investment income (loss) | .96% | 1.63% | 1.19% | .90% | .88% |
Supplemental Data | | | | | |
Net assets, end of period (000 omitted) | $ 7,909 | $ 2,348 | $ 997 | $ 1,004 | $ 1,526 |
Portfolio turnover rate E | 89% | 110% | 75% | 67% | 98% |
A Total returns would have been lower if certain expenses had not been reduced during the applicable periods shown.
B Total returns do not include the effect of the sales charges.
C Calculated based on average shares outstanding during the period.
D Fees and expenses of any underlying Fidelity Central Funds are not included in the Fund's expense ratio. The Fund indirectly bears its proportionate share of the expenses of any underlying Fidelity Central Funds.
E Amount does not include the portfolio activity of any underlying Fidelity Central Funds.
F Expense ratios reflect operating expenses of the class. Expenses before reductions do not reflect amounts reimbursed by the investment adviser or reductions from brokerage service arrangements or reductions from other expense offset arrangements and do not represent the amount paid by the class during periods when reimbursements or reductions occur. Expenses net of fee waivers reflect expenses after reimbursement by the investment adviser but prior to reductions from brokerage service arrangements or other expense offset arrangements. Expenses net of all reductions represent the net expenses paid by the class.
G Amount represents less than $.01 per share.
H Total distributions of $.37 per share is comprised of distributions from net investment income of $.128 and distributions from net realized gain of $.245 per share.
See accompanying notes which are an integral part of the financial statements.
Annual Report
Financial Highlights - Class B
Years ended October 31, | 2013 | 2012 | 2011 | 2010 | 2009 |
Selected Per-Share Data | | | | | |
Net asset value, beginning of period | $ 7.33 | $ 6.68 | $ 7.37 | $ 6.39 | $ 4.86 |
Income from Investment Operations | | | | | |
Net investment income (loss) C | .04 | .08 | .05 | .03 | .02 |
Net realized and unrealized gain (loss) | 1.24 | .59 | (.68) | .95 | 1.56 |
Total from investment operations | 1.28 | .67 | (.63) | .98 | 1.58 |
Distributions from net investment income | (.05) | (.02) | (.04) | - | (.05) |
Distributions from net realized gain | (.25) | - | (.02) | - | - |
Total distributions | (.30) | (.02) | (.06) | - | (.05) |
Redemption fees added to paid in capital C, G | - | - | - | - | - |
Net asset value, end of period | $ 8.31 | $ 7.33 | $ 6.68 | $ 7.37 | $ 6.39 |
Total Return A, B | 18.05% | 10.05% | (8.66)% | 15.34% | 32.95% |
Ratios to Average Net Assets D, F | | | | | |
Expenses before reductions | 2.26% | 2.34% | 2.51% | 2.81% | 2.82% |
Expenses net of fee waivers, if any | 2.20% | 2.20% | 2.20% | 2.25% | 2.25% |
Expenses net of all reductions | 2.18% | 2.17% | 2.17% | 2.22% | 2.22% |
Net investment income (loss) | .46% | 1.13% | .69% | .40% | .38% |
Supplemental Data | | | | | |
Net assets, end of period (000 omitted) | $ 192 | $ 220 | $ 254 | $ 327 | $ 1,337 |
Portfolio turnover rate E | 89% | 110% | 75% | 67% | 98% |
A Total returns would have been lower if certain expenses had not been reduced during the applicable periods shown.
B Total returns do not include the effect of the contingent deferred sales charge.
C Calculated based on average shares outstanding during the period.
D Fees and expenses of any underlying Fidelity Central Funds are not included in the Fund's expense ratio. The Fund indirectly bears its proportionate share of the expenses of any underlying Fidelity Central Funds.
E Amount does not include the portfolio activity of any underlying Fidelity Central Funds.
F Expense ratios reflect operating expenses of the class. Expenses before reductions do not reflect amounts reimbursed by the investment adviser or reductions from brokerage service arrangements or reductions from other expense offset arrangements and do not represent the amount paid by the class during periods when reimbursements or reductions occur. Expenses net of fee waivers reflect expenses after reimbursement by the investment adviser but prior to reductions from brokerage service arrangements or other expense offset arrangements. Expenses net of all reductions represent the net expenses paid by the class.
G Amount represents less than $.01 per share.
See accompanying notes which are an integral part of the financial statements.
Annual Report
Financial Highlights - Class C
Years ended October 31, | 2013 | 2012 | 2011 | 2010 | 2009 |
Selected Per-Share Data | | | | | |
Net asset value, beginning of period | $ 7.31 | $ 6.67 | $ 7.36 | $ 6.39 | $ 4.86 |
Income from Investment Operations | | | | | |
Net investment income (loss) C | .04 | .08 | .05 | .03 | .02 |
Net realized and unrealized gain (loss) | 1.25 | .58 | (.69) | .94 | 1.56 |
Total from investment operations | 1.29 | .66 | (.64) | .97 | 1.58 |
Distributions from net investment income | (.08) | (.02) | (.03) | - | (.05) |
Distributions from net realized gain | (.25) | - | (.02) | - | - |
Total distributions | (.32) H | (.02) | (.05) | - | (.05) |
Redemption fees added to paid in capital C, G | - | - | - | - | - |
Net asset value, end of period | $ 8.28 | $ 7.31 | $ 6.67 | $ 7.36 | $ 6.39 |
Total Return A, B | 18.30% | 9.98% | (8.72)% | 15.18% | 33.10% |
Ratios to Average Net Assets D, F | | | | | |
Expenses before reductions | 2.26% | 2.31% | 2.51% | 2.80% | 2.85% |
Expenses net of fee waivers, if any | 2.20% | 2.20% | 2.20% | 2.25% | 2.25% |
Expenses net of all reductions | 2.18% | 2.17% | 2.17% | 2.22% | 2.22% |
Net investment income (loss) | .46% | 1.13% | .69% | .40% | .38% |
Supplemental Data | | | | | |
Net assets, end of period (000 omitted) | $ 3,584 | $ 2,737 | $ 1,396 | $ 1,423 | $ 1,714 |
Portfolio turnover rate E | 89% | 110% | 75% | 67% | 98% |
A Total returns would have been lower if certain expenses had not been reduced during the applicable periods shown.
B Total returns do not include the effect of the contingent deferred sales charge.
C Calculated based on average shares outstanding during the period.
D Fees and expenses of any underlying Fidelity Central Funds are not included in the Fund's expense ratio. The Fund indirectly bears its proportionate share of the expenses of any underlying Fidelity Central Funds.
E Amount does not include the portfolio activity of any underlying Fidelity Central Funds.
F Expense ratios reflect operating expenses of the class. Expenses before reductions do not reflect amounts reimbursed by the investment adviser or reductions from brokerage service arrangements or reductions from other expense offset arrangements and do not represent the amount paid by the class during periods when reimbursements or reductions occur. Expenses net of fee waivers reflect expenses after reimbursement by the investment adviser but prior to reductions from brokerage service arrangements or other expense offset arrangements. Expenses net of all reductions represent the net expenses paid by the class.
G Amount represents less than $.01 per share.
H Total distributions of $.32 per share is comprised of distributions from net investment income of $.075 and distributions from net realized gain of $.245 per share.
See accompanying notes which are an integral part of the financial statements.
Annual Report
Financial Highlights - Total International Equity
Years ended October 31, | 2013 | 2012 | 2011 | 2010 | 2009 |
Selected Per-Share Data | | | | | |
Net asset value, beginning of period | $ 7.32 | $ 6.69 | $ 7.37 | $ 6.41 | $ 4.91 |
Income from Investment Operations | | | | | |
Net investment income (loss) B | .12 | .15 | .12 | .09 | .07 |
Net realized and unrealized gain (loss) | 1.24 | .58 | (.68) | .96 | 1.55 |
Total from investment operations | 1.36 | .73 | (.56) | 1.05 | 1.62 |
Distributions from net investment income | (.15) | (.10) | (.10) | (.06) | (.12) |
Distributions from net realized gain | (.25) | - | (.02) | (.03) | - |
Total distributions | (.39) G | (.10) | (.12) | (.09) | (.12) |
Redemption fees added to paid in capital B, F | - | - | - | - | - |
Net asset value, end of period | $ 8.29 | $ 7.32 | $ 6.69 | $ 7.37 | $ 6.41 |
Total Return A | 19.48% | 11.03% | (7.70)% | 16.45% | 34.23% |
Ratios to Average Net Assets C, E | | | | | |
Expenses before reductions | 1.09% | 1.16% | 1.42% | 1.79% | 1.87% |
Expenses net of fee waivers, if any | 1.09% | 1.16% | 1.20% | 1.25% | 1.25% |
Expenses net of all reductions | 1.07% | 1.13% | 1.17% | 1.22% | 1.22% |
Net investment income (loss) | 1.57% | 2.16% | 1.69% | 1.40% | 1.38% |
Supplemental Data | | | | | |
Net assets, end of period (000 omitted) | $ 324,395 | $ 281,979 | $ 131,338 | $ 60,826 | $ 33,061 |
Portfolio turnover rate D | 89% | 110% | 75% | 67% | 98% |
A Total returns would have been lower if certain expenses had not been reduced during the applicable periods shown.
B Calculated based on average shares outstanding during the period.
C Fees and expenses of any underlying Fidelity Central Funds are not included in the Fund's expense ratio. The Fund indirectly bears its proportionate share of the expenses of any underlying Fidelity Central Funds.
D Amount does not include the portfolio activity of any underlying Fidelity Central Funds.
E Expense ratios reflect operating expenses of the class. Expenses before reductions do not reflect amounts reimbursed by the investment adviser or reductions from brokerage service arrangements or reductions from other expense offset arrangements and do not represent the amount paid by the class during periods when reimbursements or reductions occur. Expenses net of fee waivers reflect expenses after reimbursement by the investment adviser but prior to reductions from brokerage service arrangements or other expense offset arrangements. Expenses net of all reductions represent the net expenses paid by the class.
F Amount represents less than $.01 per share.
G Total distributions of $.39 per share is comprised of distributions from net investment income of $.148 and distributions from net realized gain of $.245 per share.
See accompanying notes which are an integral part of the financial statements.
Annual Report
Financial Highlights - Institutional Class
Years ended October 31, | 2013 | 2012 | 2011 | 2010 | 2009 |
Selected Per-Share Data | | | | | |
Net asset value, beginning of period | $ 7.30 | $ 6.67 | $ 7.35 | $ 6.41 | $ 4.91 |
Income from Investment Operations | | | | | |
Net investment income (loss) B | .11 | .14 | .12 | .10 | .07 |
Net realized and unrealized gain (loss) | 1.24 | .59 | (.68) | .95 | 1.55 |
Total from investment operations | 1.35 | .73 | (.56) | 1.05 | 1.62 |
Distributions from net investment income | (.15) | (.10) | (.10) | (.08) | (.12) |
Distributions from net realized gain | (.25) | - | (.02) | (.03) | - |
Total distributions | (.39) G | (.10) | (.12) | (.11) | (.12) |
Redemption fees added to paid in capital B, F | - | - | - | - | - |
Net asset value, end of period | $ 8.26 | $ 7.30 | $ 6.67 | $ 7.35 | $ 6.41 |
Total Return A | 19.40% | 11.06% | (7.72)% | 16.48% | 34.23% |
Ratios to Average Net Assets C, E | | | | | |
Expenses before reductions | 1.21% | 1.27% | 1.48% | 1.82% | 1.80% |
Expenses net of fee waivers, if any | 1.20% | 1.20% | 1.20% | 1.25% | 1.25% |
Expenses net of all reductions | 1.18% | 1.17% | 1.17% | 1.23% | 1.22% |
Net investment income (loss) | 1.46% | 2.13% | 1.69% | 1.40% | 1.38% |
Supplemental Data | | | | | |
Net assets, end of period (000 omitted) | $ 2,372 | $ 1,514 | $ 197 | $ 28 | $ 1,308 |
Portfolio turnover rate D | 89% | 110% | 75% | 67% | 98% |
A Total returns would have been lower if certain expenses had not been reduced during the applicable periods shown.
B Calculated based on average shares outstanding during the period.
C Fees and expenses of any underlying Fidelity Central Funds are not included in the Fund's expense ratio. The Fund indirectly bears its proportionate share of the expenses of any underlying Fidelity Central Funds.
D Amount does not include the portfolio activity of any underlying Fidelity Central Funds.
E Expense ratios reflect operating expenses of the class. Expenses before reductions do not reflect amounts reimbursed by the investment adviser or reductions from brokerage service arrangements or reductions from other expense offset arrangements and do not represent the amount paid by the class during periods when reimbursements or reductions occur. Expenses net of fee waivers reflect expenses after reimbursement by the investment adviser but prior to reductions from brokerage service arrangements or other expense offset arrangements. Expenses net of all reductions represent the net expenses paid by the class.
F Amount represents less than $.01 per share.
G Total distributions of $.39 per share is comprised of distributions from net investment income of $.148 and distributions from net realized gain of $.245 per share.
See accompanying notes which are an integral part of the financial statements.
Annual Report
Notes to Financial Statements
For the period ended October 31, 2013
1. Organization.
Fidelity Total International Equity Fund (the Fund) is a fund of Fidelity Investment Trust (the Trust) and is authorized to issue an unlimited number of shares. The Trust is registered under the Investment Company Act of 1940, as amended (the 1940 Act), as an open-end management investment company organized as a Massachusetts business trust. The Fund offers Class A, Class T, Class C, Total International Equity and Institutional Class shares, each of which, along with Class B shares, has equal rights as to assets and voting privileges. Class B shares are closed to new accounts and additional purchases, except for exchanges and reinvestments. Each class has exclusive voting rights with respect to matters that affect that class. Class B shares will automatically convert to Class A shares after a holding period of seven years from the initial date of purchase. The Fund's investments in emerging markets can be subject to social, economic, regulatory, and political uncertainties and can be extremely volatile.
2. Investments in Fidelity Central Funds.
The Fund invests in Fidelity Central Funds, which are open-end investment companies generally available only to other investment companies and accounts managed by Fidelity Management & Research Company (FMR) and its affiliates. The Fund's Schedule of Investments lists each of the Fidelity Central Funds held as of period end, if any, as an investment of the Fund, but does not include the underlying holdings of each Fidelity Central Fund. As an Investing Fund, the Fund indirectly bears its proportionate share of the expenses of the underlying Fidelity Central Funds.
The Money Market Central Funds seek preservation of capital and current income and are managed by Fidelity Investments Money Management, Inc. (FIMM), an affiliate of FMR.
A complete unaudited list of holdings for each Fidelity Central Fund is available upon request or at the Securities and Exchange Commission (the SEC) website at www.sec.gov. In addition, the financial statements of the Fidelity Central Funds, which are not covered by the Fund's Report of Independent Registered Public Accounting Firm, are available on the SEC website or upon request.
3. Significant Accounting Policies.
The financial statements have been prepared in conformity with accounting principles generally accepted in the United States of America (GAAP), which require management to make certain estimates and assumptions at the date of the financial statements. Actual results could differ from those estimates. Subsequent events, if any, through the date that the financial statements were issued have been evaluated in the preparation of
Annual Report
Notes to Financial Statements - continued
3. Significant Accounting Policies - continued
the financial statements. The following summarizes the significant accounting policies of the Fund:
Investment Valuation. Investments are valued as of 4:00 p.m. Eastern time on the last calendar day of the period. In accordance with valuation policies and procedures approved by the Board of Trustees (the Board), the Fund attempts to obtain prices from one or more third party pricing vendors or brokers to value its investments. When current market prices, quotations or currency exchange rates are not readily available or reliable, investments will be fair valued in good faith by the FMR Fair Value Committee (the Committee), in accordance with procedures adopted by the Board. Factors used in determining fair value vary by investment type and may include market or investment specific events. The frequency with which these procedures are used cannot be predicted and they may be utilized to a significant extent. The Committee oversees the Fund's valuation policies and procedures and is responsible for approving and reporting to the Board all fair value determinations.
The Fund categorizes the inputs to valuation techniques used to value its investments into a disclosure hierarchy consisting of three levels as shown below:
Level 1 - quoted prices in active markets for identical investments
Level 2 - other significant observable inputs (including quoted prices for similar investments, interest rates, prepayment speeds, etc.)
Level 3 - unobservable inputs (including the Fund's own assumptions based on the best information available)
Valuation techniques used to value the Fund's investments by major category are as follows:
Equity securities, including restricted securities, for which market quotations are readily available, are valued at the last reported sale price or official closing price as reported by a third party pricing vendor on the primary market or exchange on which they are traded and are categorized as Level 1 in the hierarchy. In the event there were no sales during the day or closing prices are not available, securities are valued at the last quoted bid price or may be valued using the last available price and are generally categorized as Level 2 in the hierarchy. For foreign equity securities, when market or security specific events arise, comparisons to the valuation of American Depositary Receipts (ADRs), futures contracts, Exchange-Traded Funds (ETFs) and certain indexes as well as quoted prices for similar securities may be used and would be categorized as Level 2 in the hierarchy. Utilizing these techniques may result in transfers between Level 1 and Level 2. For equity securities, including restricted securities, where observable inputs are limited, assumptions about market activity and risk are used and these securities may be categorized as Level 3 in the hierarchy.
Annual Report
3. Significant Accounting Policies - continued
Investment Valuation - continued
Investments in open-end mutual funds, including the Fidelity Central Funds, are valued at their closing net asset value (NAV) each business day and are categorized as Level 1 in the hierarchy.
Changes in valuation techniques may result in transfers in or out of an assigned level within the disclosure hierarchy. The aggregate value of investments by input level, as of October 31, 2013, including information on transfers between Levels 1 and 2 is included at the end of the Fund's Schedule of Investments.
Foreign Currency. The Fund may use foreign currency contracts to facilitate transactions in foreign-denominated securities. Gains and losses from these transactions may arise from changes in the value of the foreign currency or if the counterparties do not perform under the contracts' terms.
Foreign-denominated assets, including investment securities, and liabilities are translated into U.S. dollars at the exchange rates at period end. Purchases and sales of investment securities, income and dividends received and expenses denominated in foreign currencies are translated into U.S. dollars at the exchange rate in effect on the transaction date.
The effects of exchange rate fluctuations on investments are included with the net realized and unrealized gain (loss) on investment securities. Other foreign currency transactions resulting in realized and unrealized gain (loss) are disclosed separately.
Investment Transactions and Income. For financial reporting purposes, the Fund's investment holdings and net asset value include trades executed through the end of the last business day of the period. The NAV per share for processing shareholder transactions is calculated as of the close of business of the New York Stock Exchange (NYSE), normally 4:00 p.m. Eastern time and includes trades executed through the end of the prior business day. Gains and losses on securities sold are determined on the basis of identified cost and may include proceeds received from litigation. Dividend income is recorded on the ex-dividend date, except for certain dividends from foreign securities where the ex-dividend date may have passed, which are recorded as soon as the Fund is informed of the ex-dividend date. Non-cash dividends included in dividend income, if any, are recorded at the fair market value of the securities received. Distributions received on securities that represent a return of capital or capital gain are recorded as a reduction of cost of investments and/or as a realized gain. Subsequent to ex-dividend date the Fund determines the components of these distributions, based upon receipt of tax filings or other correspondence relating to the underlying investment. Interest income and distributions from the Fidelity Central Funds are accrued as earned. Interest income includes coupon interest and amortization of premium and accretion of discount
Annual Report
Notes to Financial Statements - continued
3. Significant Accounting Policies - continued
Investment Transactions and Income - continued
on debt securities. Investment income is recorded net of foreign taxes withheld where recovery of such taxes is uncertain.
Class Allocations and Expenses. Investment income, realized and unrealized capital gains and losses, common expenses of the Fund, and certain fund-level expense reductions, if any, are allocated daily on a pro-rata basis to each class based on the relative net assets of each class to the total net assets of the Fund. Each class differs with respect to transfer agent and distribution and service plan fees incurred. Certain expense reductions may also differ by class. For the reporting period, the allocated portion of income and expenses to each class as a percent of its average net assets may vary due to the timing of recording these transactions in relation to fluctuating net assets of the classes. Expenses directly attributable to a fund are charged to that fund. Expenses attributable to more than one fund are allocated among the respective funds on the basis of relative net assets or other appropriate methods. Expense estimates are accrued in the period to which they relate and adjustments are made when actual amounts are known.
Income Tax Information and Distributions to Shareholders. Each year, the Fund intends to qualify as a regulated investment company under Subchapter M of the Internal Revenue Code, including distributing substantially all of its taxable income and realized gains. As a result, no provision for U.S. Federal income taxes is required. As of October 31, 2013, the Fund did not have any unrecognized tax benefits in the financial statements; nor is the Fund aware of any tax positions for which it is reasonably possible that the total amounts of unrecognized tax benefits will significantly change in the next twelve months. The Fund files a U.S. federal tax return, in addition to state and local tax returns as required. The Fund's federal income tax returns are subject to examination by the Internal Revenue Service (IRS) for a period of three fiscal years after they are filed. State and local tax returns may be subject to examination for an additional fiscal year depending on the jurisdiction. Foreign taxes are provided for based on the Fund's understanding of the tax rules and rates that exist in the foreign markets in which it invests. The Fund is subject to a tax imposed on capital gains by certain countries in which it invests. An estimated deferred tax liability for net unrealized appreciation on the applicable securities is included in Other payables and accrued expenses on the Statement of Assets & Liabilities.
Distributions are declared and recorded on the ex-dividend date. Income dividends and capital gain distributions are declared separately for each class. Income and capital gain distributions are determined in accordance with income tax regulations, which may differ from GAAP.
Annual Report
3. Significant Accounting Policies - continued
Income Tax Information and Distributions to Shareholders - continued
Capital accounts within the financial statements are adjusted for permanent book-tax differences. These adjustments have no impact on net assets or the results of operations. Temporary book-tax differences will reverse in a subsequent period.
Book-tax differences are primarily due to foreign currency transactions, passive foreign investment companies (PFIC), partnerships, capital loss carryforwards and losses deferred due to wash sales.
The federal tax cost of investment securities and unrealized appreciation (depreciation) as of period end were as follows:
Gross unrealized appreciation | $ 63,585,282 |
Gross unrealized depreciation | (5,613,524) |
Net unrealized appreciation (depreciation) on securities and other investments | $ 57,971,758 |
| |
Tax Cost | $ 288,258,467 |
The tax-based components of distributable earnings as of period end were as follows:
Undistributed long-term capital gain | $ 3,268,059 |
Undistributed ordinary income | $ 8,977,623 |
Capital loss carryforward | $ (26,999,061) |
Net unrealized appreciation (depreciation) | $ 57,977,944 |
Capital loss carry forwards are only available to offset future capital gains of the Fund to the extent provided by regulations and may be limited. Under the Regulated Investment Company Modernization Act of 2012 (the Act), the Fund is permitted to carry forward capital losses incurred in taxable years beginning after December 22, 2010 for an unlimited period and such capital losses are required to be used prior to any losses that expire. Capital loss carryforwards were as follows:
Fiscal year of expiration: | |
2016 | $ (2,434,120) |
2017 | (15,708,944) |
2019 | (8,855,997) |
Total capital loss carryforward | $ (26,999,061) |
Due to large subscriptions in a prior period, $26,999,061 of capital losses that will be available to offset future capital gains of the Fund will be limited to approximately $4,535,766 per year.
Annual Report
Notes to Financial Statements - continued
3. Significant Accounting Policies - continued
Income Tax Information and Distributions to Shareholders - continued
The tax character of distributions paid was as follows:
| October 31, 2013 | October 31, 2012 |
Ordinary Income | $ 15,216,010 | $ 1,867,192 |
Long-term | 398,743 | - |
Total | $ 15,614,753 | $ 1,867,192 |
Short-Term Trading (Redemption) Fees. Shares held by investors in the Fund less than 30 days may have been subject to a redemption fee equal to 1.00% of the net asset value of shares redeemed. All redemption fees, which reduce the proceeds of the shareholder redemption, are retained by the Fund and accounted for as an addition to paid in capital.
Delayed Delivery Transactions and When-Issued Securities. During the period, the Fund transacted in securities on a delayed delivery or when-issued basis. Payment and delivery may take place after the customary settlement period for that security. The price of the underlying securities and the date when the securities will be delivered and paid for are fixed at the time the transaction is negotiated. The securities purchased on a delayed delivery or when-issued basis are identified as such in the Fund's Schedule of Investments. The Fund may receive compensation for interest forgone in the purchase of a delayed delivery or when-issued security. With respect to purchase commitments, the Fund identifies securities as segregated in its records with a value at least equal to the amount of the commitment. Losses may arise due to changes in the value of the underlying securities or if the counterparty does not perform under the contract's terms, or if the issuer does not issue the securities due to political, economic, or other factors.
New Accounting Pronouncement. The Financial Accounting Standards Board issued in December 2011, Accounting Standard Update No. 2011-11, Disclosures about Offsetting Assets and Liabilities, and in January 2013, Accounting Standards Update No. 2013-1 Clarifying the Scope of Disclosures about Offsetting Assets and Liabilities. These updates create new disclosure requirements requiring entities to disclose both gross and net information for derivatives and other financial instruments that are either offset in the Statement of Assets and Liabilities or subject to an enforceable master netting arrangement or similar agreement. The disclosure requirements are effective for annual reporting periods beginning on or after January 1, 2013, and interim periods within those annual periods. Management expects that the impact of the updates' adoption will be limited to additional financial statement disclosures as applicable.
Annual Report
4. Derivative Instruments.
Risk Exposures and the Use of Derivative Instruments. The Fund's investment objective allows the Fund to enter into various types of derivative contracts, including futures contracts. Derivatives are investments whose value is primarily derived from underlying assets, indices or reference rates and may be transacted on an exchange or over-the-counter (OTC). Derivatives may involve a future commitment to buy or sell a specified asset based on specified terms, to exchange future cash flows at periodic intervals based on a notional principal amount, or for one party to make one or more payments upon the occurrence of specified events in exchange for periodic payments from the other party.
The Fund used derivatives to increase returns and to manage exposure to certain risks as defined below. The success of any strategy involving derivatives depends on analysis of numerous economic factors, and if the strategies for investment do not work as intended, the Fund may not achieve its objectives.
The Fund's use of derivatives increased or decreased its exposure to the following risks:
Equity Risk | Equity risk relates to the fluctuations in the value of financial instruments as a result of changes in market prices (other than those arising from interest rate risk or foreign exchange risk), whether caused by factors specific to an individual investment, its issuer, or all factors affecting all instruments traded in a market or market segment. |
The Fund is also exposed to additional risks from investing in derivatives, such as liquidity risk and counterparty credit risk. Liquidity risk is the risk that the Fund will be unable to close out the derivative in the open market in a timely manner. Counterparty credit risk is the risk that the counterparty will not be able to fulfill its obligation to the Fund. Counterparty credit risk related to exchange-traded futures contracts may be mitigated by the protection provided by the exchange on which they trade.
Investing in derivatives may involve greater risks than investing in the underlying assets directly and, to varying degrees, may involve risk of loss in excess of any initial investment and collateral received and amounts recognized in the Statement of Assets and Liabilities. In addition, there may be the risk that the change in value of the derivative contract does not correspond to the change in value of the underlying instrument.
Futures Contracts. A futures contract is an agreement between two parties to buy or sell a specified underlying instrument for a fixed price at a specified future date. The Fund used futures contracts to manage its exposure to the stock market.
Upon entering into a futures contract, a fund is required to deposit either cash or securities (initial margin) with a clearing broker in an amount equal to a certain percentage of
Annual Report
Notes to Financial Statements - continued
4. Derivative Instruments - continued
Futures Contracts - continued
the face value of the contract. Futures contracts are marked-to-market daily and subsequent daily payments (variation margin) are made or received by a fund depending on the daily fluctuations in the value of the futures contracts and are recorded as unrealized appreciation or (depreciation). This receivable and/or payable, if any, is included in daily variation margin for derivative instruments in the Statement of Assets and Liabilities. Realized gain or (loss) is recorded upon the expiration or closing of a futures contract.
Any open futures contracts at period end are presented in the Schedule of Investments under the caption "Futures Contracts." The underlying face amount at value reflects each contract's exposure to the underlying instrument or index at period end.
During the period the Fund recognized net realized gain (loss) of $(175,371) related to its investment in futures contracts. This amount is included in the Statement of Operations.
5. Purchases and Sales of Investments.
Purchases and sales of securities, other than short-term securities, aggregated $291,344,236 and $292,758,849, respectively.
6. Fees and Other Transactions with Affiliates.
Management Fee. FMR and its affiliates provide the Fund with investment management related services for which the Fund pays a monthly management fee. The management fee is the sum of an individual fund fee rate that is based on an annual rate of .45% of the Fund's average net assets and an annualized group fee rate that averaged .25% during the period. The group fee rate is based upon the average net assets of all the mutual funds advised by FMR, including any mutual funds previously advised by FMR that are currently advised by Fidelity SelectCo, LLC, an affiliate of FMR. The group fee rate decreases as assets under management increase and increases as assets under management decrease. In addition, the management fee is subject to a performance adjustment (up to a maximum of ± .20% of the Fund's average net assets over a 36 month performance period). The upward or downward adjustment to the management fee is based on the relative investment performance of Total International Equity as compared to an appropriate benchmark index over the same 36 month performance period. For the reporting period, the total annual management fee rate, including the performance adjustment, was .77% of the Fund's average net assets. The performance adjustment included in the management fee rate may be higher or lower than the maximum performance adjustment rate due to the difference between the average net assets for the reporting and performance periods.
Annual Report
6. Fees and Other Transactions with Affiliates - continued
Distribution and Service Plan Fees. In accordance with Rule 12b-1 of the 1940 Act, the Fund has adopted separate Distribution and Service Plans for each class of shares. Certain classes pay Fidelity Distributors Corporation (FDC), an affiliate of FMR, separate Distribution and Service Fees, each of which is based on an annual percentage of each class' average net assets. In addition, FDC may pay financial intermediaries for selling shares of the Fund and providing shareholder support services. For the period, the Distribution and Service Fee rates, total fees and amounts retained by FDC were as follows:
| Distribution
Fee | Service
Fee | Total Fees | Retained
by FDC |
Class A | -% | .25% | $ 19,245 | $ 355 |
Class T | .25% | .25% | 26,314 | 52 |
Class B | .75% | .25% | 2,095 | 1,584 |
Class C | .75% | .25% | 31,831 | 4,423 |
| | | $ 79,485 | $ 6,414 |
Sales Load. FDC may receive a front-end sales charge of up to 5.75% for selling Class A shares and 3.50% for selling Class T shares, some of which is paid to financial intermediaries for selling shares of the Fund. Depending on the holding period, FDC may receive contingent deferred sales charges levied on Class A, Class T, Class B, and Class C redemptions. The deferred sales charges range from 5.00% to 1.00% for Class B shares, 1.00% for Class C shares, 1.00% for certain purchases of Class A shares and .25% for certain purchases of Class T shares. For the period, sales charge amounts retained by FDC were as follows:
| Retained
by FDC |
Class A | $ 3,610 |
Class T | 1,591 |
Class B* | 630 |
Class C* | 352 |
| $ 6,183 |
* When Class B and Class C shares are initially sold, FDC pays commissions from its own resources to financial intermediaries through which the sales are made.
Transfer Agent Fees. Fidelity Investments Institutional Operations Company, Inc., (FIIOC), an affiliate of FMR, is the transfer, dividend disbursing and shareholder servicing agent for each class of the Fund. FIIOC receives account fees and asset-based fees that vary according to the account size and type of account of the shareholders of the respective classes of the Fund. FIIOC pays for typesetting, printing and mailing of shareholder reports, except proxy statements.
Annual Report
Notes to Financial Statements - continued
6. Fees and Other Transactions with Affiliates - continued
Transfer Agent Fees - continued
For the period, transfer agent fees for each class were as follows:
| Amount | % of
Average
Net Assets* |
Class A | $ 22,457 | .29 |
Class T | 15,623 | .29 |
Class B | 627 | .30 |
Class C | 9,616 | .30 |
Total International Equity | 424,331 | .13 |
Institutional Class | 5,472 | .26 |
| $ 478,126 | |
Accounting and Security Lending Fees. Fidelity Service Company, Inc. (FSC), an affiliate of FMR, maintains the Fund's accounting records. The accounting fee is based on the level of average net assets for each month. Under a separate contract, FSC administers the security lending program. The security lending fee is based on the number and duration of lending transactions.
Brokerage Commissions. The Fund placed a portion of its portfolio transactions with brokerage firms which are affiliates of the investment adviser. Brokerage commissions are included in net realized gain (loss) and change in net unrealized appreciation (depreciation) in the Statement of Operations. The commissions paid to these affiliated firms were $625 for the period.
7. Committed Line of Credit.
The Fund participates with other funds managed by FMR or an affiliate in a $4.25 billion credit facility (the "line of credit") to be utilized for temporary or emergency purposes to fund shareholder redemptions or for other short-term liquidity purposes. The Fund has agreed to pay commitment fees on its pro-rata portion of the line of credit, which amounted to $721 and is reflected in Miscellaneous expenses on the Statement of Operations. During the period, there were no borrowings on this line of credit.
8. Security Lending.
The Fund lends portfolio securities through a lending agent from time to time in order to earn additional income. For equity securities, a lending agent is used and may loan securities to certain qualified borrowers, including Fidelity Capital Markets (FCM), a broker-dealer affiliated with the Fund. On the settlement date of the loan, the Fund
Annual Report
8. Security Lending - continued
receives collateral (in the form of U.S. Treasury obligations, letters of credit and/or cash) against the loaned securities and maintains collateral in an amount not less than 100% of the market value of the loaned securities during the period of the loan. The market value of the loaned securities is determined at the close of business of the Fund and any additional required collateral is delivered to the Fund on the next business day. If the borrower defaults on its obligation to return the securities loaned because of insolvency or other reasons, the Fund may apply collateral received from the borrower against the obligation. The Fund may experience delays and costs in recovering the securities loaned. Any cash collateral received is invested in the Fidelity Securities Lending Cash Central Fund. At period end, there were no security loans outstanding. Security lending income represents the income earned on investing cash collateral, less rebates paid to borrowers and any lending agent fees associated with the loan, plus any premium payments received for lending certain types of securities. Security lending income is presented in the Statement of Operations as a component of income from Fidelity Central Funds. Total security lending income during the period amounted to $117,973. During the period, there were no securities loaned to FCM.
9. Expense Reductions.
FMR contractually agreed to reimburse each class to the extent annual operating expenses exceeded certain levels of average net assets as noted in the table below. This reimbursement will remain in place through December 31, 2014. Some expenses, for example interest expense, including commitment fees, are excluded from this reimbursement.
The following classes were in reimbursement during the period:
| Expense
Limitations | Reimbursement |
Class A | 1.45% | $ 3,717 |
Class T | 1.70% | 2,651 |
Class B | 2.20% | 120 |
Class C | 2.20% | 1,829 |
Institutional Class | 1.20% | 308 |
| | $ 8,625 |
Commissions paid to certain brokers with whom FMR, or its affiliates, places trades include an amount in addition to trade execution, which may be rebated back to the Fund to offset certain expenses. This amount totaled $73,605 for the period.
In addition, FMR reimbursed a portion of the Fund's operating expenses during the period in the amount of $3,737.
Annual Report
Notes to Financial Statements - continued
10. Distributions to Shareholders.
Distributions to shareholders of each class were as follows:
Years ended October 31, | 2013 | 2012 |
From net investment income | | |
Class A | $ 102,760 | $ 48,329 |
Class T | 49,034 | 9,062 |
Class B | 1,541 | 714 |
Class C | 28,314 | 4,731 |
Total International Equity | 5,630,153 | 1,801,469 |
Institutional Class | 33,750 | 2,887 |
Total | $ 5,845,552 | $ 1,867,192 |
From net realized gain | | |
Class A | $ 199,811 | $ - |
Class T | 93,853 | - |
Class B | 6,990 | - |
Class C | 92,492 | - |
Total International Equity | 9,320,186 | - |
Institutional Class | 55,869 | - |
Total | $ 9,769,201 | $ - |
11. Share Transactions.
Transactions for each class of shares were as follows:
| Shares | Dollars |
Years ended October 31, | 2013 | 2012 | 2013 | 2012 |
Class A | | | | |
Shares sold | 510,102 | 388,955 | $ 3,880,513 | $ 2,677,369 |
Reinvestment of distributions | 41,103 | 7,157 | 293,886 | 46,237 |
Shares redeemed | (248,440) | (252,362) | (1,903,860) | (1,699,392) |
Net increase (decrease) | 302,765 | 143,750 | $ 2,270,539 | $ 1,024,214 |
Class T | | | | |
Shares sold | 807,518 | 207,939 | $ 6,202,497 | $ 1,463,372 |
Reinvestment of distributions | 19,724 | 1,377 | 142,209 | 8,993 |
Shares redeemed | (195,438) | (38,757) | (1,518,035) | (259,817) |
Net increase (decrease) | 631,804 | 170,559 | $ 4,826,671 | $ 1,212,548 |
Class B | | | | |
Shares sold | 827 | 4,797 | $ 6,304 | $ 32,306 |
Reinvestment of distributions | 1,165 | 108 | 8,437 | 705 |
Shares redeemed | (8,955) | (12,955) | (69,218) | (88,815) |
Net increase (decrease) | (6,963) | (8,050) | $ (54,477) | $ (55,804) |
Annual Report
11. Share Transactions - continued
| Shares | Dollars |
Years ended October 31, | 2013 | 2012 | 2013 | 2012 |
Class C | | | | |
Shares sold | 129,341 | 258,694 | $ 986,204 | $ 1,733,640 |
Reinvestment of distributions | 12,546 | 710 | 90,328 | 4,622 |
Shares redeemed | (83,065) | (94,222) | (635,648) | (638,538) |
Net increase (decrease) | 58,822 | 165,182 | $ 440,884 | $ 1,099,724 |
Total International Equity | | | | |
Shares sold | 10,376,724 | 32,478,543 | $ 77,880,274 | $ 209,916,522 |
Reinvestment of distributions | 2,062,441 | 266,160 | 14,746,450 | 1,719,395 |
Shares redeemed | (11,840,491) | (13,867,286) | (90,585,484) | (93,416,780) |
Net increase (decrease) | 598,674 | 18,877,417 | $ 2,041,240 | $ 118,219,137 |
Institutional Class | | | | |
Shares sold | 142,800 | 198,611 | $ 1,078,337 | $ 1,289,078 |
Reinvestment of distributions | 12,587 | 448 | 89,619 | 2,887 |
Shares redeemed | (75,629) | (21,161) | (583,086) | (144,436) |
Net increase (decrease) | 79,758 | 177,898 | $ 584,870 | $ 1,147,529 |
12. Other.
The Fund's organizational documents provide former and current trustees and officers with a limited indemnification against liabilities arising in connection with the performance of their duties to the Fund. In the normal course of business, the Fund may also enter into contracts that provide general indemnifications. The Fund's maximum exposure under these arrangements is unknown as this would be dependent on future claims that may be made against the Fund. The risk of material loss from such claims is considered remote.
At the end of the period, a shareholder of record owned approximately 71% of the total outstanding shares of the Fund.
Annual Report
To the Trustees of Fidelity Investment Trust and Shareholders of Fidelity Total International Equity Fund:
We have audited the accompanying statement of assets and liabilities of Fidelity Total International Equity Fund (the Fund), a fund of Fidelity Investment Trust, including the schedule of investments, as of October 31, 2013, and the related statement of operations for the year then ended, the statement of changes in net assets for each of the two years in the period then ended, and the financial highlights for each of the five years in the period then ended. These financial statements and financial highlights are the responsibility of the Fund's management. Our responsibility is to express an opinion on these financial statements and financial highlights based on our audits.
We conducted our audits in accordance with the standards of the Public Company Accounting Oversight Board (United States). Those standards require that we plan and perform the audit to obtain reasonable assurance about whether the financial statements and financial highlights are free of material misstatement. The Fund is not required to have, nor were we engaged to perform, an audit of its internal control over financial reporting. Our audits included consideration of internal control over financial reporting as a basis for designing audit procedures that are appropriate in the circumstances, but not for the purpose of expressing an opinion on the effectiveness of the Fund's internal control over financial reporting. Accordingly, we express no such opinion. An audit also includes examining, on a test basis, evidence supporting the amounts and disclosures in the financial statements, assessing the accounting principles used and significant estimates made by management, as well as evaluating the overall financial statement presentation. Our procedures included confirmation of securities owned as of October 31, 2013, by correspondence with the custodians and brokers; where replies were not received from brokers, we performed other auditing procedures. We believe that our audits provide a reasonable basis for our opinion.
In our opinion, the financial statements and financial highlights referred to above present fairly, in all material respects, the financial position of Fidelity Total International Equity Fund as of October 31, 2013, the results of its operations for the year then ended, the changes in its net assets for each of the two years in the period then ended, and the financial highlights for each of the five years in the period then ended, in conformity with accounting principles generally accepted in the United States of America.
DELOITTE & TOUCHE LLP
Boston, Massachusetts
December 11, 2013
Annual Report
The Trustees, Member of the Advisory Board, and executive officers of the trust and fund, as applicable, are listed below. The Board of Trustees governs the fund and is responsible for protecting the interests of shareholders. The Trustees are experienced executives who meet periodically throughout the year to oversee the fund's activities, review contractual arrangements with companies that provide services to the fund, oversee management of the risks associated with such activities and contractual arrangements, and review the fund's performance. Except for James C. Curvey, Ned C. Lautenbach, Ronald P. O'Hanley, and William S. Stavropoulos, each of the Trustees oversees 171 funds. Mr. Curvey oversees 394 funds. Mr. Lautenbach, Mr. O'Hanley, and Mr. Stavropoulos each oversees 245 funds.
The Trustees hold office without limit in time except that (a) any Trustee may resign; (b) any Trustee may be removed by written instrument, signed by at least two-thirds of the number of Trustees prior to such removal; (c) any Trustee who requests to be retired or who has become incapacitated by illness or injury may be retired by written instrument signed by a majority of the other Trustees; and (d) any Trustee may be removed at any special meeting of shareholders by a two-thirds vote of the outstanding voting securities of the trust. Each Trustee who is not an interested person of the trust and the fund (as defined in the 1940 Act) (Independent Trustee), shall retire not later than the last day of the calendar year in which his or her 75th birthday occurs. The Independent Trustees may waive this mandatory retirement age policy with respect to individual Trustees. The executive officers and Advisory Board Member hold office without limit in time, except that any officer and Advisory Board Member may resign or may be removed by a vote of a majority of the Trustees at any regular meeting or any special meeting of the Trustees. Except as indicated, each individual has held the office shown or other offices in the same company for the past five years.
Experience, Skills, Attributes, and Qualifications of the Fund's Trustees. The Governance and Nominating Committee has adopted a statement of policy that describes the experience, qualifications, attributes, and skills that are necessary and desirable for potential Independent Trustee candidates (Statement of Policy). The Board believes that each Trustee satisfied at the time he or she was initially elected or appointed a Trustee, and continues to satisfy, the standards contemplated by the Statement of Policy. The Governance and Nominating Committee also engages professional search firms to help identify potential Independent Trustee candidates who have the experience, qualifications, attributes, and skills consistent with the Statement of Policy. From time to time, additional criteria based on the composition and skills of the current Independent Trustees, as well as experience or skills that may be appropriate in light of future changes to board composition, business conditions, and regulatory or other developments, have also been considered by the professional search firms and the Governance and Nominating Committee. In addition, the Board takes into account the Trustees' commitment and participation in Board and committee meetings, as well as their leadership of standing and ad hoc committees throughout their tenure.
Annual Report
In determining that a particular Trustee was and continues to be qualified to serve as a Trustee, the Board has considered a variety of criteria, none of which, in isolation, was controlling. The Board believes that, collectively, the Trustees have balanced and diverse experience, qualifications, attributes, and skills, which allow the Board to operate effectively in governing the fund and protecting the interests of shareholders. Information about the specific experience, skills, attributes, and qualifications of each Trustee, which in each case led to the Board's conclusion that the Trustee should serve (or continue to serve) as a trustee of the fund, is provided below.
Board Structure and Oversight Function. James C. Curvey is an interested person (as defined in the 1940 Act) and currently serves as Chairman. The Trustees have determined that an interested Chairman is appropriate and benefits shareholders because an interested Chairman has a personal and professional stake in the quality and continuity of services provided to the fund. Independent Trustees exercise their informed business judgment to appoint an individual of their choosing to serve as Chairman, regardless of whether the Trustee happens to be independent or a member of management. The Independent Trustees have determined that they can act independently and effectively without having an Independent Trustee serve as Chairman and that a key structural component for assuring that they are in a position to do so is for the Independent Trustees to constitute a substantial majority for the Board. The Independent Trustees also regularly meet in executive session. Ned C. Lautenbach serves as Chairman of the Independent Trustees and as such (i) acts as a liaison between the Independent Trustees and management with respect to matters important to the Independent Trustees and (ii) with management prepares agendas for Board meetings.
Fidelity funds are overseen by different Boards of Trustees. The fund's Board oversees Fidelity's equity and high income funds and another Board oversees Fidelity's investment-grade bond, money market, and asset allocation funds. The asset allocation funds may invest in Fidelity funds overseen by the fund's Board. The use of separate Boards, each with its own committee structure, allows the Trustees of each group of Fidelity funds to focus on the unique issues of the funds they oversee, including common research, investment, and operational issues. On occasion, the separate Boards establish joint committees to address issues of overlapping consequences for the Fidelity funds overseen by each Board.
The Trustees operate using a system of committees to facilitate the timely and efficient consideration of all matters of importance to the Trustees, the fund, and fund shareholders and to facilitate compliance with legal and regulatory requirements and oversight of the fund's activities and associated risks. The Board, acting through its committees, has charged FMR and its affiliates with (i) identifying events or circumstances the occurrence of which could have demonstrably adverse effects on the fund's business and/or reputation; (ii) implementing processes and controls to lessen the possibility that such events or circumstances occur or to mitigate the effects of such events or circumstances if they do occur; and (iii) creating and maintaining a system designed to evaluate continuously business and market conditions in order to facilitate the identification and implementation processes described in (i) and (ii) above. Because the day-to-day operations and activities of the fund are carried out by or through FMR, its affiliates and other service providers, the fund's exposure to risks is mitigated but not eliminated by the processes overseen by the Trustees. While each of the Board's committees has responsibility for overseeing different aspects of the fund's activities, oversight is exercised primarily through the Operations, Audit, and Compliance Committees. In addition, the Independent Trustees have worked with FMR to enhance the Board's oversight of investment and financial risks, legal and regulatory risks, technology risks, and operational risks, including the development of additional risk reporting to the Board. For example, a working group comprised of Independent Trustees and FMR has worked and continues to work to review the Fidelity funds' valuation-related activities, reporting and risk management. Appropriate personnel, including but not limited to the fund's Chief Compliance Officer (CCO), FMR's internal auditor, the independent accountants, the fund's Treasurer and portfolio management personnel, make periodic reports to the Board's committees, as appropriate, including an annual review of FMR's risk management program for the Fidelity funds. The responsibilities of each standing committee, including their oversight responsibilities, are described further under "Standing Committees of the Fund's Trustees."
Annual Report
Trustees and Officers - continued
The fund's Statement of Additional Information (SAI) includes more information about the Trustees. To request a free copy, call Fidelity at 1-800-544-8544.
Interested Trustees*:
Correspondence intended for each Trustee who is an interested person may be sent to Fidelity Investments, 245 Summer Street, Boston, Massachusetts 02210.
Name, Year of Birth; Principal Occupations and Other Relevant Experience+ |
James C. Curvey (1935) |
Year of Election or Appointment: 2007 Trustee Chairman of the Board of Trustees |
| Mr. Curvey also serves as Trustee of other Fidelity funds. Mr. Curvey is a Director of Fidelity Investments Money Management, Inc. (2009-present), Director of Fidelity Research & Analysis Co. (2009-present) and Director of FMR and FMR Co., Inc. (2007-present). Mr. Curvey is also Vice Chairman (2007-present) and Director of FMR LLC. In addition, Mr. Curvey serves as an Overseer for the Boston Symphony Orchestra and a member of the Trustees of Villanova University. Previously, Mr. Curvey was the Vice Chairman (2006-2007) and Director (2000-2007) of FMR Corp. |
Ronald P. O'Hanley (1957) |
Year of Election or Appointment: 2011 Trustee |
| Mr. O'Hanley also serves as Trustee of other Fidelity funds. He is Director of Fidelity SelectCo, LLC (2013-present), FMR Co., Inc. (2010-present), Director of Fidelity Investments Money Management, Inc. (2010-present), Director of Fidelity Research & Analysis Company (2010-present), President of Fidelity Asset Management and Corporate Services and a Member of Fidelity's Executive Committee (2010-present). Previously, Mr. O'Hanley served as President and Chief Executive Officer of BNY Mellon Asset Management (2007-2010). Mr. O'Hanley also served as Vice Chairman of Bank New York Mellon Corp. and a member of that firm's Executive Committee. Prior to the 2007 merger of The Bank of New York and Mellon Financial Corporation, he was Vice Chairman of Mellon Financial Corporation and President and Chief Executive Officer of Mellon Asset Management. He joined Mellon in February 1997. Mr. O'Hanley currently serves as Chairman of the Boston Public Library Foundation Board of Directors and sits on the Board of Directors of Beth Israel Deaconess Medical Center, the Board of Trustees of the Marine Biological Laboratory and the Advisory Board of the Maxwell School of Citizenship and Public Administration at Syracuse University. Mr. O'Hanley also chairs the Council on Asset Management for the Financial Services Roundtable and is a member of the Board of Directors of Institutional Investor's U.S. Institute. |
* Trustees have been determined to be "Interested Trustees" by virtue of, among other things, their affiliation with the trust or various entities under common control with FMR.
+ The information above includes each Trustee's principal occupation during the last five years and other information relating to the experience, attributes, and skills relevant to each Trustee's qualifications to serve as a Trustee, which led to the conclusion that each Trustee should serve as a Trustee for the fund.
Annual Report
Trustees and Officers - continued
Independent Trustees:
Correspondence intended for each Independent Trustee (that is, the Trustees other than the Interested Trustees) may be sent to Fidelity Investments, P.O. Box 55235, Boston, Massachusetts 02205-5235.
Name, Year of Birth; Principal Occupations and Other Relevant Experience+ |
Dennis J. Dirks (1948) |
Year of Election or Appointment: 2005 Trustee |
| Mr. Dirks also serves as Trustee of other Fidelity funds. Prior to his retirement in May 2003, Mr. Dirks was Chief Operating Officer and a member of the Board of The Depository Trust & Clearing Corporation (DTCC). He also served as President, Chief Operating Officer, and Board member of The Depository Trust Company (DTC) and President and Board member of the National Securities Clearing Corporation (NSCC). In addition, Mr. Dirks served as Chief Executive Officer and Board member of the Government Securities Clearing Corporation, Chief Executive Officer and Board member of the Mortgage-Backed Securities Clearing Corporation, as a Trustee and a member of the Finance Committee of Manhattan College (2005-2008), and as a Trustee and a member of the Finance Committee of AHRC of Nassau County (2006-2008). Mr. Dirks is a member of the Independent Directors Council (IDC) Governing Council (2010-present) and Board of Directors for The Brookville Center for Children's Services, Inc. (2009-present). |
Alan J. Lacy (1953) |
Year of Election or Appointment: 2008 Trustee |
| Mr. Lacy also serves as Trustee of other Fidelity funds. Mr. Lacy serves as Senior Adviser (2007-present) of Oak Hill Capital Partners, L.P. (private equity). Mr. Lacy also served as Chief Executive Officer (2000-2005) and Vice Chairman (2005-2006) of Sears Holdings Corporation and Sears, Roebuck and Co. (retail). In addition, Mr. Lacy serves as a member of the Board of Directors of Dave & Buster's Entertainment, Inc. (restaurant and entertainment complexes, 2010-present), Earth Fare, Inc. (retail grocery, 2012-present), The Hillman Companies, Inc. (hardware wholesalers, 2010-present), and Bristol-Myers Squibb Company (global pharmaceuticals, 2008-present). Mr. Lacy is a member of the Board of Trustees of The National Parks Conservation Association (2006-present). Previously, Mr. Lacy served as Chairman of the Board of Trustees of the National Parks Conservation Association (2008-2011) and as a member of the Board of Directors for the Western Union Company (global money transfer, 2006-2011). |
Ned C. Lautenbach (1944) |
Year of Election or Appointment: 2000 Trustee Chairman of the Independent Trustees |
| Mr. Lautenbach also serves as Trustee of other Fidelity funds. Mr. Lautenbach currently serves as the Lead Director of the Eaton Corporation Board of Directors (diversified industrial, 1997-present). Mr. Lautenbach is Chairman of the Board of Directors of the Philharmonic Center for the Arts in Naples, Florida (2012-present) and a member of the Council on Foreign Relations (1994-present). Previously, Mr. Lautenbach was a Partner/Advisory Partner at Clayton, Dubilier & Rice, LLC (private equity investment, 1998-2010), as well as a Director of Sony Corporation (2006-2007). |
Joseph Mauriello (1944) |
Year of Election or Appointment: 2008 Trustee |
| Mr. Mauriello also serves as Trustee of other Fidelity funds. Prior to his retirement in January 2006, Mr. Mauriello served in numerous senior management positions including Deputy Chairman and Chief Operating Officer (2004-2005), and Vice Chairman of Financial Services (2002-2004) of KPMG LLP US (professional services, 1965-2005). Mr. Mauriello currently serves as a member of the Board of Directors of XL Group plc. (global insurance and re-insurance, 2006-present). Previously, Mr. Mauriello served as a Director of the Hamilton Funds of the Bank of New York (2006-2007) and of Arcadia Resources Inc. (health care services and products, 2007-2012). |
Robert W. Selander (1950) |
Year of Election or Appointment: 2011 Trustee |
| Mr. Selander also serves as Trustee of other Fidelity funds. Previously, Mr. Selander served as a Member of the Advisory Board of other Fidelity funds (2011), and Executive Vice Chairman (2010), Chief Executive Officer (2009-2010), and President and Chief Executive Officer (1997-2009) of Mastercard, Inc. |
Cornelia M. Small (1944) |
Year of Election or Appointment: 2005 Trustee |
| Ms. Small also serves as Trustee of other Fidelity funds. Ms. Small is a member of the Board of Directors (2009-present) and Chair of the Investment Committee (2010-present) of the Teagle Foundation. Ms. Small also serves on the Investment Committee of the Berkshire Taconic Community Foundation (2008-present). Previously, Ms. Small served as Chairperson (2002-2008) and a member of the Investment Committee and Chairperson (2008-2012) and a member of the Board of Trustees of Smith College. In addition, Ms. Small served as Chief Investment Officer, Director of Global Equity Investments, and a member of the Board of Directors of Scudder, Stevens & Clark and Scudder Kemper Investments. |
William S. Stavropoulos (1939) |
Year of Election or Appointment: 2001 Trustee Vice Chairman of the Independent Trustees |
| Mr. Stavropoulos also serves as Trustee of other Fidelity funds. Mr. Stavropoulos serves as President and Founder of the Michigan Baseball Foundation, the Great Lakes Loons (2007-present). Mr. Stavropoulos is Chairman Emeritus of the Board of Directors of The Dow Chemical Company, where he previously served in numerous senior management positions, including President, CEO (1995-2000; 2002-2004), Chairman of the Executive Committee (2000-2006), and as a member of the Board of Directors (1990-2006). Currently, Mr. Stavropoulos is Chairman of the Board of Directors of Univar Inc. (global distributor of commodity and specialty chemicals), a Director of Teradata Corporation (data warehousing and technology solutions), and Maersk Inc. (industrial conglomerate), and a member of the Advisory Board for Metalmark Capital LLC (private equity investment, 2005-present). Mr. Stavropoulos is an operating advisor to Clayton, Dubilier & Rice, LLC (private equity investment). In addition, Mr. Stavropoulos is a member of the University of Notre Dame Advisory Council for the College of Science, a Trustee of the Rollin L. Gerstacker Foundation, and a Director of the Naples Philharmonic Center for the Arts. Previously, Mr. Stavropoulos served as a Director of Chemical Financial Corporation (bank holding company, 1993-2012) and Tyco International, Ltd. (multinational manufacturing and services, 2007-2012). |
David M. Thomas (1949) |
Year of Election or Appointment: 2008 Trustee |
| Mr. Thomas also serves as Trustee of other Fidelity funds. Mr. Thomas serves as Non-Executive Chairman of the Board of Directors of Fortune Brands Home and Security (home and security products, 2011-present), and as a member of the Board of Directors of Interpublic Group of Companies, Inc. (marketing communication, 2004-present). Previously, Mr. Thomas served as Executive Chairman (2005-2006) and Chairman and Chief Executive Officer (2000-2005) of IMS Health, Inc. (pharmaceutical and healthcare information solutions), and a Director of Fortune Brands, Inc. (consumer products, 2000-2011). |
+ The information above includes each Trustee's principal occupation during the last five years and other information relating to the experience, attributes, and skills relevant to each Trustee's qualifications to serve as a Trustee, which led to the conclusion that each Trustee should serve as a Trustee for the fund.
Advisory Board Member and Executive Officers:
Correspondence intended for each executive officer and Peter S. Lynch may be sent to Fidelity Investments, 245 Summer Street, Boston, Massachusetts 02210. Executive officers appear below in alphabetical order.
Name, Year of Birth; Principal Occupation |
Peter S. Lynch (1944) |
Year of Election or Appointment: 2003 Member of the Advisory Board |
| Mr. Lynch also serves as Member of the Advisory Board of other Fidelity funds. Mr. Lynch is Vice Chairman and a Director of FMR and FMR Co., Inc. In addition, Mr. Lynch serves as a Trustee of Boston College and as the Chairman of the Inner-City Scholarship Fund. Previously, Mr. Lynch served on the Special Olympics International Board of Directors (1997-2006). |
Elizabeth Paige Baumann (1968) |
Year of Election or Appointment: 2012 Anti-Money Laundering (AML) Officer |
| Ms. Baumann also serves as AML Officer of other funds. She is Chief AML Officer of FMR LLC (2012-present) and is an employee of Fidelity Investments. Previously, Ms. Baumann served as Vice President and Deputy Anti-Money Laundering Officer (2007-2012). |
William C. Coffey (1969) |
Year of Election or Appointment: 2009 Assistant Secretary |
| Mr. Coffey also serves as Assistant Secretary of other funds. He is Senior Vice President and Deputy General Counsel of FMR LLC (2010-present), and is an employee of Fidelity Investments. Previously, Mr. Coffey served as Vice President and Associate General Counsel of FMR LLC (2005-2009). |
Jonathan Davis (1968) |
Year of Election or Appointment: 2010 Assistant Treasurer |
| Mr. Davis also serves as Assistant Treasurer of other funds. Mr. Davis is an employee of Fidelity Investments. Previously, Mr. Davis served as Vice President and Associate General Counsel of FMR LLC (2003-2010). |
Adrien E. Deberghes (1967) |
Year of Election or Appointment: 2008 Deputy Treasurer |
| Mr. Deberghes also serves as an officer of other funds. He is an employee of Fidelity Investments (2008-present). Prior to joining Fidelity Investments, Mr. Deberghes was Senior Vice President of Mutual Fund Administration at State Street Corporation (2007-2008), Senior Director of Mutual Fund Administration at Investors Bank & Trust (2005-2007), and Director of Finance for Dunkin' Brands (2000-2005). |
Stephanie J. Dorsey (1969) |
Year of Election or Appointment: 2010 Assistant Treasurer |
| Ms. Dorsey also serves as an officer of other funds. She is an employee of Fidelity Investments (2008-present) and has served in other fund officer roles. Prior to joining Fidelity Investments, Ms. Dorsey served as Treasurer (2004-2008) of the JPMorgan Mutual Funds and Vice President (2004-2008) of JPMorgan Chase Bank. |
Scott C. Goebel (1968) |
Year of Election or Appointment: 2008 Secretary and Chief Legal Officer (CLO) |
| Mr. Goebel serves as Secretary and CLO of other funds. Mr. Goebel also serves as Secretary of Fidelity Investments Money Management, Inc. (FIMM) (2010-present) and Fidelity Research and Analysis Company (FRAC) (2010-present); General Counsel, Secretary, and Senior Vice President of FMR (2008-present) and FMR Co., Inc. (2008-present); Chief Legal Officer of Fidelity Management & Research (Hong Kong) Limited (2008-present) and Assistant Secretary of Fidelity Management & Research (Japan) Inc. (2008-present), and Fidelity Management & Research (U.K.) Inc. (2008-present). Previously, Mr. Goebel served as Secretary and CLO of other Fidelity funds (2008-2013), Assistant Secretary of FIMM (2008-2010), FRAC (2008-2010), and certain funds (2007-2008); and as Vice President and Secretary of Fidelity Distributors Corporation (FDC) (2005-2007). Mr. Goebel has been employed by FMR LLC or an affiliate since 2001. |
Joseph A. Hanlon (1968) |
Year of Election or Appointment: 2012 Chief Compliance Officer |
| Mr. Hanlon also serves as Chief Compliance Officer of other funds. Mr. Hanlon serves as Compliance Officer of FMR, FMR Co., Inc., Fidelity Investments Money Management, Inc. (FIMM), Fidelity Research and Analysis Company (FRAC), and Fidelity Management & Research (Hong Kong) (2009-present), as Senior Vice President of the Fidelity Asset Management Division (2009-present), and is an employee of Fidelity Investments. Previously, Mr. Hanlon served as Compliance Officer of Fidelity Management & Research (Japan) Inc. (2009-2013), Strategic Advisers, Inc. (2009-2013), and Fidelity Management & Research (U.K.) Inc. (2009-2013). |
Bruce T. Herring (1965) |
Year of Election or Appointment: 2006 Vice President of certain Equity Funds |
| Mr. Herring also serves as Vice President of other funds. He serves as Chief Investment Officer of Fidelity Global Asset Allocation (GAA) (2013-present), Chief Investment Officer and Director of Fidelity Management & Research (U.K.) Inc. (2010-present), Group Chief Investment Officer of FMR, and President of Fidelity Research & Analysis Company (2010-present). Previously, Mr. Herring served as Vice President (2005-2006) and Senior Vice President (2006-2007) of Fidelity Management & Research Company, Vice President of FMR Co., Inc. (2001-2007), and as a portfolio manager for Fidelity U.S. Equity Funds. |
Brian B. Hogan (1964) |
Year of Election or Appointment: 2009 Vice President |
| Mr. Hogan also serves as Vice President of other funds. Mr. Hogan serves as President of FMR's Equity Division (2009-present). Previously, Mr. Hogan served as Senior Vice President, Equity Research of FMR (2006-2009) and as a portfolio manager. |
Chris Maher (1972) |
Year of Election or Appointment: 2013 Assistant Treasurer |
| Mr. Maher serves as Assistant Treasurer of other funds. Mr. Maher is Vice President of Valuation Oversight and is an employee of Fidelity Investments. Previously, Mr. Maher served as Vice President of Asset Management Compliance (2013), Vice President of FMR's Program Management Group (2010-2013), and Vice President of Valuation Oversight (2008-2010). |
Christine Reynolds (1958) |
Year of Election or Appointment: 2008 Chief Financial Officer |
| Ms. Reynolds also serves as Chief Financial Officer of other funds. Ms. Reynolds became President of Fidelity Pricing and Cash Management Services (FPCMS) in August 2008. Ms. Reynolds served as Chief Operating Officer of FPCMS (2007-2008). Previously, Ms. Reynolds served as President, Treasurer, and Anti-Money Laundering officer of the Fidelity funds (2004-2007). |
Kenneth B. Robins (1969) |
Year of Election or Appointment: 2008 President and Treasurer |
| Mr. Robins also serves as an officer of other funds. Mr. Robins serves as Executive Vice President of Fidelity Investments Money Management, Inc. (FIMM) (2013-present) and is an employee of Fidelity Investments (2004-present). Previously, Mr. Robins served in other fund officer roles. |
Gary W. Ryan (1958) |
Year of Election or Appointment: 2005 Assistant Treasurer |
| Mr. Ryan also serves as Assistant Treasurer of other funds. Mr. Ryan is an employee of Fidelity Investments and has served in other fund officer roles. Previously, Mr. Ryan served as Vice President of Fund Reporting in Fidelity Pricing and Cash Management Services (FPCMS) (1999-2005). |
Stephen Sadoski (1971) |
Year of Election or Appointment: 2012 Deputy Treasurer |
| Mr. Sadoski also serves as Deputy Treasurer of other funds. He is an employee of Fidelity Investments (2012-present) and has served in another fund officer role. Prior to joining Fidelity Investments, Mr. Sadoski served as an assistant chief accountant in the Division of Investment Management of the Securities and Exchange Commission (SEC) (2009-2012) and as a senior manager at Deloitte & Touche LLP (1997-2009). |
Stacie M. Smith (1974) |
Year of Election or Appointment: 2013 Deputy Treasurer |
| Ms. Smith also serves as an officer of other funds. She is an employee of Fidelity Investments (2009-present) and has served in other fund officer roles. Prior to joining Fidelity Investments, Ms. Smith served as Senior Audit Manager of Ernst & Young LLP (1996-2009). |
Renee Stagnone (1975) |
Year of Election or Appointment: 2013 Deputy Treasurer |
| Ms. Stagnone also serves as Deputy Treasurer of other funds. Ms. Stagnone is an employee of Fidelity Investments. |
Joseph F. Zambello (1957) |
Year of Election or Appointment: 2011 Deputy Treasurer |
| Mr. Zambello also serves as Deputy Treasurer of other funds. Mr. Zambello is an employee of Fidelity Investments. Previously, Mr. Zambello served as Vice President of FMR's Program Management Group (2009-2011) and Vice President of the Transfer Agent Oversight Group (2005-2009). |
Annual Report
The Board of Trustees of Fidelity Total International Equity Fund voted to pay on December 9, 2013, to shareholders of record at the opening of business on December 6, 2013, a distribution of $0.181 per share derived from capital gains realized from sales of portfolio securities and a dividend of $0.122 per share from net investment income.
The fund hereby designates as a capital gain dividend with respect to the taxable year ended October 31, 2013, $3,356,997, or, if subsequently determined to be different, the net capital gain of such year.
The fund designates 1% of the dividends distributed during the fiscal year as qualifying for the dividends-received deduction for corporate shareholders.
The fund designates 38% of the dividends distributed in December 2012 during the fiscal year as amounts which may be taken into account as a dividend for the purposes of the maximum rate under section 1(h)(11) of the Internal Revenue Code.
The amounts per share which represent income derived from sources within, and taxes paid to, foreign countries or possessions of the United States are as follows:
| Pay Date | Income | Taxes |
International Value Fund | 12/10/2012 | 0.136 | 0.0114 |
The fund will notify shareholders in January 2014 of amounts for use in preparing 2013 income tax returns.
Annual Report
Board Approval of Investment Advisory Contracts and Management Fees
Fidelity Total International Equity Fund
Each year, the Board of Trustees, including the Independent Trustees (together, the Board), votes on the renewal of the management contract and sub-advisory agreements (together, the Advisory Contracts) for the fund. The Board, assisted by the advice of fund counsel and Independent Trustees' counsel, requests and considers a broad range of information relevant to the renewal of the Advisory Contracts throughout the year.
The Board meets regularly and, at each of its meetings, covers an extensive agenda of topics and materials and considers factors that are relevant to its annual consideration of the renewal of the fund's Advisory Contracts, including the services and support provided to the fund and its shareholders. The Board has established various standing committees, each composed of and chaired by Independent Trustees with varying backgrounds, to which the Board has assigned specific subject matter responsibilities in order to enhance effective decision-making by the Board. The Board, acting directly and through its Committees, requests and receives information concerning the annual consideration of the renewal of the fund's Advisory Contracts. The Board also meets as needed to consider matters specifically related to the Board's annual consideration of the renewal of Advisory Contracts. Members of the Board may also meet with trustees of other Fidelity funds through ad hoc joint committees to discuss certain matters relevant to the Fidelity funds.
At its July 2013 meeting, the Board, including the Independent Trustees, unanimously determined to renew the fund's Advisory Contracts. In reaching its determination, the Board considered all factors it believed relevant, including (i) the nature, extent, and quality of the services to be provided to the fund and its shareholders (including the investment performance of the fund); (ii) the competitiveness of the fund's management fee and total expense ratio relative to peer funds; (iii) the total costs of the services to be provided by and the profits to be realized by Fidelity from its relationship with the fund; (iv) the extent to which economies of scale exist and would be realized as the fund grows; and (v) whether fee levels reflect these economies of scale, if any, for the benefit of fund shareholders.
In considering whether to renew the Advisory Contracts for the fund, the Board reached a determination, with the assistance of fund counsel and Independent Trustees' counsel and through the exercise of its business judgment, that the renewal of the Advisory Contracts was in the best interests of the fund and its shareholders and that the compensation payable under the Advisory Contracts was fair and reasonable. The Board's decision to renew the Advisory Contracts was not based on any single factor, but rather was based on a comprehensive consideration of all the information provided to the Board at its meetings throughout the year. The Board, in reaching its determination to renew the Advisory Contracts, was aware that shareholders in the fund have a broad range of investment choices available to them, including a wide choice among mutual funds offered by Fidelity's competitors, and that the fund's shareholders, who have the opportunity to review and weigh the disclosure provided by the fund in its prospectus and other public disclosures, have chosen to invest in this fund, which is a part of the Fidelity family of funds.
Annual Report
Board Approval of Investment Advisory Contracts and
Management Fees - continued
Nature, Extent, and Quality of Services Provided. The Board considered the staffing within the investment adviser, Fidelity Management & Research Company (FMR), and the sub-advisers (together, the Investment Advisers) as it relates to the fund, including the backgrounds of the fund's investment personnel, and also considered the fund's investment objective, strategies, and related investment philosophy. The Independent Trustees also had discussions with senior management of Fidelity's investment operations and investment groups. The Board considered the structure of the portfolio manager compensation program and whether this structure provides appropriate incentives to act in the best interests of the fund.
Resources Dedicated to Investment Management and Support Services. The Board and the Fund Oversight and Research Committees reviewed the general qualifications and capabilities of the Investment Advisers' investment staff, including its size, education, experience, and resources, as well as the Investment Advisers' approach to recruiting, training, managing, and compensating investment personnel. The Board noted that FMR has continued to increase the resources devoted to non-U.S. offices, including expansion of Fidelity's global investment organization. The Board also noted that Fidelity's analysts have extensive resources, tools and capabilities that allow them to conduct sophisticated quantitative and fundamental analysis, as well as credit analysis of issuers, counterparties and guarantors. Further, the Board believes that Fidelity's investment professionals have sufficient access to global information and data so as to provide competitive investment results over time, and that those professionals also have access to sophisticated tools that permit them to assess portfolio construction and risk and performance attribution characteristics continuously, as well as to transmit new information and research conclusions rapidly around the world. Additionally, in its deliberations, the Board considered the Investment Advisers' trading and risk management capabilities and resources, which are an integral part of the investment management process.
Shareholder and Administrative Services. The Board considered (i) the nature, extent, quality, and cost of advisory, administrative, and shareholder services performed by the Investment Advisers and their affiliates under the Advisory Contracts and under separate agreements covering transfer agency, pricing and bookkeeping, and securities lending services for the fund; (ii) the nature and extent of the supervision of third party service providers, principally custodians and subcustodians; and (iii) the resources devoted to, and the record of compliance with, the fund's compliance policies and procedures. The Board also reviewed the allocation of fund brokerage, including allocations to brokers affiliated with the Investment Advisers, the use of brokerage commissions to pay fund expenses, and the use of "soft" commission dollars to pay for research services.
Annual Report
The Board noted that the growth of fund assets over time across the complex allows Fidelity to reinvest in the development of services designed to enhance the value or convenience of the Fidelity funds as investment vehicles. These services include 24-hour access to account information and market information through telephone representatives and over the Internet, investor education materials and asset allocation tools, and the expanded availability of Fidelity Investor Centers.
Investment in a Large Fund Family. The Board considered the benefits to shareholders of investing in a Fidelity fund, including the benefits of investing in a fund that is part of a large family of funds offering a variety of investment disciplines and providing a large variety of mutual fund investor services. The Board noted that Fidelity had taken, or had made recommendations that resulted in the Fidelity funds taking, a number of actions over the previous year that benefited particular funds, including (i) continuing to dedicate additional resources to investment research and to the support of the senior management team that oversees asset management; (ii) persisting in efforts to enhance Fidelity's global research capabilities; (iii) launching new funds and making other enhancements to meet client needs for global and income-oriented solutions; (iv) continuing to launch dedicated lower cost underlying funds to meet portfolio construction needs related to expanding underlying fund options for Fidelity funds of funds, specifically for the Freedom Fund product lines; (v) rationalizing product lines and gaining increased efficiencies through the mergers of several funds into other funds; (vi) strengthening Fidelity's index fund offerings by reducing investment minimums and adopting or lowering existing expense caps for certain funds and classes; (vii) enhancing Global Asset Allocation product offerings by launching new funds and strategies, including "open architecture" target date funds that utilize affiliated and unaffiliated sub-advisers; (viii) modifying the eligibility criteria for Institutional Class shares of Advisor funds to increase their marketability to a portion of the defined contribution plan market; (ix) creating a new low-cost retirement share class for certain Advisor funds to appeal to large retirement plans; (x) transitioning the management of certain Fidelity commodity funds to Geode Capital Management LLC, a registered commodity pool operator, while retaining administrative responsibilities for the funds; (xi) reorganizing a number of funds; and (xii) taking steps toward establishing a new Fidelity adviser to manage sector-based funds and products.
Investment Performance. The Board considered whether the fund has operated in accordance with its investment objective, as well as its record of compliance with its investment restrictions and its performance history.
The Board took into account discussions with the Investment Advisers about fund investment performance that occur at Board meetings throughout the year. In this regard the Board noted that as part of regularly scheduled fund reviews and other reports to the Board on fund performance, the Board periodically considers annualized return information for the fund, for different time periods, measured against a securities market index ("benchmark index") and a peer group of mutual funds with similar objectives ("peer group"). In its evaluation of fund investment performance, the Board gave particular attention to information indicating changes in performance of certain Fidelity funds for specific time periods, and the Investment Advisers' explanations for any overperformance or underperformance.
Annual Report
Board Approval of Investment Advisory Contracts and
Management Fees - continued
In addition to reviewing absolute and relative fund performance, the Independent Trustees periodically consider the appropriateness of fund performance metrics in evaluating the results achieved. In general, the Independent Trustees believe that fund performance should be evaluated based on net performance (after fees and expenses) of both the highest performing and lowest performing classes, where applicable, compared to appropriate benchmark indices, over appropriate time periods which may include full market cycles, and compared to peer groups, as applicable, over the same periods, taking into account relevant factors including the following: general market conditions; issuer-specific information; tactical opportunities for investment; and fund cash flows and other factors.
The Independent Trustees recognize that shareholders evaluate performance on a net basis over their own holding periods, for which one-, three-, and five-year periods are used as a proxy. For this reason, the performance information reviewed by the Board also included net cumulative calendar year total return information for the fund and an appropriate benchmark index and peer group for the most recent one-, three-, and five-year periods, as shown below. Returns are shown compared to the 25th percentile (top of box) and 75th percentile (bottom of box) of the peer universe. Returns of the benchmark index are "net MA," i.e., adjusted for tax withholding rates applicable to U.S.-based mutual funds organized as Massachusetts business trusts.
Annual Report
Fidelity Total International Equity Fund

The Board also considered that the fund's management fee is subject to upward or downward adjustment depending upon whether, and to what extent, the fund's investment performance for the performance period exceeds, or is exceeded by, a securities index, thus leading to a performance adjustment for the same period. The Board noted that the performance adjustment provides FMR with a strong economic incentive to seek to achieve superior performance for the fund's shareholders and helps to more closely align the interests of FMR and the fund's shareholders.
Based on its review, the Board concluded that the nature, extent, and quality of services provided to the fund under the Advisory Contracts should benefit the fund's shareholders.
Competitiveness of Management Fee and Total Expense Ratio. The Board considered the fund's management fee and total expense ratio compared to "mapped groups" of competitive funds and classes. Fidelity creates "mapped groups" by combining similar Lipper investment objective categories that have comparable management fee characteristics. Combining Lipper investment objective categories aids the Board's management fee and total expense ratio comparisons by broadening the competitive group used for comparison and by reducing the number of universes to which various Fidelity funds are compared.
Management Fee. The Board considered two proprietary management fee comparisons for the 12-month periods shown in the chart below. The group of Lipper funds used by the Board for management fee comparisons is referred to below as the "Total Mapped Group." The Total Mapped Group comparison focuses on a fund's standing in terms of gross management fees before expense reimbursements or caps, and without giving effect to the fund's performance adjustment, relative to the total universe of funds with comparable investment mandates, regardless of whether their management fee structures also are comparable. Funds with comparable investment mandates offer exposure to similar types of securities. Funds with comparable management fee structures have similar management fee contractual arrangements (e.g., flat rate charged for advisory services, all-inclusive fee rate, etc.). "TMG %" represents the percentage of funds in the Total Mapped Group that had management fees that were lower than the fund's. For example, a TMG % of 16% means that 84% of the funds in the Total Mapped Group had higher management fees than the fund. The "Asset-Size Peer Group" (ASPG) comparison focuses on a fund's standing relative to a subset of non-Fidelity funds within the Total Mapped Group that are similar in size and management fee structure. The ASPG represents at least 15% of the funds in the Total Mapped Group with comparable asset size and management fee structures, subject to a minimum of 50 funds (or all funds in the Total Mapped Group if fewer than 50). Additional information, such as the ASPG quartile in which the fund's management fee ranked and the impact of the fund's performance adjustment, is also included in the chart and considered by the Board.
Annual Report
Board Approval of Investment Advisory Contracts and
Management Fees - continued
Fidelity Total International Equity Fund

The Board noted that the fund's management fee ranked below the median of its Total Mapped Group and below the median of its ASPG for 2012. The Board also noted the effect of the fund's positive performance adjustment on the fund's management fee ranking.
Annual Report
Based on its review, the Board concluded that the fund's management fee is fair and reasonable in light of the services that the fund receives and the other factors considered.
Total Expense Ratio. In its review of each class's total expense ratio, the Board considered the fund's management fee as well as other fund or class expenses, as applicable, such as transfer agent fees, pricing and bookkeeping fees, fund-paid 12b-1 fees, and custodial, legal, and audit fees. The Board also noted the effects of any waivers and reimbursements on fees and expenses, as well as the impact of the fund's performance adjustment. As part of its review, the Board also considered the current and historical total expense ratios of each class of the fund compared to competitive fund median expenses. Each class of the fund is compared to those funds and classes in the Total Mapped Group (used by the Board for management fee comparisons) that have a similar sales load structure.
The Board noted that the total expense ratio of each of Class A and the retail class ranked below its competitive median for 2012 and the total expense ratio of each of Class T, Class B, Class C, and Institutional Class ranked above its competitive median for 2012. The Board considered that, in general, various factors can affect total expense ratios. The Board noted that the total expense ratio of Class T was above the competitive median primarily because of higher 12b-1 fees on Class T. Class T has a higher 12b-1 fee, but a lower front-end sales charge, than traditionally priced front-end sales charge classes. The Board considered that Class T is primarily sold load-waived in the retirement plan market where its 0.50% 12b-1 fee is comparable to competing no-load, higher 12b-1 fee classes designed specifically for retirement plans. The Board noted that the fund offers multiple classes, each of which has a different sales load and 12b-1 fee structure, and that the multiple structures are intended to offer a range of pricing options for the intermediary market. The Board also noted that the total expense ratios of the classes vary primarily by the level of their 12b-1 fees, although differences in transfer agent fees may also cause expenses to vary from class to class.
The Board further considered that FMR contractually agreed to reimburse Class A, Class T, Class B, Class C, Institutional Class, and the retail class of the fund to the extent that total operating expenses (excluding interest, taxes, certain securities lending costs, brokerage commissions, extraordinary expenses, and acquired fund fees and expenses, if any), as a percentage of their respective average net assets, exceed 1.45%, 1.70%, 2.20%, 2.20%, 1.20%, and 1.20% through December 31, 2013.
Fees Charged to Other Fidelity Clients. The Board also considered Fidelity fee structures and other information with respect to clients of FMR and its affiliates, such as other mutual funds advised or subadvised by FMR or its affiliates, pension plan clients, and other institutional clients. The Board noted the findings of the 2013 ad hoc joint committee (created with the board of other Fidelity funds), which reviewed and compared Fidelity's institutional investment advisory business with its business of providing services to the Fidelity funds, including the differences in services provided, fees charged, and costs incurred, as well as competition in their respective marketplaces.
Annual Report
Board Approval of Investment Advisory Contracts and
Management Fees - continued
Based on its review of total expense ratios and fees charged to other Fidelity clients, the Board concluded that the total expense ratio of each class of the fund was reasonable, although in some cases above the median of the universe presented for comparison, in light of the services that the fund and its shareholders receive and the other factors considered.
Costs of the Services and Profitability. The Board considered the revenues earned and the expenses incurred by Fidelity in conducting the business of developing, marketing, distributing, managing, administering and servicing the fund and servicing the fund's shareholders. The Board also considered the level of Fidelity's profits in respect of all the Fidelity funds.
On an annual basis, FMR presents to the Board Fidelity's profitability for the fund. Fidelity calculates the profitability for each fund, as well as aggregate profitability for groups of Fidelity funds and all Fidelity funds, using a series of detailed revenue and cost allocation methodologies which originate with the books and records of Fidelity on which Fidelity's audited financial statements are based. The Audit Committee of the Board reviews any significant changes from the prior year's methodologies.
PricewaterhouseCoopers LLP (PwC), independent registered public accounting firm and auditor to Fidelity and certain Fidelity funds, has been engaged annually by the Board as part of the Board's assessment of Fidelity's profitability analysis. PwC's engagement includes the review and assessment of the methodologies used by Fidelity in determining the revenues and expenses attributable to Fidelity's mutual fund business, and completion of agreed-upon procedures surrounding the mathematical accuracy of fund profitability and its conformity to allocation methodologies. After considering PwC's reports issued under the engagement and information provided by Fidelity, the Board concluded that while other allocation methods may also be reasonable, Fidelity's profitability methodologies are reasonable in all material respects.
The Board also reviewed Fidelity's non-fund businesses and fall-out benefits related to the mutual fund business as well as cases where Fidelity's affiliates may benefit from or be related to the fund's business.
The Board considered the costs of the services provided by and the profits realized by Fidelity in connection with the operation of the fund and was satisfied that the profitability was not excessive in the circumstances.
Economies of Scale. The Board considered whether there have been economies of scale in respect of the management of the Fidelity funds, whether the Fidelity funds (including the fund) have appropriately benefited from any such economies of scale, and whether there is potential for realization of any further economies of scale. The Board considered the extent to which the fund will benefit from economies of scale through increased services to the fund, through waivers or reimbursements, or through fee or expense reductions. The Board also noted that in 2009, it and the board of other Fidelity funds created an ad hoc committee (the Economies of Scale Committee) to analyze whether FMR attains economies of scale in respect of the management and servicing of the Fidelity funds, whether the Fidelity funds have appropriately benefited from such economies of scale, and whether there is potential for realization of any further economies of scale.
Annual Report
The Board recognized that the fund's management contract incorporates a "group fee" structure, which provides for lower group fee rates as total fund assets under FMR's management increase, and for higher group fee rates as total fund assets under FMR's management decrease. FMR calculates the group fee rates based on a tiered asset "breakpoint" schedule that varies based on asset class. The Board considered that the group fee is designed to deliver the benefits of economies of scale to fund shareholders when total Fidelity fund assets increase, even if assets of any particular fund are unchanged or have declined, because some portion of Fidelity's costs are attributable to services provided to all Fidelity funds, and all funds benefit if those costs can be allocated among more assets. The Board concluded that, given the group fee structure, fund shareholders will benefit from lower management fees as assets under FMR's management increase at the fund complex level, regardless of whether Fidelity achieves any such economies of scale.
The Board concluded, taking into account the analysis of the Economies of Scale Committee, that economies of scale, if any, are being appropriately shared between fund shareholders and Fidelity.
Amendment to Description of Group Fee Rate. At its July 2013 meeting, the Board voted to approve an amendment to the fund's management contract to modify the description of the "group fee rate" effective August 1, 2013. The Board noted that under the prior description in the contract, the group fee rate was based on the average net assets of all registered investment companies with which FMR has management contracts. Under the contract's tiered asset breakpoint schedule, the group fee rate is lower as total fund assets under FMR's management increase, and higher as total fund assets under FMR's management decrease. The Board considered that the prior description would have excluded the assets of 64 Fidelity sector funds from the group fee rate calculation once Fidelity SelectCo, LLC, an affiliate of FMR, assumed management responsibilities for those funds. The Board noted that modifying the description of the group fee rate to continue to include the assets of those 64 funds for purposes of determining group fee rate breakpoints would avoid an immediate adverse impact on the group fee rate for any fund.
Annual Report
Board Approval of Investment Advisory Contracts and
Management Fees - continued
Additional Information Requested by the Board. In order to develop fully the factual basis for consideration of the Fidelity funds' Advisory Contracts, the Board requested and received additional information on certain topics, including: (i) fund performance trends and Fidelity's long-term strategies for certain funds; (ii) the potential to further rationalize the Fidelity fund lineup with the possibility of achieving savings for the funds and Fidelity; (iii) the methodology with respect to competitive fund data and peer group classifications; (iv) the arrangements with, and performance of, certain sub-advisers on behalf of the Fidelity funds, as well as certain proposed participating affiliate arrangements; (v) the realization of fall-out benefits in certain Fidelity business units; (vi) Fidelity's group fee structures, including the rationale for the individual fee rates of certain categories of funds and the definition of group assets; (vii) trends regarding industry use of performance fee structures and the performance adjustment methodologies applicable to the Fidelity funds; (viii) additional competitive analysis regarding the total expenses for certain classes; and (ix) fund profitability methodology, including Fidelity's cost allocation methodology, and the impact of certain factors on fund profitability results.
Based on its evaluation of all of the conclusions noted above, and after considering all factors it believed relevant, the Board ultimately concluded that the advisory fee structures are fair and reasonable, and that the fund's Advisory Contracts should be renewed.
Annual Report
Investment Adviser
Fidelity Management & Research Company
Boston, MA
Investment Sub-Advisers
FMR Co., Inc.
Fidelity Management & Research
(U.K.) Inc.
Fidelity Management & Research
(Hong Kong) Limited
Fidelity Management & Research
(Japan) Inc.
FIL Investment Advisors
FIL Investments (Japan) Limited
FIL Investment Advisors (U.K.)
Limited
General Distributor
Fidelity Distributors Corporation
Smithfield, RI
Transfer and Service Agents
Fidelity Investments Institutional
Operations Company, Inc.
Boston, MA
Fidelity Service Company, Inc.
Boston, MA
Custodian
State Street Bank and Trust Company
Quincy, MA
The Fidelity Telephone Connection
Mutual Fund 24-Hour Service
Exchanges/Redemptions
and Account Assistance 1-800-544-6666
Product Information 1-800-544-8888
Retirement Accounts 1-800-544-4774
(8 a.m. - 9 p.m.)
TDD Service 1-800-544-0118
for the deaf and hearing impaired
(9 a.m. - 9 p.m. Eastern time)
Fidelity Automated Service
Telephone (FAST®)
1-800-544-5555
Automated line for quickest service
(Fidelity Investment logo)(registered trademark)
Corporate Headquarters
245 Summer St., Boston, MA 02210
www.fidelity.com
TIE-UANN-1213
1.912357.103
(Fidelity Investment logo)(registered trademark)
Fidelity Advisor®
Total International Equity
Fund - Class A, Class T, Class B,
and Class C
Annual Report
October 31, 2013
(Fidelity Cover Art)
Class A, Class T,
Class B, and Class C are
classes of Fidelity® Total
International Equity Fund
Contents
Performance | (Click Here) | How the fund has done over time. |
Management's Discussion of Fund Performance | (Click Here) | The Portfolio Manager's review of fund performance and strategy. |
Shareholder Expense Example | (Click Here) | An example of shareholder expenses. |
Investment Changes | (Click Here) | A summary of major shifts in the fund's investments over the past six months. |
Investments | (Click Here) | A complete list of the fund's investments with their market values. |
Financial Statements | (Click Here) | Statements of assets and liabilities, operations, and changes in net assets, as well as financial highlights. |
Notes | (Click Here) | Notes to the financial statements. |
Report of Independent Registered Public Accounting Firm | (Click Here) | |
Trustees and Officers | (Click Here) | |
Distributions | (Click Here) | |
Board Approval of Investment Advisory Contracts and Management Fees | (Click Here) | |
To view a fund's proxy voting guidelines and proxy voting record for the 12-month period ended June 30, visit http://www.fidelity.com/proxyvotingresults or visit the Securities and Exchange Commission's (SEC) web site at http://www.sec.gov. You may also call 1-877-208-0098 to request a free copy of the proxy voting guidelines.
Standard & Poor's, S&P and S&P 500 are registered service marks of The McGraw-Hill Companies, Inc. and have been licensed for use by Fidelity Distributors Corporation.
Other third-party marks appearing herein are the property of their respective owners.
All other marks appearing herein are registered or unregistered trademarks or service marks of FMR LLC or an affiliated company. © 2013 FMR LLC. All rights reserved.
Annual Report
This report and the financial statements contained herein are submitted for the general information of the shareholders of the fund. This report is not authorized for distribution to prospective investors in the fund unless preceded or accompanied by an effective prospectus.
A fund files its complete schedule of portfolio holdings with the SEC for the first and third quarters of each fiscal year on Form N-Q. Forms N-Q are available on the SEC's web site at http://www.sec.gov. A fund's Forms N-Q may be reviewed and copied at the SEC's Public Reference Room in Washington, DC. Information regarding the operation of the SEC's Public Reference Room may be obtained by calling 1-800-SEC-0330. For a complete list of a fund's portfolio holdings, view the most recent holdings listing, semiannual report, or annual report on Fidelity's web site at http://www.fidelity.com, http://www.advisor.fidelity.com, or http://www.401k.com, as applicable.
NOT FDIC INSURED • MAY LOSE VALUE • NO BANK GUARANTEE
Neither the fund nor Fidelity Distributors Corporation is a bank.
Annual Report
Average annual total return reflects the change in the value of an investment, assuming reinvestment of the class' distributions from dividend income and capital gains (the profits earned upon the sale of securities that have grown in value, if any) and assuming a constant rate of performance each year. The $10,000 table and the fund's returns do not reflect the deduction of taxes that a shareholder would pay on fund distributions or the redemption of fund shares. During periods of reimbursement by Fidelity, a fund's total return will be greater than it would be had the reimbursement not occurred. How a fund did yesterday is no guarantee of how it will do tomorrow.
Average Annual Total Returns
Periods ended October 31, 2013 | Past 1
year | Past 5
years | Life of
fund A |
Class A (incl. 5.75% sales charge) | 12.16% | 12.21% | -2.26% |
Class T (incl. 3.50% sales charge) | 14.57% | 12.50% | -2.12% |
Class B (incl. contingent deferred sales charge) B | 13.05% | 12.47% | -2.18% |
Class C (incl. contingent deferred sales charge) C | 17.30% | 12.73% | -2.02% |
A From November 1, 2007.
B Class B shares' contingent deferred sales charges included in the past one year, past five years, and life of fund total return figures are 5%, 2%, and 1%, respectively.
C Class C shares' contingent deferred sales charges included in the past one year, past five years, and life of fund total return figures are 1%, 0%, and 0%, respectively.
Annual Report
$10,000 Over Life of Fund
Let's say hypothetically that $10,000 was invested in Fidelity Advisor® Total International Equity Fund - Class A on November 1, 2007, when the fund started, and the current 5.75% sales charge was paid. The chart shows how the value of your investment would have changed, and also shows how the MSCI® ACWI® (All Country World Index) ex USA Index performed over the same period.
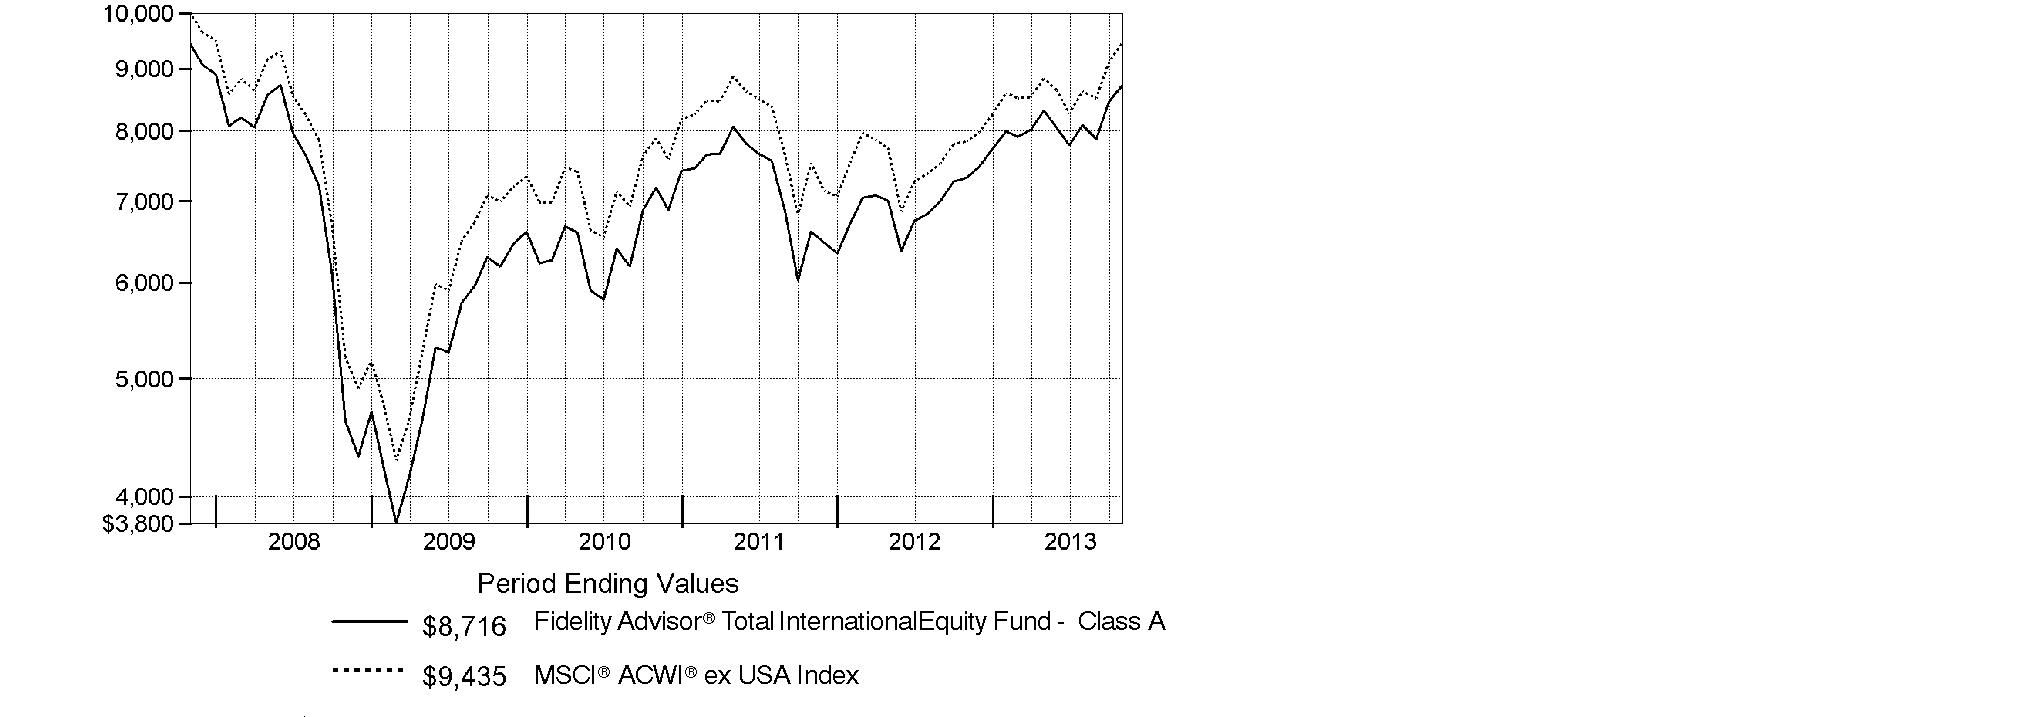
Annual Report
Market Recap: On balance, global equity markets remained upbeat for the 12-month period ending October 31, 2013. The MSCI® ACWI® (All Country World Index) Index gained 23.75% for the period, amid investor preference for higher-risk assets. The period was not without turbulence, however. In the spring and summer, central banks worldwide, especially in the U.S. and China, made clear their intentions to maintain accommodative monetary policies. That stance, combined with modest cyclical improvements around the globe and generally low valuations, underpinned the broad rally in equities. Europe (+32%) shone brightly, with most markets in the region - large and small - registering solid, index-beating gains. Another bright spot was Japan, which, despite a struggling yen and taking a second-half breather, posted a 34% result for the full year. The U.S. - by far the index's biggest constituent - also outperformed the global market with a roughly 28% advance. Meanwhile, Asia-Pacific ex Japan (+14%) lagged, hurt in part by a slowdown in Australia's mining industry as well as currency headwinds. Foreign-exchange and commodity weakness also curbed results in resource-heavy Canada and emerging markets (EM), both of which were up 7%. Country-level EM performance diverged meaningfully for the period, as evidenced by performance in Brazil (-1%), Russia (+12%), India (+1%) and China (+8%).
Comments from Jed Weiss, Co-Portfolio Manager of Fidelity Advisor® Total International Equity Fund: For the year, the fund's Class A, Class T, Class B and Class C shares returned 19.00%, 18.73%, 18.05% and 18.30%, respectively (excluding sales charges), trailing the 20.42% advance the MSCI® ACWI® (All Country World Index) ex USA Index. On a relative basis, the fund was hurt the most by disappointing stock selection in Europe ex U.K. On the positive side, the fund's investments in U.S.-based companies proved helpful, as did a big underweighting in poor-performing Canada. On an individual basis, the biggest relative detractor was Japanese automaker Toyota Motor, a strong-performing benchmark component we mostly avoided. Instead, we opted to hold DENSO, a Japanese auto-parts supplier, and its relative contribution offset some of the negative impact from our Toyota underweighting. Several of the fund's notable detractors were emerging-markets stocks, including South Africa-based gold miner AngloGold Ashanti - which we sold in May - and China Food, an out-of-index bottler of Coca-Cola beverages in China, as well as a distributor of wine. On the positive side, Dutch semiconductor company ASML Holding, a dominant player in the market for lithography, was a strong relative contributor, as was Sands China, a Hong Kong-listed casino operator.
The views expressed above reflect those of the portfolio manager(s) only through the end of the period as stated on the cover of this report and do not necessarily represent the views of Fidelity or any other person in the Fidelity organization. Any such views are subject to change at any time based upon market or other conditions and Fidelity disclaims any responsibility to update such views. These views may not be relied on as investment advice and, because investment decisions for a Fidelity fund are based on numerous factors, may not be relied on as an indication of trading intent on behalf of any Fidelity fund.
Annual Report
Shareholder Expense Example
As a shareholder of the Fund, you incur two types of costs: (1) transaction costs, including sales charges (loads) on purchase payments or redemption proceeds, redemption fees and (2) ongoing costs, including management fees, distribution and/or service (12b-1) fees and other Fund expenses. This Example is intended to help you understand your ongoing costs (in dollars) of investing in the Fund and to compare these costs with the ongoing costs of investing in other mutual funds.
The Example is based on an investment of $1,000 invested at the beginning of the period and held for the entire period (May 1, 2013 to October 31, 2013).
Actual Expenses
The first line of the accompanying table for each class of the Fund provides information about actual account values and actual expenses. You may use the information in this line, together with the amount you invested, to estimate the expenses that you paid over the period. Simply divide your account value by $1,000.00 (for example, an $8,600 account value divided by $1,000.00 = 8.6), then multiply the result by the number in the first line for a class of the Fund under the heading entitled "Expenses Paid During Period" to estimate the expenses you paid on your account during this period. A small balance maintenance fee of $12.00 that is charged once a year may apply for certain accounts with a value of less than $2,000. This fee is not included in the table below. If it was, the estimate of expenses you paid during the period would be higher, and your ending account value lower, by this amount. In addition, the Fund, as a shareholder in the underlying Fidelity Central Funds, will indirectly bear its pro-rata share of the fees and expenses incurred by the underlying Fidelity Central Funds. These fees and expenses are not included in the Fund's annualized expense ratio used to calculate the expense estimate in the table below.
Hypothetical Example for Comparison Purposes
The second line of the accompanying table for each class of the Fund provides information about hypothetical account values and hypothetical expenses based on a Class' actual expense ratio and an assumed rate of return of 5% per year before expenses, which is not the Class' actual return. The hypothetical account values and expenses may not be used to estimate the actual ending account balance or expenses you paid for the period. You may use this information to compare the ongoing costs of investing in the Fund and other funds. To do so, compare this 5% hypothetical example with the 5% hypothetical examples that appear in the shareholder reports of the other funds. A small balance maintenance fee of $12.00 that is charged once a year may apply for certain accounts with a value of less than $2,000. This fee is not included in the table below. If it was, the estimate of expenses you paid during the period would be higher, and your ending account value lower, by this amount. In addition, the Fund, as a shareholder in the underlying Fidelity Central Funds, will indirectly bear its pro-rata share of the fees and expenses incurred by the underlying Fidelity Central Funds. These fees and expenses are not included in the Fund's annualized expense ratio used to calculate the expense estimate in the table below.
Please note that the expenses shown in the table are meant to highlight your ongoing costs only and do not reflect any transaction costs. Therefore, the second line of the table is useful in comparing ongoing costs only, and will not help you determine the relative total costs of owning different funds. In addition, if these transactional costs were included, your costs would have been higher.
Annual Report
| Annualized
Expense RatioB | Beginning
Account Value
May 1, 2013 | Ending
Account Value
October 31, 2013 | Expenses Paid
During Period*
May 1, 2013
to October 31, 2013 |
Class A | 1.45% | | | |
Actual | | $ 1,000.00 | $ 1,048.20 | $ 7.49 |
HypotheticalA | | $ 1,000.00 | $ 1,017.90 | $ 7.38 |
Class T | 1.70% | | | |
Actual | | $ 1,000.00 | $ 1,047.90 | $ 8.78 |
HypotheticalA | | $ 1,000.00 | $ 1,016.64 | $ 8.64 |
Class B | 2.19% | | | |
Actual | | $ 1,000.00 | $ 1,044.00 | $ 11.28 |
HypotheticalA | | $ 1,000.00 | $ 1,014.17 | $ 11.12 |
Class C | 2.20% | | | |
Actual | | $ 1,000.00 | $ 1,045.50 | $ 11.34 |
HypotheticalA | | $ 1,000.00 | $ 1,014.12 | $ 11.17 |
Total International Equity | 1.10% | | | |
Actual | | $ 1,000.00 | $ 1,050.70 | $ 5.69 |
HypotheticalA | | $ 1,000.00 | $ 1,019.66 | $ 5.60 |
Institutional Class | 1.20% | | | |
Actual | | $ 1,000.00 | $ 1,050.90 | $ 6.20 |
HypotheticalA | | $ 1,000.00 | $ 1,019.16 | $ 6.11 |
A 5% return per year before expenses
B Annualized expense ratio reflects expenses net of applicable fee waivers.
* Expenses are equal to each Class' annualized expense ratio, multiplied by the average account value over the period, multiplied by 184/365 (to reflect the one-half year period).
Annual Report
Investment Changes (Unaudited)
Geographic Diversification (% of fund's net assets) |
As of October 31, 2013 |
 | United Kingdom 16.7% | |
 | Japan 14.4% | |
 | United States of America* 7.3% | |
 | France 7.1% | |
 | Switzerland 6.8% | |
 | Germany 5.2% | |
 | Australia 3.8% | |
 | India 3.0% | |
 | Korea (South) 2.7% | |
 | Other 33.0% | |

Percentages are based on country or territory of incorporation and are adjusted for the effect of futures contracts, if applicable. |
* Includes Short-Term Investments and Net Other Assets (Liabilities) |
As of April 30, 2013 |
| United Kingdom 17.0% | |
| Japan 12.6% | |
| United States of America* 7.8% | |
| Switzerland 6.9% | |
| Germany 4.6% | |
| Australia 4.5% | |
| France 4.3% | |
| Taiwan 3.9% | |
| India 3.1% | |
| Other 35.3% | |

Percentages are based on country or territory of incorporation and are adjusted for the effect of futures contracts, if applicable. |
* Includes Short-Term Investments and Net Other Assets (Liabilities) |
Asset Allocation as of October 31, 2013 |
| % of fund's
net assets | % of fund's net assets
6 months ago |
Stocks | 98.4 | 97.7 |
Short-Term Investments and Net Other Assets (Liabilities) | 1.6 | 2.3 |
Top Ten Stocks as of October 31, 2013 |
| % of fund's
net assets | % of fund's net assets
6 months ago |
Nestle SA (Switzerland, Food Products) | 1.6 | 1.9 |
Roche Holding AG (participation certificate) (Switzerland, Pharmaceuticals) | 1.5 | 1.3 |
Sanofi SA (France, Pharmaceuticals) | 1.5 | 1.6 |
Anheuser-Busch InBev SA NV (Belgium, Beverages) | 1.4 | 1.2 |
HSBC Holdings PLC sponsored ADR (United Kingdom, Commercial Banks) | 1.3 | 1.4 |
Total SA (France, Oil, Gas & Consumable Fuels) | 1.3 | 0.0 |
UBS AG (NY Shares) (Switzerland, Capital Markets) | 1.3 | 1.0 |
DENSO Corp. (Japan, Auto Components) | 1.2 | 1.1 |
Vodafone Group PLC sponsored ADR (United Kingdom, Wireless Telecommunication Services) | 1.2 | 1.2 |
Novartis AG (Switzerland, Pharmaceuticals) | 1.1 | 1.1 |
| 13.4 | |
Market Sectors as of October 31, 2013 |
| % of fund's
net assets | % of fund's net assets
6 months ago |
Financials | 24.3 | 22.5 |
Consumer Staples | 13.8 | 14.8 |
Consumer Discretionary | 13.2 | 11.9 |
Industrials | 12.9 | 12.6 |
Health Care | 9.3 | 9.3 |
Materials | 6.3 | 7.6 |
Telecommunication Services | 5.9 | 4.4 |
Information Technology | 5.9 | 6.3 |
Energy | 4.5 | 5.1 |
Utilities | 2.3 | 3.2 |
Annual Report
Investments October 31, 2013
Showing Percentage of Net Assets
Common Stocks - 97.6% |
| Shares | | Value |
Australia - 3.8% |
Ansell Ltd. | 31,550 | | $ 581,182 |
Australia & New Zealand Banking Group Ltd. | 89,158 | | 2,851,618 |
Coca-Cola Amatil Ltd. | 85,155 | | 1,038,247 |
CSL Ltd. | 33,066 | | 2,172,037 |
Imdex Ltd. | 41,667 | | 28,355 |
Ramsay Health Care Ltd. | 2,307 | | 84,602 |
RCG Corp. Ltd. | 60,000 | | 41,965 |
Sydney Airport unit | 173,635 | | 687,626 |
Telstra Corp. Ltd. | 217,906 | | 1,066,841 |
Transurban Group unit | 170,303 | | 1,142,829 |
Westfield Group unit | 64,761 | | 662,280 |
Westpac Banking Corp. | 89,139 | | 2,888,923 |
TOTAL AUSTRALIA | | 13,246,505 |
Austria - 0.5% |
Andritz AG | 24,961 | | 1,537,626 |
Zumtobel AG | 3,700 | | 66,137 |
TOTAL AUSTRIA | | 1,603,763 |
Bailiwick of Guernsey - 0.0% |
Resolution Ltd. | 28,414 | | 162,828 |
Bailiwick of Jersey - 0.6% |
Informa PLC | 157,001 | | 1,408,460 |
Wolseley PLC | 12,400 | | 668,239 |
TOTAL BAILIWICK OF JERSEY | | 2,076,699 |
Belgium - 2.3% |
Anheuser-Busch InBev SA NV | 47,671 | | 4,941,754 |
Gimv NV | 1,919 | | 97,186 |
KBC Ancora (a) | 3,381 | | 110,127 |
KBC Groupe SA | 29,097 | | 1,586,184 |
UCB SA | 7,688 | | 505,426 |
Umicore SA | 17,794 | | 848,855 |
TOTAL BELGIUM | | 8,089,532 |
Bermuda - 1.9% |
China Foods Ltd. | 1,106,000 | | 502,144 |
Credicorp Ltd. | 7,500 | | 1,024,500 |
Dairy Farm International Holdings Ltd. | 45,900 | | 520,047 |
Hongkong Land Holdings Ltd. | 87,000 | | 535,920 |
Lazard Ltd. Class A | 15,900 | | 614,535 |
Li & Fung Ltd. | 342,000 | | 483,467 |
Common Stocks - continued |
| Shares | | Value |
Bermuda - continued |
Shangri-La Asia Ltd. | 414,000 | | $ 758,261 |
Texwinca Holdings Ltd. | 806,000 | | 824,401 |
Trinity Ltd. | 930,000 | | 347,865 |
Yue Yuen Industrial (Holdings) Ltd. | 339,000 | | 931,343 |
TOTAL BERMUDA | | 6,542,483 |
Brazil - 2.2% |
Arezzo Industria e Comercio SA | 2,500 | | 37,385 |
Banco Bradesco SA | 77,610 | | 1,244,074 |
BM&F Bovespa SA | 150,900 | | 850,758 |
BTG Pactual Participations Ltd. unit | 47,700 | | 638,143 |
Companhia de Bebidas das Americas (AmBev) | 300 | | 11,175 |
Fleury SA | 67,700 | | 524,326 |
Hypermarcas SA | 84,400 | | 736,550 |
Iguatemi Empresa de Shopping Centers SA | 50,500 | | 580,473 |
Souza Cruz SA | 61,400 | | 664,102 |
Telefonica Brasil SA | 28,500 | | 561,553 |
Terna Participacoes SA unit | 51,600 | | 500,982 |
Tractebel Energia SA | 46,900 | | 797,648 |
Weg SA | 48,000 | | 623,516 |
TOTAL BRAZIL | | 7,770,685 |
British Virgin Islands - 0.0% |
Gem Diamonds Ltd. (a) | 18,923 | | 48,394 |
Canada - 0.1% |
Pason Systems, Inc. | 6,400 | | 133,015 |
ShawCor Ltd. Class A | 1,500 | | 63,056 |
TAG Oil Ltd. (a)(c) | 9,800 | | 39,852 |
TOTAL CANADA | | 235,923 |
Cayman Islands - 1.6% |
Ginko International Co. Ltd. | 20,000 | | 381,179 |
Gourmet Master Co. Ltd. | 96,000 | | 639,239 |
Hengan International Group Co. Ltd. | 50,000 | | 612,344 |
Lifestyle International Holdings Ltd. | 51,000 | | 111,170 |
Sands China Ltd. | 281,400 | | 1,999,889 |
SITC International Holdings Co. Ltd. | 1,087,000 | | 459,868 |
Wynn Macau Ltd. | 355,200 | | 1,362,982 |
TOTAL CAYMAN ISLANDS | | 5,566,671 |
Chile - 1.5% |
Cencosud SA | 175,326 | | 715,303 |
Common Stocks - continued |
| Shares | | Value |
Chile - continued |
Compania Cervecerias Unidas SA sponsored ADR | 35,855 | | $ 956,970 |
Embotelladora Andina SA sponsored ADR | 18,000 | | 615,600 |
Empresa Nacional de Telecomunicaciones SA (ENTEL) | 46,696 | | 718,603 |
Inversiones Aguas Metropolitanas SA | 254,947 | | 472,815 |
Parque Arauco SA | 285,766 | | 551,728 |
Quinenco SA | 275,436 | | 736,647 |
Quinenco SA rights 11/5/13 (a) | 65,950 | | 25,749 |
Sociedad Matriz SAAM SA | 5,792,804 | | 582,277 |
TOTAL CHILE | | 5,375,692 |
China - 0.7% |
China Communications Services Corp. Ltd. (H Shares) | 790,000 | | 484,006 |
China Pacific Insurance Group Co. Ltd. (H Shares) | 185,800 | | 671,018 |
China Telecom Corp. Ltd. (H Shares) | 1,202,000 | | 627,871 |
Shandong Weigao Medical Polymer Co. Ltd. (H Shares) | 536,000 | | 503,299 |
TOTAL CHINA | | 2,286,194 |
Denmark - 0.9% |
A.P. Moller - Maersk A/S Series B | 81 | | 783,716 |
Jyske Bank A/S (Reg.) (a) | 1,654 | | 93,370 |
Novo Nordisk A/S Series B sponsored ADR | 14,000 | | 2,333,380 |
Spar Nord Bank A/S (a) | 11,331 | | 101,073 |
TOTAL DENMARK | | 3,311,539 |
Finland - 1.0% |
Nokia Corp. (a) | 77,916 | | 592,223 |
Nokian Tyres PLC | 29,458 | | 1,490,673 |
Sampo Oyj (A Shares) | 26,099 | | 1,236,359 |
Tikkurila Oyj | 3,580 | | 92,792 |
TOTAL FINLAND | | 3,412,047 |
France - 7.1% |
Arkema SA | 7,278 | | 826,308 |
Atos Origin SA | 10,134 | | 865,193 |
BNP Paribas SA | 33,579 | | 2,486,582 |
Cap Gemini SA | 11,002 | | 723,744 |
Carrefour SA | 26,773 | | 980,751 |
Danone SA | 18,480 | | 1,370,482 |
GDF Suez | 51,369 | | 1,279,146 |
Havas SA | 70,377 | | 586,322 |
Kering SA | 3,113 | | 707,334 |
Laurent-Perrier Group SA | 859 | | 80,254 |
Remy Cointreau SA | 6,481 | | 639,553 |
Common Stocks - continued |
| Shares | | Value |
France - continued |
Renault SA | 10,870 | | $ 952,086 |
Safran SA | 21,914 | | 1,400,657 |
Saft Groupe SA | 2,521 | | 80,027 |
Sanofi SA | 49,051 | | 5,229,976 |
Schneider Electric SA | 4,741 | | 399,422 |
Total SA | 74,087 | | 4,545,458 |
Vetoquinol SA | 1,500 | | 59,714 |
Virbac SA | 410 | | 82,472 |
Vivendi SA | 52,852 | | 1,341,550 |
TOTAL FRANCE | | 24,637,031 |
Germany - 4.6% |
Allianz SE | 11,227 | | 1,888,665 |
alstria office REIT-AG | 2,900 | | 36,768 |
BASF AG | 23,711 | | 2,466,996 |
Bayer AG | 25,993 | | 3,230,629 |
Bilfinger Berger AG | 1,120 | | 124,346 |
CompuGROUP Holding AG | 4,546 | | 118,478 |
CTS Eventim AG | 4,483 | | 218,820 |
Deutsche Bank AG | 10,780 | | 520,988 |
Deutsche Bank AG (NY Shares) | 300 | | 14,496 |
Deutsche Post AG | 34,917 | | 1,181,658 |
Fielmann AG | 1,079 | | 120,717 |
Fresenius SE & Co. KGaA | 5,500 | | 714,876 |
HeidelbergCement Finance AG | 9,123 | | 719,175 |
Linde AG | 14,649 | | 2,783,561 |
Siemens AG | 10,138 | | 1,295,558 |
Siemens AG sponsored ADR | 4,769 | | 610,480 |
TOTAL GERMANY | | 16,046,211 |
Greece - 0.0% |
Titan Cement Co. SA (Reg.) (a) | 3,444 | | 93,989 |
Hong Kong - 1.4% |
China Insurance International Holdings Co. Ltd. (a) | 717,800 | | 1,120,261 |
Dah Chong Hong Holdings Ltd. | 630,000 | | 534,683 |
Hang Lung Properties Ltd. | 261,000 | | 860,125 |
HKT Trust / HKT Ltd. unit | 641,000 | | 594,452 |
Hysan Development Co. Ltd. | 140,000 | | 654,585 |
Lenovo Group Ltd. | 628,000 | | 672,307 |
Wing Hang Bank Ltd. | 37,562 | | 534,385 |
TOTAL HONG KONG | | 4,970,798 |
Common Stocks - continued |
| Shares | | Value |
Hungary - 0.2% |
Richter Gedeon PLC | 38,800 | | $ 737,790 |
India - 3.0% |
Bank of Baroda | 49,621 | | 517,677 |
Cipla Ltd. | 86,552 | | 580,347 |
Container Corp. of India Ltd. | 44,711 | | 549,201 |
Grasim Industries Ltd. | 15,533 | | 730,141 |
Housing Development Finance Corp. Ltd. | 120,022 | | 1,665,338 |
IDFC Ltd. | 457,281 | | 784,718 |
Infosys Ltd. | 23,850 | | 1,271,037 |
Jyothy Laboratories Ltd. (a) | 32,119 | | 96,580 |
Kotak Mahindra Bank Ltd. | 54,534 | | 665,879 |
Larsen & Toubro Ltd. | 62,294 | | 984,286 |
NTPC Ltd. | 524,093 | | 1,268,049 |
Prestige Estates Projects Ltd. (a) | 272,850 | | 633,377 |
Punjab National Bank | 57,188 | | 530,472 |
TOTAL INDIA | | 10,277,102 |
Indonesia - 0.5% |
PT Bank Rakyat Indonesia Tbk | 821,000 | | 575,371 |
PT Semen Gresik (Persero) Tbk | 438,500 | | 558,212 |
PT Wijaya Karya Persero Tbk | 3,288,500 | | 560,114 |
TOTAL INDONESIA | | 1,693,697 |
Ireland - 0.7% |
CRH PLC sponsored ADR | 39,729 | | 972,566 |
FBD Holdings PLC | 5,372 | | 115,972 |
James Hardie Industries PLC: | | | |
CDI | 8,082 | | 83,491 |
sponsored ADR | 24,355 | | 1,268,408 |
TOTAL IRELAND | | 2,440,437 |
Israel - 0.2% |
Azrieli Group | 14,096 | | 453,311 |
Ituran Location & Control Ltd. | 2,761 | | 50,526 |
Strauss Group Ltd. | 2,359 | | 41,664 |
TOTAL ISRAEL | | 545,501 |
Italy - 0.5% |
Azimut Holding SpA | 8,114 | | 206,124 |
Beni Stabili SpA SIIQ | 145,810 | | 100,175 |
Interpump Group SpA | 53,591 | | 596,658 |
Common Stocks - continued |
| Shares | | Value |
Italy - continued |
Prada SpA | 68,900 | | $ 671,848 |
Unione di Banche Italiane ScpA | 44,737 | | 309,782 |
TOTAL ITALY | | 1,884,587 |
Japan - 14.4% |
AEON Financial Service Co. Ltd. | 8,800 | | 270,250 |
AEON Mall Co. Ltd. | 36,130 | | 1,026,127 |
Air Water, Inc. | 29,500 | | 421,681 |
Anicom Holdings, Inc. (a) | 2,500 | | 29,626 |
Aozora Bank Ltd. | 243,000 | | 706,409 |
ARNEST ONE Corp. | 2,300 | | 63,061 |
Artnature, Inc. | 4,000 | | 85,376 |
Asahi Co. Ltd. | 4,000 | | 67,805 |
Astellas Pharma, Inc. | 11,700 | | 652,233 |
Autobacs Seven Co. Ltd. | 27,400 | | 399,505 |
Azbil Corp. | 4,200 | | 101,197 |
Coca-Cola Central Japan Co. Ltd. | 3,800 | | 67,300 |
Cosmos Pharmaceutical Corp. | 700 | | 85,281 |
Daikin Industries Ltd. | 9,300 | | 535,061 |
Daikokutenbussan Co. Ltd. | 5,000 | | 150,040 |
DENSO Corp. | 88,900 | | 4,273,282 |
Dentsu, Inc. | 14,400 | | 544,064 |
East Japan Railway Co. | 10,400 | | 903,455 |
Fanuc Corp. | 6,800 | | 1,090,772 |
Fast Retailing Co. Ltd. | 3,900 | | 1,312,786 |
FCC Co. Ltd. | 6,800 | | 155,345 |
GCA Savvian Group Corp. | 4,700 | | 51,811 |
Glory Ltd. | 2,000 | | 49,594 |
Goldcrest Co. Ltd. | 6,260 | | 167,479 |
Hajime Construction Co. Ltd. | 400 | | 27,581 |
Harmonic Drive Systems, Inc. | 3,000 | | 64,584 |
Hoya Corp. | 35,500 | | 851,268 |
Isuzu Motors Ltd. | 82,000 | | 510,662 |
Itochu Corp. | 66,200 | | 795,999 |
Iwatsuka Confectionary Co. Ltd. | 1,200 | | 61,891 |
Japan Exchange Group, Inc. | 15,600 | | 362,671 |
Japan Tobacco, Inc. | 66,500 | | 2,406,215 |
JFE Holdings, Inc. | 26,300 | | 597,922 |
JTEKT Corp. | 41,200 | | 528,937 |
Kamigumi Co. Ltd. | 6,000 | | 52,190 |
Kansai Electric Power Co., Inc. (a) | 40,900 | | 517,672 |
KDDI Corp. | 21,200 | | 1,148,118 |
Common Stocks - continued |
| Shares | | Value |
Japan - continued |
Keyence Corp. | 5,921 | | $ 2,537,681 |
Kobayashi Pharmaceutical Co. Ltd. | 1,600 | | 89,586 |
Kyoto Kimono Yuzen Co. Ltd. | 2,800 | | 29,424 |
Lasertec Corp. (a) | 5,500 | | 56,820 |
Leopalace21 Corp. (a) | 31,800 | | 220,772 |
Meiko Network Japan Co. Ltd. | 2,700 | | 31,169 |
Miraial Co. Ltd. | 2,400 | | 38,930 |
Mitsubishi Electric Corp. | 62,000 | | 681,502 |
Mitsui Fudosan Co. Ltd. | 59,000 | | 1,954,428 |
MS&AD Insurance Group Holdings, Inc. | 29,400 | | 760,206 |
Nabtesco Corp. | 3,000 | | 73,223 |
Nagaileben Co. Ltd. | 5,100 | | 84,161 |
ND Software Co. Ltd. | 2,000 | | 35,876 |
Nihon M&A Center, Inc. | 2,300 | | 177,389 |
Nihon Parkerizing Co. Ltd. | 7,000 | | 136,745 |
Nippon Seiki Co. Ltd. | 7,000 | | 114,127 |
Nippon Telegraph & Telephone Corp. | 18,600 | | 966,834 |
Nomura Holdings, Inc. | 44,400 | | 327,984 |
NS Tool Co. Ltd. | 1,900 | | 32,362 |
Obic Co. Ltd. | 3,800 | | 119,330 |
Omron Corp. | 14,600 | | 557,154 |
ORIX Corp. | 67,100 | | 1,162,245 |
OSG Corp. | 10,200 | | 165,002 |
Santen Pharmaceutical Co. Ltd. | 12,800 | | 649,801 |
Seven & i Holdings Co., Ltd. | 24,100 | | 891,908 |
Seven Bank Ltd. | 339,600 | | 1,201,931 |
Shinsei Bank Ltd. | 552,000 | | 1,292,401 |
SHO-BOND Holdings Co. Ltd. | 17,200 | | 805,430 |
Shoei Co. Ltd. | 5,900 | | 55,432 |
SoftBank Corp. | 39,800 | | 2,972,221 |
Software Service, Inc. | 1,000 | | 37,598 |
Sumitomo Corp. | 54,800 | | 713,129 |
Sumitomo Mitsui Financial Group, Inc. | 57,200 | | 2,764,813 |
Sumitomo Mitsui Trust Holdings, Inc. | 192,000 | | 948,305 |
Techno Medica Co. Ltd. | 1,800 | | 39,199 |
The Nippon Synthetic Chemical Industry Co. Ltd. | 11,000 | | 106,054 |
Tocalo Co. Ltd. | 2,800 | | 45,843 |
Tokyo Tatemono Co. Ltd. | 47,000 | | 441,236 |
Toyota Motor Corp. | 22,000 | | 1,426,440 |
Tsutsumi Jewelry Co. Ltd. | 2,000 | | 48,731 |
Unicharm Corp. | 11,400 | | 732,210 |
USS Co. Ltd. | 163,500 | | 2,394,375 |
Common Stocks - continued |
| Shares | | Value |
Japan - continued |
Workman Co. Ltd. | 2,000 | | $ 78,379 |
Yamato Kogyo Co. Ltd. | 25,500 | | 945,137 |
TOTAL JAPAN | | 50,078,773 |
Korea (South) - 2.7% |
Coway Co. Ltd. | 2,497 | | 142,581 |
E-Mart Co. Ltd. | 5,451 | | 1,304,607 |
Kiwoom Securities Co. Ltd. | 13,501 | | 707,311 |
Korea Electric Power Corp. (a) | 32,950 | | 879,523 |
Korea Plant Service & Engineering Co. Ltd. | 18,239 | | 924,598 |
KT Corp. | 25,930 | | 856,618 |
LG Corp. | 17,494 | | 1,033,538 |
LG Household & Health Care Ltd. | 1,560 | | 809,927 |
NICE Holdings Co. Ltd. | 5,000 | | 61,011 |
NICE Information Service Co. Ltd. | 12,000 | | 34,600 |
Samsung Fire & Marine Insurance Co. Ltd. | 3,292 | | 769,275 |
Shinhan Financial Group Co. Ltd. | 30,630 | | 1,334,912 |
TK Corp. (a) | 27,242 | | 553,167 |
TOTAL KOREA (SOUTH) | | 9,411,668 |
Luxembourg - 0.3% |
Millicom International Cellular SA (depository receipt) | 10,000 | | 922,061 |
Malaysia - 0.4% |
Axiata Group Bhd | 104,300 | | 227,005 |
Public Bank Bhd | 71,500 | | 414,526 |
YTL Corp. Bhd | 1,298,600 | | 678,818 |
TOTAL MALAYSIA | | 1,320,349 |
Mexico - 0.9% |
Bolsa Mexicana de Valores S.A.B. de CV | 221,300 | | 527,500 |
Consorcio ARA S.A.B. de CV (a) | 1,492,555 | | 583,420 |
Fomento Economico Mexicano S.A.B. de CV sponsored ADR | 12,233 | | 1,141,339 |
Grupo Televisa SA de CV | 162,300 | | 991,420 |
TOTAL MEXICO | | 3,243,679 |
Netherlands - 2.0% |
Aalberts Industries NV | 7,600 | | 227,429 |
AEGON NV | 51,215 | | 407,512 |
ASM International NV (depositary receipt) | 1,950 | | 64,389 |
ASML Holding NV | 12,776 | | 1,209,121 |
Heijmans NV (Certificaten Van Aandelen) | 8,481 | | 112,836 |
ING Groep NV (Certificaten Van Aandelen) (a) | 148,405 | | 1,885,890 |
Common Stocks - continued |
| Shares | | Value |
Netherlands - continued |
Koninklijke Philips Electronics NV | 38,309 | | $ 1,353,868 |
Royal DSM NV | 11,256 | | 852,629 |
Unilever NV (Certificaten Van Aandelen) (Bearer) | 16,000 | | 634,328 |
VastNed Retail NV | 2,215 | | 102,418 |
TOTAL NETHERLANDS | | 6,850,420 |
Nigeria - 0.1% |
Guaranty Trust Bank PLC | 3,130,003 | | 498,672 |
Norway - 0.4% |
Telenor ASA | 56,208 | | 1,350,189 |
Philippines - 0.4% |
Jollibee Food Corp. | 14,560 | | 59,770 |
Security Bank Corp. | 165,970 | | 533,838 |
SM Investments Corp. | 32,910 | | 651,879 |
TOTAL PHILIPPINES | | 1,245,487 |
Poland - 0.2% |
Warsaw Stock Exchange | 49,938 | | 723,046 |
Portugal - 0.5% |
Jeronimo Martins SGPS SA | 98,869 | | 1,826,998 |
Russia - 0.1% |
Moscow Exchange MICEX-RTS OAO | 184,700 | | 352,747 |
Singapore - 0.8% |
Ezion Holdings Ltd. | 269,000 | | 485,075 |
Singapore Telecommunications Ltd. | 394,000 | | 1,198,937 |
United Overseas Bank Ltd. | 58,746 | | 985,563 |
TOTAL SINGAPORE | | 2,669,575 |
South Africa - 2.3% |
African Bank Investments Ltd. | 410,106 | | 694,489 |
Bidvest Group Ltd. | 31,600 | | 842,698 |
Clicks Group Ltd. | 118,211 | | 736,556 |
Nampak Ltd. | 25,130 | | 83,110 |
Naspers Ltd. Class N | 9,700 | | 907,314 |
Remgro Ltd. | 31,700 | | 645,447 |
Sasol Ltd. | 18,500 | | 945,310 |
Shoprite Holdings Ltd. | 48,300 | | 884,327 |
Standard Bank Group Ltd. | 83,671 | | 1,062,854 |
Tiger Brands Ltd. | 35,300 | | 1,034,447 |
TOTAL SOUTH AFRICA | | 7,836,552 |
Common Stocks - continued |
| Shares | | Value |
Spain - 1.9% |
Amadeus IT Holding SA Class A | 17,157 | | $ 637,116 |
Banco Bilbao Vizcaya Argentaria SA sponsored ADR | 169,876 | | 1,984,152 |
Grifols SA | 1,546 | | 63,403 |
Inditex SA | 12,680 | | 2,083,169 |
International Consolidated Airlines Group SA CDI (a) | 86,600 | | 483,075 |
Prosegur Compania de Seguridad SA (Reg.) | 74,476 | | 442,905 |
Repsol YPF SA | 33,855 | | 909,220 |
TOTAL SPAIN | | 6,603,040 |
Sweden - 2.7% |
ASSA ABLOY AB (B Shares) | 30,400 | | 1,509,198 |
Atlas Copco AB (A Shares) | 51,459 | | 1,427,817 |
Fagerhult AB | 13,985 | | 429,474 |
H&M Hennes & Mauritz AB (B Shares) | 40,086 | | 1,732,098 |
Intrum Justitia AB | 25,963 | | 691,139 |
SKF AB (B Shares) | 32,800 | | 869,092 |
Svenska Cellulosa AB (SCA) (B Shares) | 24,176 | | 686,474 |
Svenska Handelsbanken AB (A Shares) | 42,293 | | 1,916,224 |
Swedish Match Co. AB | 3,900 | | 128,675 |
TOTAL SWEDEN | | 9,390,191 |
Switzerland - 6.8% |
Credit Suisse Group | 16,189 | | 503,607 |
Nestle SA | 78,360 | | 5,656,343 |
Novartis AG | 47,854 | | 3,714,551 |
Roche Holding AG (participation certificate) | 18,964 | | 5,250,187 |
Schindler Holding AG: | | | |
(participation certificate) | 5,270 | | 747,505 |
(Reg.) | 2,001 | | 284,487 |
Swatch Group AG (Bearer) | 960 | | 614,184 |
Swiss Re Ltd. | 16,910 | | 1,485,344 |
Syngenta AG (Switzerland) | 2,230 | | 900,065 |
UBS AG (NY Shares) | 225,197 | | 4,359,814 |
Zehnder Group AG | 1,363 | | 64,218 |
TOTAL SWITZERLAND | | 23,580,305 |
Taiwan - 1.7% |
Chroma ATE, Inc. | 325,116 | | 691,431 |
CTCI Corp. | 353,000 | | 616,416 |
E.SUN Financial Holdings Co. Ltd. | 1,122,485 | | 749,340 |
King Slide Works Co. Ltd. | 48,000 | | 423,985 |
Standard Foods Corp. | 18,550 | | 56,718 |
Taiwan Semiconductor Manufacturing Co. Ltd. | 536,035 | | 1,971,867 |
Common Stocks - continued |
| Shares | | Value |
Taiwan - continued |
Unified-President Enterprises Corp. | 540,988 | | $ 1,029,228 |
Wowprime Corp. | 31,200 | | 516,202 |
TOTAL TAIWAN | | 6,055,187 |
Turkey - 1.3% |
Albaraka Turk Katilim Bankasi A/S (a) | 113,907 | | 101,568 |
Anadolu Efes Biracilik Ve Malt Sanayii A/S | 57,000 | | 728,115 |
Coca-Cola Icecek A/S | 35,589 | | 1,020,649 |
Enka Insaat ve Sanayi A/S | 254,062 | | 743,255 |
Tupras Turkiye Petrol Rafinelleri A/S | 22,313 | | 506,339 |
Turkiye Garanti Bankasi A/S | 313,143 | | 1,261,200 |
TOTAL TURKEY | | 4,361,126 |
United Kingdom - 16.7% |
Babcock International Group PLC | 49,400 | | 1,009,902 |
Barclays PLC | 467,229 | | 1,965,850 |
Barclays PLC sponsored ADR | 48,333 | | 812,478 |
Bellway PLC | 5,928 | | 142,955 |
Berendsen PLC | 7,328 | | 114,031 |
BG Group PLC | 103,727 | | 2,118,033 |
BHP Billiton PLC | 68,221 | | 2,105,198 |
BHP Billiton PLC ADR | 15,600 | | 961,584 |
British American Tobacco PLC (United Kingdom) | 15,840 | | 873,929 |
Britvic PLC | 9,817 | | 98,379 |
BT Group PLC | 124,647 | | 754,193 |
Bunzl PLC | 39,057 | | 862,332 |
Compass Group PLC | 65,914 | | 948,008 |
Dechra Pharmaceuticals PLC | 9,000 | | 99,571 |
Derwent London PLC | 2,000 | | 80,298 |
Elementis PLC | 32,808 | | 136,298 |
Fenner PLC | 8,953 | | 57,421 |
GlaxoSmithKline PLC sponsored ADR | 53,397 | | 2,810,284 |
Great Portland Estates PLC | 17,772 | | 163,280 |
Hilton Food Group PLC | 4,200 | | 28,823 |
HSBC Holdings PLC sponsored ADR | 84,258 | | 4,637,560 |
Imperial Tobacco Group PLC | 35,990 | | 1,343,981 |
InterContinental Hotel Group PLC ADR | 54,247 | | 1,592,149 |
ITV PLC | 304,819 | | 933,018 |
Johnson Matthey PLC | 29,077 | | 1,400,527 |
Kingfisher PLC | 152,227 | | 921,405 |
Legal & General Group PLC | 392,124 | | 1,359,947 |
Meggitt PLC | 14,735 | | 135,259 |
Common Stocks - continued |
| Shares | | Value |
United Kingdom - continued |
National Grid PLC | 122,891 | | $ 1,544,342 |
Next PLC | 7,800 | | 680,980 |
Persimmon PLC | 4,537 | | 92,024 |
Prudential PLC | 176,390 | | 3,607,310 |
Reckitt Benckiser Group PLC | 26,051 | | 2,025,018 |
Reed Elsevier PLC | 74,513 | | 1,044,204 |
Rexam PLC | 86,188 | | 717,917 |
Rolls-Royce Group PLC | 127,052 | | 2,342,725 |
Rotork PLC | 22,403 | | 1,028,417 |
Royal Dutch Shell PLC Class A sponsored ADR | 50,889 | | 3,392,261 |
SABMiller PLC | 45,563 | | 2,377,233 |
Serco Group PLC | 101,845 | | 909,571 |
Shaftesbury PLC | 49,537 | | 471,800 |
Spectris PLC | 5,170 | | 191,655 |
Spirax-Sarco Engineering PLC | 4,807 | | 224,906 |
Standard Chartered PLC (United Kingdom) | 76,604 | | 1,841,789 |
Taylor Wimpey PLC | 270,787 | | 478,466 |
Ted Baker PLC | 2,575 | | 70,478 |
Tesco PLC | 211,773 | | 1,236,666 |
Tullow Oil PLC | 35,500 | | 536,478 |
Ultra Electronics Holdings PLC | 5,001 | | 155,080 |
Unite Group PLC | 76,402 | | 485,112 |
Vodafone Group PLC sponsored ADR | 114,232 | | 4,206,022 |
TOTAL UNITED KINGDOM | | 58,127,147 |
United States of America - 5.7% |
AbbVie, Inc. | 15,329 | | 742,690 |
ANSYS, Inc. (a) | 400 | | 34,980 |
Autoliv, Inc. | 17,254 | | 1,539,574 |
Berkshire Hathaway, Inc. Class B (a) | 4,316 | | 496,685 |
BorgWarner, Inc. | 13,097 | | 1,350,694 |
BPZ Energy, Inc. (a) | 15,547 | | 31,249 |
Broadridge Financial Solutions, Inc. | 1,140 | | 40,082 |
Cabot Corp. | 7,508 | | 349,948 |
Cummins, Inc. | 6,191 | | 786,381 |
Dril-Quip, Inc. (a) | 1,070 | | 125,639 |
Evercore Partners, Inc. Class A | 2,160 | | 109,015 |
FMC Technologies, Inc. (a) | 10,803 | | 546,092 |
Google, Inc. Class A (a) | 600 | | 618,348 |
Greenhill & Co., Inc. | 1,420 | | 72,846 |
Kansas City Southern | 517 | | 62,826 |
Kennedy-Wilson Holdings, Inc. | 5,183 | | 103,867 |
Common Stocks - continued |
| Shares | | Value |
United States of America - continued |
KLA-Tencor Corp. | 8,500 | | $ 557,600 |
Martin Marietta Materials, Inc. | 7,780 | | 763,140 |
MasterCard, Inc. Class A | 2,409 | | 1,727,494 |
Mead Johnson Nutrition Co. Class A | 16,700 | | 1,363,722 |
Mohawk Industries, Inc. (a) | 6,035 | | 799,155 |
National Oilwell Varco, Inc. | 9,546 | | 774,944 |
Oceaneering International, Inc. | 1,250 | | 107,350 |
Philip Morris International, Inc. | 10,000 | | 891,200 |
PriceSmart, Inc. | 8,085 | | 919,992 |
ResMed, Inc. | 15,420 | | 797,831 |
Sohu.com, Inc. (a) | 5,600 | | 374,976 |
Solera Holdings, Inc. | 12,873 | | 723,720 |
SS&C Technologies Holdings, Inc. (a) | 19,854 | | 780,262 |
Union Pacific Corp. | 3,900 | | 590,460 |
Visa, Inc. Class A | 8,601 | | 1,691,559 |
TOTAL UNITED STATES OF AMERICA | | 19,874,321 |
TOTAL COMMON STOCKS (Cost $279,749,091) |
339,377,631
|
Nonconvertible Preferred Stocks - 0.8% |
| | | |
Brazil - 0.2% |
Banco ABC Brasil SA | 5,994 | | 36,897 |
Klabin SA (PN) (non-vtg.) | 124,100 | | 659,222 |
TOTAL BRAZIL | | 696,119 |
Germany - 0.6% |
Sartorius AG (non-vtg.) | 800 | | 84,398 |
Volkswagen AG | 7,390 | | 1,878,322 |
TOTAL GERMANY | | 1,962,720 |
United Kingdom - 0.0% |
Rolls-Royce Group PLC Series C | 8,544,272 | | 13,700 |
TOTAL NONCONVERTIBLE PREFERRED STOCKS (Cost $2,154,229) |
2,672,539
|
Money Market Funds - 1.2% |
| Shares | | Value |
Fidelity Cash Central Fund, 0.09% (b)
(Cost $4,180,055) | 4,180,055 | | $ 4,180,055 |
TOTAL INVESTMENT PORTFOLIO - 99.6% (Cost $286,083,375) | | 346,230,225 |
NET OTHER ASSETS (LIABILITIES) - 0.4% | | 1,255,209 |
NET ASSETS - 100% | $ 347,485,434 |
Legend |
(a) Non-income producing |
(b) Affiliated fund that is generally available only to investment companies and other accounts managed by Fidelity Investments. The rate quoted is the annualized seven-day yield of the fund at period end. A complete unaudited listing of the fund's holdings as of its most recent quarter end is available upon request. In addition, each Fidelity Central Fund's financial statements, which are not covered by the Fund's Report of Independent Registered Public Accounting Firm, are available on the SEC's website or upon request. |
(c) Security or a portion of the security purchased on a delayed delivery or when-issued basis. |
Affiliated Central Funds |
Information regarding fiscal year to date income earned by the Fund from investments in Fidelity Central Funds is as follows: |
Fund | Income earned |
Fidelity Cash Central Fund | $ 7,651 |
Fidelity Securities Lending Cash Central Fund | 117,973 |
Total | $ 125,624 |
Other Information |
Categorizations in the Schedule of Investments are based on country or territory of incorporation. |
The following is a summary of the inputs used, as of October 31, 2013, involving the Fund's assets and liabilities carried at fair value. The inputs or methodology used for valuing securities may not be an indication of the risk associated with investing in those securities. For more information on valuation inputs, and their aggregation into the levels used in the tables below, please refer to the Investment Valuation section in the accompanying Notes to Financial Statements. |
Valuation Inputs at Reporting Date: |
Description | Total | Level 1 | Level 2 | Level 3 |
Investments in Securities: | | | | |
Equities: | | | | |
Consumer Discretionary | $ 45,862,668 | $ 34,330,500 | $ 11,441,526 | $ 90,642 |
Consumer Staples | 47,931,001 | 31,254,840 | 16,676,161 | - |
Energy | 15,259,371 | 9,768,603 | 5,490,768 | - |
Financials | 85,212,436 | 60,767,201 | 24,445,235 | - |
Health Care | 32,901,496 | 22,458,101 | 10,443,395 | - |
Industrials | 44,536,699 | 35,172,801 | 9,363,898 | - |
Information Technology | 19,752,010 | 11,654,503 | 8,097,507 | - |
Materials | 22,658,420 | 16,715,477 | 5,942,943 | - |
Telecommunication Services | 19,997,074 | 12,671,219 | 7,325,855 | - |
Utilities | 7,938,995 | 4,997,458 | 2,941,537 | - |
Money Market Funds | 4,180,055 | 4,180,055 | - | - |
Total Investments in Securities: | $ 346,230,225 | $ 243,970,758 | $ 102,168,825 | $ 90,642 |
The following is a summary of transfers between Level 1 and Level 2 for the period ended October 31, 2013. Transfers are assumed to have occurred at the beginning of the period, and are primarily attributable to the valuation techniques used for foreign equity securities, as discussed in the accompanying Notes to Financial Statements: |
Transfers | Total |
Level 1 to Level 2 | $ 27,446,870 |
Level 2 to Level 1 | $ 0 |
See accompanying notes which are an integral part of the financial statements.
Annual Report
Statement of Assets and Liabilities
| October 31, 2013 |
| | |
Assets | | |
Investment in securities, at value - See accompanying schedule: Unaffiliated issuers (cost $281,903,320) | $ 342,050,170 | |
Fidelity Central Funds (cost $4,180,055) | 4,180,055 | |
Total Investments (cost $286,083,375) | | $ 346,230,225 |
Cash | | 98,120 |
Foreign currency held at value (cost $48,734) | | 48,356 |
Receivable for investments sold | | 5,463,171 |
Receivable for fund shares sold | | 129,490 |
Dividends receivable | | 652,586 |
Distributions receivable from Fidelity Central Funds | | 461 |
Prepaid expenses | | 1,143 |
Receivable from investment adviser for expense reductions | | 1,873 |
Other receivables | | 19,410 |
Total assets | | 352,644,835 |
| | |
Liabilities | | |
Payable for investments purchased
Regular delivery | $ 4,152,032 | |
Delayed delivery | 3,376 | |
Payable for fund shares redeemed | 510,377 | |
Accrued management fee | 211,644 | |
Distribution and service plan fees payable | 8,092 | |
Other affiliated payables | 52,427 | |
Other payables and accrued expenses | 221,453 | |
Total liabilities | | 5,159,401 |
| | |
Net Assets | | $ 347,485,434 |
Net Assets consist of: | | |
Paid in capital | | $ 304,386,459 |
Undistributed net investment income | | 4,647,078 |
Accumulated undistributed net realized gain (loss) on investments and foreign currency transactions | | (21,575,548) |
Net unrealized appreciation (depreciation) on investments and assets and liabilities in foreign currencies | | 60,027,445 |
Net Assets | | $ 347,485,434 |
See accompanying notes which are an integral part of the financial statements.
Annual Report
Financial Statements - continued
Statement of Assets and Liabilities - continued
| October 31, 2013 |
| | |
Calculation of Maximum Offering Price Class A:
Net Asset Value and redemption price per share ($9,033,736 ÷ 1,091,791 shares) | | $ 8.27 |
| | |
Maximum offering price per share (100/94.25 of $8.27) | | $ 8.77 |
Class T:
Net Asset Value and redemption price per share ($7,908,968 ÷ 950,538 shares) | | $ 8.32 |
| | |
Maximum offering price per share (100/96.50 of $8.32) | | $ 8.62 |
Class B:
Net Asset Value and offering price per share ($191,605 ÷ 23,044 shares)A | | $ 8.31 |
| | |
Class C:
Net Asset Value and offering price per share ($3,584,459 ÷ 433,098 shares)A | | $ 8.28 |
| | |
Total International Equity:
Net Asset Value, offering price and redemption price per share ($324,394,605 ÷ 39,121,493 shares) | | $ 8.29 |
| | |
Institutional Class:
Net Asset Value, offering price and redemption price per share ($2,372,061 ÷ 287,233 shares) | | $ 8.26 |
A Redemption price per share is equal to net asset value less any applicable contingent deferred sales charge.
See accompanying notes which are an integral part of the financial statements.
Annual Report
Statement of Operations
| Year ended October 31, 2013 |
| | |
Investment Income | | |
Dividends | | $ 9,425,071 |
Interest | | 291 |
Income from Fidelity Central Funds | | 125,624 |
Income before foreign taxes withheld | | 9,550,986 |
Less foreign taxes withheld | | (700,335) |
Total income | | 8,850,651 |
| | |
Expenses | | |
Management fee
Basic fee | $ 2,364,132 | |
Performance adjustment | 228,686 | |
Transfer agent fees | 478,126 | |
Distribution and service plan fees | 79,485 | |
Accounting and security lending fees | 174,309 | |
Custodian fees and expenses | 273,120 | |
Independent trustees' compensation | 1,910 | |
Registration fees | 73,943 | |
Audit | 93,320 | |
Legal | 893 | |
Miscellaneous | 2,714 | |
Total expenses before reductions | 3,770,638 | |
Expense reductions | (85,967) | 3,684,671 |
Net investment income (loss) | | 5,165,980 |
Realized and Unrealized Gain (Loss) Net realized gain (loss) on: | | |
Investment securities: | | |
Unaffiliated issuers | 8,824,925 | |
Foreign currency transactions | (119,832) | |
Futures contracts | (175,371) | |
Total net realized gain (loss) | | 8,529,722 |
Change in net unrealized appreciation (depreciation) on: Investment securities (net of increase in deferred foreign taxes of $90,453) | 44,707,928 | |
Assets and liabilities in foreign currencies | 18,535 | |
Total change in net unrealized appreciation (depreciation) | | 44,726,463 |
Net gain (loss) | | 53,256,185 |
Net increase (decrease) in net assets resulting from operations | | $ 58,422,165 |
See accompanying notes which are an integral part of the financial statements.
Annual Report
Financial Statements - continued
Statement of Changes in Net Assets
| Year ended
October 31,
2013 | Year ended
October 31,
2012 |
Increase (Decrease) in Net Assets | | |
Operations | | |
Net investment income (loss) | $ 5,165,980 | $ 5,615,371 |
Net realized gain (loss) | 8,529,722 | 9,140,393 |
Change in net unrealized appreciation (depreciation) | 44,726,463 | 20,537,189 |
Net increase (decrease) in net assets resulting
from operations | 58,422,165 | 35,292,953 |
Distributions to shareholders from net investment income | (5,845,552) | (1,867,192) |
Distributions to shareholders from net realized gain | (9,769,201) | - |
Total distributions | (15,614,753) | (1,867,192) |
Share transactions - net increase (decrease) | 10,109,727 | 122,647,348 |
Redemption fees | 2,498 | 3,128 |
Total increase (decrease) in net assets | 52,919,637 | 156,076,237 |
| | |
Net Assets | | |
Beginning of period | 294,565,797 | 138,489,560 |
End of period (including undistributed net investment income of $4,647,078 and undistributed net investment income of $5,300,982, respectively) | $ 347,485,434 | $ 294,565,797 |
See accompanying notes which are an integral part of the financial statements.
Annual Report
Financial Highlights - Class A
Years ended October 31, | 2013 | 2012 | 2011 | 2010 | 2009 |
Selected Per-Share Data | | | | | |
Net asset value, beginning of period | $ 7.31 | $ 6.67 | $ 7.36 | $ 6.40 | $ 4.90 |
Income from Investment Operations | | | | | |
Net investment income (loss) C | .09 | .13 | .11 | .08 | .06 |
Net realized and unrealized gain (loss) | 1.24 | .59 | (.69) | .95 | 1.55 |
Total from investment operations | 1.33 | .72 | (.58) | 1.03 | 1.61 |
Distributions from net investment income | (.13) | (.08) | (.09) | (.04) | (.11) |
Distributions from net realized gain | (.25) | - | (.02) | (.03) | - |
Total distributions | (.37) H | (.08) | (.11) | (.07) | (.11) |
Redemption fees added to paid in capital C, G | - | - | - | - | - |
Net asset value, end of period | $ 8.27 | $ 7.31 | $ 6.67 | $ 7.36 | $ 6.40 |
Total Return A, B | 19.00% | 10.88% | (8.03)% | 16.17% | 33.87% |
Ratios to Average Net Assets D, F | | | | | |
Expenses before reductions | 1.50% | 1.57% | 1.73% | 2.02% | 2.09% |
Expenses net of fee waivers, if any | 1.45% | 1.45% | 1.45% | 1.50% | 1.50% |
Expenses net of all reductions | 1.43% | 1.42% | 1.42% | 1.47% | 1.47% |
Net investment income (loss) | 1.21% | 1.88% | 1.44% | 1.15% | 1.13% |
Supplemental Data | | | | | |
Net assets, end of period (000 omitted) | $ 9,034 | $ 5,767 | $ 4,307 | $ 5,029 | $ 3,727 |
Portfolio turnover rate E | 89% | 110% | 75% | 67% | 98% |
A Total returns would have been lower if certain expenses had not been reduced during the applicable periods shown.
B Total returns do not include the effect of the sales charges.
C Calculated based on average shares outstanding during the period.
D Fees and expenses of any underlying Fidelity Central Funds are not included in the Fund's expense ratio. The Fund indirectly bears its proportionate share of the expenses of any underlying Fidelity Central Funds.
E Amount does not include the portfolio activity of any underlying Fidelity Central Funds.
F Expense ratios reflect operating expenses of the class. Expenses before reductions do not reflect amounts reimbursed by the investment adviser or reductions from brokerage service arrangements or reductions from other expense offset arrangements and do not represent the amount paid by the class during periods when reimbursements or reductions occur. Expenses net of fee waivers reflect expenses after reimbursement by the investment adviser but prior to reductions from brokerage service arrangements or other expense offset arrangements. Expenses net of all reductions represent the net expenses paid by the class.
G Amount represents less than $.01 per share.
H Total distributions of $.37 per share is comprised of distributions from net investment income of $.126 and distributions from net realized gain of $.245 per share.
See accompanying notes which are an integral part of the financial statements.
Annual Report
Financial Highlights - Class T
Years ended October 31, | 2013 | 2012 | 2011 | 2010 | 2009 |
Selected Per-Share Data | | | | | |
Net asset value, beginning of period | $ 7.37 | $ 6.73 | $ 7.41 | $ 6.40 | $ 4.88 |
Income from Investment Operations | | | | | |
Net investment income (loss) C | .07 | .11 | .09 | .06 | .04 |
Net realized and unrealized gain (loss) | 1.25 | .59 | (.68) | .95 | 1.57 |
Total from investment operations | 1.32 | .70 | (.59) | 1.01 | 1.61 |
Distributions from net investment income | (.13) | (.06) | (.07) | - | (.09) |
Distributions from net realized gain | (.25) | - | (.02) | - | - |
Total distributions | (.37) H | (.06) | (.09) | - | (.09) |
Redemption fees added to paid in capital C, G | - | - | - | - | - |
Net asset value, end of period | $ 8.32 | $ 7.37 | $ 6.73 | $ 7.41 | $ 6.40 |
Total Return A, B | 18.73% | 10.52% | (8.08)% | 15.78% | 33.74% |
Ratios to Average Net Assets D, F | | | | | |
Expenses before reductions | 1.75% | 1.84% | 2.02% | 2.31% | 2.34% |
Expenses net of fee waivers, if any | 1.70% | 1.70% | 1.70% | 1.75% | 1.75% |
Expenses net of all reductions | 1.67% | 1.67% | 1.67% | 1.72% | 1.72% |
Net investment income (loss) | .96% | 1.63% | 1.19% | .90% | .88% |
Supplemental Data | | | | | |
Net assets, end of period (000 omitted) | $ 7,909 | $ 2,348 | $ 997 | $ 1,004 | $ 1,526 |
Portfolio turnover rate E | 89% | 110% | 75% | 67% | 98% |
A Total returns would have been lower if certain expenses had not been reduced during the applicable periods shown.
B Total returns do not include the effect of the sales charges.
C Calculated based on average shares outstanding during the period.
D Fees and expenses of any underlying Fidelity Central Funds are not included in the Fund's expense ratio. The Fund indirectly bears its proportionate share of the expenses of any underlying Fidelity Central Funds.
E Amount does not include the portfolio activity of any underlying Fidelity Central Funds.
F Expense ratios reflect operating expenses of the class. Expenses before reductions do not reflect amounts reimbursed by the investment adviser or reductions from brokerage service arrangements or reductions from other expense offset arrangements and do not represent the amount paid by the class during periods when reimbursements or reductions occur. Expenses net of fee waivers reflect expenses after reimbursement by the investment adviser but prior to reductions from brokerage service arrangements or other expense offset arrangements. Expenses net of all reductions represent the net expenses paid by the class.
G Amount represents less than $.01 per share.
H Total distributions of $.37 per share is comprised of distributions from net investment income of $.128 and distributions from net realized gain of $.245 per share.
See accompanying notes which are an integral part of the financial statements.
Annual Report
Financial Highlights - Class B
Years ended October 31, | 2013 | 2012 | 2011 | 2010 | 2009 |
Selected Per-Share Data | | | | | |
Net asset value, beginning of period | $ 7.33 | $ 6.68 | $ 7.37 | $ 6.39 | $ 4.86 |
Income from Investment Operations | | | | | |
Net investment income (loss) C | .04 | .08 | .05 | .03 | .02 |
Net realized and unrealized gain (loss) | 1.24 | .59 | (.68) | .95 | 1.56 |
Total from investment operations | 1.28 | .67 | (.63) | .98 | 1.58 |
Distributions from net investment income | (.05) | (.02) | (.04) | - | (.05) |
Distributions from net realized gain | (.25) | - | (.02) | - | - |
Total distributions | (.30) | (.02) | (.06) | - | (.05) |
Redemption fees added to paid in capital C, G | - | - | - | - | - |
Net asset value, end of period | $ 8.31 | $ 7.33 | $ 6.68 | $ 7.37 | $ 6.39 |
Total Return A, B | 18.05% | 10.05% | (8.66)% | 15.34% | 32.95% |
Ratios to Average Net Assets D, F | | | | | |
Expenses before reductions | 2.26% | 2.34% | 2.51% | 2.81% | 2.82% |
Expenses net of fee waivers, if any | 2.20% | 2.20% | 2.20% | 2.25% | 2.25% |
Expenses net of all reductions | 2.18% | 2.17% | 2.17% | 2.22% | 2.22% |
Net investment income (loss) | .46% | 1.13% | .69% | .40% | .38% |
Supplemental Data | | | | | |
Net assets, end of period (000 omitted) | $ 192 | $ 220 | $ 254 | $ 327 | $ 1,337 |
Portfolio turnover rate E | 89% | 110% | 75% | 67% | 98% |
A Total returns would have been lower if certain expenses had not been reduced during the applicable periods shown.
B Total returns do not include the effect of the contingent deferred sales charge.
C Calculated based on average shares outstanding during the period.
D Fees and expenses of any underlying Fidelity Central Funds are not included in the Fund's expense ratio. The Fund indirectly bears its proportionate share of the expenses of any underlying Fidelity Central Funds.
E Amount does not include the portfolio activity of any underlying Fidelity Central Funds.
F Expense ratios reflect operating expenses of the class. Expenses before reductions do not reflect amounts reimbursed by the investment adviser or reductions from brokerage service arrangements or reductions from other expense offset arrangements and do not represent the amount paid by the class during periods when reimbursements or reductions occur. Expenses net of fee waivers reflect expenses after reimbursement by the investment adviser but prior to reductions from brokerage service arrangements or other expense offset arrangements. Expenses net of all reductions represent the net expenses paid by the class.
G Amount represents less than $.01 per share.
See accompanying notes which are an integral part of the financial statements.
Annual Report
Financial Highlights - Class C
Years ended October 31, | 2013 | 2012 | 2011 | 2010 | 2009 |
Selected Per-Share Data | | | | | |
Net asset value, beginning of period | $ 7.31 | $ 6.67 | $ 7.36 | $ 6.39 | $ 4.86 |
Income from Investment Operations | | | | | |
Net investment income (loss) C | .04 | .08 | .05 | .03 | .02 |
Net realized and unrealized gain (loss) | 1.25 | .58 | (.69) | .94 | 1.56 |
Total from investment operations | 1.29 | .66 | (.64) | .97 | 1.58 |
Distributions from net investment income | (.08) | (.02) | (.03) | - | (.05) |
Distributions from net realized gain | (.25) | - | (.02) | - | - |
Total distributions | (.32) H | (.02) | (.05) | - | (.05) |
Redemption fees added to paid in capital C, G | - | - | - | - | - |
Net asset value, end of period | $ 8.28 | $ 7.31 | $ 6.67 | $ 7.36 | $ 6.39 |
Total Return A, B | 18.30% | 9.98% | (8.72)% | 15.18% | 33.10% |
Ratios to Average Net Assets D, F | | | | | |
Expenses before reductions | 2.26% | 2.31% | 2.51% | 2.80% | 2.85% |
Expenses net of fee waivers, if any | 2.20% | 2.20% | 2.20% | 2.25% | 2.25% |
Expenses net of all reductions | 2.18% | 2.17% | 2.17% | 2.22% | 2.22% |
Net investment income (loss) | .46% | 1.13% | .69% | .40% | .38% |
Supplemental Data | | | | | |
Net assets, end of period (000 omitted) | $ 3,584 | $ 2,737 | $ 1,396 | $ 1,423 | $ 1,714 |
Portfolio turnover rate E | 89% | 110% | 75% | 67% | 98% |
A Total returns would have been lower if certain expenses had not been reduced during the applicable periods shown.
B Total returns do not include the effect of the contingent deferred sales charge.
C Calculated based on average shares outstanding during the period.
D Fees and expenses of any underlying Fidelity Central Funds are not included in the Fund's expense ratio. The Fund indirectly bears its proportionate share of the expenses of any underlying Fidelity Central Funds.
E Amount does not include the portfolio activity of any underlying Fidelity Central Funds.
F Expense ratios reflect operating expenses of the class. Expenses before reductions do not reflect amounts reimbursed by the investment adviser or reductions from brokerage service arrangements or reductions from other expense offset arrangements and do not represent the amount paid by the class during periods when reimbursements or reductions occur. Expenses net of fee waivers reflect expenses after reimbursement by the investment adviser but prior to reductions from brokerage service arrangements or other expense offset arrangements. Expenses net of all reductions represent the net expenses paid by the class.
G Amount represents less than $.01 per share.
H Total distributions of $.32 per share is comprised of distributions from net investment income of $.075 and distributions from net realized gain of $.245 per share.
See accompanying notes which are an integral part of the financial statements.
Annual Report
Financial Highlights - Total International Equity
Years ended October 31, | 2013 | 2012 | 2011 | 2010 | 2009 |
Selected Per-Share Data | | | | | |
Net asset value, beginning of period | $ 7.32 | $ 6.69 | $ 7.37 | $ 6.41 | $ 4.91 |
Income from Investment Operations | | | | | |
Net investment income (loss) B | .12 | .15 | .12 | .09 | .07 |
Net realized and unrealized gain (loss) | 1.24 | .58 | (.68) | .96 | 1.55 |
Total from investment operations | 1.36 | .73 | (.56) | 1.05 | 1.62 |
Distributions from net investment income | (.15) | (.10) | (.10) | (.06) | (.12) |
Distributions from net realized gain | (.25) | - | (.02) | (.03) | - |
Total distributions | (.39) G | (.10) | (.12) | (.09) | (.12) |
Redemption fees added to paid in capital B, F | - | - | - | - | - |
Net asset value, end of period | $ 8.29 | $ 7.32 | $ 6.69 | $ 7.37 | $ 6.41 |
Total Return A | 19.48% | 11.03% | (7.70)% | 16.45% | 34.23% |
Ratios to Average Net Assets C, E | | | | | |
Expenses before reductions | 1.09% | 1.16% | 1.42% | 1.79% | 1.87% |
Expenses net of fee waivers, if any | 1.09% | 1.16% | 1.20% | 1.25% | 1.25% |
Expenses net of all reductions | 1.07% | 1.13% | 1.17% | 1.22% | 1.22% |
Net investment income (loss) | 1.57% | 2.16% | 1.69% | 1.40% | 1.38% |
Supplemental Data | | | | | |
Net assets, end of period (000 omitted) | $ 324,395 | $ 281,979 | $ 131,338 | $ 60,826 | $ 33,061 |
Portfolio turnover rate D | 89% | 110% | 75% | 67% | 98% |
A Total returns would have been lower if certain expenses had not been reduced during the applicable periods shown.
B Calculated based on average shares outstanding during the period.
C Fees and expenses of any underlying Fidelity Central Funds are not included in the Fund's expense ratio. The Fund indirectly bears its proportionate share of the expenses of any underlying Fidelity Central Funds.
D Amount does not include the portfolio activity of any underlying Fidelity Central Funds.
E Expense ratios reflect operating expenses of the class. Expenses before reductions do not reflect amounts reimbursed by the investment adviser or reductions from brokerage service arrangements or reductions from other expense offset arrangements and do not represent the amount paid by the class during periods when reimbursements or reductions occur. Expenses net of fee waivers reflect expenses after reimbursement by the investment adviser but prior to reductions from brokerage service arrangements or other expense offset arrangements. Expenses net of all reductions represent the net expenses paid by the class.
F Amount represents less than $.01 per share.
G Total distributions of $.39 per share is comprised of distributions from net investment income of $.148 and distributions from net realized gain of $.245 per share.
See accompanying notes which are an integral part of the financial statements.
Annual Report
Financial Highlights - Institutional Class
Years ended October 31, | 2013 | 2012 | 2011 | 2010 | 2009 |
Selected Per-Share Data | | | | | |
Net asset value, beginning of period | $ 7.30 | $ 6.67 | $ 7.35 | $ 6.41 | $ 4.91 |
Income from Investment Operations | | | | | |
Net investment income (loss) B | .11 | .14 | .12 | .10 | .07 |
Net realized and unrealized gain (loss) | 1.24 | .59 | (.68) | .95 | 1.55 |
Total from investment operations | 1.35 | .73 | (.56) | 1.05 | 1.62 |
Distributions from net investment income | (.15) | (.10) | (.10) | (.08) | (.12) |
Distributions from net realized gain | (.25) | - | (.02) | (.03) | - |
Total distributions | (.39) G | (.10) | (.12) | (.11) | (.12) |
Redemption fees added to paid in capital B, F | - | - | - | - | - |
Net asset value, end of period | $ 8.26 | $ 7.30 | $ 6.67 | $ 7.35 | $ 6.41 |
Total Return A | 19.40% | 11.06% | (7.72)% | 16.48% | 34.23% |
Ratios to Average Net Assets C, E | | | | | |
Expenses before reductions | 1.21% | 1.27% | 1.48% | 1.82% | 1.80% |
Expenses net of fee waivers, if any | 1.20% | 1.20% | 1.20% | 1.25% | 1.25% |
Expenses net of all reductions | 1.18% | 1.17% | 1.17% | 1.23% | 1.22% |
Net investment income (loss) | 1.46% | 2.13% | 1.69% | 1.40% | 1.38% |
Supplemental Data | | | | | |
Net assets, end of period (000 omitted) | $ 2,372 | $ 1,514 | $ 197 | $ 28 | $ 1,308 |
Portfolio turnover rate D | 89% | 110% | 75% | 67% | 98% |
A Total returns would have been lower if certain expenses had not been reduced during the applicable periods shown.
B Calculated based on average shares outstanding during the period.
C Fees and expenses of any underlying Fidelity Central Funds are not included in the Fund's expense ratio. The Fund indirectly bears its proportionate share of the expenses of any underlying Fidelity Central Funds.
D Amount does not include the portfolio activity of any underlying Fidelity Central Funds.
E Expense ratios reflect operating expenses of the class. Expenses before reductions do not reflect amounts reimbursed by the investment adviser or reductions from brokerage service arrangements or reductions from other expense offset arrangements and do not represent the amount paid by the class during periods when reimbursements or reductions occur. Expenses net of fee waivers reflect expenses after reimbursement by the investment adviser but prior to reductions from brokerage service arrangements or other expense offset arrangements. Expenses net of all reductions represent the net expenses paid by the class.
F Amount represents less than $.01 per share.
G Total distributions of $.39 per share is comprised of distributions from net investment income of $.148 and distributions from net realized gain of $.245 per share.
See accompanying notes which are an integral part of the financial statements.
Annual Report
Notes to Financial Statements
For the period ended October 31, 2013
1. Organization.
Fidelity Total International Equity Fund (the Fund) is a fund of Fidelity Investment Trust (the Trust) and is authorized to issue an unlimited number of shares. The Trust is registered under the Investment Company Act of 1940, as amended (the 1940 Act), as an open-end management investment company organized as a Massachusetts business trust. The Fund offers Class A, Class T, Class C, Total International Equity and Institutional Class shares, each of which, along with Class B shares, has equal rights as to assets and voting privileges. Class B shares are closed to new accounts and additional purchases, except for exchanges and reinvestments. Each class has exclusive voting rights with respect to matters that affect that class. Class B shares will automatically convert to Class A shares after a holding period of seven years from the initial date of purchase. The Fund's investments in emerging markets can be subject to social, economic, regulatory, and political uncertainties and can be extremely volatile.
2. Investments in Fidelity Central Funds.
The Fund invests in Fidelity Central Funds, which are open-end investment companies generally available only to other investment companies and accounts managed by Fidelity Management & Research Company (FMR) and its affiliates. The Fund's Schedule of Investments lists each of the Fidelity Central Funds held as of period end, if any, as an investment of the Fund, but does not include the underlying holdings of each Fidelity Central Fund. As an Investing Fund, the Fund indirectly bears its proportionate share of the expenses of the underlying Fidelity Central Funds.
The Money Market Central Funds seek preservation of capital and current income and are managed by Fidelity Investments Money Management, Inc. (FIMM), an affiliate of FMR.
A complete unaudited list of holdings for each Fidelity Central Fund is available upon request or at the Securities and Exchange Commission (the SEC) website at www.sec.gov. In addition, the financial statements of the Fidelity Central Funds, which are not covered by the Fund's Report of Independent Registered Public Accounting Firm, are available on the SEC website or upon request.
3. Significant Accounting Policies.
The financial statements have been prepared in conformity with accounting principles generally accepted in the United States of America (GAAP), which require management to make certain estimates and assumptions at the date of the financial statements. Actual results could differ from those estimates. Subsequent events, if any, through the date that the financial statements were issued have been evaluated in the preparation of
Annual Report
3. Significant Accounting Policies - continued
the financial statements. The following summarizes the significant accounting policies of the Fund:
Investment Valuation. Investments are valued as of 4:00 p.m. Eastern time on the last calendar day of the period. In accordance with valuation policies and procedures approved by the Board of Trustees (the Board), the Fund attempts to obtain prices from one or more third party pricing vendors or brokers to value its investments. When current market prices, quotations or currency exchange rates are not readily available or reliable, investments will be fair valued in good faith by the FMR Fair Value Committee (the Committee), in accordance with procedures adopted by the Board. Factors used in determining fair value vary by investment type and may include market or investment specific events. The frequency with which these procedures are used cannot be predicted and they may be utilized to a significant extent. The Committee oversees the Fund's valuation policies and procedures and is responsible for approving and reporting to the Board all fair value determinations.
The Fund categorizes the inputs to valuation techniques used to value its investments into a disclosure hierarchy consisting of three levels as shown below:
Level 1 - quoted prices in active markets for identical investments
Level 2 - other significant observable inputs (including quoted prices for similar investments, interest rates, prepayment speeds, etc.)
Level 3 - unobservable inputs (including the Fund's own assumptions based on the best information available)
Valuation techniques used to value the Fund's investments by major category are as follows:
Equity securities, including restricted securities, for which market quotations are readily available, are valued at the last reported sale price or official closing price as reported by a third party pricing vendor on the primary market or exchange on which they are traded and are categorized as Level 1 in the hierarchy. In the event there were no sales during the day or closing prices are not available, securities are valued at the last quoted bid price or may be valued using the last available price and are generally categorized as Level 2 in the hierarchy. For foreign equity securities, when market or security specific events arise, comparisons to the valuation of American Depositary Receipts (ADRs), futures contracts, Exchange-Traded Funds (ETFs) and certain indexes as well as quoted prices for similar securities may be used and would be categorized as Level 2 in the hierarchy. Utilizing these techniques may result in transfers between Level 1 and Level 2. For equity securities, including restricted securities, where observable inputs are limited, assumptions about market activity and risk are used and these securities may be categorized as Level 3 in the hierarchy.
Annual Report
Notes to Financial Statements - continued
3. Significant Accounting Policies - continued
Investment Valuation - continued
Investments in open-end mutual funds, including the Fidelity Central Funds, are valued at their closing net asset value (NAV) each business day and are categorized as Level 1 in the hierarchy.
Changes in valuation techniques may result in transfers in or out of an assigned level within the disclosure hierarchy. The aggregate value of investments by input level, as of October 31, 2013, including information on transfers between Levels 1 and 2 is included at the end of the Fund's Schedule of Investments.
Foreign Currency. The Fund may use foreign currency contracts to facilitate transactions in foreign-denominated securities. Gains and losses from these transactions may arise from changes in the value of the foreign currency or if the counterparties do not perform under the contracts' terms.
Foreign-denominated assets, including investment securities, and liabilities are translated into U.S. dollars at the exchange rates at period end. Purchases and sales of investment securities, income and dividends received and expenses denominated in foreign currencies are translated into U.S. dollars at the exchange rate in effect on the transaction date.
The effects of exchange rate fluctuations on investments are included with the net realized and unrealized gain (loss) on investment securities. Other foreign currency transactions resulting in realized and unrealized gain (loss) are disclosed separately.
Investment Transactions and Income. For financial reporting purposes, the Fund's investment holdings and net asset value include trades executed through the end of the last business day of the period. The NAV per share for processing shareholder transactions is calculated as of the close of business of the New York Stock Exchange (NYSE), normally 4:00 p.m. Eastern time and includes trades executed through the end of the prior business day. Gains and losses on securities sold are determined on the basis of identified cost and may include proceeds received from litigation. Dividend income is recorded on the ex-dividend date, except for certain dividends from foreign securities where the ex-dividend date may have passed, which are recorded as soon as the Fund is informed of the ex-dividend date. Non-cash dividends included in dividend income, if any, are recorded at the fair market value of the securities received. Distributions received on securities that represent a return of capital or capital gain are recorded as a reduction of cost of investments and/or as a realized gain. Subsequent to ex-dividend date the Fund determines the components of these distributions, based upon receipt of tax filings or other correspondence relating to the underlying investment. Interest income and distributions from the Fidelity Central Funds are accrued as earned. Interest income includes coupon interest and amortization of premium and accretion of discount
Annual Report
3. Significant Accounting Policies - continued
Investment Transactions and Income - continued
on debt securities. Investment income is recorded net of foreign taxes withheld where recovery of such taxes is uncertain.
Class Allocations and Expenses. Investment income, realized and unrealized capital gains and losses, common expenses of the Fund, and certain fund-level expense reductions, if any, are allocated daily on a pro-rata basis to each class based on the relative net assets of each class to the total net assets of the Fund. Each class differs with respect to transfer agent and distribution and service plan fees incurred. Certain expense reductions may also differ by class. For the reporting period, the allocated portion of income and expenses to each class as a percent of its average net assets may vary due to the timing of recording these transactions in relation to fluctuating net assets of the classes. Expenses directly attributable to a fund are charged to that fund. Expenses attributable to more than one fund are allocated among the respective funds on the basis of relative net assets or other appropriate methods. Expense estimates are accrued in the period to which they relate and adjustments are made when actual amounts are known.
Income Tax Information and Distributions to Shareholders. Each year, the Fund intends to qualify as a regulated investment company under Subchapter M of the Internal Revenue Code, including distributing substantially all of its taxable income and realized gains. As a result, no provision for U.S. Federal income taxes is required. As of October 31, 2013, the Fund did not have any unrecognized tax benefits in the financial statements; nor is the Fund aware of any tax positions for which it is reasonably possible that the total amounts of unrecognized tax benefits will significantly change in the next twelve months. The Fund files a U.S. federal tax return, in addition to state and local tax returns as required. The Fund's federal income tax returns are subject to examination by the Internal Revenue Service (IRS) for a period of three fiscal years after they are filed. State and local tax returns may be subject to examination for an additional fiscal year depending on the jurisdiction. Foreign taxes are provided for based on the Fund's understanding of the tax rules and rates that exist in the foreign markets in which it invests. The Fund is subject to a tax imposed on capital gains by certain countries in which it invests. An estimated deferred tax liability for net unrealized appreciation on the applicable securities is included in Other payables and accrued expenses on the Statement of Assets & Liabilities.
Distributions are declared and recorded on the ex-dividend date. Income dividends and capital gain distributions are declared separately for each class. Income and capital gain distributions are determined in accordance with income tax regulations, which may differ from GAAP.
Annual Report
Notes to Financial Statements - continued
3. Significant Accounting Policies - continued
Income Tax Information and Distributions to Shareholders - continued
Capital accounts within the financial statements are adjusted for permanent book-tax differences. These adjustments have no impact on net assets or the results of operations. Temporary book-tax differences will reverse in a subsequent period.
Book-tax differences are primarily due to foreign currency transactions, passive foreign investment companies (PFIC), partnerships, capital loss carryforwards and losses deferred due to wash sales.
The federal tax cost of investment securities and unrealized appreciation (depreciation) as of period end were as follows:
Gross unrealized appreciation | $ 63,585,282 |
Gross unrealized depreciation | (5,613,524) |
Net unrealized appreciation (depreciation) on securities and other investments | $ 57,971,758 |
| |
Tax Cost | $ 288,258,467 |
The tax-based components of distributable earnings as of period end were as follows:
Undistributed long-term capital gain | $ 3,268,059 |
Undistributed ordinary income | $ 8,977,623 |
Capital loss carryforward | $ (26,999,061) |
Net unrealized appreciation (depreciation) | $ 57,977,944 |
Capital loss carry forwards are only available to offset future capital gains of the Fund to the extent provided by regulations and may be limited. Under the Regulated Investment Company Modernization Act of 2012 (the Act), the Fund is permitted to carry forward capital losses incurred in taxable years beginning after December 22, 2010 for an unlimited period and such capital losses are required to be used prior to any losses that expire. Capital loss carryforwards were as follows:
Fiscal year of expiration: | |
2016 | $ (2,434,120) |
2017 | (15,708,944) |
2019 | (8,855,997) |
Total capital loss carryforward | $ (26,999,061) |
Due to large subscriptions in a prior period, $26,999,061 of capital losses that will be available to offset future capital gains of the Fund will be limited to approximately $4,535,766 per year.
Annual Report
3. Significant Accounting Policies - continued
Income Tax Information and Distributions to Shareholders - continued
The tax character of distributions paid was as follows:
| October 31, 2013 | October 31, 2012 |
Ordinary Income | $ 15,216,010 | $ 1,867,192 |
Long-term | 398,743 | - |
Total | $ 15,614,753 | $ 1,867,192 |
Short-Term Trading (Redemption) Fees. Shares held by investors in the Fund less than 30 days may have been subject to a redemption fee equal to 1.00% of the net asset value of shares redeemed. All redemption fees, which reduce the proceeds of the shareholder redemption, are retained by the Fund and accounted for as an addition to paid in capital.
Delayed Delivery Transactions and When-Issued Securities. During the period, the Fund transacted in securities on a delayed delivery or when-issued basis. Payment and delivery may take place after the customary settlement period for that security. The price of the underlying securities and the date when the securities will be delivered and paid for are fixed at the time the transaction is negotiated. The securities purchased on a delayed delivery or when-issued basis are identified as such in the Fund's Schedule of Investments. The Fund may receive compensation for interest forgone in the purchase of a delayed delivery or when-issued security. With respect to purchase commitments, the Fund identifies securities as segregated in its records with a value at least equal to the amount of the commitment. Losses may arise due to changes in the value of the underlying securities or if the counterparty does not perform under the contract's terms, or if the issuer does not issue the securities due to political, economic, or other factors.
New Accounting Pronouncement. The Financial Accounting Standards Board issued in December 2011, Accounting Standard Update No. 2011-11, Disclosures about Offsetting Assets and Liabilities, and in January 2013, Accounting Standards Update No. 2013-1 Clarifying the Scope of Disclosures about Offsetting Assets and Liabilities. These updates create new disclosure requirements requiring entities to disclose both gross and net information for derivatives and other financial instruments that are either offset in the Statement of Assets and Liabilities or subject to an enforceable master netting arrangement or similar agreement. The disclosure requirements are effective for annual reporting periods beginning on or after January 1, 2013, and interim periods within those annual periods. Management expects that the impact of the updates' adoption will be limited to additional financial statement disclosures as applicable.
Annual Report
Notes to Financial Statements - continued
4. Derivative Instruments.
Risk Exposures and the Use of Derivative Instruments. The Fund's investment objective allows the Fund to enter into various types of derivative contracts, including futures contracts. Derivatives are investments whose value is primarily derived from underlying assets, indices or reference rates and may be transacted on an exchange or over-the-counter (OTC). Derivatives may involve a future commitment to buy or sell a specified asset based on specified terms, to exchange future cash flows at periodic intervals based on a notional principal amount, or for one party to make one or more payments upon the occurrence of specified events in exchange for periodic payments from the other party.
The Fund used derivatives to increase returns and to manage exposure to certain risks as defined below. The success of any strategy involving derivatives depends on analysis of numerous economic factors, and if the strategies for investment do not work as intended, the Fund may not achieve its objectives.
The Fund's use of derivatives increased or decreased its exposure to the following risks:
Equity Risk | Equity risk relates to the fluctuations in the value of financial instruments as a result of changes in market prices (other than those arising from interest rate risk or foreign exchange risk), whether caused by factors specific to an individual investment, its issuer, or all factors affecting all instruments traded in a market or market segment. |
The Fund is also exposed to additional risks from investing in derivatives, such as liquidity risk and counterparty credit risk. Liquidity risk is the risk that the Fund will be unable to close out the derivative in the open market in a timely manner. Counterparty credit risk is the risk that the counterparty will not be able to fulfill its obligation to the Fund. Counterparty credit risk related to exchange-traded futures contracts may be mitigated by the protection provided by the exchange on which they trade.
Investing in derivatives may involve greater risks than investing in the underlying assets directly and, to varying degrees, may involve risk of loss in excess of any initial investment and collateral received and amounts recognized in the Statement of Assets and Liabilities. In addition, there may be the risk that the change in value of the derivative contract does not correspond to the change in value of the underlying instrument.
Futures Contracts. A futures contract is an agreement between two parties to buy or sell a specified underlying instrument for a fixed price at a specified future date. The Fund used futures contracts to manage its exposure to the stock market.
Upon entering into a futures contract, a fund is required to deposit either cash or securities (initial margin) with a clearing broker in an amount equal to a certain percentage of
Annual Report
4. Derivative Instruments - continued
Futures Contracts - continued
the face value of the contract. Futures contracts are marked-to-market daily and subsequent daily payments (variation margin) are made or received by a fund depending on the daily fluctuations in the value of the futures contracts and are recorded as unrealized appreciation or (depreciation). This receivable and/or payable, if any, is included in daily variation margin for derivative instruments in the Statement of Assets and Liabilities. Realized gain or (loss) is recorded upon the expiration or closing of a futures contract.
Any open futures contracts at period end are presented in the Schedule of Investments under the caption "Futures Contracts." The underlying face amount at value reflects each contract's exposure to the underlying instrument or index at period end.
During the period the Fund recognized net realized gain (loss) of $(175,371) related to its investment in futures contracts. This amount is included in the Statement of Operations.
5. Purchases and Sales of Investments.
Purchases and sales of securities, other than short-term securities, aggregated $291,344,236 and $292,758,849, respectively.
6. Fees and Other Transactions with Affiliates.
Management Fee. FMR and its affiliates provide the Fund with investment management related services for which the Fund pays a monthly management fee. The management fee is the sum of an individual fund fee rate that is based on an annual rate of .45% of the Fund's average net assets and an annualized group fee rate that averaged .25% during the period. The group fee rate is based upon the average net assets of all the mutual funds advised by FMR, including any mutual funds previously advised by FMR that are currently advised by Fidelity SelectCo, LLC, an affiliate of FMR. The group fee rate decreases as assets under management increase and increases as assets under management decrease. In addition, the management fee is subject to a performance adjustment (up to a maximum of ± .20% of the Fund's average net assets over a 36 month performance period). The upward or downward adjustment to the management fee is based on the relative investment performance of Total International Equity as compared to an appropriate benchmark index over the same 36 month performance period. For the reporting period, the total annual management fee rate, including the performance adjustment, was .77% of the Fund's average net assets. The performance adjustment included in the management fee rate may be higher or lower than the maximum performance adjustment rate due to the difference between the average net assets for the reporting and performance periods.
Annual Report
Notes to Financial Statements - continued
6. Fees and Other Transactions with Affiliates - continued
Distribution and Service Plan Fees. In accordance with Rule 12b-1 of the 1940 Act, the Fund has adopted separate Distribution and Service Plans for each class of shares. Certain classes pay Fidelity Distributors Corporation (FDC), an affiliate of FMR, separate Distribution and Service Fees, each of which is based on an annual percentage of each class' average net assets. In addition, FDC may pay financial intermediaries for selling shares of the Fund and providing shareholder support services. For the period, the Distribution and Service Fee rates, total fees and amounts retained by FDC were as follows:
| Distribution
Fee | Service
Fee | Total Fees | Retained
by FDC |
Class A | -% | .25% | $ 19,245 | $ 355 |
Class T | .25% | .25% | 26,314 | 52 |
Class B | .75% | .25% | 2,095 | 1,584 |
Class C | .75% | .25% | 31,831 | 4,423 |
| | | $ 79,485 | $ 6,414 |
Sales Load. FDC may receive a front-end sales charge of up to 5.75% for selling Class A shares and 3.50% for selling Class T shares, some of which is paid to financial intermediaries for selling shares of the Fund. Depending on the holding period, FDC may receive contingent deferred sales charges levied on Class A, Class T, Class B, and Class C redemptions. The deferred sales charges range from 5.00% to 1.00% for Class B shares, 1.00% for Class C shares, 1.00% for certain purchases of Class A shares and .25% for certain purchases of Class T shares. For the period, sales charge amounts retained by FDC were as follows:
| Retained
by FDC |
Class A | $ 3,610 |
Class T | 1,591 |
Class B* | 630 |
Class C* | 352 |
| $ 6,183 |
* When Class B and Class C shares are initially sold, FDC pays commissions from its own resources to financial intermediaries through which the sales are made.
Transfer Agent Fees. Fidelity Investments Institutional Operations Company, Inc., (FIIOC), an affiliate of FMR, is the transfer, dividend disbursing and shareholder servicing agent for each class of the Fund. FIIOC receives account fees and asset-based fees that vary according to the account size and type of account of the shareholders of the respective classes of the Fund. FIIOC pays for typesetting, printing and mailing of shareholder reports, except proxy statements.
Annual Report
6. Fees and Other Transactions with Affiliates - continued
Transfer Agent Fees - continued
For the period, transfer agent fees for each class were as follows:
| Amount | % of
Average
Net Assets* |
Class A | $ 22,457 | .29 |
Class T | 15,623 | .29 |
Class B | 627 | .30 |
Class C | 9,616 | .30 |
Total International Equity | 424,331 | .13 |
Institutional Class | 5,472 | .26 |
| $ 478,126 | |
Accounting and Security Lending Fees. Fidelity Service Company, Inc. (FSC), an affiliate of FMR, maintains the Fund's accounting records. The accounting fee is based on the level of average net assets for each month. Under a separate contract, FSC administers the security lending program. The security lending fee is based on the number and duration of lending transactions.
Brokerage Commissions. The Fund placed a portion of its portfolio transactions with brokerage firms which are affiliates of the investment adviser. Brokerage commissions are included in net realized gain (loss) and change in net unrealized appreciation (depreciation) in the Statement of Operations. The commissions paid to these affiliated firms were $625 for the period.
7. Committed Line of Credit.
The Fund participates with other funds managed by FMR or an affiliate in a $4.25 billion credit facility (the "line of credit") to be utilized for temporary or emergency purposes to fund shareholder redemptions or for other short-term liquidity purposes. The Fund has agreed to pay commitment fees on its pro-rata portion of the line of credit, which amounted to $721 and is reflected in Miscellaneous expenses on the Statement of Operations. During the period, there were no borrowings on this line of credit.
8. Security Lending.
The Fund lends portfolio securities through a lending agent from time to time in order to earn additional income. For equity securities, a lending agent is used and may loan securities to certain qualified borrowers, including Fidelity Capital Markets (FCM), a broker-dealer affiliated with the Fund. On the settlement date of the loan, the Fund
Annual Report
Notes to Financial Statements - continued
8. Security Lending - continued
receives collateral (in the form of U.S. Treasury obligations, letters of credit and/or cash) against the loaned securities and maintains collateral in an amount not less than 100% of the market value of the loaned securities during the period of the loan. The market value of the loaned securities is determined at the close of business of the Fund and any additional required collateral is delivered to the Fund on the next business day. If the borrower defaults on its obligation to return the securities loaned because of insolvency or other reasons, the Fund may apply collateral received from the borrower against the obligation. The Fund may experience delays and costs in recovering the securities loaned. Any cash collateral received is invested in the Fidelity Securities Lending Cash Central Fund. At period end, there were no security loans outstanding. Security lending income represents the income earned on investing cash collateral, less rebates paid to borrowers and any lending agent fees associated with the loan, plus any premium payments received for lending certain types of securities. Security lending income is presented in the Statement of Operations as a component of income from Fidelity Central Funds. Total security lending income during the period amounted to $117,973. During the period, there were no securities loaned to FCM.
9. Expense Reductions.
FMR contractually agreed to reimburse each class to the extent annual operating expenses exceeded certain levels of average net assets as noted in the table below. This reimbursement will remain in place through December 31, 2014. Some expenses, for example interest expense, including commitment fees, are excluded from this reimbursement.
The following classes were in reimbursement during the period:
| Expense
Limitations | Reimbursement |
Class A | 1.45% | $ 3,717 |
Class T | 1.70% | 2,651 |
Class B | 2.20% | 120 |
Class C | 2.20% | 1,829 |
Institutional Class | 1.20% | 308 |
| | $ 8,625 |
Commissions paid to certain brokers with whom FMR, or its affiliates, places trades include an amount in addition to trade execution, which may be rebated back to the Fund to offset certain expenses. This amount totaled $73,605 for the period.
In addition, FMR reimbursed a portion of the Fund's operating expenses during the period in the amount of $3,737.
Annual Report
10. Distributions to Shareholders.
Distributions to shareholders of each class were as follows:
Years ended October 31, | 2013 | 2012 |
From net investment income | | |
Class A | $ 102,760 | $ 48,329 |
Class T | 49,034 | 9,062 |
Class B | 1,541 | 714 |
Class C | 28,314 | 4,731 |
Total International Equity | 5,630,153 | 1,801,469 |
Institutional Class | 33,750 | 2,887 |
Total | $ 5,845,552 | $ 1,867,192 |
From net realized gain | | |
Class A | $ 199,811 | $ - |
Class T | 93,853 | - |
Class B | 6,990 | - |
Class C | 92,492 | - |
Total International Equity | 9,320,186 | - |
Institutional Class | 55,869 | - |
Total | $ 9,769,201 | $ - |
11. Share Transactions.
Transactions for each class of shares were as follows:
| Shares | Dollars |
Years ended October 31, | 2013 | 2012 | 2013 | 2012 |
Class A | | | | |
Shares sold | 510,102 | 388,955 | $ 3,880,513 | $ 2,677,369 |
Reinvestment of distributions | 41,103 | 7,157 | 293,886 | 46,237 |
Shares redeemed | (248,440) | (252,362) | (1,903,860) | (1,699,392) |
Net increase (decrease) | 302,765 | 143,750 | $ 2,270,539 | $ 1,024,214 |
Class T | | | | |
Shares sold | 807,518 | 207,939 | $ 6,202,497 | $ 1,463,372 |
Reinvestment of distributions | 19,724 | 1,377 | 142,209 | 8,993 |
Shares redeemed | (195,438) | (38,757) | (1,518,035) | (259,817) |
Net increase (decrease) | 631,804 | 170,559 | $ 4,826,671 | $ 1,212,548 |
Class B | | | | |
Shares sold | 827 | 4,797 | $ 6,304 | $ 32,306 |
Reinvestment of distributions | 1,165 | 108 | 8,437 | 705 |
Shares redeemed | (8,955) | (12,955) | (69,218) | (88,815) |
Net increase (decrease) | (6,963) | (8,050) | $ (54,477) | $ (55,804) |
Annual Report
Notes to Financial Statements - continued
11. Share Transactions - continued
| Shares | Dollars |
Years ended October 31, | 2013 | 2012 | 2013 | 2012 |
Class C | | | | |
Shares sold | 129,341 | 258,694 | $ 986,204 | $ 1,733,640 |
Reinvestment of distributions | 12,546 | 710 | 90,328 | 4,622 |
Shares redeemed | (83,065) | (94,222) | (635,648) | (638,538) |
Net increase (decrease) | 58,822 | 165,182 | $ 440,884 | $ 1,099,724 |
Total International Equity | | | | |
Shares sold | 10,376,724 | 32,478,543 | $ 77,880,274 | $ 209,916,522 |
Reinvestment of distributions | 2,062,441 | 266,160 | 14,746,450 | 1,719,395 |
Shares redeemed | (11,840,491) | (13,867,286) | (90,585,484) | (93,416,780) |
Net increase (decrease) | 598,674 | 18,877,417 | $ 2,041,240 | $ 118,219,137 |
Institutional Class | | | | |
Shares sold | 142,800 | 198,611 | $ 1,078,337 | $ 1,289,078 |
Reinvestment of distributions | 12,587 | 448 | 89,619 | 2,887 |
Shares redeemed | (75,629) | (21,161) | (583,086) | (144,436) |
Net increase (decrease) | 79,758 | 177,898 | $ 584,870 | $ 1,147,529 |
12. Other.
The Fund's organizational documents provide former and current trustees and officers with a limited indemnification against liabilities arising in connection with the performance of their duties to the Fund. In the normal course of business, the Fund may also enter into contracts that provide general indemnifications. The Fund's maximum exposure under these arrangements is unknown as this would be dependent on future claims that may be made against the Fund. The risk of material loss from such claims is considered remote.
At the end of the period, a shareholder of record owned approximately 71% of the total outstanding shares of the Fund.
Annual Report
To the Trustees of Fidelity Investment Trust and Shareholders of Fidelity Total International Equity Fund:
We have audited the accompanying statement of assets and liabilities of Fidelity Total International Equity Fund (the Fund), a fund of Fidelity Investment Trust, including the schedule of investments, as of October 31, 2013, and the related statement of operations for the year then ended, the statement of changes in net assets for each of the two years in the period then ended, and the financial highlights for each of the five years in the period then ended. These financial statements and financial highlights are the responsibility of the Fund's management. Our responsibility is to express an opinion on these financial statements and financial highlights based on our audits.
We conducted our audits in accordance with the standards of the Public Company Accounting Oversight Board (United States). Those standards require that we plan and perform the audit to obtain reasonable assurance about whether the financial statements and financial highlights are free of material misstatement. The Fund is not required to have, nor were we engaged to perform, an audit of its internal control over financial reporting. Our audits included consideration of internal control over financial reporting as a basis for designing audit procedures that are appropriate in the circumstances, but not for the purpose of expressing an opinion on the effectiveness of the Fund's internal control over financial reporting. Accordingly, we express no such opinion. An audit also includes examining, on a test basis, evidence supporting the amounts and disclosures in the financial statements, assessing the accounting principles used and significant estimates made by management, as well as evaluating the overall financial statement presentation. Our procedures included confirmation of securities owned as of October 31, 2013, by correspondence with the custodians and brokers; where replies were not received from brokers, we performed other auditing procedures. We believe that our audits provide a reasonable basis for our opinion.
In our opinion, the financial statements and financial highlights referred to above present fairly, in all material respects, the financial position of Fidelity Total International Equity Fund as of October 31, 2013, the results of its operations for the year then ended, the changes in its net assets for each of the two years in the period then ended, and the financial highlights for each of the five years in the period then ended, in conformity with accounting principles generally accepted in the United States of America.
DELOITTE & TOUCHE LLP
Boston, Massachusetts
December 11, 2013
Annual Report
The Trustees, Member of the Advisory Board, and executive officers of the trust and fund, as applicable, are listed below. The Board of Trustees governs the fund and is responsible for protecting the interests of shareholders. The Trustees are experienced executives who meet periodically throughout the year to oversee the fund's activities, review contractual arrangements with companies that provide services to the fund, oversee management of the risks associated with such activities and contractual arrangements, and review the fund's performance. Except for James C. Curvey, Ned C. Lautenbach, Ronald P. O'Hanley, and William S. Stavropoulos, each of the Trustees oversees 171 funds. Mr. Curvey oversees 394 funds. Mr. Lautenbach, Mr. O'Hanley, and Mr. Stavropoulos each oversees 245 funds.
The Trustees hold office without limit in time except that (a) any Trustee may resign; (b) any Trustee may be removed by written instrument, signed by at least two-thirds of the number of Trustees prior to such removal; (c) any Trustee who requests to be retired or who has become incapacitated by illness or injury may be retired by written instrument signed by a majority of the other Trustees; and (d) any Trustee may be removed at any special meeting of shareholders by a two-thirds vote of the outstanding voting securities of the trust. Each Trustee who is not an interested person of the trust and the fund (as defined in the 1940 Act) (Independent Trustee), shall retire not later than the last day of the calendar year in which his or her 75th birthday occurs. The Independent Trustees may waive this mandatory retirement age policy with respect to individual Trustees. The executive officers and Advisory Board Member hold office without limit in time, except that any officer and Advisory Board Member may resign or may be removed by a vote of a majority of the Trustees at any regular meeting or any special meeting of the Trustees. Except as indicated, each individual has held the office shown or other offices in the same company for the past five years.
Experience, Skills, Attributes, and Qualifications of the Fund's Trustees. The Governance and Nominating Committee has adopted a statement of policy that describes the experience, qualifications, attributes, and skills that are necessary and desirable for potential Independent Trustee candidates (Statement of Policy). The Board believes that each Trustee satisfied at the time he or she was initially elected or appointed a Trustee, and continues to satisfy, the standards contemplated by the Statement of Policy. The Governance and Nominating Committee also engages professional search firms to help identify potential Independent Trustee candidates who have the experience, qualifications, attributes, and skills consistent with the Statement of Policy. From time to time, additional criteria based on the composition and skills of the current Independent Trustees, as well as experience or skills that may be appropriate in light of future changes to board composition, business conditions, and regulatory or other developments, have also been considered by the professional search firms and the Governance and Nominating Committee. In addition, the Board takes into account the Trustees' commitment and participation in Board and committee meetings, as well as their leadership of standing and ad hoc committees throughout their tenure.
Annual Report
Trustees and Officers - continued
In determining that a particular Trustee was and continues to be qualified to serve as a Trustee, the Board has considered a variety of criteria, none of which, in isolation, was controlling. The Board believes that, collectively, the Trustees have balanced and diverse experience, qualifications, attributes, and skills, which allow the Board to operate effectively in governing the fund and protecting the interests of shareholders. Information about the specific experience, skills, attributes, and qualifications of each Trustee, which in each case led to the Board's conclusion that the Trustee should serve (or continue to serve) as a trustee of the fund, is provided below.
Board Structure and Oversight Function. James C. Curvey is an interested person (as defined in the 1940 Act) and currently serves as Chairman. The Trustees have determined that an interested Chairman is appropriate and benefits shareholders because an interested Chairman has a personal and professional stake in the quality and continuity of services provided to the fund. Independent Trustees exercise their informed business judgment to appoint an individual of their choosing to serve as Chairman, regardless of whether the Trustee happens to be independent or a member of management. The Independent Trustees have determined that they can act independently and effectively without having an Independent Trustee serve as Chairman and that a key structural component for assuring that they are in a position to do so is for the Independent Trustees to constitute a substantial majority for the Board. The Independent Trustees also regularly meet in executive session. Ned C. Lautenbach serves as Chairman of the Independent Trustees and as such (i) acts as a liaison between the Independent Trustees and management with respect to matters important to the Independent Trustees and (ii) with management prepares agendas for Board meetings.
Fidelity funds are overseen by different Boards of Trustees. The fund's Board oversees Fidelity's equity and high income funds and another Board oversees Fidelity's investment-grade bond, money market, and asset allocation funds. The asset allocation funds may invest in Fidelity funds overseen by the fund's Board. The use of separate Boards, each with its own committee structure, allows the Trustees of each group of Fidelity funds to focus on the unique issues of the funds they oversee, including common research, investment, and operational issues. On occasion, the separate Boards establish joint committees to address issues of overlapping consequences for the Fidelity funds overseen by each Board.
The Trustees operate using a system of committees to facilitate the timely and efficient consideration of all matters of importance to the Trustees, the fund, and fund shareholders and to facilitate compliance with legal and regulatory requirements and oversight of the fund's activities and associated risks. The Board, acting through its committees, has charged FMR and its affiliates with (i) identifying events or circumstances the occurrence of which could have demonstrably adverse effects on the fund's business and/or reputation; (ii) implementing processes and controls to lessen the possibility that such events or circumstances occur or to mitigate the effects of such events or circumstances if they do occur; and (iii) creating and maintaining a system designed to evaluate continuously business and market conditions in order to facilitate the identification and implementation processes described in (i) and (ii) above. Because the day-to-day operations and activities of the fund are carried out by or through FMR, its affiliates and other service providers, the fund's exposure to risks is mitigated but not eliminated by the processes overseen by the Trustees. While each of the Board's committees has responsibility for overseeing different aspects of the fund's activities, oversight is exercised primarily through the Operations, Audit, and Compliance Committees. In addition, the Independent Trustees have worked with FMR to enhance the Board's oversight of investment and financial risks, legal and regulatory risks, technology risks, and operational risks, including the development of additional risk reporting to the Board. For example, a working group comprised of Independent Trustees and FMR has worked and continues to work to review the Fidelity funds' valuation-related activities, reporting and risk management. Appropriate personnel, including but not limited to the fund's Chief Compliance Officer (CCO), FMR's internal auditor, the independent accountants, the fund's Treasurer and portfolio management personnel, make periodic reports to the Board's committees, as appropriate, including an annual review of FMR's risk management program for the Fidelity funds. The responsibilities of each standing committee, including their oversight responsibilities, are described further under "Standing Committees of the Fund's Trustees."
Annual Report
The fund's Statement of Additional Information (SAI) includes more information about the Trustees. To request a free copy, call Fidelity at 1-877-208-0098.
Interested Trustees*:
Correspondence intended for each Trustee who is an interested person may be sent to Fidelity Investments, 245 Summer Street, Boston, Massachusetts 02210.
Name, Year of Birth; Principal Occupations and Other Relevant Experience+ |
James C. Curvey (1935) |
Year of Election or Appointment: 2007 Trustee Chairman of the Board of Trustees |
| Mr. Curvey also serves as Trustee of other Fidelity funds. Mr. Curvey is a Director of Fidelity Investments Money Management, Inc. (2009-present), Director of Fidelity Research & Analysis Co. (2009-present) and Director of FMR and FMR Co., Inc. (2007-present). Mr. Curvey is also Vice Chairman (2007-present) and Director of FMR LLC. In addition, Mr. Curvey serves as an Overseer for the Boston Symphony Orchestra and a member of the Trustees of Villanova University. Previously, Mr. Curvey was the Vice Chairman (2006-2007) and Director (2000-2007) of FMR Corp. |
Ronald P. O'Hanley (1957) |
Year of Election or Appointment: 2011 Trustee |
| Mr. O'Hanley also serves as Trustee of other Fidelity funds. He is Director of Fidelity SelectCo, LLC (2013-present), FMR Co., Inc. (2010-present), Director of Fidelity Investments Money Management, Inc. (2010-present), Director of Fidelity Research & Analysis Company (2010-present), President of Fidelity Asset Management and Corporate Services and a Member of Fidelity's Executive Committee (2010-present). Previously, Mr. O'Hanley served as President and Chief Executive Officer of BNY Mellon Asset Management (2007-2010). Mr. O'Hanley also served as Vice Chairman of Bank New York Mellon Corp. and a member of that firm's Executive Committee. Prior to the 2007 merger of The Bank of New York and Mellon Financial Corporation, he was Vice Chairman of Mellon Financial Corporation and President and Chief Executive Officer of Mellon Asset Management. He joined Mellon in February 1997. Mr. O'Hanley currently serves as Chairman of the Boston Public Library Foundation Board of Directors and sits on the Board of Directors of Beth Israel Deaconess Medical Center, the Board of Trustees of the Marine Biological Laboratory and the Advisory Board of the Maxwell School of Citizenship and Public Administration at Syracuse University. Mr. O'Hanley also chairs the Council on Asset Management for the Financial Services Roundtable and is a member of the Board of Directors of Institutional Investor's U.S. Institute. |
* Trustees have been determined to be "Interested Trustees" by virtue of, among other things, their affiliation with the trust or various entities under common control with FMR.
+ The information above includes each Trustee's principal occupation during the last five years and other information relating to the experience, attributes, and skills relevant to each Trustee's qualifications to serve as a Trustee, which led to the conclusion that each Trustee should serve as a Trustee for the fund.
Annual Report
Independent Trustees:
Correspondence intended for each Independent Trustee (that is, the Trustees other than the Interested Trustees) may be sent to Fidelity Investments, P.O. Box 55235, Boston, Massachusetts 02205-5235.
Name, Year of Birth; Principal Occupations and Other Relevant Experience+ |
Dennis J. Dirks (1948) |
Year of Election or Appointment: 2005 Trustee |
| Mr. Dirks also serves as Trustee of other Fidelity funds. Prior to his retirement in May 2003, Mr. Dirks was Chief Operating Officer and a member of the Board of The Depository Trust & Clearing Corporation (DTCC). He also served as President, Chief Operating Officer, and Board member of The Depository Trust Company (DTC) and President and Board member of the National Securities Clearing Corporation (NSCC). In addition, Mr. Dirks served as Chief Executive Officer and Board member of the Government Securities Clearing Corporation, Chief Executive Officer and Board member of the Mortgage-Backed Securities Clearing Corporation, as a Trustee and a member of the Finance Committee of Manhattan College (2005-2008), and as a Trustee and a member of the Finance Committee of AHRC of Nassau County (2006-2008). Mr. Dirks is a member of the Independent Directors Council (IDC) Governing Council (2010-present) and Board of Directors for The Brookville Center for Children's Services, Inc. (2009-present). |
Alan J. Lacy (1953) |
Year of Election or Appointment: 2008 Trustee |
| Mr. Lacy also serves as Trustee of other Fidelity funds. Mr. Lacy serves as Senior Adviser (2007-present) of Oak Hill Capital Partners, L.P. (private equity). Mr. Lacy also served as Chief Executive Officer (2000-2005) and Vice Chairman (2005-2006) of Sears Holdings Corporation and Sears, Roebuck and Co. (retail). In addition, Mr. Lacy serves as a member of the Board of Directors of Dave & Buster's Entertainment, Inc. (restaurant and entertainment complexes, 2010-present), Earth Fare, Inc. (retail grocery, 2012-present), The Hillman Companies, Inc. (hardware wholesalers, 2010-present), and Bristol-Myers Squibb Company (global pharmaceuticals, 2008-present). Mr. Lacy is a member of the Board of Trustees of The National Parks Conservation Association (2006-present). Previously, Mr. Lacy served as Chairman of the Board of Trustees of the National Parks Conservation Association (2008-2011) and as a member of the Board of Directors for the Western Union Company (global money transfer, 2006-2011). |
Ned C. Lautenbach (1944) |
Year of Election or Appointment: 2000 Trustee Chairman of the Independent Trustees |
| Mr. Lautenbach also serves as Trustee of other Fidelity funds. Mr. Lautenbach currently serves as the Lead Director of the Eaton Corporation Board of Directors (diversified industrial, 1997-present). Mr. Lautenbach is Chairman of the Board of Directors of the Philharmonic Center for the Arts in Naples, Florida (2012-present) and a member of the Council on Foreign Relations (1994-present). Previously, Mr. Lautenbach was a Partner/Advisory Partner at Clayton, Dubilier & Rice, LLC (private equity investment, 1998-2010), as well as a Director of Sony Corporation (2006-2007). |
Joseph Mauriello (1944) |
Year of Election or Appointment: 2008 Trustee |
| Mr. Mauriello also serves as Trustee of other Fidelity funds. Prior to his retirement in January 2006, Mr. Mauriello served in numerous senior management positions including Deputy Chairman and Chief Operating Officer (2004-2005), and Vice Chairman of Financial Services (2002-2004) of KPMG LLP US (professional services, 1965-2005). Mr. Mauriello currently serves as a member of the Board of Directors of XL Group plc. (global insurance and re-insurance, 2006-present). Previously, Mr. Mauriello served as a Director of the Hamilton Funds of the Bank of New York (2006-2007) and of Arcadia Resources Inc. (health care services and products, 2007-2012). |
Robert W. Selander (1950) |
Year of Election or Appointment: 2011 Trustee |
| Mr. Selander also serves as Trustee of other Fidelity funds. Previously, Mr. Selander served as a Member of the Advisory Board of other Fidelity funds (2011), and Executive Vice Chairman (2010), Chief Executive Officer (2009-2010), and President and Chief Executive Officer (1997-2009) of Mastercard, Inc. |
Cornelia M. Small (1944) |
Year of Election or Appointment: 2005 Trustee |
| Ms. Small also serves as Trustee of other Fidelity funds. Ms. Small is a member of the Board of Directors (2009-present) and Chair of the Investment Committee (2010-present) of the Teagle Foundation. Ms. Small also serves on the Investment Committee of the Berkshire Taconic Community Foundation (2008-present). Previously, Ms. Small served as Chairperson (2002-2008) and a member of the Investment Committee and Chairperson (2008-2012) and a member of the Board of Trustees of Smith College. In addition, Ms. Small served as Chief Investment Officer, Director of Global Equity Investments, and a member of the Board of Directors of Scudder, Stevens & Clark and Scudder Kemper Investments. |
William S. Stavropoulos (1939) |
Year of Election or Appointment: 2001 Trustee Vice Chairman of the Independent Trustees |
| Mr. Stavropoulos also serves as Trustee of other Fidelity funds. Mr. Stavropoulos serves as President and Founder of the Michigan Baseball Foundation, the Great Lakes Loons (2007-present). Mr. Stavropoulos is Chairman Emeritus of the Board of Directors of The Dow Chemical Company, where he previously served in numerous senior management positions, including President, CEO (1995-2000; 2002-2004), Chairman of the Executive Committee (2000-2006), and as a member of the Board of Directors (1990-2006). Currently, Mr. Stavropoulos is Chairman of the Board of Directors of Univar Inc. (global distributor of commodity and specialty chemicals), a Director of Teradata Corporation (data warehousing and technology solutions), and Maersk Inc. (industrial conglomerate), and a member of the Advisory Board for Metalmark Capital LLC (private equity investment, 2005-present). Mr. Stavropoulos is an operating advisor to Clayton, Dubilier & Rice, LLC (private equity investment). In addition, Mr. Stavropoulos is a member of the University of Notre Dame Advisory Council for the College of Science, a Trustee of the Rollin L. Gerstacker Foundation, and a Director of the Naples Philharmonic Center for the Arts. Previously, Mr. Stavropoulos served as a Director of Chemical Financial Corporation (bank holding company, 1993-2012) and Tyco International, Ltd. (multinational manufacturing and services, 2007-2012). |
David M. Thomas (1949) |
Year of Election or Appointment: 2008 Trustee |
| Mr. Thomas also serves as Trustee of other Fidelity funds. Mr. Thomas serves as Non-Executive Chairman of the Board of Directors of Fortune Brands Home and Security (home and security products, 2011-present), and as a member of the Board of Directors of Interpublic Group of Companies, Inc. (marketing communication, 2004-present). Previously, Mr. Thomas served as Executive Chairman (2005-2006) and Chairman and Chief Executive Officer (2000-2005) of IMS Health, Inc. (pharmaceutical and healthcare information solutions), and a Director of Fortune Brands, Inc. (consumer products, 2000-2011). |
+ The information above includes each Trustee's principal occupation during the last five years and other information relating to the experience, attributes, and skills relevant to each Trustee's qualifications to serve as a Trustee, which led to the conclusion that each Trustee should serve as a Trustee for the fund.
Advisory Board Member and Executive Officers:
Correspondence intended for each executive officer and Peter S. Lynch may be sent to Fidelity Investments, 245 Summer Street, Boston, Massachusetts 02210. Executive officers appear below in alphabetical order.
Name, Year of Birth; Principal Occupation |
Peter S. Lynch (1944) |
Year of Election or Appointment: 2003 Member of the Advisory Board |
| Mr. Lynch also serves as Member of the Advisory Board of other Fidelity funds. Mr. Lynch is Vice Chairman and a Director of FMR and FMR Co., Inc. In addition, Mr. Lynch serves as a Trustee of Boston College and as the Chairman of the Inner-City Scholarship Fund. Previously, Mr. Lynch served on the Special Olympics International Board of Directors (1997-2006). |
Elizabeth Paige Baumann (1968) |
Year of Election or Appointment: 2012 Anti-Money Laundering (AML) Officer |
| Ms. Baumann also serves as AML Officer of other funds. She is Chief AML Officer of FMR LLC (2012-present) and is an employee of Fidelity Investments. Previously, Ms. Baumann served as Vice President and Deputy Anti-Money Laundering Officer (2007-2012). |
William C. Coffey (1969) |
Year of Election or Appointment: 2009 Assistant Secretary |
| Mr. Coffey also serves as Assistant Secretary of other funds. He is Senior Vice President and Deputy General Counsel of FMR LLC (2010-present), and is an employee of Fidelity Investments. Previously, Mr. Coffey served as Vice President and Associate General Counsel of FMR LLC (2005-2009). |
Jonathan Davis (1968) |
Year of Election or Appointment: 2010 Assistant Treasurer |
| Mr. Davis also serves as Assistant Treasurer of other funds. Mr. Davis is an employee of Fidelity Investments. Previously, Mr. Davis served as Vice President and Associate General Counsel of FMR LLC (2003-2010). |
Adrien E. Deberghes (1967) |
Year of Election or Appointment: 2008 Deputy Treasurer |
| Mr. Deberghes also serves as an officer of other funds. He is an employee of Fidelity Investments (2008-present). Prior to joining Fidelity Investments, Mr. Deberghes was Senior Vice President of Mutual Fund Administration at State Street Corporation (2007-2008), Senior Director of Mutual Fund Administration at Investors Bank & Trust (2005-2007), and Director of Finance for Dunkin' Brands (2000-2005). |
Stephanie J. Dorsey (1969) |
Year of Election or Appointment: 2010 Assistant Treasurer |
| Ms. Dorsey also serves as an officer of other funds. She is an employee of Fidelity Investments (2008-present) and has served in other fund officer roles. Prior to joining Fidelity Investments, Ms. Dorsey served as Treasurer (2004-2008) of the JPMorgan Mutual Funds and Vice President (2004-2008) of JPMorgan Chase Bank. |
Scott C. Goebel (1968) |
Year of Election or Appointment: 2008 Secretary and Chief Legal Officer (CLO) |
| Mr. Goebel serves as Secretary and CLO of other funds. Mr. Goebel also serves as Secretary of Fidelity Investments Money Management, Inc. (FIMM) (2010-present) and Fidelity Research and Analysis Company (FRAC) (2010-present); General Counsel, Secretary, and Senior Vice President of FMR (2008-present) and FMR Co., Inc. (2008-present); Chief Legal Officer of Fidelity Management & Research (Hong Kong) Limited (2008-present) and Assistant Secretary of Fidelity Management & Research (Japan) Inc. (2008-present), and Fidelity Management & Research (U.K.) Inc. (2008-present). Previously, Mr. Goebel served as Secretary and CLO of other Fidelity funds (2008-2013), Assistant Secretary of FIMM (2008-2010), FRAC (2008-2010), and certain funds (2007-2008); and as Vice President and Secretary of Fidelity Distributors Corporation (FDC) (2005-2007). Mr. Goebel has been employed by FMR LLC or an affiliate since 2001. |
Joseph A. Hanlon (1968) |
Year of Election or Appointment: 2012 Chief Compliance Officer |
| Mr. Hanlon also serves as Chief Compliance Officer of other funds. Mr. Hanlon serves as Compliance Officer of FMR, FMR Co., Inc., Fidelity Investments Money Management, Inc. (FIMM), Fidelity Research and Analysis Company (FRAC), and Fidelity Management & Research (Hong Kong) (2009-present), as Senior Vice President of the Fidelity Asset Management Division (2009-present), and is an employee of Fidelity Investments. Previously, Mr. Hanlon served as Compliance Officer of Fidelity Management & Research (Japan) Inc. (2009-2013), Strategic Advisers, Inc. (2009-2013), and Fidelity Management & Research (U.K.) Inc. (2009-2013). |
Bruce T. Herring (1965) |
Year of Election or Appointment: 2006 Vice President of certain Equity Funds |
| Mr. Herring also serves as Vice President of other funds. He serves as Chief Investment Officer of Fidelity Global Asset Allocation (GAA) (2013-present), Chief Investment Officer and Director of Fidelity Management & Research (U.K.) Inc. (2010-present), Group Chief Investment Officer of FMR, and President of Fidelity Research & Analysis Company (2010-present). Previously, Mr. Herring served as Vice President (2005-2006) and Senior Vice President (2006-2007) of Fidelity Management & Research Company, Vice President of FMR Co., Inc. (2001-2007), and as a portfolio manager for Fidelity U.S. Equity Funds. |
Brian B. Hogan (1964) |
Year of Election or Appointment: 2009 Vice President |
| Mr. Hogan also serves as Vice President of other funds. Mr. Hogan serves as President of FMR's Equity Division (2009-present). Previously, Mr. Hogan served as Senior Vice President, Equity Research of FMR (2006-2009) and as a portfolio manager. |
Chris Maher (1972) |
Year of Election or Appointment: 2013 Assistant Treasurer |
| Mr. Maher serves as Assistant Treasurer of other funds. Mr. Maher is Vice President of Valuation Oversight and is an employee of Fidelity Investments. Previously, Mr. Maher served as Vice President of Asset Management Compliance (2013), Vice President of FMR's Program Management Group (2010-2013), and Vice President of Valuation Oversight (2008-2010). |
Christine Reynolds (1958) |
Year of Election or Appointment: 2008 Chief Financial Officer |
| Ms. Reynolds also serves as Chief Financial Officer of other funds. Ms. Reynolds became President of Fidelity Pricing and Cash Management Services (FPCMS) in August 2008. Ms. Reynolds served as Chief Operating Officer of FPCMS (2007-2008). Previously, Ms. Reynolds served as President, Treasurer, and Anti-Money Laundering officer of the Fidelity funds (2004-2007). |
Kenneth B. Robins (1969) |
Year of Election or Appointment: 2008 President and Treasurer |
| Mr. Robins also serves as an officer of other funds. Mr. Robins serves as Executive Vice President of Fidelity Investments Money Management, Inc. (FIMM) (2013-present) and is an employee of Fidelity Investments (2004-present). Previously, Mr. Robins served in other fund officer roles. |
Gary W. Ryan (1958) |
Year of Election or Appointment: 2005 Assistant Treasurer |
| Mr. Ryan also serves as Assistant Treasurer of other funds. Mr. Ryan is an employee of Fidelity Investments and has served in other fund officer roles. Previously, Mr. Ryan served as Vice President of Fund Reporting in Fidelity Pricing and Cash Management Services (FPCMS) (1999-2005). |
Stephen Sadoski (1971) |
Year of Election or Appointment: 2012 Deputy Treasurer |
| Mr. Sadoski also serves as Deputy Treasurer of other funds. He is an employee of Fidelity Investments (2012-present) and has served in another fund officer role. Prior to joining Fidelity Investments, Mr. Sadoski served as an assistant chief accountant in the Division of Investment Management of the Securities and Exchange Commission (SEC) (2009-2012) and as a senior manager at Deloitte & Touche LLP (1997-2009). |
Stacie M. Smith (1974) |
Year of Election or Appointment: 2013 Deputy Treasurer |
| Ms. Smith also serves as an officer of other funds. She is an employee of Fidelity Investments (2009-present) and has served in other fund officer roles. Prior to joining Fidelity Investments, Ms. Smith served as Senior Audit Manager of Ernst & Young LLP (1996-2009). |
Renee Stagnone (1975) |
Year of Election or Appointment: 2013 Deputy Treasurer |
| Ms. Stagnone also serves as Deputy Treasurer of other funds. Ms. Stagnone is an employee of Fidelity Investments. |
Joseph F. Zambello (1957) |
Year of Election or Appointment: 2011 Deputy Treasurer |
| Mr. Zambello also serves as Deputy Treasurer of other funds. Mr. Zambello is an employee of Fidelity Investments. Previously, Mr. Zambello served as Vice President of FMR's Program Management Group (2009-2011) and Vice President of the Transfer Agent Oversight Group (2005-2009). |
Annual Report
The Board of Trustees of Fidelity Total International Equity Fund voted to pay to shareholders of record at the opening of business on record date, the following distributions per share derived from capital gains realized from sales of portfolio securities, and dividends derived from net investment income:
| Pay Date | Record Date | Dividends | Capital Gains |
Class A | 12/09/13 | 12/06/13 | $0.103 | $0.181 |
Class T | 12/09/13 | 12/06/13 | $0.093 | $0.181 |
Class B | 12/09/13 | 12/06/13 | $0.033 | $0.181 |
Class C | 12/09/13 | 12/06/13 | $0.052 | $0.181 |
The fund hereby designates as a capital gain dividend with respect to the taxable year ended October 31, 2013, $3,356,997, or, if subsequently determined to be different, the net capital gain of such year.
Class A, Class T, Class B, and Class C designates 2% of the dividends distributed in December 2012 as indicated in the Corporate Qualifying memo distributed by the Tax department, during the fiscal year as qualifying for the dividends-received deduction for corporate shareholders.
Class A designates 41%, Class T designates 40%, Class B designates 50%, and Class C designates 47% of the dividends distributed during the fiscal year as amounts which may be taken into account as a dividend for purposes of the maximum rate under section 1(h)(11) of the Internal Revenue Code.
The amounts per share which represent income derived from sources within, and taxes paid to, foreign countries or possessions of the United States are as follows:
| Pay Date | Income | Taxes |
Class A | 12/10/2012 | 0.128 | 0.0114 |
Class T | 12/10/2012 | 0.129 | 0.0114 |
Class B | 12/10/2012 | 0.104 | 0.0114 |
Class C | 12/10/2012 | 0.111 | 0.0114 |
The fund will notify shareholders in January 2014 of amounts for use in preparing 2013 income tax returns.
Annual Report
Board Approval of Investment Advisory Contracts and Management Fees
Fidelity Total International Equity Fund
Each year, the Board of Trustees, including the Independent Trustees (together, the Board), votes on the renewal of the management contract and sub-advisory agreements (together, the Advisory Contracts) for the fund. The Board, assisted by the advice of fund counsel and Independent Trustees' counsel, requests and considers a broad range of information relevant to the renewal of the Advisory Contracts throughout the year.
The Board meets regularly and, at each of its meetings, covers an extensive agenda of topics and materials and considers factors that are relevant to its annual consideration of the renewal of the fund's Advisory Contracts, including the services and support provided to the fund and its shareholders. The Board has established various standing committees, each composed of and chaired by Independent Trustees with varying backgrounds, to which the Board has assigned specific subject matter responsibilities in order to enhance effective decision-making by the Board. The Board, acting directly and through its Committees, requests and receives information concerning the annual consideration of the renewal of the fund's Advisory Contracts. The Board also meets as needed to consider matters specifically related to the Board's annual consideration of the renewal of Advisory Contracts. Members of the Board may also meet with trustees of other Fidelity funds through ad hoc joint committees to discuss certain matters relevant to the Fidelity funds.
At its July 2013 meeting, the Board, including the Independent Trustees, unanimously determined to renew the fund's Advisory Contracts. In reaching its determination, the Board considered all factors it believed relevant, including (i) the nature, extent, and quality of the services to be provided to the fund and its shareholders (including the investment performance of the fund); (ii) the competitiveness of the fund's management fee and total expense ratio relative to peer funds; (iii) the total costs of the services to be provided by and the profits to be realized by Fidelity from its relationship with the fund; (iv) the extent to which economies of scale exist and would be realized as the fund grows; and (v) whether fee levels reflect these economies of scale, if any, for the benefit of fund shareholders.
In considering whether to renew the Advisory Contracts for the fund, the Board reached a determination, with the assistance of fund counsel and Independent Trustees' counsel and through the exercise of its business judgment, that the renewal of the Advisory Contracts was in the best interests of the fund and its shareholders and that the compensation payable under the Advisory Contracts was fair and reasonable. The Board's decision to renew the Advisory Contracts was not based on any single factor, but rather was based on a comprehensive consideration of all the information provided to the Board at its meetings throughout the year. The Board, in reaching its determination to renew the Advisory Contracts, was aware that shareholders in the fund have a broad range of investment choices available to them, including a wide choice among mutual funds offered by Fidelity's competitors, and that the fund's shareholders, who have the opportunity to review and weigh the disclosure provided by the fund in its prospectus and other public disclosures, have chosen to invest in this fund, which is a part of the Fidelity family of funds.
Annual Report
Nature, Extent, and Quality of Services Provided. The Board considered the staffing within the investment adviser, Fidelity Management & Research Company (FMR), and the sub-advisers (together, the Investment Advisers) as it relates to the fund, including the backgrounds of the fund's investment personnel, and also considered the fund's investment objective, strategies, and related investment philosophy. The Independent Trustees also had discussions with senior management of Fidelity's investment operations and investment groups. The Board considered the structure of the portfolio manager compensation program and whether this structure provides appropriate incentives to act in the best interests of the fund.
Resources Dedicated to Investment Management and Support Services. The Board and the Fund Oversight and Research Committees reviewed the general qualifications and capabilities of the Investment Advisers' investment staff, including its size, education, experience, and resources, as well as the Investment Advisers' approach to recruiting, training, managing, and compensating investment personnel. The Board noted that FMR has continued to increase the resources devoted to non-U.S. offices, including expansion of Fidelity's global investment organization. The Board also noted that Fidelity's analysts have extensive resources, tools and capabilities that allow them to conduct sophisticated quantitative and fundamental analysis, as well as credit analysis of issuers, counterparties and guarantors. Further, the Board believes that Fidelity's investment professionals have sufficient access to global information and data so as to provide competitive investment results over time, and that those professionals also have access to sophisticated tools that permit them to assess portfolio construction and risk and performance attribution characteristics continuously, as well as to transmit new information and research conclusions rapidly around the world. Additionally, in its deliberations, the Board considered the Investment Advisers' trading and risk management capabilities and resources, which are an integral part of the investment management process.
Shareholder and Administrative Services. The Board considered (i) the nature, extent, quality, and cost of advisory, administrative, and shareholder services performed by the Investment Advisers and their affiliates under the Advisory Contracts and under separate agreements covering transfer agency, pricing and bookkeeping, and securities lending services for the fund; (ii) the nature and extent of the supervision of third party service providers, principally custodians and subcustodians; and (iii) the resources devoted to, and the record of compliance with, the fund's compliance policies and procedures. The Board also reviewed the allocation of fund brokerage, including allocations to brokers affiliated with the Investment Advisers, the use of brokerage commissions to pay fund expenses, and the use of "soft" commission dollars to pay for research services.
Annual Report
Board Approval of Investment Advisory Contracts and
Management Fees - continued
The Board noted that the growth of fund assets over time across the complex allows Fidelity to reinvest in the development of services designed to enhance the value or convenience of the Fidelity funds as investment vehicles. These services include 24-hour access to account information and market information through telephone representatives and over the Internet, investor education materials and asset allocation tools, and the expanded availability of Fidelity Investor Centers.
Investment in a Large Fund Family. The Board considered the benefits to shareholders of investing in a Fidelity fund, including the benefits of investing in a fund that is part of a large family of funds offering a variety of investment disciplines and providing a large variety of mutual fund investor services. The Board noted that Fidelity had taken, or had made recommendations that resulted in the Fidelity funds taking, a number of actions over the previous year that benefited particular funds, including (i) continuing to dedicate additional resources to investment research and to the support of the senior management team that oversees asset management; (ii) persisting in efforts to enhance Fidelity's global research capabilities; (iii) launching new funds and making other enhancements to meet client needs for global and income-oriented solutions; (iv) continuing to launch dedicated lower cost underlying funds to meet portfolio construction needs related to expanding underlying fund options for Fidelity funds of funds, specifically for the Freedom Fund product lines; (v) rationalizing product lines and gaining increased efficiencies through the mergers of several funds into other funds; (vi) strengthening Fidelity's index fund offerings by reducing investment minimums and adopting or lowering existing expense caps for certain funds and classes; (vii) enhancing Global Asset Allocation product offerings by launching new funds and strategies, including "open architecture" target date funds that utilize affiliated and unaffiliated sub-advisers; (viii) modifying the eligibility criteria for Institutional Class shares of Advisor funds to increase their marketability to a portion of the defined contribution plan market; (ix) creating a new low-cost retirement share class for certain Advisor funds to appeal to large retirement plans; (x) transitioning the management of certain Fidelity commodity funds to Geode Capital Management LLC, a registered commodity pool operator, while retaining administrative responsibilities for the funds; (xi) reorganizing a number of funds; and (xii) taking steps toward establishing a new Fidelity adviser to manage sector-based funds and products.
Investment Performance. The Board considered whether the fund has operated in accordance with its investment objective, as well as its record of compliance with its investment restrictions and its performance history.
The Board took into account discussions with the Investment Advisers about fund investment performance that occur at Board meetings throughout the year. In this regard the Board noted that as part of regularly scheduled fund reviews and other reports to the Board on fund performance, the Board periodically considers annualized return information for the fund, for different time periods, measured against a securities market index ("benchmark index") and a peer group of mutual funds with similar objectives ("peer group"). In its evaluation of fund investment performance, the Board gave particular attention to information indicating changes in performance of certain Fidelity funds for specific time periods, and the Investment Advisers' explanations for any overperformance or underperformance.
Annual Report
In addition to reviewing absolute and relative fund performance, the Independent Trustees periodically consider the appropriateness of fund performance metrics in evaluating the results achieved. In general, the Independent Trustees believe that fund performance should be evaluated based on net performance (after fees and expenses) of both the highest performing and lowest performing classes, where applicable, compared to appropriate benchmark indices, over appropriate time periods which may include full market cycles, and compared to peer groups, as applicable, over the same periods, taking into account relevant factors including the following: general market conditions; issuer-specific information; tactical opportunities for investment; and fund cash flows and other factors.
The Independent Trustees recognize that shareholders evaluate performance on a net basis over their own holding periods, for which one-, three-, and five-year periods are used as a proxy. For this reason, the performance information reviewed by the Board also included net cumulative calendar year total return information for the fund and an appropriate benchmark index and peer group for the most recent one-, three-, and five-year periods, as shown below. Returns are shown compared to the 25th percentile (top of box) and 75th percentile (bottom of box) of the peer universe. Returns of the benchmark index are "net MA," i.e., adjusted for tax withholding rates applicable to U.S.-based mutual funds organized as Massachusetts business trusts.
Annual Report
Board Approval of Investment Advisory Contracts and
Management Fees - continued
Fidelity Total International Equity Fund

The Board also considered that the fund's management fee is subject to upward or downward adjustment depending upon whether, and to what extent, the fund's investment performance for the performance period exceeds, or is exceeded by, a securities index, thus leading to a performance adjustment for the same period. The Board noted that the performance adjustment provides FMR with a strong economic incentive to seek to achieve superior performance for the fund's shareholders and helps to more closely align the interests of FMR and the fund's shareholders.
Based on its review, the Board concluded that the nature, extent, and quality of services provided to the fund under the Advisory Contracts should benefit the fund's shareholders.
Competitiveness of Management Fee and Total Expense Ratio. The Board considered the fund's management fee and total expense ratio compared to "mapped groups" of competitive funds and classes. Fidelity creates "mapped groups" by combining similar Lipper investment objective categories that have comparable management fee characteristics. Combining Lipper investment objective categories aids the Board's management fee and total expense ratio comparisons by broadening the competitive group used for comparison and by reducing the number of universes to which various Fidelity funds are compared.
Management Fee. The Board considered two proprietary management fee comparisons for the 12-month periods shown in the chart below. The group of Lipper funds used by the Board for management fee comparisons is referred to below as the "Total Mapped Group." The Total Mapped Group comparison focuses on a fund's standing in terms of gross management fees before expense reimbursements or caps, and without giving effect to the fund's performance adjustment, relative to the total universe of funds with comparable investment mandates, regardless of whether their management fee structures also are comparable. Funds with comparable investment mandates offer exposure to similar types of securities. Funds with comparable management fee structures have similar management fee contractual arrangements (e.g., flat rate charged for advisory services, all-inclusive fee rate, etc.). "TMG %" represents the percentage of funds in the Total Mapped Group that had management fees that were lower than the fund's. For example, a TMG % of 16% means that 84% of the funds in the Total Mapped Group had higher management fees than the fund. The "Asset-Size Peer Group" (ASPG) comparison focuses on a fund's standing relative to a subset of non-Fidelity funds within the Total Mapped Group that are similar in size and management fee structure. The ASPG represents at least 15% of the funds in the Total Mapped Group with comparable asset size and management fee structures, subject to a minimum of 50 funds (or all funds in the Total Mapped Group if fewer than 50). Additional information, such as the ASPG quartile in which the fund's management fee ranked and the impact of the fund's performance adjustment, is also included in the chart and considered by the Board.
Annual Report
Fidelity Total International Equity Fund

The Board noted that the fund's management fee ranked below the median of its Total Mapped Group and below the median of its ASPG for 2012. The Board also noted the effect of the fund's positive performance adjustment on the fund's management fee ranking.
Annual Report
Board Approval of Investment Advisory Contracts and
Management Fees - continued
Based on its review, the Board concluded that the fund's management fee is fair and reasonable in light of the services that the fund receives and the other factors considered.
Total Expense Ratio. In its review of each class's total expense ratio, the Board considered the fund's management fee as well as other fund or class expenses, as applicable, such as transfer agent fees, pricing and bookkeeping fees, fund-paid 12b-1 fees, and custodial, legal, and audit fees. The Board also noted the effects of any waivers and reimbursements on fees and expenses, as well as the impact of the fund's performance adjustment. As part of its review, the Board also considered the current and historical total expense ratios of each class of the fund compared to competitive fund median expenses. Each class of the fund is compared to those funds and classes in the Total Mapped Group (used by the Board for management fee comparisons) that have a similar sales load structure.
The Board noted that the total expense ratio of each of Class A and the retail class ranked below its competitive median for 2012 and the total expense ratio of each of Class T, Class B, Class C, and Institutional Class ranked above its competitive median for 2012. The Board considered that, in general, various factors can affect total expense ratios. The Board noted that the total expense ratio of Class T was above the competitive median primarily because of higher 12b-1 fees on Class T. Class T has a higher 12b-1 fee, but a lower front-end sales charge, than traditionally priced front-end sales charge classes. The Board considered that Class T is primarily sold load-waived in the retirement plan market where its 0.50% 12b-1 fee is comparable to competing no-load, higher 12b-1 fee classes designed specifically for retirement plans. The Board noted that the fund offers multiple classes, each of which has a different sales load and 12b-1 fee structure, and that the multiple structures are intended to offer a range of pricing options for the intermediary market. The Board also noted that the total expense ratios of the classes vary primarily by the level of their 12b-1 fees, although differences in transfer agent fees may also cause expenses to vary from class to class.
The Board further considered that FMR contractually agreed to reimburse Class A, Class T, Class B, Class C, Institutional Class, and the retail class of the fund to the extent that total operating expenses (excluding interest, taxes, certain securities lending costs, brokerage commissions, extraordinary expenses, and acquired fund fees and expenses, if any), as a percentage of their respective average net assets, exceed 1.45%, 1.70%, 2.20%, 2.20%, 1.20%, and 1.20% through December 31, 2013.
Fees Charged to Other Fidelity Clients. The Board also considered Fidelity fee structures and other information with respect to clients of FMR and its affiliates, such as other mutual funds advised or subadvised by FMR or its affiliates, pension plan clients, and other institutional clients. The Board noted the findings of the 2013 ad hoc joint committee (created with the board of other Fidelity funds), which reviewed and compared Fidelity's institutional investment advisory business with its business of providing services to the Fidelity funds, including the differences in services provided, fees charged, and costs incurred, as well as competition in their respective marketplaces.
Annual Report
Based on its review of total expense ratios and fees charged to other Fidelity clients, the Board concluded that the total expense ratio of each class of the fund was reasonable, although in some cases above the median of the universe presented for comparison, in light of the services that the fund and its shareholders receive and the other factors considered.
Costs of the Services and Profitability. The Board considered the revenues earned and the expenses incurred by Fidelity in conducting the business of developing, marketing, distributing, managing, administering and servicing the fund and servicing the fund's shareholders. The Board also considered the level of Fidelity's profits in respect of all the Fidelity funds.
On an annual basis, FMR presents to the Board Fidelity's profitability for the fund. Fidelity calculates the profitability for each fund, as well as aggregate profitability for groups of Fidelity funds and all Fidelity funds, using a series of detailed revenue and cost allocation methodologies which originate with the books and records of Fidelity on which Fidelity's audited financial statements are based. The Audit Committee of the Board reviews any significant changes from the prior year's methodologies.
PricewaterhouseCoopers LLP (PwC), independent registered public accounting firm and auditor to Fidelity and certain Fidelity funds, has been engaged annually by the Board as part of the Board's assessment of Fidelity's profitability analysis. PwC's engagement includes the review and assessment of the methodologies used by Fidelity in determining the revenues and expenses attributable to Fidelity's mutual fund business, and completion of agreed-upon procedures surrounding the mathematical accuracy of fund profitability and its conformity to allocation methodologies. After considering PwC's reports issued under the engagement and information provided by Fidelity, the Board concluded that while other allocation methods may also be reasonable, Fidelity's profitability methodologies are reasonable in all material respects.
The Board also reviewed Fidelity's non-fund businesses and fall-out benefits related to the mutual fund business as well as cases where Fidelity's affiliates may benefit from or be related to the fund's business.
The Board considered the costs of the services provided by and the profits realized by Fidelity in connection with the operation of the fund and was satisfied that the profitability was not excessive in the circumstances.
Economies of Scale. The Board considered whether there have been economies of scale in respect of the management of the Fidelity funds, whether the Fidelity funds (including the fund) have appropriately benefited from any such economies of scale, and whether there is potential for realization of any further economies of scale. The Board considered the extent to which the fund will benefit from economies of scale through increased services to the fund, through waivers or reimbursements, or through fee or expense reductions. The Board also noted that in 2009, it and the board of other Fidelity funds created an ad hoc committee (the Economies of Scale Committee) to analyze whether FMR attains economies of scale in respect of the management and servicing of the Fidelity funds, whether the Fidelity funds have appropriately benefited from such economies of scale, and whether there is potential for realization of any further economies of scale.
Annual Report
Board Approval of Investment Advisory Contracts and
Management Fees - continued
The Board recognized that the fund's management contract incorporates a "group fee" structure, which provides for lower group fee rates as total fund assets under FMR's management increase, and for higher group fee rates as total fund assets under FMR's management decrease. FMR calculates the group fee rates based on a tiered asset "breakpoint" schedule that varies based on asset class. The Board considered that the group fee is designed to deliver the benefits of economies of scale to fund shareholders when total Fidelity fund assets increase, even if assets of any particular fund are unchanged or have declined, because some portion of Fidelity's costs are attributable to services provided to all Fidelity funds, and all funds benefit if those costs can be allocated among more assets. The Board concluded that, given the group fee structure, fund shareholders will benefit from lower management fees as assets under FMR's management increase at the fund complex level, regardless of whether Fidelity achieves any such economies of scale.
The Board concluded, taking into account the analysis of the Economies of Scale Committee, that economies of scale, if any, are being appropriately shared between fund shareholders and Fidelity.
Amendment to Description of Group Fee Rate. At its July 2013 meeting, the Board voted to approve an amendment to the fund's management contract to modify the description of the "group fee rate" effective August 1, 2013. The Board noted that under the prior description in the contract, the group fee rate was based on the average net assets of all registered investment companies with which FMR has management contracts. Under the contract's tiered asset breakpoint schedule, the group fee rate is lower as total fund assets under FMR's management increase, and higher as total fund assets under FMR's management decrease. The Board considered that the prior description would have excluded the assets of 64 Fidelity sector funds from the group fee rate calculation once Fidelity SelectCo, LLC, an affiliate of FMR, assumed management responsibilities for those funds. The Board noted that modifying the description of the group fee rate to continue to include the assets of those 64 funds for purposes of determining group fee rate breakpoints would avoid an immediate adverse impact on the group fee rate for any fund.
Annual Report
Additional Information Requested by the Board. In order to develop fully the factual basis for consideration of the Fidelity funds' Advisory Contracts, the Board requested and received additional information on certain topics, including: (i) fund performance trends and Fidelity's long-term strategies for certain funds; (ii) the potential to further rationalize the Fidelity fund lineup with the possibility of achieving savings for the funds and Fidelity; (iii) the methodology with respect to competitive fund data and peer group classifications; (iv) the arrangements with, and performance of, certain sub-advisers on behalf of the Fidelity funds, as well as certain proposed participating affiliate arrangements; (v) the realization of fall-out benefits in certain Fidelity business units; (vi) Fidelity's group fee structures, including the rationale for the individual fee rates of certain categories of funds and the definition of group assets; (vii) trends regarding industry use of performance fee structures and the performance adjustment methodologies applicable to the Fidelity funds; (viii) additional competitive analysis regarding the total expenses for certain classes; and (ix) fund profitability methodology, including Fidelity's cost allocation methodology, and the impact of certain factors on fund profitability results.
Based on its evaluation of all of the conclusions noted above, and after considering all factors it believed relevant, the Board ultimately concluded that the advisory fee structures are fair and reasonable, and that the fund's Advisory Contracts should be renewed.
Annual Report
Investment Adviser
Fidelity Management & Research Company
Boston, MA
Investment Sub-Advisers
FMR Co., Inc.
Fidelity Management & Research
(U.K.) Inc.
Fidelity Management & Research
(Hong Kong) Limited
Fidelity Management & Research
(Japan) Inc.
FIL Investment Advisors
FIL Investments (Japan) Limited
FIL Investment Advisors
(U.K.) Limited
General Distributor
Fidelity Distributors Corporation
Smithfield, RI
Transfer and Service Agents
Fidelity Investments Institutional Operations Company, Inc.
Boston, MA
Fidelity Service Company, Inc.
Boston, MA
Custodian
State Street Bank & Trust Company
Quincy, MA
(Fidelity Investment logo)(registered trademark)
ATIE-UANN-1213
1.853363.105
(Fidelity Investment logo)(registered trademark)
Fidelity Advisor®
Total International Equity
Fund - Institutional Class
Annual Report
October 31, 2013
(Fidelity Cover Art)
Institutional Class is
a class of Fidelity®
Total International Equity Fund
Contents
Performance | (Click Here) | How the fund has done over time. |
Management's Discussion of Fund Performance | (Click Here) | The Portfolio Manager's review of fund performance and strategy. |
Shareholder Expense Example | (Click Here) | An example of shareholder expenses. |
Investment Changes | (Click Here) | A summary of major shifts in the fund's investments over the past six months. |
Investments | (Click Here) | A complete list of the fund's investments with their market values. |
Financial Statements | (Click Here) | Statements of assets and liabilities, operations, and changes in net assets, as well as financial highlights. |
Notes | (Click Here) | Notes to the financial statements. |
Report of Independent Registered Public Accounting Firm | (Click Here) | |
Trustees and Officers | (Click Here) | |
Distributions | (Click Here) | |
Board Approval of Investment Advisory Contracts and Management Fees | (Click Here) | |
To view a fund's proxy voting guidelines and proxy voting record for the 12-month period ended June 30, visit http://www.fidelity.com/proxyvotingresults or visit the Securities and Exchange Commission's (SEC) web site at http://www.sec.gov. You may also call 1-877-208-0098 to request a free copy of the proxy voting guidelines.
Standard & Poor's, S&P and S&P 500 are registered service marks of The McGraw-Hill Companies, Inc. and have been licensed for use by Fidelity Distributors Corporation.
Other third-party marks appearing herein are the property of their respective owners.
All other marks appearing herein are registered or unregistered trademarks or service marks of FMR LLC or an affiliated company. © 2013 FMR LLC. All rights reserved.
Annual Report
This report and the financial statements contained herein are submitted for the general information of the shareholders of the fund. This report is not authorized for distribution to prospective investors in the fund unless preceded or accompanied by an effective prospectus.
A fund files its complete schedule of portfolio holdings with the SEC for the first and third quarters of each fiscal year on Form N-Q. Forms N-Q are available on the SEC's web site at http://www.sec.gov. A fund's Forms N-Q may be reviewed and copied at the SEC's Public Reference Room in Washington, DC. Information regarding the operation of the SEC's Public Reference Room may be obtained by calling 1-800-SEC-0330. For a complete list of a fund's portfolio holdings, view the most recent holdings listing, semiannual report, or annual report on Fidelity's web site at http://www.fidelity.com, http://www.advisor.fidelity.com, or http://www.401k.com, as applicable.
NOT FDIC INSURED • MAY LOSE VALUE • NO BANK GUARANTEE
Neither the fund nor Fidelity Distributors Corporation is a bank.
Annual Report
Average annual total return reflects the change in the value of an investment, assuming reinvestment of the class' distributions from dividend income and capital gains (the profits earned upon the sale of securities that have grown in value, if any) and assuming a constant rate of performance each year. The $10,000 table and the fund's returns do not reflect the deduction of taxes that a shareholder would pay on fund distributions or the redemption of fund shares. During periods of reimbursement by Fidelity, a fund's total return will be greater than it would be had the reimbursement not occurred. How a fund did yesterday is no guarantee of how it will do tomorrow.
Average Annual Total Returns
Periods ended October 31, 2013 | Past 1
year | Past 5
years | Life of
fund A |
Institutional Class | 19.40% | 13.86% | -1.03% |
A From November 1, 2007.
$10,000 Over Life of Fund
Let's say hypothetically that $10,000 was invested in Fidelity Advisor® Total International Equity Fund - Institutional Class on November 1, 2007, when the fund started. The chart shows how the value of your investment would have changed, and also shows how the MSCI® ACWI® (All Country World Index) ex USA Index performed over the same period.
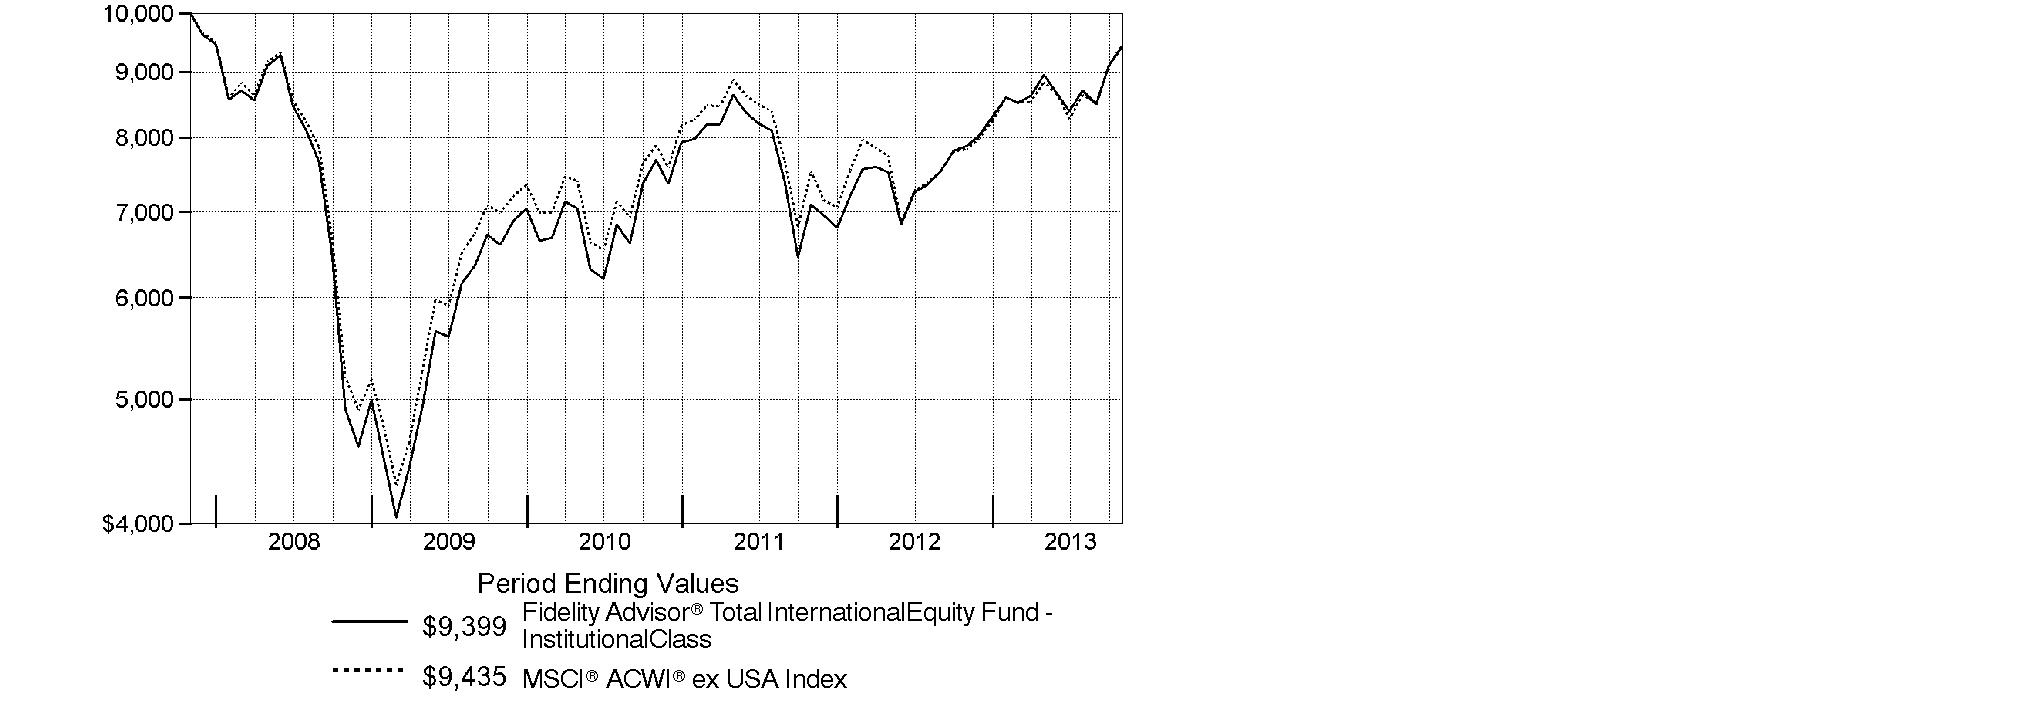
Annual Report
Market Recap: On balance, global equity markets remained upbeat for the 12-month period ending October 31, 2013. The MSCI® ACWI® (All Country World Index) Index gained 23.75% for the period, amid investor preference for higher-risk assets. The period was not without turbulence, however. In the spring and summer, central banks worldwide, especially in the U.S. and China, made clear their intentions to maintain accommodative monetary policies. That stance, combined with modest cyclical improvements around the globe and generally low valuations, underpinned the broad rally in equities. Europe (+32%) shone brightly, with most markets in the region - large and small - registering solid, index-beating gains. Another bright spot was Japan, which, despite a struggling yen and taking a second-half breather, posted a 34% result for the full year. The U.S. - by far the index's biggest constituent - also outperformed the global market with a roughly 28% advance. Meanwhile, Asia-Pacific ex Japan (+14%) lagged, hurt in part by a slowdown in Australia's mining industry as well as currency headwinds. Foreign-exchange and commodity weakness also curbed results in resource-heavy Canada and emerging markets (EM), both of which were up 7%. Country-level EM performance diverged meaningfully for the period, as evidenced by performance in Brazil (-1%), Russia (+12%), India (+1%) and China (+8%).
Comments from Jed Weiss, Co-Portfolio Manager of Fidelity Advisor® Total International Equity Fund: For the year, the fund's Institutional Class shares gained 19.40%, trailing the 20.42% advance the MSCI® ACWI® (All Country World Index) ex USA Index. On a relative basis, the fund was hurt the most by disappointing stock selection in Europe ex U.K. On the positive side, the fund's investments in U.S.-based companies proved helpful, as did a big underweighting in poor-performing Canada. On an individual basis, the biggest relative detractor was Japanese automaker Toyota Motor, a strong-performing benchmark component we mostly avoided. Instead, we opted to hold DENSO, a Japanese auto-parts supplier, and its relative contribution offset some of the negative impact from our Toyota underweighting. Several of the fund's notable detractors were emerging-markets stocks, including South Africa-based gold miner AngloGold Ashanti - which we sold in May - and China Food, an out-of-index bottler of Coca-Cola beverages in China, as well as a distributor of wine. On the positive side, Dutch semiconductor company ASML Holding, a dominant player in the market for lithography, was a strong relative contributor, as was Sands China, a Hong Kong-listed casino operator.
The views expressed above reflect those of the portfolio manager(s) only through the end of the period as stated on the cover of this report and do not necessarily represent the views of Fidelity or any other person in the Fidelity organization. Any such views are subject to change at any time based upon market or other conditions and Fidelity disclaims any responsibility to update such views. These views may not be relied on as investment advice and, because investment decisions for a Fidelity fund are based on numerous factors, may not be relied on as an indication of trading intent on behalf of any Fidelity fund.
Annual Report
Shareholder Expense Example
As a shareholder of the Fund, you incur two types of costs: (1) transaction costs, including sales charges (loads) on purchase payments or redemption proceeds, redemption fees and (2) ongoing costs, including management fees, distribution and/or service (12b-1) fees and other Fund expenses. This Example is intended to help you understand your ongoing costs (in dollars) of investing in the Fund and to compare these costs with the ongoing costs of investing in other mutual funds.
The Example is based on an investment of $1,000 invested at the beginning of the period and held for the entire period (May 1, 2013 to October 31, 2013).
Actual Expenses
The first line of the accompanying table for each class of the Fund provides information about actual account values and actual expenses. You may use the information in this line, together with the amount you invested, to estimate the expenses that you paid over the period. Simply divide your account value by $1,000.00 (for example, an $8,600 account value divided by $1,000.00 = 8.6), then multiply the result by the number in the first line for a class of the Fund under the heading entitled "Expenses Paid During Period" to estimate the expenses you paid on your account during this period. A small balance maintenance fee of $12.00 that is charged once a year may apply for certain accounts with a value of less than $2,000. This fee is not included in the table below. If it was, the estimate of expenses you paid during the period would be higher, and your ending account value lower, by this amount. In addition, the Fund, as a shareholder in the underlying Fidelity Central Funds, will indirectly bear its pro-rata share of the fees and expenses incurred by the underlying Fidelity Central Funds. These fees and expenses are not included in the Fund's annualized expense ratio used to calculate the expense estimate in the table below.
Hypothetical Example for Comparison Purposes
The second line of the accompanying table for each class of the Fund provides information about hypothetical account values and hypothetical expenses based on a Class' actual expense ratio and an assumed rate of return of 5% per year before expenses, which is not the Class' actual return. The hypothetical account values and expenses may not be used to estimate the actual ending account balance or expenses you paid for the period. You may use this information to compare the ongoing costs of investing in the Fund and other funds. To do so, compare this 5% hypothetical example with the 5% hypothetical examples that appear in the shareholder reports of the other funds. A small balance maintenance fee of $12.00 that is charged once a year may apply for certain accounts with a value of less than $2,000. This fee is not included in the table below. If it was, the estimate of expenses you paid during the period would be higher, and your ending account value lower, by this amount. In addition, the Fund, as a shareholder in the underlying Fidelity Central Funds, will indirectly bear its pro-rata share of the fees and expenses incurred by the underlying Fidelity Central Funds. These fees and expenses are not included in the Fund's annualized expense ratio used to calculate the expense estimate in the table below.
Please note that the expenses shown in the table are meant to highlight your ongoing costs only and do not reflect any transaction costs. Therefore, the second line of the table is useful in comparing ongoing costs only, and will not help you determine the relative total costs of owning different funds. In addition, if these transactional costs were included, your costs would have been higher.
Annual Report
Shareholder Expense Example - continued
| Annualized
Expense RatioB | Beginning
Account Value
May 1, 2013 | Ending
Account Value
October 31, 2013 | Expenses Paid
During Period*
May 1, 2013
to October 31, 2013 |
Class A | 1.45% | | | |
Actual | | $ 1,000.00 | $ 1,048.20 | $ 7.49 |
HypotheticalA | | $ 1,000.00 | $ 1,017.90 | $ 7.38 |
Class T | 1.70% | | | |
Actual | | $ 1,000.00 | $ 1,047.90 | $ 8.78 |
HypotheticalA | | $ 1,000.00 | $ 1,016.64 | $ 8.64 |
Class B | 2.19% | | | |
Actual | | $ 1,000.00 | $ 1,044.00 | $ 11.28 |
HypotheticalA | | $ 1,000.00 | $ 1,014.17 | $ 11.12 |
Class C | 2.20% | | | |
Actual | | $ 1,000.00 | $ 1,045.50 | $ 11.34 |
HypotheticalA | | $ 1,000.00 | $ 1,014.12 | $ 11.17 |
Total International Equity | 1.10% | | | |
Actual | | $ 1,000.00 | $ 1,050.70 | $ 5.69 |
HypotheticalA | | $ 1,000.00 | $ 1,019.66 | $ 5.60 |
Institutional Class | 1.20% | | | |
Actual | | $ 1,000.00 | $ 1,050.90 | $ 6.20 |
HypotheticalA | | $ 1,000.00 | $ 1,019.16 | $ 6.11 |
A 5% return per year before expenses
B Annualized expense ratio reflects expenses net of applicable fee waivers.
* Expenses are equal to each Class' annualized expense ratio, multiplied by the average account value over the period, multiplied by 184/365 (to reflect the one-half year period).
Annual Report
Investment Changes (Unaudited)
Geographic Diversification (% of fund's net assets) |
As of October 31, 2013 |
 | United Kingdom 16.7% | |
 | Japan 14.4% | |
 | United States of America* 7.3% | |
 | France 7.1% | |
 | Switzerland 6.8% | |
 | Germany 5.2% | |
 | Australia 3.8% | |
 | India 3.0% | |
 | Korea (South) 2.7% | |
 | Other 33.0% | |

Percentages are based on country or territory of incorporation and are adjusted for the effect of futures contracts, if applicable. |
* Includes Short-Term Investments and Net Other Assets (Liabilities) |
As of April 30, 2013 |
| United Kingdom 17.0% | |
| Japan 12.6% | |
| United States of America* 7.8% | |
| Switzerland 6.9% | |
| Germany 4.6% | |
| Australia 4.5% | |
| France 4.3% | |
| Taiwan 3.9% | |
| India 3.1% | |
| Other 35.3% | |

Percentages are based on country or territory of incorporation and are adjusted for the effect of futures contracts, if applicable. |
* Includes Short-Term Investments and Net Other Assets (Liabilities) |
Asset Allocation as of October 31, 2013 |
| % of fund's
net assets | % of fund's net assets
6 months ago |
Stocks | 98.4 | 97.7 |
Short-Term Investments and Net Other Assets (Liabilities) | 1.6 | 2.3 |
Top Ten Stocks as of October 31, 2013 |
| % of fund's
net assets | % of fund's net assets
6 months ago |
Nestle SA (Switzerland, Food Products) | 1.6 | 1.9 |
Roche Holding AG (participation certificate) (Switzerland, Pharmaceuticals) | 1.5 | 1.3 |
Sanofi SA (France, Pharmaceuticals) | 1.5 | 1.6 |
Anheuser-Busch InBev SA NV (Belgium, Beverages) | 1.4 | 1.2 |
HSBC Holdings PLC sponsored ADR (United Kingdom, Commercial Banks) | 1.3 | 1.4 |
Total SA (France, Oil, Gas & Consumable Fuels) | 1.3 | 0.0 |
UBS AG (NY Shares) (Switzerland, Capital Markets) | 1.3 | 1.0 |
DENSO Corp. (Japan, Auto Components) | 1.2 | 1.1 |
Vodafone Group PLC sponsored ADR (United Kingdom, Wireless Telecommunication Services) | 1.2 | 1.2 |
Novartis AG (Switzerland, Pharmaceuticals) | 1.1 | 1.1 |
| 13.4 | |
Market Sectors as of October 31, 2013 |
| % of fund's
net assets | % of fund's net assets
6 months ago |
Financials | 24.3 | 22.5 |
Consumer Staples | 13.8 | 14.8 |
Consumer Discretionary | 13.2 | 11.9 |
Industrials | 12.9 | 12.6 |
Health Care | 9.3 | 9.3 |
Materials | 6.3 | 7.6 |
Telecommunication Services | 5.9 | 4.4 |
Information Technology | 5.9 | 6.3 |
Energy | 4.5 | 5.1 |
Utilities | 2.3 | 3.2 |
Annual Report
Investments October 31, 2013
Showing Percentage of Net Assets
Common Stocks - 97.6% |
| Shares | | Value |
Australia - 3.8% |
Ansell Ltd. | 31,550 | | $ 581,182 |
Australia & New Zealand Banking Group Ltd. | 89,158 | | 2,851,618 |
Coca-Cola Amatil Ltd. | 85,155 | | 1,038,247 |
CSL Ltd. | 33,066 | | 2,172,037 |
Imdex Ltd. | 41,667 | | 28,355 |
Ramsay Health Care Ltd. | 2,307 | | 84,602 |
RCG Corp. Ltd. | 60,000 | | 41,965 |
Sydney Airport unit | 173,635 | | 687,626 |
Telstra Corp. Ltd. | 217,906 | | 1,066,841 |
Transurban Group unit | 170,303 | | 1,142,829 |
Westfield Group unit | 64,761 | | 662,280 |
Westpac Banking Corp. | 89,139 | | 2,888,923 |
TOTAL AUSTRALIA | | 13,246,505 |
Austria - 0.5% |
Andritz AG | 24,961 | | 1,537,626 |
Zumtobel AG | 3,700 | | 66,137 |
TOTAL AUSTRIA | | 1,603,763 |
Bailiwick of Guernsey - 0.0% |
Resolution Ltd. | 28,414 | | 162,828 |
Bailiwick of Jersey - 0.6% |
Informa PLC | 157,001 | | 1,408,460 |
Wolseley PLC | 12,400 | | 668,239 |
TOTAL BAILIWICK OF JERSEY | | 2,076,699 |
Belgium - 2.3% |
Anheuser-Busch InBev SA NV | 47,671 | | 4,941,754 |
Gimv NV | 1,919 | | 97,186 |
KBC Ancora (a) | 3,381 | | 110,127 |
KBC Groupe SA | 29,097 | | 1,586,184 |
UCB SA | 7,688 | | 505,426 |
Umicore SA | 17,794 | | 848,855 |
TOTAL BELGIUM | | 8,089,532 |
Bermuda - 1.9% |
China Foods Ltd. | 1,106,000 | | 502,144 |
Credicorp Ltd. | 7,500 | | 1,024,500 |
Dairy Farm International Holdings Ltd. | 45,900 | | 520,047 |
Hongkong Land Holdings Ltd. | 87,000 | | 535,920 |
Lazard Ltd. Class A | 15,900 | | 614,535 |
Li & Fung Ltd. | 342,000 | | 483,467 |
Common Stocks - continued |
| Shares | | Value |
Bermuda - continued |
Shangri-La Asia Ltd. | 414,000 | | $ 758,261 |
Texwinca Holdings Ltd. | 806,000 | | 824,401 |
Trinity Ltd. | 930,000 | | 347,865 |
Yue Yuen Industrial (Holdings) Ltd. | 339,000 | | 931,343 |
TOTAL BERMUDA | | 6,542,483 |
Brazil - 2.2% |
Arezzo Industria e Comercio SA | 2,500 | | 37,385 |
Banco Bradesco SA | 77,610 | | 1,244,074 |
BM&F Bovespa SA | 150,900 | | 850,758 |
BTG Pactual Participations Ltd. unit | 47,700 | | 638,143 |
Companhia de Bebidas das Americas (AmBev) | 300 | | 11,175 |
Fleury SA | 67,700 | | 524,326 |
Hypermarcas SA | 84,400 | | 736,550 |
Iguatemi Empresa de Shopping Centers SA | 50,500 | | 580,473 |
Souza Cruz SA | 61,400 | | 664,102 |
Telefonica Brasil SA | 28,500 | | 561,553 |
Terna Participacoes SA unit | 51,600 | | 500,982 |
Tractebel Energia SA | 46,900 | | 797,648 |
Weg SA | 48,000 | | 623,516 |
TOTAL BRAZIL | | 7,770,685 |
British Virgin Islands - 0.0% |
Gem Diamonds Ltd. (a) | 18,923 | | 48,394 |
Canada - 0.1% |
Pason Systems, Inc. | 6,400 | | 133,015 |
ShawCor Ltd. Class A | 1,500 | | 63,056 |
TAG Oil Ltd. (a)(c) | 9,800 | | 39,852 |
TOTAL CANADA | | 235,923 |
Cayman Islands - 1.6% |
Ginko International Co. Ltd. | 20,000 | | 381,179 |
Gourmet Master Co. Ltd. | 96,000 | | 639,239 |
Hengan International Group Co. Ltd. | 50,000 | | 612,344 |
Lifestyle International Holdings Ltd. | 51,000 | | 111,170 |
Sands China Ltd. | 281,400 | | 1,999,889 |
SITC International Holdings Co. Ltd. | 1,087,000 | | 459,868 |
Wynn Macau Ltd. | 355,200 | | 1,362,982 |
TOTAL CAYMAN ISLANDS | | 5,566,671 |
Chile - 1.5% |
Cencosud SA | 175,326 | | 715,303 |
Common Stocks - continued |
| Shares | | Value |
Chile - continued |
Compania Cervecerias Unidas SA sponsored ADR | 35,855 | | $ 956,970 |
Embotelladora Andina SA sponsored ADR | 18,000 | | 615,600 |
Empresa Nacional de Telecomunicaciones SA (ENTEL) | 46,696 | | 718,603 |
Inversiones Aguas Metropolitanas SA | 254,947 | | 472,815 |
Parque Arauco SA | 285,766 | | 551,728 |
Quinenco SA | 275,436 | | 736,647 |
Quinenco SA rights 11/5/13 (a) | 65,950 | | 25,749 |
Sociedad Matriz SAAM SA | 5,792,804 | | 582,277 |
TOTAL CHILE | | 5,375,692 |
China - 0.7% |
China Communications Services Corp. Ltd. (H Shares) | 790,000 | | 484,006 |
China Pacific Insurance Group Co. Ltd. (H Shares) | 185,800 | | 671,018 |
China Telecom Corp. Ltd. (H Shares) | 1,202,000 | | 627,871 |
Shandong Weigao Medical Polymer Co. Ltd. (H Shares) | 536,000 | | 503,299 |
TOTAL CHINA | | 2,286,194 |
Denmark - 0.9% |
A.P. Moller - Maersk A/S Series B | 81 | | 783,716 |
Jyske Bank A/S (Reg.) (a) | 1,654 | | 93,370 |
Novo Nordisk A/S Series B sponsored ADR | 14,000 | | 2,333,380 |
Spar Nord Bank A/S (a) | 11,331 | | 101,073 |
TOTAL DENMARK | | 3,311,539 |
Finland - 1.0% |
Nokia Corp. (a) | 77,916 | | 592,223 |
Nokian Tyres PLC | 29,458 | | 1,490,673 |
Sampo Oyj (A Shares) | 26,099 | | 1,236,359 |
Tikkurila Oyj | 3,580 | | 92,792 |
TOTAL FINLAND | | 3,412,047 |
France - 7.1% |
Arkema SA | 7,278 | | 826,308 |
Atos Origin SA | 10,134 | | 865,193 |
BNP Paribas SA | 33,579 | | 2,486,582 |
Cap Gemini SA | 11,002 | | 723,744 |
Carrefour SA | 26,773 | | 980,751 |
Danone SA | 18,480 | | 1,370,482 |
GDF Suez | 51,369 | | 1,279,146 |
Havas SA | 70,377 | | 586,322 |
Kering SA | 3,113 | | 707,334 |
Laurent-Perrier Group SA | 859 | | 80,254 |
Remy Cointreau SA | 6,481 | | 639,553 |
Common Stocks - continued |
| Shares | | Value |
France - continued |
Renault SA | 10,870 | | $ 952,086 |
Safran SA | 21,914 | | 1,400,657 |
Saft Groupe SA | 2,521 | | 80,027 |
Sanofi SA | 49,051 | | 5,229,976 |
Schneider Electric SA | 4,741 | | 399,422 |
Total SA | 74,087 | | 4,545,458 |
Vetoquinol SA | 1,500 | | 59,714 |
Virbac SA | 410 | | 82,472 |
Vivendi SA | 52,852 | | 1,341,550 |
TOTAL FRANCE | | 24,637,031 |
Germany - 4.6% |
Allianz SE | 11,227 | | 1,888,665 |
alstria office REIT-AG | 2,900 | | 36,768 |
BASF AG | 23,711 | | 2,466,996 |
Bayer AG | 25,993 | | 3,230,629 |
Bilfinger Berger AG | 1,120 | | 124,346 |
CompuGROUP Holding AG | 4,546 | | 118,478 |
CTS Eventim AG | 4,483 | | 218,820 |
Deutsche Bank AG | 10,780 | | 520,988 |
Deutsche Bank AG (NY Shares) | 300 | | 14,496 |
Deutsche Post AG | 34,917 | | 1,181,658 |
Fielmann AG | 1,079 | | 120,717 |
Fresenius SE & Co. KGaA | 5,500 | | 714,876 |
HeidelbergCement Finance AG | 9,123 | | 719,175 |
Linde AG | 14,649 | | 2,783,561 |
Siemens AG | 10,138 | | 1,295,558 |
Siemens AG sponsored ADR | 4,769 | | 610,480 |
TOTAL GERMANY | | 16,046,211 |
Greece - 0.0% |
Titan Cement Co. SA (Reg.) (a) | 3,444 | | 93,989 |
Hong Kong - 1.4% |
China Insurance International Holdings Co. Ltd. (a) | 717,800 | | 1,120,261 |
Dah Chong Hong Holdings Ltd. | 630,000 | | 534,683 |
Hang Lung Properties Ltd. | 261,000 | | 860,125 |
HKT Trust / HKT Ltd. unit | 641,000 | | 594,452 |
Hysan Development Co. Ltd. | 140,000 | | 654,585 |
Lenovo Group Ltd. | 628,000 | | 672,307 |
Wing Hang Bank Ltd. | 37,562 | | 534,385 |
TOTAL HONG KONG | | 4,970,798 |
Common Stocks - continued |
| Shares | | Value |
Hungary - 0.2% |
Richter Gedeon PLC | 38,800 | | $ 737,790 |
India - 3.0% |
Bank of Baroda | 49,621 | | 517,677 |
Cipla Ltd. | 86,552 | | 580,347 |
Container Corp. of India Ltd. | 44,711 | | 549,201 |
Grasim Industries Ltd. | 15,533 | | 730,141 |
Housing Development Finance Corp. Ltd. | 120,022 | | 1,665,338 |
IDFC Ltd. | 457,281 | | 784,718 |
Infosys Ltd. | 23,850 | | 1,271,037 |
Jyothy Laboratories Ltd. (a) | 32,119 | | 96,580 |
Kotak Mahindra Bank Ltd. | 54,534 | | 665,879 |
Larsen & Toubro Ltd. | 62,294 | | 984,286 |
NTPC Ltd. | 524,093 | | 1,268,049 |
Prestige Estates Projects Ltd. (a) | 272,850 | | 633,377 |
Punjab National Bank | 57,188 | | 530,472 |
TOTAL INDIA | | 10,277,102 |
Indonesia - 0.5% |
PT Bank Rakyat Indonesia Tbk | 821,000 | | 575,371 |
PT Semen Gresik (Persero) Tbk | 438,500 | | 558,212 |
PT Wijaya Karya Persero Tbk | 3,288,500 | | 560,114 |
TOTAL INDONESIA | | 1,693,697 |
Ireland - 0.7% |
CRH PLC sponsored ADR | 39,729 | | 972,566 |
FBD Holdings PLC | 5,372 | | 115,972 |
James Hardie Industries PLC: | | | |
CDI | 8,082 | | 83,491 |
sponsored ADR | 24,355 | | 1,268,408 |
TOTAL IRELAND | | 2,440,437 |
Israel - 0.2% |
Azrieli Group | 14,096 | | 453,311 |
Ituran Location & Control Ltd. | 2,761 | | 50,526 |
Strauss Group Ltd. | 2,359 | | 41,664 |
TOTAL ISRAEL | | 545,501 |
Italy - 0.5% |
Azimut Holding SpA | 8,114 | | 206,124 |
Beni Stabili SpA SIIQ | 145,810 | | 100,175 |
Interpump Group SpA | 53,591 | | 596,658 |
Common Stocks - continued |
| Shares | | Value |
Italy - continued |
Prada SpA | 68,900 | | $ 671,848 |
Unione di Banche Italiane ScpA | 44,737 | | 309,782 |
TOTAL ITALY | | 1,884,587 |
Japan - 14.4% |
AEON Financial Service Co. Ltd. | 8,800 | | 270,250 |
AEON Mall Co. Ltd. | 36,130 | | 1,026,127 |
Air Water, Inc. | 29,500 | | 421,681 |
Anicom Holdings, Inc. (a) | 2,500 | | 29,626 |
Aozora Bank Ltd. | 243,000 | | 706,409 |
ARNEST ONE Corp. | 2,300 | | 63,061 |
Artnature, Inc. | 4,000 | | 85,376 |
Asahi Co. Ltd. | 4,000 | | 67,805 |
Astellas Pharma, Inc. | 11,700 | | 652,233 |
Autobacs Seven Co. Ltd. | 27,400 | | 399,505 |
Azbil Corp. | 4,200 | | 101,197 |
Coca-Cola Central Japan Co. Ltd. | 3,800 | | 67,300 |
Cosmos Pharmaceutical Corp. | 700 | | 85,281 |
Daikin Industries Ltd. | 9,300 | | 535,061 |
Daikokutenbussan Co. Ltd. | 5,000 | | 150,040 |
DENSO Corp. | 88,900 | | 4,273,282 |
Dentsu, Inc. | 14,400 | | 544,064 |
East Japan Railway Co. | 10,400 | | 903,455 |
Fanuc Corp. | 6,800 | | 1,090,772 |
Fast Retailing Co. Ltd. | 3,900 | | 1,312,786 |
FCC Co. Ltd. | 6,800 | | 155,345 |
GCA Savvian Group Corp. | 4,700 | | 51,811 |
Glory Ltd. | 2,000 | | 49,594 |
Goldcrest Co. Ltd. | 6,260 | | 167,479 |
Hajime Construction Co. Ltd. | 400 | | 27,581 |
Harmonic Drive Systems, Inc. | 3,000 | | 64,584 |
Hoya Corp. | 35,500 | | 851,268 |
Isuzu Motors Ltd. | 82,000 | | 510,662 |
Itochu Corp. | 66,200 | | 795,999 |
Iwatsuka Confectionary Co. Ltd. | 1,200 | | 61,891 |
Japan Exchange Group, Inc. | 15,600 | | 362,671 |
Japan Tobacco, Inc. | 66,500 | | 2,406,215 |
JFE Holdings, Inc. | 26,300 | | 597,922 |
JTEKT Corp. | 41,200 | | 528,937 |
Kamigumi Co. Ltd. | 6,000 | | 52,190 |
Kansai Electric Power Co., Inc. (a) | 40,900 | | 517,672 |
KDDI Corp. | 21,200 | | 1,148,118 |
Common Stocks - continued |
| Shares | | Value |
Japan - continued |
Keyence Corp. | 5,921 | | $ 2,537,681 |
Kobayashi Pharmaceutical Co. Ltd. | 1,600 | | 89,586 |
Kyoto Kimono Yuzen Co. Ltd. | 2,800 | | 29,424 |
Lasertec Corp. (a) | 5,500 | | 56,820 |
Leopalace21 Corp. (a) | 31,800 | | 220,772 |
Meiko Network Japan Co. Ltd. | 2,700 | | 31,169 |
Miraial Co. Ltd. | 2,400 | | 38,930 |
Mitsubishi Electric Corp. | 62,000 | | 681,502 |
Mitsui Fudosan Co. Ltd. | 59,000 | | 1,954,428 |
MS&AD Insurance Group Holdings, Inc. | 29,400 | | 760,206 |
Nabtesco Corp. | 3,000 | | 73,223 |
Nagaileben Co. Ltd. | 5,100 | | 84,161 |
ND Software Co. Ltd. | 2,000 | | 35,876 |
Nihon M&A Center, Inc. | 2,300 | | 177,389 |
Nihon Parkerizing Co. Ltd. | 7,000 | | 136,745 |
Nippon Seiki Co. Ltd. | 7,000 | | 114,127 |
Nippon Telegraph & Telephone Corp. | 18,600 | | 966,834 |
Nomura Holdings, Inc. | 44,400 | | 327,984 |
NS Tool Co. Ltd. | 1,900 | | 32,362 |
Obic Co. Ltd. | 3,800 | | 119,330 |
Omron Corp. | 14,600 | | 557,154 |
ORIX Corp. | 67,100 | | 1,162,245 |
OSG Corp. | 10,200 | | 165,002 |
Santen Pharmaceutical Co. Ltd. | 12,800 | | 649,801 |
Seven & i Holdings Co., Ltd. | 24,100 | | 891,908 |
Seven Bank Ltd. | 339,600 | | 1,201,931 |
Shinsei Bank Ltd. | 552,000 | | 1,292,401 |
SHO-BOND Holdings Co. Ltd. | 17,200 | | 805,430 |
Shoei Co. Ltd. | 5,900 | | 55,432 |
SoftBank Corp. | 39,800 | | 2,972,221 |
Software Service, Inc. | 1,000 | | 37,598 |
Sumitomo Corp. | 54,800 | | 713,129 |
Sumitomo Mitsui Financial Group, Inc. | 57,200 | | 2,764,813 |
Sumitomo Mitsui Trust Holdings, Inc. | 192,000 | | 948,305 |
Techno Medica Co. Ltd. | 1,800 | | 39,199 |
The Nippon Synthetic Chemical Industry Co. Ltd. | 11,000 | | 106,054 |
Tocalo Co. Ltd. | 2,800 | | 45,843 |
Tokyo Tatemono Co. Ltd. | 47,000 | | 441,236 |
Toyota Motor Corp. | 22,000 | | 1,426,440 |
Tsutsumi Jewelry Co. Ltd. | 2,000 | | 48,731 |
Unicharm Corp. | 11,400 | | 732,210 |
USS Co. Ltd. | 163,500 | | 2,394,375 |
Common Stocks - continued |
| Shares | | Value |
Japan - continued |
Workman Co. Ltd. | 2,000 | | $ 78,379 |
Yamato Kogyo Co. Ltd. | 25,500 | | 945,137 |
TOTAL JAPAN | | 50,078,773 |
Korea (South) - 2.7% |
Coway Co. Ltd. | 2,497 | | 142,581 |
E-Mart Co. Ltd. | 5,451 | | 1,304,607 |
Kiwoom Securities Co. Ltd. | 13,501 | | 707,311 |
Korea Electric Power Corp. (a) | 32,950 | | 879,523 |
Korea Plant Service & Engineering Co. Ltd. | 18,239 | | 924,598 |
KT Corp. | 25,930 | | 856,618 |
LG Corp. | 17,494 | | 1,033,538 |
LG Household & Health Care Ltd. | 1,560 | | 809,927 |
NICE Holdings Co. Ltd. | 5,000 | | 61,011 |
NICE Information Service Co. Ltd. | 12,000 | | 34,600 |
Samsung Fire & Marine Insurance Co. Ltd. | 3,292 | | 769,275 |
Shinhan Financial Group Co. Ltd. | 30,630 | | 1,334,912 |
TK Corp. (a) | 27,242 | | 553,167 |
TOTAL KOREA (SOUTH) | | 9,411,668 |
Luxembourg - 0.3% |
Millicom International Cellular SA (depository receipt) | 10,000 | | 922,061 |
Malaysia - 0.4% |
Axiata Group Bhd | 104,300 | | 227,005 |
Public Bank Bhd | 71,500 | | 414,526 |
YTL Corp. Bhd | 1,298,600 | | 678,818 |
TOTAL MALAYSIA | | 1,320,349 |
Mexico - 0.9% |
Bolsa Mexicana de Valores S.A.B. de CV | 221,300 | | 527,500 |
Consorcio ARA S.A.B. de CV (a) | 1,492,555 | | 583,420 |
Fomento Economico Mexicano S.A.B. de CV sponsored ADR | 12,233 | | 1,141,339 |
Grupo Televisa SA de CV | 162,300 | | 991,420 |
TOTAL MEXICO | | 3,243,679 |
Netherlands - 2.0% |
Aalberts Industries NV | 7,600 | | 227,429 |
AEGON NV | 51,215 | | 407,512 |
ASM International NV (depositary receipt) | 1,950 | | 64,389 |
ASML Holding NV | 12,776 | | 1,209,121 |
Heijmans NV (Certificaten Van Aandelen) | 8,481 | | 112,836 |
ING Groep NV (Certificaten Van Aandelen) (a) | 148,405 | | 1,885,890 |
Common Stocks - continued |
| Shares | | Value |
Netherlands - continued |
Koninklijke Philips Electronics NV | 38,309 | | $ 1,353,868 |
Royal DSM NV | 11,256 | | 852,629 |
Unilever NV (Certificaten Van Aandelen) (Bearer) | 16,000 | | 634,328 |
VastNed Retail NV | 2,215 | | 102,418 |
TOTAL NETHERLANDS | | 6,850,420 |
Nigeria - 0.1% |
Guaranty Trust Bank PLC | 3,130,003 | | 498,672 |
Norway - 0.4% |
Telenor ASA | 56,208 | | 1,350,189 |
Philippines - 0.4% |
Jollibee Food Corp. | 14,560 | | 59,770 |
Security Bank Corp. | 165,970 | | 533,838 |
SM Investments Corp. | 32,910 | | 651,879 |
TOTAL PHILIPPINES | | 1,245,487 |
Poland - 0.2% |
Warsaw Stock Exchange | 49,938 | | 723,046 |
Portugal - 0.5% |
Jeronimo Martins SGPS SA | 98,869 | | 1,826,998 |
Russia - 0.1% |
Moscow Exchange MICEX-RTS OAO | 184,700 | | 352,747 |
Singapore - 0.8% |
Ezion Holdings Ltd. | 269,000 | | 485,075 |
Singapore Telecommunications Ltd. | 394,000 | | 1,198,937 |
United Overseas Bank Ltd. | 58,746 | | 985,563 |
TOTAL SINGAPORE | | 2,669,575 |
South Africa - 2.3% |
African Bank Investments Ltd. | 410,106 | | 694,489 |
Bidvest Group Ltd. | 31,600 | | 842,698 |
Clicks Group Ltd. | 118,211 | | 736,556 |
Nampak Ltd. | 25,130 | | 83,110 |
Naspers Ltd. Class N | 9,700 | | 907,314 |
Remgro Ltd. | 31,700 | | 645,447 |
Sasol Ltd. | 18,500 | | 945,310 |
Shoprite Holdings Ltd. | 48,300 | | 884,327 |
Standard Bank Group Ltd. | 83,671 | | 1,062,854 |
Tiger Brands Ltd. | 35,300 | | 1,034,447 |
TOTAL SOUTH AFRICA | | 7,836,552 |
Common Stocks - continued |
| Shares | | Value |
Spain - 1.9% |
Amadeus IT Holding SA Class A | 17,157 | | $ 637,116 |
Banco Bilbao Vizcaya Argentaria SA sponsored ADR | 169,876 | | 1,984,152 |
Grifols SA | 1,546 | | 63,403 |
Inditex SA | 12,680 | | 2,083,169 |
International Consolidated Airlines Group SA CDI (a) | 86,600 | | 483,075 |
Prosegur Compania de Seguridad SA (Reg.) | 74,476 | | 442,905 |
Repsol YPF SA | 33,855 | | 909,220 |
TOTAL SPAIN | | 6,603,040 |
Sweden - 2.7% |
ASSA ABLOY AB (B Shares) | 30,400 | | 1,509,198 |
Atlas Copco AB (A Shares) | 51,459 | | 1,427,817 |
Fagerhult AB | 13,985 | | 429,474 |
H&M Hennes & Mauritz AB (B Shares) | 40,086 | | 1,732,098 |
Intrum Justitia AB | 25,963 | | 691,139 |
SKF AB (B Shares) | 32,800 | | 869,092 |
Svenska Cellulosa AB (SCA) (B Shares) | 24,176 | | 686,474 |
Svenska Handelsbanken AB (A Shares) | 42,293 | | 1,916,224 |
Swedish Match Co. AB | 3,900 | | 128,675 |
TOTAL SWEDEN | | 9,390,191 |
Switzerland - 6.8% |
Credit Suisse Group | 16,189 | | 503,607 |
Nestle SA | 78,360 | | 5,656,343 |
Novartis AG | 47,854 | | 3,714,551 |
Roche Holding AG (participation certificate) | 18,964 | | 5,250,187 |
Schindler Holding AG: | | | |
(participation certificate) | 5,270 | | 747,505 |
(Reg.) | 2,001 | | 284,487 |
Swatch Group AG (Bearer) | 960 | | 614,184 |
Swiss Re Ltd. | 16,910 | | 1,485,344 |
Syngenta AG (Switzerland) | 2,230 | | 900,065 |
UBS AG (NY Shares) | 225,197 | | 4,359,814 |
Zehnder Group AG | 1,363 | | 64,218 |
TOTAL SWITZERLAND | | 23,580,305 |
Taiwan - 1.7% |
Chroma ATE, Inc. | 325,116 | | 691,431 |
CTCI Corp. | 353,000 | | 616,416 |
E.SUN Financial Holdings Co. Ltd. | 1,122,485 | | 749,340 |
King Slide Works Co. Ltd. | 48,000 | | 423,985 |
Standard Foods Corp. | 18,550 | | 56,718 |
Taiwan Semiconductor Manufacturing Co. Ltd. | 536,035 | | 1,971,867 |
Common Stocks - continued |
| Shares | | Value |
Taiwan - continued |
Unified-President Enterprises Corp. | 540,988 | | $ 1,029,228 |
Wowprime Corp. | 31,200 | | 516,202 |
TOTAL TAIWAN | | 6,055,187 |
Turkey - 1.3% |
Albaraka Turk Katilim Bankasi A/S (a) | 113,907 | | 101,568 |
Anadolu Efes Biracilik Ve Malt Sanayii A/S | 57,000 | | 728,115 |
Coca-Cola Icecek A/S | 35,589 | | 1,020,649 |
Enka Insaat ve Sanayi A/S | 254,062 | | 743,255 |
Tupras Turkiye Petrol Rafinelleri A/S | 22,313 | | 506,339 |
Turkiye Garanti Bankasi A/S | 313,143 | | 1,261,200 |
TOTAL TURKEY | | 4,361,126 |
United Kingdom - 16.7% |
Babcock International Group PLC | 49,400 | | 1,009,902 |
Barclays PLC | 467,229 | | 1,965,850 |
Barclays PLC sponsored ADR | 48,333 | | 812,478 |
Bellway PLC | 5,928 | | 142,955 |
Berendsen PLC | 7,328 | | 114,031 |
BG Group PLC | 103,727 | | 2,118,033 |
BHP Billiton PLC | 68,221 | | 2,105,198 |
BHP Billiton PLC ADR | 15,600 | | 961,584 |
British American Tobacco PLC (United Kingdom) | 15,840 | | 873,929 |
Britvic PLC | 9,817 | | 98,379 |
BT Group PLC | 124,647 | | 754,193 |
Bunzl PLC | 39,057 | | 862,332 |
Compass Group PLC | 65,914 | | 948,008 |
Dechra Pharmaceuticals PLC | 9,000 | | 99,571 |
Derwent London PLC | 2,000 | | 80,298 |
Elementis PLC | 32,808 | | 136,298 |
Fenner PLC | 8,953 | | 57,421 |
GlaxoSmithKline PLC sponsored ADR | 53,397 | | 2,810,284 |
Great Portland Estates PLC | 17,772 | | 163,280 |
Hilton Food Group PLC | 4,200 | | 28,823 |
HSBC Holdings PLC sponsored ADR | 84,258 | | 4,637,560 |
Imperial Tobacco Group PLC | 35,990 | | 1,343,981 |
InterContinental Hotel Group PLC ADR | 54,247 | | 1,592,149 |
ITV PLC | 304,819 | | 933,018 |
Johnson Matthey PLC | 29,077 | | 1,400,527 |
Kingfisher PLC | 152,227 | | 921,405 |
Legal & General Group PLC | 392,124 | | 1,359,947 |
Meggitt PLC | 14,735 | | 135,259 |
Common Stocks - continued |
| Shares | | Value |
United Kingdom - continued |
National Grid PLC | 122,891 | | $ 1,544,342 |
Next PLC | 7,800 | | 680,980 |
Persimmon PLC | 4,537 | | 92,024 |
Prudential PLC | 176,390 | | 3,607,310 |
Reckitt Benckiser Group PLC | 26,051 | | 2,025,018 |
Reed Elsevier PLC | 74,513 | | 1,044,204 |
Rexam PLC | 86,188 | | 717,917 |
Rolls-Royce Group PLC | 127,052 | | 2,342,725 |
Rotork PLC | 22,403 | | 1,028,417 |
Royal Dutch Shell PLC Class A sponsored ADR | 50,889 | | 3,392,261 |
SABMiller PLC | 45,563 | | 2,377,233 |
Serco Group PLC | 101,845 | | 909,571 |
Shaftesbury PLC | 49,537 | | 471,800 |
Spectris PLC | 5,170 | | 191,655 |
Spirax-Sarco Engineering PLC | 4,807 | | 224,906 |
Standard Chartered PLC (United Kingdom) | 76,604 | | 1,841,789 |
Taylor Wimpey PLC | 270,787 | | 478,466 |
Ted Baker PLC | 2,575 | | 70,478 |
Tesco PLC | 211,773 | | 1,236,666 |
Tullow Oil PLC | 35,500 | | 536,478 |
Ultra Electronics Holdings PLC | 5,001 | | 155,080 |
Unite Group PLC | 76,402 | | 485,112 |
Vodafone Group PLC sponsored ADR | 114,232 | | 4,206,022 |
TOTAL UNITED KINGDOM | | 58,127,147 |
United States of America - 5.7% |
AbbVie, Inc. | 15,329 | | 742,690 |
ANSYS, Inc. (a) | 400 | | 34,980 |
Autoliv, Inc. | 17,254 | | 1,539,574 |
Berkshire Hathaway, Inc. Class B (a) | 4,316 | | 496,685 |
BorgWarner, Inc. | 13,097 | | 1,350,694 |
BPZ Energy, Inc. (a) | 15,547 | | 31,249 |
Broadridge Financial Solutions, Inc. | 1,140 | | 40,082 |
Cabot Corp. | 7,508 | | 349,948 |
Cummins, Inc. | 6,191 | | 786,381 |
Dril-Quip, Inc. (a) | 1,070 | | 125,639 |
Evercore Partners, Inc. Class A | 2,160 | | 109,015 |
FMC Technologies, Inc. (a) | 10,803 | | 546,092 |
Google, Inc. Class A (a) | 600 | | 618,348 |
Greenhill & Co., Inc. | 1,420 | | 72,846 |
Kansas City Southern | 517 | | 62,826 |
Kennedy-Wilson Holdings, Inc. | 5,183 | | 103,867 |
Common Stocks - continued |
| Shares | | Value |
United States of America - continued |
KLA-Tencor Corp. | 8,500 | | $ 557,600 |
Martin Marietta Materials, Inc. | 7,780 | | 763,140 |
MasterCard, Inc. Class A | 2,409 | | 1,727,494 |
Mead Johnson Nutrition Co. Class A | 16,700 | | 1,363,722 |
Mohawk Industries, Inc. (a) | 6,035 | | 799,155 |
National Oilwell Varco, Inc. | 9,546 | | 774,944 |
Oceaneering International, Inc. | 1,250 | | 107,350 |
Philip Morris International, Inc. | 10,000 | | 891,200 |
PriceSmart, Inc. | 8,085 | | 919,992 |
ResMed, Inc. | 15,420 | | 797,831 |
Sohu.com, Inc. (a) | 5,600 | | 374,976 |
Solera Holdings, Inc. | 12,873 | | 723,720 |
SS&C Technologies Holdings, Inc. (a) | 19,854 | | 780,262 |
Union Pacific Corp. | 3,900 | | 590,460 |
Visa, Inc. Class A | 8,601 | | 1,691,559 |
TOTAL UNITED STATES OF AMERICA | | 19,874,321 |
TOTAL COMMON STOCKS (Cost $279,749,091) |
339,377,631
|
Nonconvertible Preferred Stocks - 0.8% |
| | | |
Brazil - 0.2% |
Banco ABC Brasil SA | 5,994 | | 36,897 |
Klabin SA (PN) (non-vtg.) | 124,100 | | 659,222 |
TOTAL BRAZIL | | 696,119 |
Germany - 0.6% |
Sartorius AG (non-vtg.) | 800 | | 84,398 |
Volkswagen AG | 7,390 | | 1,878,322 |
TOTAL GERMANY | | 1,962,720 |
United Kingdom - 0.0% |
Rolls-Royce Group PLC Series C | 8,544,272 | | 13,700 |
TOTAL NONCONVERTIBLE PREFERRED STOCKS (Cost $2,154,229) |
2,672,539
|
Money Market Funds - 1.2% |
| Shares | | Value |
Fidelity Cash Central Fund, 0.09% (b)
(Cost $4,180,055) | 4,180,055 | | $ 4,180,055 |
TOTAL INVESTMENT PORTFOLIO - 99.6% (Cost $286,083,375) | | 346,230,225 |
NET OTHER ASSETS (LIABILITIES) - 0.4% | | 1,255,209 |
NET ASSETS - 100% | $ 347,485,434 |
Legend |
(a) Non-income producing |
(b) Affiliated fund that is generally available only to investment companies and other accounts managed by Fidelity Investments. The rate quoted is the annualized seven-day yield of the fund at period end. A complete unaudited listing of the fund's holdings as of its most recent quarter end is available upon request. In addition, each Fidelity Central Fund's financial statements, which are not covered by the Fund's Report of Independent Registered Public Accounting Firm, are available on the SEC's website or upon request. |
(c) Security or a portion of the security purchased on a delayed delivery or when-issued basis. |
Affiliated Central Funds |
Information regarding fiscal year to date income earned by the Fund from investments in Fidelity Central Funds is as follows: |
Fund | Income earned |
Fidelity Cash Central Fund | $ 7,651 |
Fidelity Securities Lending Cash Central Fund | 117,973 |
Total | $ 125,624 |
Other Information |
Categorizations in the Schedule of Investments are based on country or territory of incorporation. |
The following is a summary of the inputs used, as of October 31, 2013, involving the Fund's assets and liabilities carried at fair value. The inputs or methodology used for valuing securities may not be an indication of the risk associated with investing in those securities. For more information on valuation inputs, and their aggregation into the levels used in the tables below, please refer to the Investment Valuation section in the accompanying Notes to Financial Statements. |
Valuation Inputs at Reporting Date: |
Description | Total | Level 1 | Level 2 | Level 3 |
Investments in Securities: | | | | |
Equities: | | | | |
Consumer Discretionary | $ 45,862,668 | $ 34,330,500 | $ 11,441,526 | $ 90,642 |
Consumer Staples | 47,931,001 | 31,254,840 | 16,676,161 | - |
Energy | 15,259,371 | 9,768,603 | 5,490,768 | - |
Financials | 85,212,436 | 60,767,201 | 24,445,235 | - |
Health Care | 32,901,496 | 22,458,101 | 10,443,395 | - |
Industrials | 44,536,699 | 35,172,801 | 9,363,898 | - |
Information Technology | 19,752,010 | 11,654,503 | 8,097,507 | - |
Materials | 22,658,420 | 16,715,477 | 5,942,943 | - |
Telecommunication Services | 19,997,074 | 12,671,219 | 7,325,855 | - |
Utilities | 7,938,995 | 4,997,458 | 2,941,537 | - |
Money Market Funds | 4,180,055 | 4,180,055 | - | - |
Total Investments in Securities: | $ 346,230,225 | $ 243,970,758 | $ 102,168,825 | $ 90,642 |
The following is a summary of transfers between Level 1 and Level 2 for the period ended October 31, 2013. Transfers are assumed to have occurred at the beginning of the period, and are primarily attributable to the valuation techniques used for foreign equity securities, as discussed in the accompanying Notes to Financial Statements: |
Transfers | Total |
Level 1 to Level 2 | $ 27,446,870 |
Level 2 to Level 1 | $ 0 |
See accompanying notes which are an integral part of the financial statements.
Annual Report
Statement of Assets and Liabilities
| October 31, 2013 |
| | |
Assets | | |
Investment in securities, at value - See accompanying schedule: Unaffiliated issuers (cost $281,903,320) | $ 342,050,170 | |
Fidelity Central Funds (cost $4,180,055) | 4,180,055 | |
Total Investments (cost $286,083,375) | | $ 346,230,225 |
Cash | | 98,120 |
Foreign currency held at value (cost $48,734) | | 48,356 |
Receivable for investments sold | | 5,463,171 |
Receivable for fund shares sold | | 129,490 |
Dividends receivable | | 652,586 |
Distributions receivable from Fidelity Central Funds | | 461 |
Prepaid expenses | | 1,143 |
Receivable from investment adviser for expense reductions | | 1,873 |
Other receivables | | 19,410 |
Total assets | | 352,644,835 |
| | |
Liabilities | | |
Payable for investments purchased
Regular delivery | $ 4,152,032 | |
Delayed delivery | 3,376 | |
Payable for fund shares redeemed | 510,377 | |
Accrued management fee | 211,644 | |
Distribution and service plan fees payable | 8,092 | |
Other affiliated payables | 52,427 | |
Other payables and accrued expenses | 221,453 | |
Total liabilities | | 5,159,401 |
| | |
Net Assets | | $ 347,485,434 |
Net Assets consist of: | | |
Paid in capital | | $ 304,386,459 |
Undistributed net investment income | | 4,647,078 |
Accumulated undistributed net realized gain (loss) on investments and foreign currency transactions | | (21,575,548) |
Net unrealized appreciation (depreciation) on investments and assets and liabilities in foreign currencies | | 60,027,445 |
Net Assets | | $ 347,485,434 |
See accompanying notes which are an integral part of the financial statements.
Annual Report
Statement of Assets and Liabilities - continued
| October 31, 2013 |
| | |
Calculation of Maximum Offering Price Class A:
Net Asset Value and redemption price per share ($9,033,736 ÷ 1,091,791 shares) | | $ 8.27 |
| | |
Maximum offering price per share (100/94.25 of $8.27) | | $ 8.77 |
Class T:
Net Asset Value and redemption price per share ($7,908,968 ÷ 950,538 shares) | | $ 8.32 |
| | |
Maximum offering price per share (100/96.50 of $8.32) | | $ 8.62 |
Class B:
Net Asset Value and offering price per share ($191,605 ÷ 23,044 shares)A | | $ 8.31 |
| | |
Class C:
Net Asset Value and offering price per share ($3,584,459 ÷ 433,098 shares)A | | $ 8.28 |
| | |
Total International Equity:
Net Asset Value, offering price and redemption price per share ($324,394,605 ÷ 39,121,493 shares) | | $ 8.29 |
| | |
Institutional Class:
Net Asset Value, offering price and redemption price per share ($2,372,061 ÷ 287,233 shares) | | $ 8.26 |
A Redemption price per share is equal to net asset value less any applicable contingent deferred sales charge.
See accompanying notes which are an integral part of the financial statements.
Annual Report
Financial Statements - continued
Statement of Operations
| Year ended October 31, 2013 |
| | |
Investment Income | | |
Dividends | | $ 9,425,071 |
Interest | | 291 |
Income from Fidelity Central Funds | | 125,624 |
Income before foreign taxes withheld | | 9,550,986 |
Less foreign taxes withheld | | (700,335) |
Total income | | 8,850,651 |
| | |
Expenses | | |
Management fee
Basic fee | $ 2,364,132 | |
Performance adjustment | 228,686 | |
Transfer agent fees | 478,126 | |
Distribution and service plan fees | 79,485 | |
Accounting and security lending fees | 174,309 | |
Custodian fees and expenses | 273,120 | |
Independent trustees' compensation | 1,910 | |
Registration fees | 73,943 | |
Audit | 93,320 | |
Legal | 893 | |
Miscellaneous | 2,714 | |
Total expenses before reductions | 3,770,638 | |
Expense reductions | (85,967) | 3,684,671 |
Net investment income (loss) | | 5,165,980 |
Realized and Unrealized Gain (Loss) Net realized gain (loss) on: | | |
Investment securities: | | |
Unaffiliated issuers | 8,824,925 | |
Foreign currency transactions | (119,832) | |
Futures contracts | (175,371) | |
Total net realized gain (loss) | | 8,529,722 |
Change in net unrealized appreciation (depreciation) on: Investment securities (net of increase in deferred foreign taxes of $90,453) | 44,707,928 | |
Assets and liabilities in foreign currencies | 18,535 | |
Total change in net unrealized appreciation (depreciation) | | 44,726,463 |
Net gain (loss) | | 53,256,185 |
Net increase (decrease) in net assets resulting from operations | | $ 58,422,165 |
See accompanying notes which are an integral part of the financial statements.
Annual Report
Statement of Changes in Net Assets
| Year ended
October 31,
2013 | Year ended
October 31,
2012 |
Increase (Decrease) in Net Assets | | |
Operations | | |
Net investment income (loss) | $ 5,165,980 | $ 5,615,371 |
Net realized gain (loss) | 8,529,722 | 9,140,393 |
Change in net unrealized appreciation (depreciation) | 44,726,463 | 20,537,189 |
Net increase (decrease) in net assets resulting
from operations | 58,422,165 | 35,292,953 |
Distributions to shareholders from net investment income | (5,845,552) | (1,867,192) |
Distributions to shareholders from net realized gain | (9,769,201) | - |
Total distributions | (15,614,753) | (1,867,192) |
Share transactions - net increase (decrease) | 10,109,727 | 122,647,348 |
Redemption fees | 2,498 | 3,128 |
Total increase (decrease) in net assets | 52,919,637 | 156,076,237 |
| | |
Net Assets | | |
Beginning of period | 294,565,797 | 138,489,560 |
End of period (including undistributed net investment income of $4,647,078 and undistributed net investment income of $5,300,982, respectively) | $ 347,485,434 | $ 294,565,797 |
See accompanying notes which are an integral part of the financial statements.
Annual Report
Financial Highlights - Class A
Years ended October 31, | 2013 | 2012 | 2011 | 2010 | 2009 |
Selected Per-Share Data | | | | | |
Net asset value, beginning of period | $ 7.31 | $ 6.67 | $ 7.36 | $ 6.40 | $ 4.90 |
Income from Investment Operations | | | | | |
Net investment income (loss) C | .09 | .13 | .11 | .08 | .06 |
Net realized and unrealized gain (loss) | 1.24 | .59 | (.69) | .95 | 1.55 |
Total from investment operations | 1.33 | .72 | (.58) | 1.03 | 1.61 |
Distributions from net investment income | (.13) | (.08) | (.09) | (.04) | (.11) |
Distributions from net realized gain | (.25) | - | (.02) | (.03) | - |
Total distributions | (.37) H | (.08) | (.11) | (.07) | (.11) |
Redemption fees added to paid in capital C, G | - | - | - | - | - |
Net asset value, end of period | $ 8.27 | $ 7.31 | $ 6.67 | $ 7.36 | $ 6.40 |
Total Return A, B | 19.00% | 10.88% | (8.03)% | 16.17% | 33.87% |
Ratios to Average Net Assets D, F | | | | | |
Expenses before reductions | 1.50% | 1.57% | 1.73% | 2.02% | 2.09% |
Expenses net of fee waivers, if any | 1.45% | 1.45% | 1.45% | 1.50% | 1.50% |
Expenses net of all reductions | 1.43% | 1.42% | 1.42% | 1.47% | 1.47% |
Net investment income (loss) | 1.21% | 1.88% | 1.44% | 1.15% | 1.13% |
Supplemental Data | | | | | |
Net assets, end of period (000 omitted) | $ 9,034 | $ 5,767 | $ 4,307 | $ 5,029 | $ 3,727 |
Portfolio turnover rate E | 89% | 110% | 75% | 67% | 98% |
A Total returns would have been lower if certain expenses had not been reduced during the applicable periods shown.
B Total returns do not include the effect of the sales charges.
C Calculated based on average shares outstanding during the period.
D Fees and expenses of any underlying Fidelity Central Funds are not included in the Fund's expense ratio. The Fund indirectly bears its proportionate share of the expenses of any underlying Fidelity Central Funds.
E Amount does not include the portfolio activity of any underlying Fidelity Central Funds.
F Expense ratios reflect operating expenses of the class. Expenses before reductions do not reflect amounts reimbursed by the investment adviser or reductions from brokerage service arrangements or reductions from other expense offset arrangements and do not represent the amount paid by the class during periods when reimbursements or reductions occur. Expenses net of fee waivers reflect expenses after reimbursement by the investment adviser but prior to reductions from brokerage service arrangements or other expense offset arrangements. Expenses net of all reductions represent the net expenses paid by the class.
G Amount represents less than $.01 per share.
H Total distributions of $.37 per share is comprised of distributions from net investment income of $.126 and distributions from net realized gain of $.245 per share.
See accompanying notes which are an integral part of the financial statements.
Annual Report
Financial Highlights - Class T
Years ended October 31, | 2013 | 2012 | 2011 | 2010 | 2009 |
Selected Per-Share Data | | | | | |
Net asset value, beginning of period | $ 7.37 | $ 6.73 | $ 7.41 | $ 6.40 | $ 4.88 |
Income from Investment Operations | | | | | |
Net investment income (loss) C | .07 | .11 | .09 | .06 | .04 |
Net realized and unrealized gain (loss) | 1.25 | .59 | (.68) | .95 | 1.57 |
Total from investment operations | 1.32 | .70 | (.59) | 1.01 | 1.61 |
Distributions from net investment income | (.13) | (.06) | (.07) | - | (.09) |
Distributions from net realized gain | (.25) | - | (.02) | - | - |
Total distributions | (.37) H | (.06) | (.09) | - | (.09) |
Redemption fees added to paid in capital C, G | - | - | - | - | - |
Net asset value, end of period | $ 8.32 | $ 7.37 | $ 6.73 | $ 7.41 | $ 6.40 |
Total Return A, B | 18.73% | 10.52% | (8.08)% | 15.78% | 33.74% |
Ratios to Average Net Assets D, F | | | | | |
Expenses before reductions | 1.75% | 1.84% | 2.02% | 2.31% | 2.34% |
Expenses net of fee waivers, if any | 1.70% | 1.70% | 1.70% | 1.75% | 1.75% |
Expenses net of all reductions | 1.67% | 1.67% | 1.67% | 1.72% | 1.72% |
Net investment income (loss) | .96% | 1.63% | 1.19% | .90% | .88% |
Supplemental Data | | | | | |
Net assets, end of period (000 omitted) | $ 7,909 | $ 2,348 | $ 997 | $ 1,004 | $ 1,526 |
Portfolio turnover rate E | 89% | 110% | 75% | 67% | 98% |
A Total returns would have been lower if certain expenses had not been reduced during the applicable periods shown.
B Total returns do not include the effect of the sales charges.
C Calculated based on average shares outstanding during the period.
D Fees and expenses of any underlying Fidelity Central Funds are not included in the Fund's expense ratio. The Fund indirectly bears its proportionate share of the expenses of any underlying Fidelity Central Funds.
E Amount does not include the portfolio activity of any underlying Fidelity Central Funds.
F Expense ratios reflect operating expenses of the class. Expenses before reductions do not reflect amounts reimbursed by the investment adviser or reductions from brokerage service arrangements or reductions from other expense offset arrangements and do not represent the amount paid by the class during periods when reimbursements or reductions occur. Expenses net of fee waivers reflect expenses after reimbursement by the investment adviser but prior to reductions from brokerage service arrangements or other expense offset arrangements. Expenses net of all reductions represent the net expenses paid by the class.
G Amount represents less than $.01 per share.
H Total distributions of $.37 per share is comprised of distributions from net investment income of $.128 and distributions from net realized gain of $.245 per share.
See accompanying notes which are an integral part of the financial statements.
Annual Report
Financial Highlights - Class B
Years ended October 31, | 2013 | 2012 | 2011 | 2010 | 2009 |
Selected Per-Share Data | | | | | |
Net asset value, beginning of period | $ 7.33 | $ 6.68 | $ 7.37 | $ 6.39 | $ 4.86 |
Income from Investment Operations | | | | | |
Net investment income (loss) C | .04 | .08 | .05 | .03 | .02 |
Net realized and unrealized gain (loss) | 1.24 | .59 | (.68) | .95 | 1.56 |
Total from investment operations | 1.28 | .67 | (.63) | .98 | 1.58 |
Distributions from net investment income | (.05) | (.02) | (.04) | - | (.05) |
Distributions from net realized gain | (.25) | - | (.02) | - | - |
Total distributions | (.30) | (.02) | (.06) | - | (.05) |
Redemption fees added to paid in capital C, G | - | - | - | - | - |
Net asset value, end of period | $ 8.31 | $ 7.33 | $ 6.68 | $ 7.37 | $ 6.39 |
Total Return A, B | 18.05% | 10.05% | (8.66)% | 15.34% | 32.95% |
Ratios to Average Net Assets D, F | | | | | |
Expenses before reductions | 2.26% | 2.34% | 2.51% | 2.81% | 2.82% |
Expenses net of fee waivers, if any | 2.20% | 2.20% | 2.20% | 2.25% | 2.25% |
Expenses net of all reductions | 2.18% | 2.17% | 2.17% | 2.22% | 2.22% |
Net investment income (loss) | .46% | 1.13% | .69% | .40% | .38% |
Supplemental Data | | | | | |
Net assets, end of period (000 omitted) | $ 192 | $ 220 | $ 254 | $ 327 | $ 1,337 |
Portfolio turnover rate E | 89% | 110% | 75% | 67% | 98% |
A Total returns would have been lower if certain expenses had not been reduced during the applicable periods shown.
B Total returns do not include the effect of the contingent deferred sales charge.
C Calculated based on average shares outstanding during the period.
D Fees and expenses of any underlying Fidelity Central Funds are not included in the Fund's expense ratio. The Fund indirectly bears its proportionate share of the expenses of any underlying Fidelity Central Funds.
E Amount does not include the portfolio activity of any underlying Fidelity Central Funds.
F Expense ratios reflect operating expenses of the class. Expenses before reductions do not reflect amounts reimbursed by the investment adviser or reductions from brokerage service arrangements or reductions from other expense offset arrangements and do not represent the amount paid by the class during periods when reimbursements or reductions occur. Expenses net of fee waivers reflect expenses after reimbursement by the investment adviser but prior to reductions from brokerage service arrangements or other expense offset arrangements. Expenses net of all reductions represent the net expenses paid by the class.
G Amount represents less than $.01 per share.
See accompanying notes which are an integral part of the financial statements.
Annual Report
Financial Highlights - Class C
Years ended October 31, | 2013 | 2012 | 2011 | 2010 | 2009 |
Selected Per-Share Data | | | | | |
Net asset value, beginning of period | $ 7.31 | $ 6.67 | $ 7.36 | $ 6.39 | $ 4.86 |
Income from Investment Operations | | | | | |
Net investment income (loss) C | .04 | .08 | .05 | .03 | .02 |
Net realized and unrealized gain (loss) | 1.25 | .58 | (.69) | .94 | 1.56 |
Total from investment operations | 1.29 | .66 | (.64) | .97 | 1.58 |
Distributions from net investment income | (.08) | (.02) | (.03) | - | (.05) |
Distributions from net realized gain | (.25) | - | (.02) | - | - |
Total distributions | (.32) H | (.02) | (.05) | - | (.05) |
Redemption fees added to paid in capital C, G | - | - | - | - | - |
Net asset value, end of period | $ 8.28 | $ 7.31 | $ 6.67 | $ 7.36 | $ 6.39 |
Total Return A, B | 18.30% | 9.98% | (8.72)% | 15.18% | 33.10% |
Ratios to Average Net Assets D, F | | | | | |
Expenses before reductions | 2.26% | 2.31% | 2.51% | 2.80% | 2.85% |
Expenses net of fee waivers, if any | 2.20% | 2.20% | 2.20% | 2.25% | 2.25% |
Expenses net of all reductions | 2.18% | 2.17% | 2.17% | 2.22% | 2.22% |
Net investment income (loss) | .46% | 1.13% | .69% | .40% | .38% |
Supplemental Data | | | | | |
Net assets, end of period (000 omitted) | $ 3,584 | $ 2,737 | $ 1,396 | $ 1,423 | $ 1,714 |
Portfolio turnover rate E | 89% | 110% | 75% | 67% | 98% |
A Total returns would have been lower if certain expenses had not been reduced during the applicable periods shown.
B Total returns do not include the effect of the contingent deferred sales charge.
C Calculated based on average shares outstanding during the period.
D Fees and expenses of any underlying Fidelity Central Funds are not included in the Fund's expense ratio. The Fund indirectly bears its proportionate share of the expenses of any underlying Fidelity Central Funds.
E Amount does not include the portfolio activity of any underlying Fidelity Central Funds.
F Expense ratios reflect operating expenses of the class. Expenses before reductions do not reflect amounts reimbursed by the investment adviser or reductions from brokerage service arrangements or reductions from other expense offset arrangements and do not represent the amount paid by the class during periods when reimbursements or reductions occur. Expenses net of fee waivers reflect expenses after reimbursement by the investment adviser but prior to reductions from brokerage service arrangements or other expense offset arrangements. Expenses net of all reductions represent the net expenses paid by the class.
G Amount represents less than $.01 per share.
H Total distributions of $.32 per share is comprised of distributions from net investment income of $.075 and distributions from net realized gain of $.245 per share.
See accompanying notes which are an integral part of the financial statements.
Annual Report
Financial Highlights - Total International Equity
Years ended October 31, | 2013 | 2012 | 2011 | 2010 | 2009 |
Selected Per-Share Data | | | | | |
Net asset value, beginning of period | $ 7.32 | $ 6.69 | $ 7.37 | $ 6.41 | $ 4.91 |
Income from Investment Operations | | | | | |
Net investment income (loss) B | .12 | .15 | .12 | .09 | .07 |
Net realized and unrealized gain (loss) | 1.24 | .58 | (.68) | .96 | 1.55 |
Total from investment operations | 1.36 | .73 | (.56) | 1.05 | 1.62 |
Distributions from net investment income | (.15) | (.10) | (.10) | (.06) | (.12) |
Distributions from net realized gain | (.25) | - | (.02) | (.03) | - |
Total distributions | (.39) G | (.10) | (.12) | (.09) | (.12) |
Redemption fees added to paid in capital B, F | - | - | - | - | - |
Net asset value, end of period | $ 8.29 | $ 7.32 | $ 6.69 | $ 7.37 | $ 6.41 |
Total Return A | 19.48% | 11.03% | (7.70)% | 16.45% | 34.23% |
Ratios to Average Net Assets C, E | | | | | |
Expenses before reductions | 1.09% | 1.16% | 1.42% | 1.79% | 1.87% |
Expenses net of fee waivers, if any | 1.09% | 1.16% | 1.20% | 1.25% | 1.25% |
Expenses net of all reductions | 1.07% | 1.13% | 1.17% | 1.22% | 1.22% |
Net investment income (loss) | 1.57% | 2.16% | 1.69% | 1.40% | 1.38% |
Supplemental Data | | | | | |
Net assets, end of period (000 omitted) | $ 324,395 | $ 281,979 | $ 131,338 | $ 60,826 | $ 33,061 |
Portfolio turnover rate D | 89% | 110% | 75% | 67% | 98% |
A Total returns would have been lower if certain expenses had not been reduced during the applicable periods shown.
B Calculated based on average shares outstanding during the period.
C Fees and expenses of any underlying Fidelity Central Funds are not included in the Fund's expense ratio. The Fund indirectly bears its proportionate share of the expenses of any underlying Fidelity Central Funds.
D Amount does not include the portfolio activity of any underlying Fidelity Central Funds.
E Expense ratios reflect operating expenses of the class. Expenses before reductions do not reflect amounts reimbursed by the investment adviser or reductions from brokerage service arrangements or reductions from other expense offset arrangements and do not represent the amount paid by the class during periods when reimbursements or reductions occur. Expenses net of fee waivers reflect expenses after reimbursement by the investment adviser but prior to reductions from brokerage service arrangements or other expense offset arrangements. Expenses net of all reductions represent the net expenses paid by the class.
F Amount represents less than $.01 per share.
G Total distributions of $.39 per share is comprised of distributions from net investment income of $.148 and distributions from net realized gain of $.245 per share.
See accompanying notes which are an integral part of the financial statements.
Annual Report
Financial Highlights - Institutional Class
Years ended October 31, | 2013 | 2012 | 2011 | 2010 | 2009 |
Selected Per-Share Data | | | | | |
Net asset value, beginning of period | $ 7.30 | $ 6.67 | $ 7.35 | $ 6.41 | $ 4.91 |
Income from Investment Operations | | | | | |
Net investment income (loss) B | .11 | .14 | .12 | .10 | .07 |
Net realized and unrealized gain (loss) | 1.24 | .59 | (.68) | .95 | 1.55 |
Total from investment operations | 1.35 | .73 | (.56) | 1.05 | 1.62 |
Distributions from net investment income | (.15) | (.10) | (.10) | (.08) | (.12) |
Distributions from net realized gain | (.25) | - | (.02) | (.03) | - |
Total distributions | (.39) G | (.10) | (.12) | (.11) | (.12) |
Redemption fees added to paid in capital B, F | - | - | - | - | - |
Net asset value, end of period | $ 8.26 | $ 7.30 | $ 6.67 | $ 7.35 | $ 6.41 |
Total Return A | 19.40% | 11.06% | (7.72)% | 16.48% | 34.23% |
Ratios to Average Net Assets C, E | | | | | |
Expenses before reductions | 1.21% | 1.27% | 1.48% | 1.82% | 1.80% |
Expenses net of fee waivers, if any | 1.20% | 1.20% | 1.20% | 1.25% | 1.25% |
Expenses net of all reductions | 1.18% | 1.17% | 1.17% | 1.23% | 1.22% |
Net investment income (loss) | 1.46% | 2.13% | 1.69% | 1.40% | 1.38% |
Supplemental Data | | | | | |
Net assets, end of period (000 omitted) | $ 2,372 | $ 1,514 | $ 197 | $ 28 | $ 1,308 |
Portfolio turnover rate D | 89% | 110% | 75% | 67% | 98% |
A Total returns would have been lower if certain expenses had not been reduced during the applicable periods shown.
B Calculated based on average shares outstanding during the period.
C Fees and expenses of any underlying Fidelity Central Funds are not included in the Fund's expense ratio. The Fund indirectly bears its proportionate share of the expenses of any underlying Fidelity Central Funds.
D Amount does not include the portfolio activity of any underlying Fidelity Central Funds.
E Expense ratios reflect operating expenses of the class. Expenses before reductions do not reflect amounts reimbursed by the investment adviser or reductions from brokerage service arrangements or reductions from other expense offset arrangements and do not represent the amount paid by the class during periods when reimbursements or reductions occur. Expenses net of fee waivers reflect expenses after reimbursement by the investment adviser but prior to reductions from brokerage service arrangements or other expense offset arrangements. Expenses net of all reductions represent the net expenses paid by the class.
F Amount represents less than $.01 per share.
G Total distributions of $.39 per share is comprised of distributions from net investment income of $.148 and distributions from net realized gain of $.245 per share.
See accompanying notes which are an integral part of the financial statements.
Annual Report
Notes to Financial Statements
For the period ended October 31, 2013
1. Organization.
Fidelity Total International Equity Fund (the Fund) is a fund of Fidelity Investment Trust (the Trust) and is authorized to issue an unlimited number of shares. The Trust is registered under the Investment Company Act of 1940, as amended (the 1940 Act), as an open-end management investment company organized as a Massachusetts business trust. The Fund offers Class A, Class T, Class C, Total International Equity and Institutional Class shares, each of which, along with Class B shares, has equal rights as to assets and voting privileges. Class B shares are closed to new accounts and additional purchases, except for exchanges and reinvestments. Each class has exclusive voting rights with respect to matters that affect that class. Class B shares will automatically convert to Class A shares after a holding period of seven years from the initial date of purchase. The Fund's investments in emerging markets can be subject to social, economic, regulatory, and political uncertainties and can be extremely volatile.
2. Investments in Fidelity Central Funds.
The Fund invests in Fidelity Central Funds, which are open-end investment companies generally available only to other investment companies and accounts managed by Fidelity Management & Research Company (FMR) and its affiliates. The Fund's Schedule of Investments lists each of the Fidelity Central Funds held as of period end, if any, as an investment of the Fund, but does not include the underlying holdings of each Fidelity Central Fund. As an Investing Fund, the Fund indirectly bears its proportionate share of the expenses of the underlying Fidelity Central Funds.
The Money Market Central Funds seek preservation of capital and current income and are managed by Fidelity Investments Money Management, Inc. (FIMM), an affiliate of FMR.
A complete unaudited list of holdings for each Fidelity Central Fund is available upon request or at the Securities and Exchange Commission (the SEC) website at www.sec.gov. In addition, the financial statements of the Fidelity Central Funds, which are not covered by the Fund's Report of Independent Registered Public Accounting Firm, are available on the SEC website or upon request.
3. Significant Accounting Policies.
The financial statements have been prepared in conformity with accounting principles generally accepted in the United States of America (GAAP), which require management to make certain estimates and assumptions at the date of the financial statements. Actual results could differ from those estimates. Subsequent events, if any, through the date that the financial statements were issued have been evaluated in the preparation of
Annual Report
Notes to Financial Statements - continued
3. Significant Accounting Policies - continued
the financial statements. The following summarizes the significant accounting policies of the Fund:
Investment Valuation. Investments are valued as of 4:00 p.m. Eastern time on the last calendar day of the period. In accordance with valuation policies and procedures approved by the Board of Trustees (the Board), the Fund attempts to obtain prices from one or more third party pricing vendors or brokers to value its investments. When current market prices, quotations or currency exchange rates are not readily available or reliable, investments will be fair valued in good faith by the FMR Fair Value Committee (the Committee), in accordance with procedures adopted by the Board. Factors used in determining fair value vary by investment type and may include market or investment specific events. The frequency with which these procedures are used cannot be predicted and they may be utilized to a significant extent. The Committee oversees the Fund's valuation policies and procedures and is responsible for approving and reporting to the Board all fair value determinations.
The Fund categorizes the inputs to valuation techniques used to value its investments into a disclosure hierarchy consisting of three levels as shown below:
Level 1 - quoted prices in active markets for identical investments
Level 2 - other significant observable inputs (including quoted prices for similar investments, interest rates, prepayment speeds, etc.)
Level 3 - unobservable inputs (including the Fund's own assumptions based on the best information available)
Valuation techniques used to value the Fund's investments by major category are as follows:
Equity securities, including restricted securities, for which market quotations are readily available, are valued at the last reported sale price or official closing price as reported by a third party pricing vendor on the primary market or exchange on which they are traded and are categorized as Level 1 in the hierarchy. In the event there were no sales during the day or closing prices are not available, securities are valued at the last quoted bid price or may be valued using the last available price and are generally categorized as Level 2 in the hierarchy. For foreign equity securities, when market or security specific events arise, comparisons to the valuation of American Depositary Receipts (ADRs), futures contracts, Exchange-Traded Funds (ETFs) and certain indexes as well as quoted prices for similar securities may be used and would be categorized as Level 2 in the hierarchy. Utilizing these techniques may result in transfers between Level 1 and Level 2. For equity securities, including restricted securities, where observable inputs are limited, assumptions about market activity and risk are used and these securities may be categorized as Level 3 in the hierarchy.
Annual Report
3. Significant Accounting Policies - continued
Investment Valuation - continued
Investments in open-end mutual funds, including the Fidelity Central Funds, are valued at their closing net asset value (NAV) each business day and are categorized as Level 1 in the hierarchy.
Changes in valuation techniques may result in transfers in or out of an assigned level within the disclosure hierarchy. The aggregate value of investments by input level, as of October 31, 2013, including information on transfers between Levels 1 and 2 is included at the end of the Fund's Schedule of Investments.
Foreign Currency. The Fund may use foreign currency contracts to facilitate transactions in foreign-denominated securities. Gains and losses from these transactions may arise from changes in the value of the foreign currency or if the counterparties do not perform under the contracts' terms.
Foreign-denominated assets, including investment securities, and liabilities are translated into U.S. dollars at the exchange rates at period end. Purchases and sales of investment securities, income and dividends received and expenses denominated in foreign currencies are translated into U.S. dollars at the exchange rate in effect on the transaction date.
The effects of exchange rate fluctuations on investments are included with the net realized and unrealized gain (loss) on investment securities. Other foreign currency transactions resulting in realized and unrealized gain (loss) are disclosed separately.
Investment Transactions and Income. For financial reporting purposes, the Fund's investment holdings and net asset value include trades executed through the end of the last business day of the period. The NAV per share for processing shareholder transactions is calculated as of the close of business of the New York Stock Exchange (NYSE), normally 4:00 p.m. Eastern time and includes trades executed through the end of the prior business day. Gains and losses on securities sold are determined on the basis of identified cost and may include proceeds received from litigation. Dividend income is recorded on the ex-dividend date, except for certain dividends from foreign securities where the ex-dividend date may have passed, which are recorded as soon as the Fund is informed of the ex-dividend date. Non-cash dividends included in dividend income, if any, are recorded at the fair market value of the securities received. Distributions received on securities that represent a return of capital or capital gain are recorded as a reduction of cost of investments and/or as a realized gain. Subsequent to ex-dividend date the Fund determines the components of these distributions, based upon receipt of tax filings or other correspondence relating to the underlying investment. Interest income and distributions from the Fidelity Central Funds are accrued as earned. Interest income includes coupon interest and amortization of premium and accretion of discount
Annual Report
Notes to Financial Statements - continued
3. Significant Accounting Policies - continued
Investment Transactions and Income - continued
on debt securities. Investment income is recorded net of foreign taxes withheld where recovery of such taxes is uncertain.
Class Allocations and Expenses. Investment income, realized and unrealized capital gains and losses, common expenses of the Fund, and certain fund-level expense reductions, if any, are allocated daily on a pro-rata basis to each class based on the relative net assets of each class to the total net assets of the Fund. Each class differs with respect to transfer agent and distribution and service plan fees incurred. Certain expense reductions may also differ by class. For the reporting period, the allocated portion of income and expenses to each class as a percent of its average net assets may vary due to the timing of recording these transactions in relation to fluctuating net assets of the classes. Expenses directly attributable to a fund are charged to that fund. Expenses attributable to more than one fund are allocated among the respective funds on the basis of relative net assets or other appropriate methods. Expense estimates are accrued in the period to which they relate and adjustments are made when actual amounts are known.
Income Tax Information and Distributions to Shareholders. Each year, the Fund intends to qualify as a regulated investment company under Subchapter M of the Internal Revenue Code, including distributing substantially all of its taxable income and realized gains. As a result, no provision for U.S. Federal income taxes is required. As of October 31, 2013, the Fund did not have any unrecognized tax benefits in the financial statements; nor is the Fund aware of any tax positions for which it is reasonably possible that the total amounts of unrecognized tax benefits will significantly change in the next twelve months. The Fund files a U.S. federal tax return, in addition to state and local tax returns as required. The Fund's federal income tax returns are subject to examination by the Internal Revenue Service (IRS) for a period of three fiscal years after they are filed. State and local tax returns may be subject to examination for an additional fiscal year depending on the jurisdiction. Foreign taxes are provided for based on the Fund's understanding of the tax rules and rates that exist in the foreign markets in which it invests. The Fund is subject to a tax imposed on capital gains by certain countries in which it invests. An estimated deferred tax liability for net unrealized appreciation on the applicable securities is included in Other payables and accrued expenses on the Statement of Assets & Liabilities.
Distributions are declared and recorded on the ex-dividend date. Income dividends and capital gain distributions are declared separately for each class. Income and capital gain distributions are determined in accordance with income tax regulations, which may differ from GAAP.
Annual Report
3. Significant Accounting Policies - continued
Income Tax Information and Distributions to Shareholders - continued
Capital accounts within the financial statements are adjusted for permanent book-tax differences. These adjustments have no impact on net assets or the results of operations. Temporary book-tax differences will reverse in a subsequent period.
Book-tax differences are primarily due to foreign currency transactions, passive foreign investment companies (PFIC), partnerships, capital loss carryforwards and losses deferred due to wash sales.
The federal tax cost of investment securities and unrealized appreciation (depreciation) as of period end were as follows:
Gross unrealized appreciation | $ 63,585,282 |
Gross unrealized depreciation | (5,613,524) |
Net unrealized appreciation (depreciation) on securities and other investments | $ 57,971,758 |
| |
Tax Cost | $ 288,258,467 |
The tax-based components of distributable earnings as of period end were as follows:
Undistributed long-term capital gain | $ 3,268,059 |
Undistributed ordinary income | $ 8,977,623 |
Capital loss carryforward | $ (26,999,061) |
Net unrealized appreciation (depreciation) | $ 57,977,944 |
Capital loss carry forwards are only available to offset future capital gains of the Fund to the extent provided by regulations and may be limited. Under the Regulated Investment Company Modernization Act of 2012 (the Act), the Fund is permitted to carry forward capital losses incurred in taxable years beginning after December 22, 2010 for an unlimited period and such capital losses are required to be used prior to any losses that expire. Capital loss carryforwards were as follows:
Fiscal year of expiration: | |
2016 | $ (2,434,120) |
2017 | (15,708,944) |
2019 | (8,855,997) |
Total capital loss carryforward | $ (26,999,061) |
Due to large subscriptions in a prior period, $26,999,061 of capital losses that will be available to offset future capital gains of the Fund will be limited to approximately $4,535,766 per year.
Annual Report
Notes to Financial Statements - continued
3. Significant Accounting Policies - continued
Income Tax Information and Distributions to Shareholders - continued
The tax character of distributions paid was as follows:
| October 31, 2013 | October 31, 2012 |
Ordinary Income | $ 15,216,010 | $ 1,867,192 |
Long-term | 398,743 | - |
Total | $ 15,614,753 | $ 1,867,192 |
Short-Term Trading (Redemption) Fees. Shares held by investors in the Fund less than 30 days may have been subject to a redemption fee equal to 1.00% of the net asset value of shares redeemed. All redemption fees, which reduce the proceeds of the shareholder redemption, are retained by the Fund and accounted for as an addition to paid in capital.
Delayed Delivery Transactions and When-Issued Securities. During the period, the Fund transacted in securities on a delayed delivery or when-issued basis. Payment and delivery may take place after the customary settlement period for that security. The price of the underlying securities and the date when the securities will be delivered and paid for are fixed at the time the transaction is negotiated. The securities purchased on a delayed delivery or when-issued basis are identified as such in the Fund's Schedule of Investments. The Fund may receive compensation for interest forgone in the purchase of a delayed delivery or when-issued security. With respect to purchase commitments, the Fund identifies securities as segregated in its records with a value at least equal to the amount of the commitment. Losses may arise due to changes in the value of the underlying securities or if the counterparty does not perform under the contract's terms, or if the issuer does not issue the securities due to political, economic, or other factors.
New Accounting Pronouncement. The Financial Accounting Standards Board issued in December 2011, Accounting Standard Update No. 2011-11, Disclosures about Offsetting Assets and Liabilities, and in January 2013, Accounting Standards Update No. 2013-1 Clarifying the Scope of Disclosures about Offsetting Assets and Liabilities. These updates create new disclosure requirements requiring entities to disclose both gross and net information for derivatives and other financial instruments that are either offset in the Statement of Assets and Liabilities or subject to an enforceable master netting arrangement or similar agreement. The disclosure requirements are effective for annual reporting periods beginning on or after January 1, 2013, and interim periods within those annual periods. Management expects that the impact of the updates' adoption will be limited to additional financial statement disclosures as applicable.
Annual Report
4. Derivative Instruments.
Risk Exposures and the Use of Derivative Instruments. The Fund's investment objective allows the Fund to enter into various types of derivative contracts, including futures contracts. Derivatives are investments whose value is primarily derived from underlying assets, indices or reference rates and may be transacted on an exchange or over-the-counter (OTC). Derivatives may involve a future commitment to buy or sell a specified asset based on specified terms, to exchange future cash flows at periodic intervals based on a notional principal amount, or for one party to make one or more payments upon the occurrence of specified events in exchange for periodic payments from the other party.
The Fund used derivatives to increase returns and to manage exposure to certain risks as defined below. The success of any strategy involving derivatives depends on analysis of numerous economic factors, and if the strategies for investment do not work as intended, the Fund may not achieve its objectives.
The Fund's use of derivatives increased or decreased its exposure to the following risks:
Equity Risk | Equity risk relates to the fluctuations in the value of financial instruments as a result of changes in market prices (other than those arising from interest rate risk or foreign exchange risk), whether caused by factors specific to an individual investment, its issuer, or all factors affecting all instruments traded in a market or market segment. |
The Fund is also exposed to additional risks from investing in derivatives, such as liquidity risk and counterparty credit risk. Liquidity risk is the risk that the Fund will be unable to close out the derivative in the open market in a timely manner. Counterparty credit risk is the risk that the counterparty will not be able to fulfill its obligation to the Fund. Counterparty credit risk related to exchange-traded futures contracts may be mitigated by the protection provided by the exchange on which they trade.
Investing in derivatives may involve greater risks than investing in the underlying assets directly and, to varying degrees, may involve risk of loss in excess of any initial investment and collateral received and amounts recognized in the Statement of Assets and Liabilities. In addition, there may be the risk that the change in value of the derivative contract does not correspond to the change in value of the underlying instrument.
Futures Contracts. A futures contract is an agreement between two parties to buy or sell a specified underlying instrument for a fixed price at a specified future date. The Fund used futures contracts to manage its exposure to the stock market.
Upon entering into a futures contract, a fund is required to deposit either cash or securities (initial margin) with a clearing broker in an amount equal to a certain percentage of
Annual Report
Notes to Financial Statements - continued
4. Derivative Instruments - continued
Futures Contracts - continued
the face value of the contract. Futures contracts are marked-to-market daily and subsequent daily payments (variation margin) are made or received by a fund depending on the daily fluctuations in the value of the futures contracts and are recorded as unrealized appreciation or (depreciation). This receivable and/or payable, if any, is included in daily variation margin for derivative instruments in the Statement of Assets and Liabilities. Realized gain or (loss) is recorded upon the expiration or closing of a futures contract.
Any open futures contracts at period end are presented in the Schedule of Investments under the caption "Futures Contracts." The underlying face amount at value reflects each contract's exposure to the underlying instrument or index at period end.
During the period the Fund recognized net realized gain (loss) of $(175,371) related to its investment in futures contracts. This amount is included in the Statement of Operations.
5. Purchases and Sales of Investments.
Purchases and sales of securities, other than short-term securities, aggregated $291,344,236 and $292,758,849, respectively.
6. Fees and Other Transactions with Affiliates.
Management Fee. FMR and its affiliates provide the Fund with investment management related services for which the Fund pays a monthly management fee. The management fee is the sum of an individual fund fee rate that is based on an annual rate of .45% of the Fund's average net assets and an annualized group fee rate that averaged .25% during the period. The group fee rate is based upon the average net assets of all the mutual funds advised by FMR, including any mutual funds previously advised by FMR that are currently advised by Fidelity SelectCo, LLC, an affiliate of FMR. The group fee rate decreases as assets under management increase and increases as assets under management decrease. In addition, the management fee is subject to a performance adjustment (up to a maximum of ± .20% of the Fund's average net assets over a 36 month performance period). The upward or downward adjustment to the management fee is based on the relative investment performance of Total International Equity as compared to an appropriate benchmark index over the same 36 month performance period. For the reporting period, the total annual management fee rate, including the performance adjustment, was .77% of the Fund's average net assets. The performance adjustment included in the management fee rate may be higher or lower than the maximum performance adjustment rate due to the difference between the average net assets for the reporting and performance periods.
Annual Report
6. Fees and Other Transactions with Affiliates - continued
Distribution and Service Plan Fees. In accordance with Rule 12b-1 of the 1940 Act, the Fund has adopted separate Distribution and Service Plans for each class of shares. Certain classes pay Fidelity Distributors Corporation (FDC), an affiliate of FMR, separate Distribution and Service Fees, each of which is based on an annual percentage of each class' average net assets. In addition, FDC may pay financial intermediaries for selling shares of the Fund and providing shareholder support services. For the period, the Distribution and Service Fee rates, total fees and amounts retained by FDC were as follows:
| Distribution
Fee | Service
Fee | Total Fees | Retained
by FDC |
Class A | -% | .25% | $ 19,245 | $ 355 |
Class T | .25% | .25% | 26,314 | 52 |
Class B | .75% | .25% | 2,095 | 1,584 |
Class C | .75% | .25% | 31,831 | 4,423 |
| | | $ 79,485 | $ 6,414 |
Sales Load. FDC may receive a front-end sales charge of up to 5.75% for selling Class A shares and 3.50% for selling Class T shares, some of which is paid to financial intermediaries for selling shares of the Fund. Depending on the holding period, FDC may receive contingent deferred sales charges levied on Class A, Class T, Class B, and Class C redemptions. The deferred sales charges range from 5.00% to 1.00% for Class B shares, 1.00% for Class C shares, 1.00% for certain purchases of Class A shares and .25% for certain purchases of Class T shares. For the period, sales charge amounts retained by FDC were as follows:
| Retained
by FDC |
Class A | $ 3,610 |
Class T | 1,591 |
Class B* | 630 |
Class C* | 352 |
| $ 6,183 |
* When Class B and Class C shares are initially sold, FDC pays commissions from its own resources to financial intermediaries through which the sales are made.
Transfer Agent Fees. Fidelity Investments Institutional Operations Company, Inc., (FIIOC), an affiliate of FMR, is the transfer, dividend disbursing and shareholder servicing agent for each class of the Fund. FIIOC receives account fees and asset-based fees that vary according to the account size and type of account of the shareholders of the respective classes of the Fund. FIIOC pays for typesetting, printing and mailing of shareholder reports, except proxy statements.
Annual Report
Notes to Financial Statements - continued
6. Fees and Other Transactions with Affiliates - continued
Transfer Agent Fees - continued
For the period, transfer agent fees for each class were as follows:
| Amount | % of
Average
Net Assets* |
Class A | $ 22,457 | .29 |
Class T | 15,623 | .29 |
Class B | 627 | .30 |
Class C | 9,616 | .30 |
Total International Equity | 424,331 | .13 |
Institutional Class | 5,472 | .26 |
| $ 478,126 | |
Accounting and Security Lending Fees. Fidelity Service Company, Inc. (FSC), an affiliate of FMR, maintains the Fund's accounting records. The accounting fee is based on the level of average net assets for each month. Under a separate contract, FSC administers the security lending program. The security lending fee is based on the number and duration of lending transactions.
Brokerage Commissions. The Fund placed a portion of its portfolio transactions with brokerage firms which are affiliates of the investment adviser. Brokerage commissions are included in net realized gain (loss) and change in net unrealized appreciation (depreciation) in the Statement of Operations. The commissions paid to these affiliated firms were $625 for the period.
7. Committed Line of Credit.
The Fund participates with other funds managed by FMR or an affiliate in a $4.25 billion credit facility (the "line of credit") to be utilized for temporary or emergency purposes to fund shareholder redemptions or for other short-term liquidity purposes. The Fund has agreed to pay commitment fees on its pro-rata portion of the line of credit, which amounted to $721 and is reflected in Miscellaneous expenses on the Statement of Operations. During the period, there were no borrowings on this line of credit.
8. Security Lending.
The Fund lends portfolio securities through a lending agent from time to time in order to earn additional income. For equity securities, a lending agent is used and may loan securities to certain qualified borrowers, including Fidelity Capital Markets (FCM), a broker-dealer affiliated with the Fund. On the settlement date of the loan, the Fund
Annual Report
8. Security Lending - continued
receives collateral (in the form of U.S. Treasury obligations, letters of credit and/or cash) against the loaned securities and maintains collateral in an amount not less than 100% of the market value of the loaned securities during the period of the loan. The market value of the loaned securities is determined at the close of business of the Fund and any additional required collateral is delivered to the Fund on the next business day. If the borrower defaults on its obligation to return the securities loaned because of insolvency or other reasons, the Fund may apply collateral received from the borrower against the obligation. The Fund may experience delays and costs in recovering the securities loaned. Any cash collateral received is invested in the Fidelity Securities Lending Cash Central Fund. At period end, there were no security loans outstanding. Security lending income represents the income earned on investing cash collateral, less rebates paid to borrowers and any lending agent fees associated with the loan, plus any premium payments received for lending certain types of securities. Security lending income is presented in the Statement of Operations as a component of income from Fidelity Central Funds. Total security lending income during the period amounted to $117,973. During the period, there were no securities loaned to FCM.
9. Expense Reductions.
FMR contractually agreed to reimburse each class to the extent annual operating expenses exceeded certain levels of average net assets as noted in the table below. This reimbursement will remain in place through December 31, 2014. Some expenses, for example interest expense, including commitment fees, are excluded from this reimbursement.
The following classes were in reimbursement during the period:
| Expense
Limitations | Reimbursement |
Class A | 1.45% | $ 3,717 |
Class T | 1.70% | 2,651 |
Class B | 2.20% | 120 |
Class C | 2.20% | 1,829 |
Institutional Class | 1.20% | 308 |
| | $ 8,625 |
Commissions paid to certain brokers with whom FMR, or its affiliates, places trades include an amount in addition to trade execution, which may be rebated back to the Fund to offset certain expenses. This amount totaled $73,605 for the period.
In addition, FMR reimbursed a portion of the Fund's operating expenses during the period in the amount of $3,737.
Annual Report
Notes to Financial Statements - continued
10. Distributions to Shareholders.
Distributions to shareholders of each class were as follows:
Years ended October 31, | 2013 | 2012 |
From net investment income | | |
Class A | $ 102,760 | $ 48,329 |
Class T | 49,034 | 9,062 |
Class B | 1,541 | 714 |
Class C | 28,314 | 4,731 |
Total International Equity | 5,630,153 | 1,801,469 |
Institutional Class | 33,750 | 2,887 |
Total | $ 5,845,552 | $ 1,867,192 |
From net realized gain | | |
Class A | $ 199,811 | $ - |
Class T | 93,853 | - |
Class B | 6,990 | - |
Class C | 92,492 | - |
Total International Equity | 9,320,186 | - |
Institutional Class | 55,869 | - |
Total | $ 9,769,201 | $ - |
11. Share Transactions.
Transactions for each class of shares were as follows:
| Shares | Dollars |
Years ended October 31, | 2013 | 2012 | 2013 | 2012 |
Class A | | | | |
Shares sold | 510,102 | 388,955 | $ 3,880,513 | $ 2,677,369 |
Reinvestment of distributions | 41,103 | 7,157 | 293,886 | 46,237 |
Shares redeemed | (248,440) | (252,362) | (1,903,860) | (1,699,392) |
Net increase (decrease) | 302,765 | 143,750 | $ 2,270,539 | $ 1,024,214 |
Class T | | | | |
Shares sold | 807,518 | 207,939 | $ 6,202,497 | $ 1,463,372 |
Reinvestment of distributions | 19,724 | 1,377 | 142,209 | 8,993 |
Shares redeemed | (195,438) | (38,757) | (1,518,035) | (259,817) |
Net increase (decrease) | 631,804 | 170,559 | $ 4,826,671 | $ 1,212,548 |
Class B | | | | |
Shares sold | 827 | 4,797 | $ 6,304 | $ 32,306 |
Reinvestment of distributions | 1,165 | 108 | 8,437 | 705 |
Shares redeemed | (8,955) | (12,955) | (69,218) | (88,815) |
Net increase (decrease) | (6,963) | (8,050) | $ (54,477) | $ (55,804) |
Annual Report
11. Share Transactions - continued
| Shares | Dollars |
Years ended October 31, | 2013 | 2012 | 2013 | 2012 |
Class C | | | | |
Shares sold | 129,341 | 258,694 | $ 986,204 | $ 1,733,640 |
Reinvestment of distributions | 12,546 | 710 | 90,328 | 4,622 |
Shares redeemed | (83,065) | (94,222) | (635,648) | (638,538) |
Net increase (decrease) | 58,822 | 165,182 | $ 440,884 | $ 1,099,724 |
Total International Equity | | | | |
Shares sold | 10,376,724 | 32,478,543 | $ 77,880,274 | $ 209,916,522 |
Reinvestment of distributions | 2,062,441 | 266,160 | 14,746,450 | 1,719,395 |
Shares redeemed | (11,840,491) | (13,867,286) | (90,585,484) | (93,416,780) |
Net increase (decrease) | 598,674 | 18,877,417 | $ 2,041,240 | $ 118,219,137 |
Institutional Class | | | | |
Shares sold | 142,800 | 198,611 | $ 1,078,337 | $ 1,289,078 |
Reinvestment of distributions | 12,587 | 448 | 89,619 | 2,887 |
Shares redeemed | (75,629) | (21,161) | (583,086) | (144,436) |
Net increase (decrease) | 79,758 | 177,898 | $ 584,870 | $ 1,147,529 |
12. Other.
The Fund's organizational documents provide former and current trustees and officers with a limited indemnification against liabilities arising in connection with the performance of their duties to the Fund. In the normal course of business, the Fund may also enter into contracts that provide general indemnifications. The Fund's maximum exposure under these arrangements is unknown as this would be dependent on future claims that may be made against the Fund. The risk of material loss from such claims is considered remote.
At the end of the period, a shareholder of record owned approximately 71% of the total outstanding shares of the Fund.
Annual Report
To the Trustees of Fidelity Investment Trust and Shareholders of Fidelity Total International Equity Fund:
We have audited the accompanying statement of assets and liabilities of Fidelity Total International Equity Fund (the Fund), a fund of Fidelity Investment Trust, including the schedule of investments, as of October 31, 2013, and the related statement of operations for the year then ended, the statement of changes in net assets for each of the two years in the period then ended, and the financial highlights for each of the five years in the period then ended. These financial statements and financial highlights are the responsibility of the Fund's management. Our responsibility is to express an opinion on these financial statements and financial highlights based on our audits.
We conducted our audits in accordance with the standards of the Public Company Accounting Oversight Board (United States). Those standards require that we plan and perform the audit to obtain reasonable assurance about whether the financial statements and financial highlights are free of material misstatement. The Fund is not required to have, nor were we engaged to perform, an audit of its internal control over financial reporting. Our audits included consideration of internal control over financial reporting as a basis for designing audit procedures that are appropriate in the circumstances, but not for the purpose of expressing an opinion on the effectiveness of the Fund's internal control over financial reporting. Accordingly, we express no such opinion. An audit also includes examining, on a test basis, evidence supporting the amounts and disclosures in the financial statements, assessing the accounting principles used and significant estimates made by management, as well as evaluating the overall financial statement presentation. Our procedures included confirmation of securities owned as of October 31, 2013, by correspondence with the custodians and brokers; where replies were not received from brokers, we performed other auditing procedures. We believe that our audits provide a reasonable basis for our opinion.
In our opinion, the financial statements and financial highlights referred to above present fairly, in all material respects, the financial position of Fidelity Total International Equity Fund as of October 31, 2013, the results of its operations for the year then ended, the changes in its net assets for each of the two years in the period then ended, and the financial highlights for each of the five years in the period then ended, in conformity with accounting principles generally accepted in the United States of America.
DELOITTE & TOUCHE LLP
Boston, Massachusetts
December 11, 2013
Annual Report
The Trustees, Member of the Advisory Board, and executive officers of the trust and fund, as applicable, are listed below. The Board of Trustees governs the fund and is responsible for protecting the interests of shareholders. The Trustees are experienced executives who meet periodically throughout the year to oversee the fund's activities, review contractual arrangements with companies that provide services to the fund, oversee management of the risks associated with such activities and contractual arrangements, and review the fund's performance. Except for James C. Curvey, Ned C. Lautenbach, Ronald P. O'Hanley, and William S. Stavropoulos, each of the Trustees oversees 171 funds. Mr. Curvey oversees 394 funds. Mr. Lautenbach, Mr. O'Hanley, and Mr. Stavropoulos each oversees 245 funds.
The Trustees hold office without limit in time except that (a) any Trustee may resign; (b) any Trustee may be removed by written instrument, signed by at least two-thirds of the number of Trustees prior to such removal; (c) any Trustee who requests to be retired or who has become incapacitated by illness or injury may be retired by written instrument signed by a majority of the other Trustees; and (d) any Trustee may be removed at any special meeting of shareholders by a two-thirds vote of the outstanding voting securities of the trust. Each Trustee who is not an interested person of the trust and the fund (as defined in the 1940 Act) (Independent Trustee), shall retire not later than the last day of the calendar year in which his or her 75th birthday occurs. The Independent Trustees may waive this mandatory retirement age policy with respect to individual Trustees. The executive officers and Advisory Board Member hold office without limit in time, except that any officer and Advisory Board Member may resign or may be removed by a vote of a majority of the Trustees at any regular meeting or any special meeting of the Trustees. Except as indicated, each individual has held the office shown or other offices in the same company for the past five years.
Experience, Skills, Attributes, and Qualifications of the Fund's Trustees. The Governance and Nominating Committee has adopted a statement of policy that describes the experience, qualifications, attributes, and skills that are necessary and desirable for potential Independent Trustee candidates (Statement of Policy). The Board believes that each Trustee satisfied at the time he or she was initially elected or appointed a Trustee, and continues to satisfy, the standards contemplated by the Statement of Policy. The Governance and Nominating Committee also engages professional search firms to help identify potential Independent Trustee candidates who have the experience, qualifications, attributes, and skills consistent with the Statement of Policy. From time to time, additional criteria based on the composition and skills of the current Independent Trustees, as well as experience or skills that may be appropriate in light of future changes to board composition, business conditions, and regulatory or other developments, have also been considered by the professional search firms and the Governance and Nominating Committee. In addition, the Board takes into account the Trustees' commitment and participation in Board and committee meetings, as well as their leadership of standing and ad hoc committees throughout their tenure.
Annual Report
In determining that a particular Trustee was and continues to be qualified to serve as a Trustee, the Board has considered a variety of criteria, none of which, in isolation, was controlling. The Board believes that, collectively, the Trustees have balanced and diverse experience, qualifications, attributes, and skills, which allow the Board to operate effectively in governing the fund and protecting the interests of shareholders. Information about the specific experience, skills, attributes, and qualifications of each Trustee, which in each case led to the Board's conclusion that the Trustee should serve (or continue to serve) as a trustee of the fund, is provided below.
Board Structure and Oversight Function. James C. Curvey is an interested person (as defined in the 1940 Act) and currently serves as Chairman. The Trustees have determined that an interested Chairman is appropriate and benefits shareholders because an interested Chairman has a personal and professional stake in the quality and continuity of services provided to the fund. Independent Trustees exercise their informed business judgment to appoint an individual of their choosing to serve as Chairman, regardless of whether the Trustee happens to be independent or a member of management. The Independent Trustees have determined that they can act independently and effectively without having an Independent Trustee serve as Chairman and that a key structural component for assuring that they are in a position to do so is for the Independent Trustees to constitute a substantial majority for the Board. The Independent Trustees also regularly meet in executive session. Ned C. Lautenbach serves as Chairman of the Independent Trustees and as such (i) acts as a liaison between the Independent Trustees and management with respect to matters important to the Independent Trustees and (ii) with management prepares agendas for Board meetings.
Fidelity funds are overseen by different Boards of Trustees. The fund's Board oversees Fidelity's equity and high income funds and another Board oversees Fidelity's investment-grade bond, money market, and asset allocation funds. The asset allocation funds may invest in Fidelity funds overseen by the fund's Board. The use of separate Boards, each with its own committee structure, allows the Trustees of each group of Fidelity funds to focus on the unique issues of the funds they oversee, including common research, investment, and operational issues. On occasion, the separate Boards establish joint committees to address issues of overlapping consequences for the Fidelity funds overseen by each Board.
The Trustees operate using a system of committees to facilitate the timely and efficient consideration of all matters of importance to the Trustees, the fund, and fund shareholders and to facilitate compliance with legal and regulatory requirements and oversight of the fund's activities and associated risks. The Board, acting through its committees, has charged FMR and its affiliates with (i) identifying events or circumstances the occurrence of which could have demonstrably adverse effects on the fund's business and/or reputation; (ii) implementing processes and controls to lessen the possibility that such events or circumstances occur or to mitigate the effects of such events or circumstances if they do occur; and (iii) creating and maintaining a system designed to evaluate continuously business and market conditions in order to facilitate the identification and implementation processes described in (i) and (ii) above. Because the day-to-day operations and activities of the fund are carried out by or through FMR, its affiliates and other service providers, the fund's exposure to risks is mitigated but not eliminated by the processes overseen by the Trustees. While each of the Board's committees has responsibility for overseeing different aspects of the fund's activities, oversight is exercised primarily through the Operations, Audit, and Compliance Committees. In addition, the Independent Trustees have worked with FMR to enhance the Board's oversight of investment and financial risks, legal and regulatory risks, technology risks, and operational risks, including the development of additional risk reporting to the Board. For example, a working group comprised of Independent Trustees and FMR has worked and continues to work to review the Fidelity funds' valuation-related activities, reporting and risk management. Appropriate personnel, including but not limited to the fund's Chief Compliance Officer (CCO), FMR's internal auditor, the independent accountants, the fund's Treasurer and portfolio management personnel, make periodic reports to the Board's committees, as appropriate, including an annual review of FMR's risk management program for the Fidelity funds. The responsibilities of each standing committee, including their oversight responsibilities, are described further under "Standing Committees of the Fund's Trustees."
Annual Report
Trustees and Officers - continued
The fund's Statement of Additional Information (SAI) includes more information about the Trustees. To request a free copy, call Fidelity at 1-877-208-0098.
Interested Trustees*:
Correspondence intended for each Trustee who is an interested person may be sent to Fidelity Investments, 245 Summer Street, Boston, Massachusetts 02210.
Name, Year of Birth; Principal Occupations and Other Relevant Experience+ |
James C. Curvey (1935) |
Year of Election or Appointment: 2007 Trustee Chairman of the Board of Trustees |
| Mr. Curvey also serves as Trustee of other Fidelity funds. Mr. Curvey is a Director of Fidelity Investments Money Management, Inc. (2009-present), Director of Fidelity Research & Analysis Co. (2009-present) and Director of FMR and FMR Co., Inc. (2007-present). Mr. Curvey is also Vice Chairman (2007-present) and Director of FMR LLC. In addition, Mr. Curvey serves as an Overseer for the Boston Symphony Orchestra and a member of the Trustees of Villanova University. Previously, Mr. Curvey was the Vice Chairman (2006-2007) and Director (2000-2007) of FMR Corp. |
Ronald P. O'Hanley (1957) |
Year of Election or Appointment: 2011 Trustee |
| Mr. O'Hanley also serves as Trustee of other Fidelity funds. He is Director of Fidelity SelectCo, LLC (2013-present), FMR Co., Inc. (2010-present), Director of Fidelity Investments Money Management, Inc. (2010-present), Director of Fidelity Research & Analysis Company (2010-present), President of Fidelity Asset Management and Corporate Services and a Member of Fidelity's Executive Committee (2010-present). Previously, Mr. O'Hanley served as President and Chief Executive Officer of BNY Mellon Asset Management (2007-2010). Mr. O'Hanley also served as Vice Chairman of Bank New York Mellon Corp. and a member of that firm's Executive Committee. Prior to the 2007 merger of The Bank of New York and Mellon Financial Corporation, he was Vice Chairman of Mellon Financial Corporation and President and Chief Executive Officer of Mellon Asset Management. He joined Mellon in February 1997. Mr. O'Hanley currently serves as Chairman of the Boston Public Library Foundation Board of Directors and sits on the Board of Directors of Beth Israel Deaconess Medical Center, the Board of Trustees of the Marine Biological Laboratory and the Advisory Board of the Maxwell School of Citizenship and Public Administration at Syracuse University. Mr. O'Hanley also chairs the Council on Asset Management for the Financial Services Roundtable and is a member of the Board of Directors of Institutional Investor's U.S. Institute. |
* Trustees have been determined to be "Interested Trustees" by virtue of, among other things, their affiliation with the trust or various entities under common control with FMR.
+ The information above includes each Trustee's principal occupation during the last five years and other information relating to the experience, attributes, and skills relevant to each Trustee's qualifications to serve as a Trustee, which led to the conclusion that each Trustee should serve as a Trustee for the fund.
Annual Report
Trustees and Officers - continued
Independent Trustees:
Correspondence intended for each Independent Trustee (that is, the Trustees other than the Interested Trustees) may be sent to Fidelity Investments, P.O. Box 55235, Boston, Massachusetts 02205-5235.
Name, Year of Birth; Principal Occupations and Other Relevant Experience+ |
Dennis J. Dirks (1948) |
Year of Election or Appointment: 2005 Trustee |
| Mr. Dirks also serves as Trustee of other Fidelity funds. Prior to his retirement in May 2003, Mr. Dirks was Chief Operating Officer and a member of the Board of The Depository Trust & Clearing Corporation (DTCC). He also served as President, Chief Operating Officer, and Board member of The Depository Trust Company (DTC) and President and Board member of the National Securities Clearing Corporation (NSCC). In addition, Mr. Dirks served as Chief Executive Officer and Board member of the Government Securities Clearing Corporation, Chief Executive Officer and Board member of the Mortgage-Backed Securities Clearing Corporation, as a Trustee and a member of the Finance Committee of Manhattan College (2005-2008), and as a Trustee and a member of the Finance Committee of AHRC of Nassau County (2006-2008). Mr. Dirks is a member of the Independent Directors Council (IDC) Governing Council (2010-present) and Board of Directors for The Brookville Center for Children's Services, Inc. (2009-present). |
Alan J. Lacy (1953) |
Year of Election or Appointment: 2008 Trustee |
| Mr. Lacy also serves as Trustee of other Fidelity funds. Mr. Lacy serves as Senior Adviser (2007-present) of Oak Hill Capital Partners, L.P. (private equity). Mr. Lacy also served as Chief Executive Officer (2000-2005) and Vice Chairman (2005-2006) of Sears Holdings Corporation and Sears, Roebuck and Co. (retail). In addition, Mr. Lacy serves as a member of the Board of Directors of Dave & Buster's Entertainment, Inc. (restaurant and entertainment complexes, 2010-present), Earth Fare, Inc. (retail grocery, 2012-present), The Hillman Companies, Inc. (hardware wholesalers, 2010-present), and Bristol-Myers Squibb Company (global pharmaceuticals, 2008-present). Mr. Lacy is a member of the Board of Trustees of The National Parks Conservation Association (2006-present). Previously, Mr. Lacy served as Chairman of the Board of Trustees of the National Parks Conservation Association (2008-2011) and as a member of the Board of Directors for the Western Union Company (global money transfer, 2006-2011). |
Ned C. Lautenbach (1944) |
Year of Election or Appointment: 2000 Trustee Chairman of the Independent Trustees |
| Mr. Lautenbach also serves as Trustee of other Fidelity funds. Mr. Lautenbach currently serves as the Lead Director of the Eaton Corporation Board of Directors (diversified industrial, 1997-present). Mr. Lautenbach is Chairman of the Board of Directors of the Philharmonic Center for the Arts in Naples, Florida (2012-present) and a member of the Council on Foreign Relations (1994-present). Previously, Mr. Lautenbach was a Partner/Advisory Partner at Clayton, Dubilier & Rice, LLC (private equity investment, 1998-2010), as well as a Director of Sony Corporation (2006-2007). |
Joseph Mauriello (1944) |
Year of Election or Appointment: 2008 Trustee |
| Mr. Mauriello also serves as Trustee of other Fidelity funds. Prior to his retirement in January 2006, Mr. Mauriello served in numerous senior management positions including Deputy Chairman and Chief Operating Officer (2004-2005), and Vice Chairman of Financial Services (2002-2004) of KPMG LLP US (professional services, 1965-2005). Mr. Mauriello currently serves as a member of the Board of Directors of XL Group plc. (global insurance and re-insurance, 2006-present). Previously, Mr. Mauriello served as a Director of the Hamilton Funds of the Bank of New York (2006-2007) and of Arcadia Resources Inc. (health care services and products, 2007-2012). |
Robert W. Selander (1950) |
Year of Election or Appointment: 2011 Trustee |
| Mr. Selander also serves as Trustee of other Fidelity funds. Previously, Mr. Selander served as a Member of the Advisory Board of other Fidelity funds (2011), and Executive Vice Chairman (2010), Chief Executive Officer (2009-2010), and President and Chief Executive Officer (1997-2009) of Mastercard, Inc. |
Cornelia M. Small (1944) |
Year of Election or Appointment: 2005 Trustee |
| Ms. Small also serves as Trustee of other Fidelity funds. Ms. Small is a member of the Board of Directors (2009-present) and Chair of the Investment Committee (2010-present) of the Teagle Foundation. Ms. Small also serves on the Investment Committee of the Berkshire Taconic Community Foundation (2008-present). Previously, Ms. Small served as Chairperson (2002-2008) and a member of the Investment Committee and Chairperson (2008-2012) and a member of the Board of Trustees of Smith College. In addition, Ms. Small served as Chief Investment Officer, Director of Global Equity Investments, and a member of the Board of Directors of Scudder, Stevens & Clark and Scudder Kemper Investments. |
William S. Stavropoulos (1939) |
Year of Election or Appointment: 2001 Trustee Vice Chairman of the Independent Trustees |
| Mr. Stavropoulos also serves as Trustee of other Fidelity funds. Mr. Stavropoulos serves as President and Founder of the Michigan Baseball Foundation, the Great Lakes Loons (2007-present). Mr. Stavropoulos is Chairman Emeritus of the Board of Directors of The Dow Chemical Company, where he previously served in numerous senior management positions, including President, CEO (1995-2000; 2002-2004), Chairman of the Executive Committee (2000-2006), and as a member of the Board of Directors (1990-2006). Currently, Mr. Stavropoulos is Chairman of the Board of Directors of Univar Inc. (global distributor of commodity and specialty chemicals), a Director of Teradata Corporation (data warehousing and technology solutions), and Maersk Inc. (industrial conglomerate), and a member of the Advisory Board for Metalmark Capital LLC (private equity investment, 2005-present). Mr. Stavropoulos is an operating advisor to Clayton, Dubilier & Rice, LLC (private equity investment). In addition, Mr. Stavropoulos is a member of the University of Notre Dame Advisory Council for the College of Science, a Trustee of the Rollin L. Gerstacker Foundation, and a Director of the Naples Philharmonic Center for the Arts. Previously, Mr. Stavropoulos served as a Director of Chemical Financial Corporation (bank holding company, 1993-2012) and Tyco International, Ltd. (multinational manufacturing and services, 2007-2012). |
David M. Thomas (1949) |
Year of Election or Appointment: 2008 Trustee |
| Mr. Thomas also serves as Trustee of other Fidelity funds. Mr. Thomas serves as Non-Executive Chairman of the Board of Directors of Fortune Brands Home and Security (home and security products, 2011-present), and as a member of the Board of Directors of Interpublic Group of Companies, Inc. (marketing communication, 2004-present). Previously, Mr. Thomas served as Executive Chairman (2005-2006) and Chairman and Chief Executive Officer (2000-2005) of IMS Health, Inc. (pharmaceutical and healthcare information solutions), and a Director of Fortune Brands, Inc. (consumer products, 2000-2011). |
+ The information above includes each Trustee's principal occupation during the last five years and other information relating to the experience, attributes, and skills relevant to each Trustee's qualifications to serve as a Trustee, which led to the conclusion that each Trustee should serve as a Trustee for the fund.
Advisory Board Member and Executive Officers:
Correspondence intended for each executive officer and Peter S. Lynch may be sent to Fidelity Investments, 245 Summer Street, Boston, Massachusetts 02210. Executive officers appear below in alphabetical order.
Name, Year of Birth; Principal Occupation |
Peter S. Lynch (1944) |
Year of Election or Appointment: 2003 Member of the Advisory Board |
| Mr. Lynch also serves as Member of the Advisory Board of other Fidelity funds. Mr. Lynch is Vice Chairman and a Director of FMR and FMR Co., Inc. In addition, Mr. Lynch serves as a Trustee of Boston College and as the Chairman of the Inner-City Scholarship Fund. Previously, Mr. Lynch served on the Special Olympics International Board of Directors (1997-2006). |
Elizabeth Paige Baumann (1968) |
Year of Election or Appointment: 2012 Anti-Money Laundering (AML) Officer |
| Ms. Baumann also serves as AML Officer of other funds. She is Chief AML Officer of FMR LLC (2012-present) and is an employee of Fidelity Investments. Previously, Ms. Baumann served as Vice President and Deputy Anti-Money Laundering Officer (2007-2012). |
William C. Coffey (1969) |
Year of Election or Appointment: 2009 Assistant Secretary |
| Mr. Coffey also serves as Assistant Secretary of other funds. He is Senior Vice President and Deputy General Counsel of FMR LLC (2010-present), and is an employee of Fidelity Investments. Previously, Mr. Coffey served as Vice President and Associate General Counsel of FMR LLC (2005-2009). |
Jonathan Davis (1968) |
Year of Election or Appointment: 2010 Assistant Treasurer |
| Mr. Davis also serves as Assistant Treasurer of other funds. Mr. Davis is an employee of Fidelity Investments. Previously, Mr. Davis served as Vice President and Associate General Counsel of FMR LLC (2003-2010). |
Adrien E. Deberghes (1967) |
Year of Election or Appointment: 2008 Deputy Treasurer |
| Mr. Deberghes also serves as an officer of other funds. He is an employee of Fidelity Investments (2008-present). Prior to joining Fidelity Investments, Mr. Deberghes was Senior Vice President of Mutual Fund Administration at State Street Corporation (2007-2008), Senior Director of Mutual Fund Administration at Investors Bank & Trust (2005-2007), and Director of Finance for Dunkin' Brands (2000-2005). |
Stephanie J. Dorsey (1969) |
Year of Election or Appointment: 2010 Assistant Treasurer |
| Ms. Dorsey also serves as an officer of other funds. She is an employee of Fidelity Investments (2008-present) and has served in other fund officer roles. Prior to joining Fidelity Investments, Ms. Dorsey served as Treasurer (2004-2008) of the JPMorgan Mutual Funds and Vice President (2004-2008) of JPMorgan Chase Bank. |
Scott C. Goebel (1968) |
Year of Election or Appointment: 2008 Secretary and Chief Legal Officer (CLO) |
| Mr. Goebel serves as Secretary and CLO of other funds. Mr. Goebel also serves as Secretary of Fidelity Investments Money Management, Inc. (FIMM) (2010-present) and Fidelity Research and Analysis Company (FRAC) (2010-present); General Counsel, Secretary, and Senior Vice President of FMR (2008-present) and FMR Co., Inc. (2008-present); Chief Legal Officer of Fidelity Management & Research (Hong Kong) Limited (2008-present) and Assistant Secretary of Fidelity Management & Research (Japan) Inc. (2008-present), and Fidelity Management & Research (U.K.) Inc. (2008-present). Previously, Mr. Goebel served as Secretary and CLO of other Fidelity funds (2008-2013), Assistant Secretary of FIMM (2008-2010), FRAC (2008-2010), and certain funds (2007-2008); and as Vice President and Secretary of Fidelity Distributors Corporation (FDC) (2005-2007). Mr. Goebel has been employed by FMR LLC or an affiliate since 2001. |
Joseph A. Hanlon (1968) |
Year of Election or Appointment: 2012 Chief Compliance Officer |
| Mr. Hanlon also serves as Chief Compliance Officer of other funds. Mr. Hanlon serves as Compliance Officer of FMR, FMR Co., Inc., Fidelity Investments Money Management, Inc. (FIMM), Fidelity Research and Analysis Company (FRAC), and Fidelity Management & Research (Hong Kong) (2009-present), as Senior Vice President of the Fidelity Asset Management Division (2009-present), and is an employee of Fidelity Investments. Previously, Mr. Hanlon served as Compliance Officer of Fidelity Management & Research (Japan) Inc. (2009-2013), Strategic Advisers, Inc. (2009-2013), and Fidelity Management & Research (U.K.) Inc. (2009-2013). |
Bruce T. Herring (1965) |
Year of Election or Appointment: 2006 Vice President of certain Equity Funds |
| Mr. Herring also serves as Vice President of other funds. He serves as Chief Investment Officer of Fidelity Global Asset Allocation (GAA) (2013-present), Chief Investment Officer and Director of Fidelity Management & Research (U.K.) Inc. (2010-present), Group Chief Investment Officer of FMR, and President of Fidelity Research & Analysis Company (2010-present). Previously, Mr. Herring served as Vice President (2005-2006) and Senior Vice President (2006-2007) of Fidelity Management & Research Company, Vice President of FMR Co., Inc. (2001-2007), and as a portfolio manager for Fidelity U.S. Equity Funds. |
Brian B. Hogan (1964) |
Year of Election or Appointment: 2009 Vice President |
| Mr. Hogan also serves as Vice President of other funds. Mr. Hogan serves as President of FMR's Equity Division (2009-present). Previously, Mr. Hogan served as Senior Vice President, Equity Research of FMR (2006-2009) and as a portfolio manager. |
Chris Maher (1972) |
Year of Election or Appointment: 2013 Assistant Treasurer |
| Mr. Maher serves as Assistant Treasurer of other funds. Mr. Maher is Vice President of Valuation Oversight and is an employee of Fidelity Investments. Previously, Mr. Maher served as Vice President of Asset Management Compliance (2013), Vice President of FMR's Program Management Group (2010-2013), and Vice President of Valuation Oversight (2008-2010). |
Christine Reynolds (1958) |
Year of Election or Appointment: 2008 Chief Financial Officer |
| Ms. Reynolds also serves as Chief Financial Officer of other funds. Ms. Reynolds became President of Fidelity Pricing and Cash Management Services (FPCMS) in August 2008. Ms. Reynolds served as Chief Operating Officer of FPCMS (2007-2008). Previously, Ms. Reynolds served as President, Treasurer, and Anti-Money Laundering officer of the Fidelity funds (2004-2007). |
Kenneth B. Robins (1969) |
Year of Election or Appointment: 2008 President and Treasurer |
| Mr. Robins also serves as an officer of other funds. Mr. Robins serves as Executive Vice President of Fidelity Investments Money Management, Inc. (FIMM) (2013-present) and is an employee of Fidelity Investments (2004-present). Previously, Mr. Robins served in other fund officer roles. |
Gary W. Ryan (1958) |
Year of Election or Appointment: 2005 Assistant Treasurer |
| Mr. Ryan also serves as Assistant Treasurer of other funds. Mr. Ryan is an employee of Fidelity Investments and has served in other fund officer roles. Previously, Mr. Ryan served as Vice President of Fund Reporting in Fidelity Pricing and Cash Management Services (FPCMS) (1999-2005). |
Stephen Sadoski (1971) |
Year of Election or Appointment: 2012 Deputy Treasurer |
| Mr. Sadoski also serves as Deputy Treasurer of other funds. He is an employee of Fidelity Investments (2012-present) and has served in another fund officer role. Prior to joining Fidelity Investments, Mr. Sadoski served as an assistant chief accountant in the Division of Investment Management of the Securities and Exchange Commission (SEC) (2009-2012) and as a senior manager at Deloitte & Touche LLP (1997-2009). |
Stacie M. Smith (1974) |
Year of Election or Appointment: 2013 Deputy Treasurer |
| Ms. Smith also serves as an officer of other funds. She is an employee of Fidelity Investments (2009-present) and has served in other fund officer roles. Prior to joining Fidelity Investments, Ms. Smith served as Senior Audit Manager of Ernst & Young LLP (1996-2009). |
Renee Stagnone (1975) |
Year of Election or Appointment: 2013 Deputy Treasurer |
| Ms. Stagnone also serves as Deputy Treasurer of other funds. Ms. Stagnone is an employee of Fidelity Investments. |
Joseph F. Zambello (1957) |
Year of Election or Appointment: 2011 Deputy Treasurer |
| Mr. Zambello also serves as Deputy Treasurer of other funds. Mr. Zambello is an employee of Fidelity Investments. Previously, Mr. Zambello served as Vice President of FMR's Program Management Group (2009-2011) and Vice President of the Transfer Agent Oversight Group (2005-2009). |
Annual Report
The Board of Trustees of Fidelity Total International Equity Fund voted to pay to shareholders of record at the opening of business on record date, the following distributions per share derived from capital gains realized from sales of portfolio securities, and dividends derived from net investment income:
| Pay Date | Record Date | Dividends | Capital Gains |
Institutional Class | 12/09/13 | 12/06/13 | $0.117 | $0.181 |
The fund hereby designates as a capital gain dividend with respect to the taxable year ended October 31, 2013, $3,356,997, or, if subsequently determined to be different, the net capital gain of such year.
Institutional Class designates 1% of the dividends distributed in December 2012 as indicated in the Corporate Qualifying memo distributed by the Tax department, during the fiscal year as qualifying for the dividends-received deduction for corporate shareholders.
Institutional Class designates 38% of the dividends distributed in December during the fiscal year as amounts which may be taken into account as a dividend for purposes of the maximum rate under section 1(h)(11) of the Internal Revenue Code.
The amounts per share which represent income derived from sources within, and taxes paid to, foreign countries or possessions of the United States are as follows:
| Pay Date | Income | Taxes |
Institutional Class | 12/10/2012 | 0.136 | 0.0114 |
The fund will notify shareholders in January 2014 of amounts for use in preparing 2013 income tax returns.
Annual Report
Board Approval of Investment Advisory Contracts and Management Fees
Fidelity Total International Equity Fund
Each year, the Board of Trustees, including the Independent Trustees (together, the Board), votes on the renewal of the management contract and sub-advisory agreements (together, the Advisory Contracts) for the fund. The Board, assisted by the advice of fund counsel and Independent Trustees' counsel, requests and considers a broad range of information relevant to the renewal of the Advisory Contracts throughout the year.
The Board meets regularly and, at each of its meetings, covers an extensive agenda of topics and materials and considers factors that are relevant to its annual consideration of the renewal of the fund's Advisory Contracts, including the services and support provided to the fund and its shareholders. The Board has established various standing committees, each composed of and chaired by Independent Trustees with varying backgrounds, to which the Board has assigned specific subject matter responsibilities in order to enhance effective decision-making by the Board. The Board, acting directly and through its Committees, requests and receives information concerning the annual consideration of the renewal of the fund's Advisory Contracts. The Board also meets as needed to consider matters specifically related to the Board's annual consideration of the renewal of Advisory Contracts. Members of the Board may also meet with trustees of other Fidelity funds through ad hoc joint committees to discuss certain matters relevant to the Fidelity funds.
At its July 2013 meeting, the Board, including the Independent Trustees, unanimously determined to renew the fund's Advisory Contracts. In reaching its determination, the Board considered all factors it believed relevant, including (i) the nature, extent, and quality of the services to be provided to the fund and its shareholders (including the investment performance of the fund); (ii) the competitiveness of the fund's management fee and total expense ratio relative to peer funds; (iii) the total costs of the services to be provided by and the profits to be realized by Fidelity from its relationship with the fund; (iv) the extent to which economies of scale exist and would be realized as the fund grows; and (v) whether fee levels reflect these economies of scale, if any, for the benefit of fund shareholders.
In considering whether to renew the Advisory Contracts for the fund, the Board reached a determination, with the assistance of fund counsel and Independent Trustees' counsel and through the exercise of its business judgment, that the renewal of the Advisory Contracts was in the best interests of the fund and its shareholders and that the compensation payable under the Advisory Contracts was fair and reasonable. The Board's decision to renew the Advisory Contracts was not based on any single factor, but rather was based on a comprehensive consideration of all the information provided to the Board at its meetings throughout the year. The Board, in reaching its determination to renew the Advisory Contracts, was aware that shareholders in the fund have a broad range of investment choices available to them, including a wide choice among mutual funds offered by Fidelity's competitors, and that the fund's shareholders, who have the opportunity to review and weigh the disclosure provided by the fund in its prospectus and other public disclosures, have chosen to invest in this fund, which is a part of the Fidelity family of funds.
Annual Report
Board Approval of Investment Advisory Contracts and
Management Fees - continued
Nature, Extent, and Quality of Services Provided. The Board considered the staffing within the investment adviser, Fidelity Management & Research Company (FMR), and the sub-advisers (together, the Investment Advisers) as it relates to the fund, including the backgrounds of the fund's investment personnel, and also considered the fund's investment objective, strategies, and related investment philosophy. The Independent Trustees also had discussions with senior management of Fidelity's investment operations and investment groups. The Board considered the structure of the portfolio manager compensation program and whether this structure provides appropriate incentives to act in the best interests of the fund.
Resources Dedicated to Investment Management and Support Services. The Board and the Fund Oversight and Research Committees reviewed the general qualifications and capabilities of the Investment Advisers' investment staff, including its size, education, experience, and resources, as well as the Investment Advisers' approach to recruiting, training, managing, and compensating investment personnel. The Board noted that FMR has continued to increase the resources devoted to non-U.S. offices, including expansion of Fidelity's global investment organization. The Board also noted that Fidelity's analysts have extensive resources, tools and capabilities that allow them to conduct sophisticated quantitative and fundamental analysis, as well as credit analysis of issuers, counterparties and guarantors. Further, the Board believes that Fidelity's investment professionals have sufficient access to global information and data so as to provide competitive investment results over time, and that those professionals also have access to sophisticated tools that permit them to assess portfolio construction and risk and performance attribution characteristics continuously, as well as to transmit new information and research conclusions rapidly around the world. Additionally, in its deliberations, the Board considered the Investment Advisers' trading and risk management capabilities and resources, which are an integral part of the investment management process.
Shareholder and Administrative Services. The Board considered (i) the nature, extent, quality, and cost of advisory, administrative, and shareholder services performed by the Investment Advisers and their affiliates under the Advisory Contracts and under separate agreements covering transfer agency, pricing and bookkeeping, and securities lending services for the fund; (ii) the nature and extent of the supervision of third party service providers, principally custodians and subcustodians; and (iii) the resources devoted to, and the record of compliance with, the fund's compliance policies and procedures. The Board also reviewed the allocation of fund brokerage, including allocations to brokers affiliated with the Investment Advisers, the use of brokerage commissions to pay fund expenses, and the use of "soft" commission dollars to pay for research services.
Annual Report
The Board noted that the growth of fund assets over time across the complex allows Fidelity to reinvest in the development of services designed to enhance the value or convenience of the Fidelity funds as investment vehicles. These services include 24-hour access to account information and market information through telephone representatives and over the Internet, investor education materials and asset allocation tools, and the expanded availability of Fidelity Investor Centers.
Investment in a Large Fund Family. The Board considered the benefits to shareholders of investing in a Fidelity fund, including the benefits of investing in a fund that is part of a large family of funds offering a variety of investment disciplines and providing a large variety of mutual fund investor services. The Board noted that Fidelity had taken, or had made recommendations that resulted in the Fidelity funds taking, a number of actions over the previous year that benefited particular funds, including (i) continuing to dedicate additional resources to investment research and to the support of the senior management team that oversees asset management; (ii) persisting in efforts to enhance Fidelity's global research capabilities; (iii) launching new funds and making other enhancements to meet client needs for global and income-oriented solutions; (iv) continuing to launch dedicated lower cost underlying funds to meet portfolio construction needs related to expanding underlying fund options for Fidelity funds of funds, specifically for the Freedom Fund product lines; (v) rationalizing product lines and gaining increased efficiencies through the mergers of several funds into other funds; (vi) strengthening Fidelity's index fund offerings by reducing investment minimums and adopting or lowering existing expense caps for certain funds and classes; (vii) enhancing Global Asset Allocation product offerings by launching new funds and strategies, including "open architecture" target date funds that utilize affiliated and unaffiliated sub-advisers; (viii) modifying the eligibility criteria for Institutional Class shares of Advisor funds to increase their marketability to a portion of the defined contribution plan market; (ix) creating a new low-cost retirement share class for certain Advisor funds to appeal to large retirement plans; (x) transitioning the management of certain Fidelity commodity funds to Geode Capital Management LLC, a registered commodity pool operator, while retaining administrative responsibilities for the funds; (xi) reorganizing a number of funds; and (xii) taking steps toward establishing a new Fidelity adviser to manage sector-based funds and products.
Investment Performance. The Board considered whether the fund has operated in accordance with its investment objective, as well as its record of compliance with its investment restrictions and its performance history.
The Board took into account discussions with the Investment Advisers about fund investment performance that occur at Board meetings throughout the year. In this regard the Board noted that as part of regularly scheduled fund reviews and other reports to the Board on fund performance, the Board periodically considers annualized return information for the fund, for different time periods, measured against a securities market index ("benchmark index") and a peer group of mutual funds with similar objectives ("peer group"). In its evaluation of fund investment performance, the Board gave particular attention to information indicating changes in performance of certain Fidelity funds for specific time periods, and the Investment Advisers' explanations for any overperformance or underperformance.
Annual Report
Board Approval of Investment Advisory Contracts and
Management Fees - continued
In addition to reviewing absolute and relative fund performance, the Independent Trustees periodically consider the appropriateness of fund performance metrics in evaluating the results achieved. In general, the Independent Trustees believe that fund performance should be evaluated based on net performance (after fees and expenses) of both the highest performing and lowest performing classes, where applicable, compared to appropriate benchmark indices, over appropriate time periods which may include full market cycles, and compared to peer groups, as applicable, over the same periods, taking into account relevant factors including the following: general market conditions; issuer-specific information; tactical opportunities for investment; and fund cash flows and other factors.
The Independent Trustees recognize that shareholders evaluate performance on a net basis over their own holding periods, for which one-, three-, and five-year periods are used as a proxy. For this reason, the performance information reviewed by the Board also included net cumulative calendar year total return information for the fund and an appropriate benchmark index and peer group for the most recent one-, three-, and five-year periods, as shown below. Returns are shown compared to the 25th percentile (top of box) and 75th percentile (bottom of box) of the peer universe. Returns of the benchmark index are "net MA," i.e., adjusted for tax withholding rates applicable to U.S.-based mutual funds organized as Massachusetts business trusts.
Annual Report
Fidelity Total International Equity Fund

The Board also considered that the fund's management fee is subject to upward or downward adjustment depending upon whether, and to what extent, the fund's investment performance for the performance period exceeds, or is exceeded by, a securities index, thus leading to a performance adjustment for the same period. The Board noted that the performance adjustment provides FMR with a strong economic incentive to seek to achieve superior performance for the fund's shareholders and helps to more closely align the interests of FMR and the fund's shareholders.
Based on its review, the Board concluded that the nature, extent, and quality of services provided to the fund under the Advisory Contracts should benefit the fund's shareholders.
Competitiveness of Management Fee and Total Expense Ratio. The Board considered the fund's management fee and total expense ratio compared to "mapped groups" of competitive funds and classes. Fidelity creates "mapped groups" by combining similar Lipper investment objective categories that have comparable management fee characteristics. Combining Lipper investment objective categories aids the Board's management fee and total expense ratio comparisons by broadening the competitive group used for comparison and by reducing the number of universes to which various Fidelity funds are compared.
Management Fee. The Board considered two proprietary management fee comparisons for the 12-month periods shown in the chart below. The group of Lipper funds used by the Board for management fee comparisons is referred to below as the "Total Mapped Group." The Total Mapped Group comparison focuses on a fund's standing in terms of gross management fees before expense reimbursements or caps, and without giving effect to the fund's performance adjustment, relative to the total universe of funds with comparable investment mandates, regardless of whether their management fee structures also are comparable. Funds with comparable investment mandates offer exposure to similar types of securities. Funds with comparable management fee structures have similar management fee contractual arrangements (e.g., flat rate charged for advisory services, all-inclusive fee rate, etc.). "TMG %" represents the percentage of funds in the Total Mapped Group that had management fees that were lower than the fund's. For example, a TMG % of 16% means that 84% of the funds in the Total Mapped Group had higher management fees than the fund. The "Asset-Size Peer Group" (ASPG) comparison focuses on a fund's standing relative to a subset of non-Fidelity funds within the Total Mapped Group that are similar in size and management fee structure. The ASPG represents at least 15% of the funds in the Total Mapped Group with comparable asset size and management fee structures, subject to a minimum of 50 funds (or all funds in the Total Mapped Group if fewer than 50). Additional information, such as the ASPG quartile in which the fund's management fee ranked and the impact of the fund's performance adjustment, is also included in the chart and considered by the Board.
Annual Report
Board Approval of Investment Advisory Contracts and
Management Fees - continued
Fidelity Total International Equity Fund
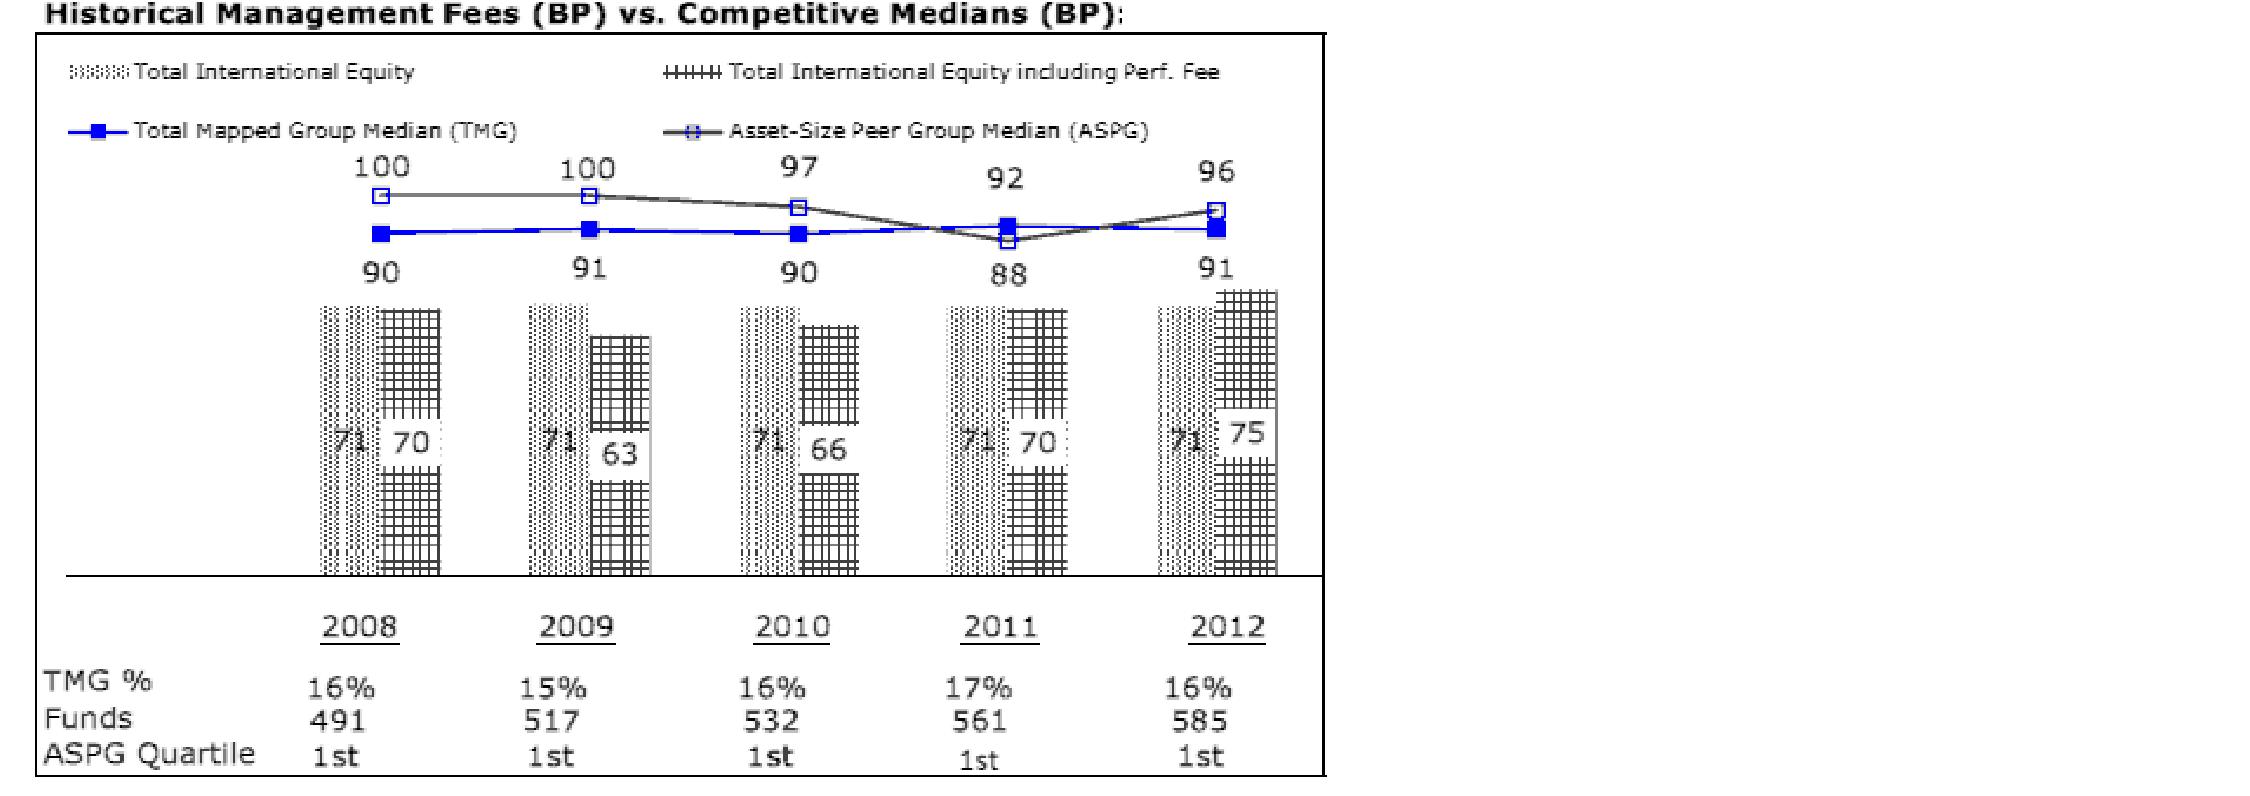
The Board noted that the fund's management fee ranked below the median of its Total Mapped Group and below the median of its ASPG for 2012. The Board also noted the effect of the fund's positive performance adjustment on the fund's management fee ranking.
Annual Report
Based on its review, the Board concluded that the fund's management fee is fair and reasonable in light of the services that the fund receives and the other factors considered.
Total Expense Ratio. In its review of each class's total expense ratio, the Board considered the fund's management fee as well as other fund or class expenses, as applicable, such as transfer agent fees, pricing and bookkeeping fees, fund-paid 12b-1 fees, and custodial, legal, and audit fees. The Board also noted the effects of any waivers and reimbursements on fees and expenses, as well as the impact of the fund's performance adjustment. As part of its review, the Board also considered the current and historical total expense ratios of each class of the fund compared to competitive fund median expenses. Each class of the fund is compared to those funds and classes in the Total Mapped Group (used by the Board for management fee comparisons) that have a similar sales load structure.
The Board noted that the total expense ratio of each of Class A and the retail class ranked below its competitive median for 2012 and the total expense ratio of each of Class T, Class B, Class C, and Institutional Class ranked above its competitive median for 2012. The Board considered that, in general, various factors can affect total expense ratios. The Board noted that the total expense ratio of Class T was above the competitive median primarily because of higher 12b-1 fees on Class T. Class T has a higher 12b-1 fee, but a lower front-end sales charge, than traditionally priced front-end sales charge classes. The Board considered that Class T is primarily sold load-waived in the retirement plan market where its 0.50% 12b-1 fee is comparable to competing no-load, higher 12b-1 fee classes designed specifically for retirement plans. The Board noted that the fund offers multiple classes, each of which has a different sales load and 12b-1 fee structure, and that the multiple structures are intended to offer a range of pricing options for the intermediary market. The Board also noted that the total expense ratios of the classes vary primarily by the level of their 12b-1 fees, although differences in transfer agent fees may also cause expenses to vary from class to class.
The Board further considered that FMR contractually agreed to reimburse Class A, Class T, Class B, Class C, Institutional Class, and the retail class of the fund to the extent that total operating expenses (excluding interest, taxes, certain securities lending costs, brokerage commissions, extraordinary expenses, and acquired fund fees and expenses, if any), as a percentage of their respective average net assets, exceed 1.45%, 1.70%, 2.20%, 2.20%, 1.20%, and 1.20% through December 31, 2013.
Fees Charged to Other Fidelity Clients. The Board also considered Fidelity fee structures and other information with respect to clients of FMR and its affiliates, such as other mutual funds advised or subadvised by FMR or its affiliates, pension plan clients, and other institutional clients. The Board noted the findings of the 2013 ad hoc joint committee (created with the board of other Fidelity funds), which reviewed and compared Fidelity's institutional investment advisory business with its business of providing services to the Fidelity funds, including the differences in services provided, fees charged, and costs incurred, as well as competition in their respective marketplaces.
Annual Report
Board Approval of Investment Advisory Contracts and
Management Fees - continued
Based on its review of total expense ratios and fees charged to other Fidelity clients, the Board concluded that the total expense ratio of each class of the fund was reasonable, although in some cases above the median of the universe presented for comparison, in light of the services that the fund and its shareholders receive and the other factors considered.
Costs of the Services and Profitability. The Board considered the revenues earned and the expenses incurred by Fidelity in conducting the business of developing, marketing, distributing, managing, administering and servicing the fund and servicing the fund's shareholders. The Board also considered the level of Fidelity's profits in respect of all the Fidelity funds.
On an annual basis, FMR presents to the Board Fidelity's profitability for the fund. Fidelity calculates the profitability for each fund, as well as aggregate profitability for groups of Fidelity funds and all Fidelity funds, using a series of detailed revenue and cost allocation methodologies which originate with the books and records of Fidelity on which Fidelity's audited financial statements are based. The Audit Committee of the Board reviews any significant changes from the prior year's methodologies.
PricewaterhouseCoopers LLP (PwC), independent registered public accounting firm and auditor to Fidelity and certain Fidelity funds, has been engaged annually by the Board as part of the Board's assessment of Fidelity's profitability analysis. PwC's engagement includes the review and assessment of the methodologies used by Fidelity in determining the revenues and expenses attributable to Fidelity's mutual fund business, and completion of agreed-upon procedures surrounding the mathematical accuracy of fund profitability and its conformity to allocation methodologies. After considering PwC's reports issued under the engagement and information provided by Fidelity, the Board concluded that while other allocation methods may also be reasonable, Fidelity's profitability methodologies are reasonable in all material respects.
The Board also reviewed Fidelity's non-fund businesses and fall-out benefits related to the mutual fund business as well as cases where Fidelity's affiliates may benefit from or be related to the fund's business.
The Board considered the costs of the services provided by and the profits realized by Fidelity in connection with the operation of the fund and was satisfied that the profitability was not excessive in the circumstances.
Economies of Scale. The Board considered whether there have been economies of scale in respect of the management of the Fidelity funds, whether the Fidelity funds (including the fund) have appropriately benefited from any such economies of scale, and whether there is potential for realization of any further economies of scale. The Board considered the extent to which the fund will benefit from economies of scale through increased services to the fund, through waivers or reimbursements, or through fee or expense reductions. The Board also noted that in 2009, it and the board of other Fidelity funds created an ad hoc committee (the Economies of Scale Committee) to analyze whether FMR attains economies of scale in respect of the management and servicing of the Fidelity funds, whether the Fidelity funds have appropriately benefited from such economies of scale, and whether there is potential for realization of any further economies of scale.
Annual Report
The Board recognized that the fund's management contract incorporates a "group fee" structure, which provides for lower group fee rates as total fund assets under FMR's management increase, and for higher group fee rates as total fund assets under FMR's management decrease. FMR calculates the group fee rates based on a tiered asset "breakpoint" schedule that varies based on asset class. The Board considered that the group fee is designed to deliver the benefits of economies of scale to fund shareholders when total Fidelity fund assets increase, even if assets of any particular fund are unchanged or have declined, because some portion of Fidelity's costs are attributable to services provided to all Fidelity funds, and all funds benefit if those costs can be allocated among more assets. The Board concluded that, given the group fee structure, fund shareholders will benefit from lower management fees as assets under FMR's management increase at the fund complex level, regardless of whether Fidelity achieves any such economies of scale.
The Board concluded, taking into account the analysis of the Economies of Scale Committee, that economies of scale, if any, are being appropriately shared between fund shareholders and Fidelity.
Amendment to Description of Group Fee Rate. At its July 2013 meeting, the Board voted to approve an amendment to the fund's management contract to modify the description of the "group fee rate" effective August 1, 2013. The Board noted that under the prior description in the contract, the group fee rate was based on the average net assets of all registered investment companies with which FMR has management contracts. Under the contract's tiered asset breakpoint schedule, the group fee rate is lower as total fund assets under FMR's management increase, and higher as total fund assets under FMR's management decrease. The Board considered that the prior description would have excluded the assets of 64 Fidelity sector funds from the group fee rate calculation once Fidelity SelectCo, LLC, an affiliate of FMR, assumed management responsibilities for those funds. The Board noted that modifying the description of the group fee rate to continue to include the assets of those 64 funds for purposes of determining group fee rate breakpoints would avoid an immediate adverse impact on the group fee rate for any fund.
Annual Report
Board Approval of Investment Advisory Contracts and
Management Fees - continued
Additional Information Requested by the Board. In order to develop fully the factual basis for consideration of the Fidelity funds' Advisory Contracts, the Board requested and received additional information on certain topics, including: (i) fund performance trends and Fidelity's long-term strategies for certain funds; (ii) the potential to further rationalize the Fidelity fund lineup with the possibility of achieving savings for the funds and Fidelity; (iii) the methodology with respect to competitive fund data and peer group classifications; (iv) the arrangements with, and performance of, certain sub-advisers on behalf of the Fidelity funds, as well as certain proposed participating affiliate arrangements; (v) the realization of fall-out benefits in certain Fidelity business units; (vi) Fidelity's group fee structures, including the rationale for the individual fee rates of certain categories of funds and the definition of group assets; (vii) trends regarding industry use of performance fee structures and the performance adjustment methodologies applicable to the Fidelity funds; (viii) additional competitive analysis regarding the total expenses for certain classes; and (ix) fund profitability methodology, including Fidelity's cost allocation methodology, and the impact of certain factors on fund profitability results.
Based on its evaluation of all of the conclusions noted above, and after considering all factors it believed relevant, the Board ultimately concluded that the advisory fee structures are fair and reasonable, and that the fund's Advisory Contracts should be renewed.
Annual Report
Investment Adviser
Fidelity Management & Research Company
Boston, MA
Investment Sub-Advisers
FMR Co., Inc.
Fidelity Management & Research
(U.K.) Inc.
Fidelity Management & Research
(Hong Kong) Limited
Fidelity Management & Research
(Japan) Inc.
FIL Investment Advisors
FIL Investments (Japan) Limited
FIL Investment Advisors
(U.K.) Limited
General Distributor
Fidelity Distributors Corporation
Smithfield, RI
Transfer and Service Agents
Fidelity Investments Institutional Operations Company, Inc.
Boston, MA
Fidelity Service Company, Inc.
Boston, MA
Custodian
State Street Bank & Trust Company
Quincy, MA
(Fidelity Investment logo)(registered trademark)
ATIEI-UANN-1213
1.853356.105
(Fidelity Investment logo)(registered trademark)
Fidelity Advisor®
International Growth
Fund - Class Z
Annual Report
October 31, 2013
(Fidelity Cover Art)
Class Z is
a class of Fidelity®
International Growth Fund
Contents
Performance | (Click Here) | How the fund has done over time. |
Management's Discussion of Fund Performance | (Click Here) | The Portfolio Manager's review of fund performance and strategy. |
Shareholder Expense Example | (Click Here) | An example of shareholder expenses. |
Investment Changes | (Click Here) | A summary of major shifts in the fund's investments over the past six months. |
Investments | (Click Here) | A complete list of the fund's investments with their market values. |
Financial Statements | (Click Here) | Statements of assets and liabilities, operations, and changes in net assets, as well as financial highlights. |
Notes | (Click Here) | Notes to financial statements. |
Report of Independent Registered Public Accounting Firm | (Click Here) | |
Trustees and Officers | (Click Here) | |
Distributions | (Click Here) | |
Board Approval of Investment Advisory Contracts and Management Fees | (Click Here) | |
To view a fund's proxy voting guidelines and proxy voting record for the 12-month period ended June 30, visit http://www.fidelity.com/proxyvotingresults or visit the Securities and Exchange Commission's (SEC) web site at http://www.sec.gov. You may also call 1-877-208-0098 to request a free copy of the proxy voting guidelines.
Standard & Poor's, S&P and S&P 500 are registered service marks of The McGraw-Hill Companies, Inc. and have been licensed for use by Fidelity Distributors Corporation.
Other third-party marks appearing herein are the property of their respective owners.
All other marks appearing herein are registered or unregistered trademarks or service marks of FMR LLC or an affiliated company. © 2013 FMR LLC. All rights reserved.
Annual Report
This report and the financial statements contained herein are submitted for the general information of the shareholders of the fund. This report is not authorized for distribution to prospective investors in the fund unless preceded or accompanied by an effective prospectus.
A fund files its complete schedule of portfolio holdings with the SEC for the first and third quarters of each fiscal year on Form N-Q. Forms N-Q are available on the SEC's web site at http://www.sec.gov. A fund's Forms N-Q may be reviewed and copied at the SEC's Public Reference Room in Washington, DC. Information regarding the operation of the SEC's Public Reference Room may be obtained by calling 1-800-SEC-0330. For a complete list of a fund's portfolio holdings, view the most recent holdings listing, semiannual report, or annual report on Fidelity's web site at http://www.fidelity.com, http://www.advisor.fidelity.com, or http://www.401k.com, as applicable.
NOT FDIC INSURED • MAY LOSE VALUE • NO BANK GUARANTEE
Neither the fund nor Fidelity Distributors Corporation is a bank.
Annual Report
Average annual total return reflects the change in the value of an investment, assuming reinvestment of the class' distributions from dividend income and capital gains (the profits earned upon the sale of securities that have grown in value, if any) and assuming a constant rate of performance each year. The $10,000 table and the fund's returns do not reflect the deduction of taxes that a shareholder would pay on fund distributions or the redemption of fund shares. During periods of reimbursement by Fidelity, a fund's total return will be greater than it would be had the reimbursement not occurred. How a fund did yesterday is no guarantee of how it will do tomorrow.
Average Annual Total Returns
Periods ended October 31, 2013 | Past 1
year | Past 5
years | Life of
fund A |
Class Z B | 22.66% | 15.88% | 2.29% |
A From November 1, 2007.
B The initial offering of Class Z shares took place on August 13, 2013. Returns prior to August 13, 2013, are those of Institutional Class.
$10,000 Over Life of Fund
Let's say hypothetically that $10,000 was invested in Fidelity Advisor® International Growth Fund - Class Z on November 1, 2007, when the fund started. The chart shows how the value of your investment would have changed, and also shows how the MSCI® EAFE® Growth Index performed over the same period. See footnote B above for additional information regarding the performance of Class Z.
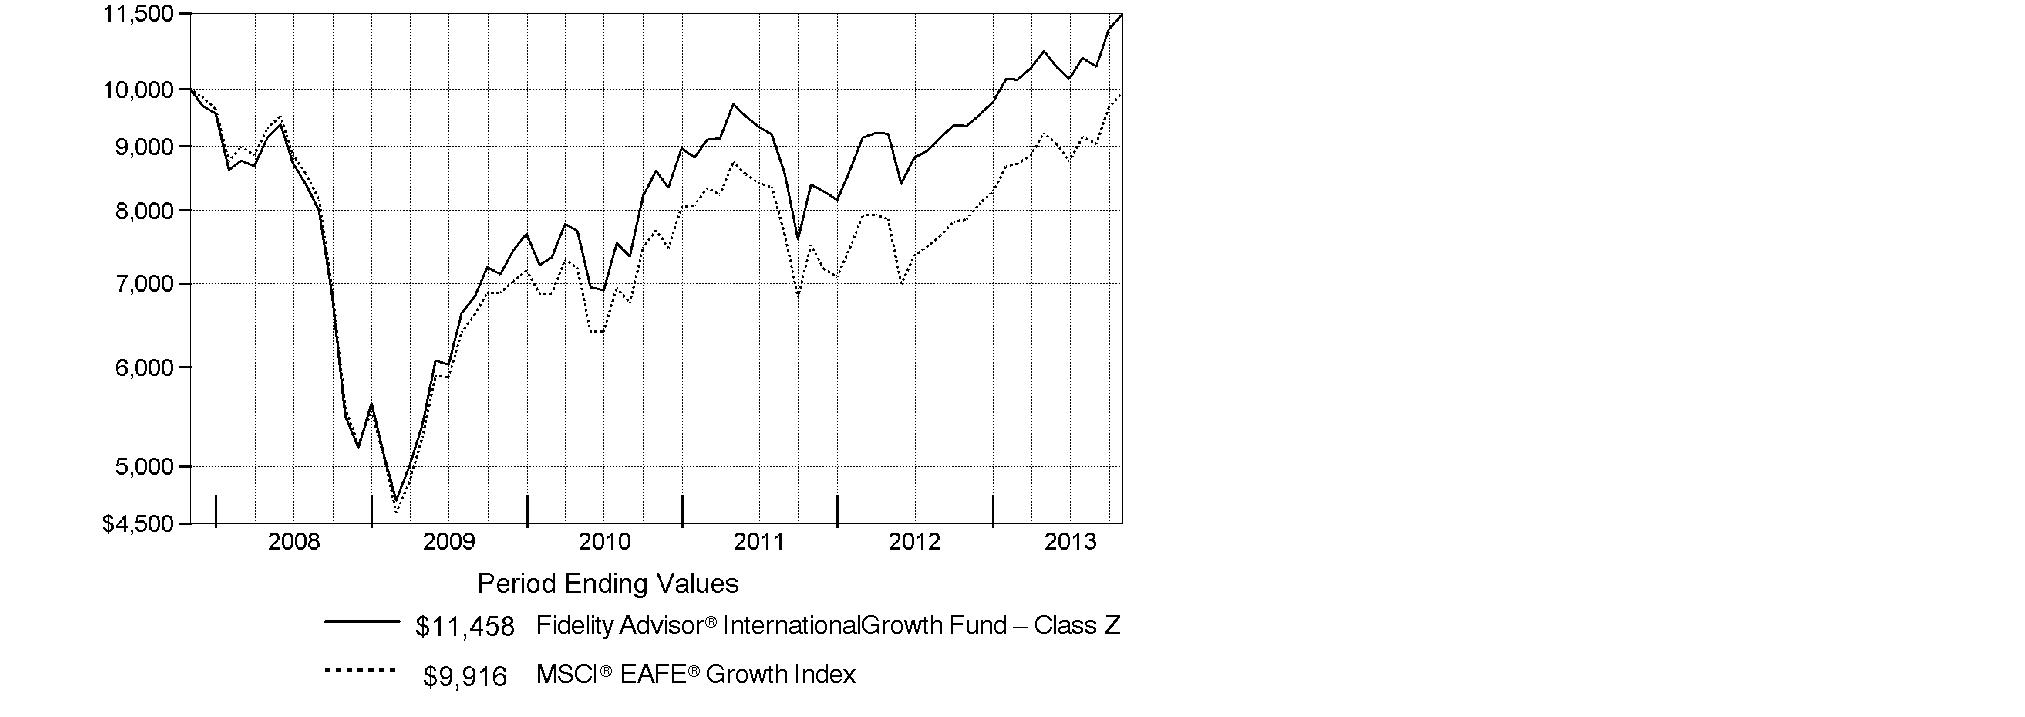
Annual Report
Market Recap: On balance, global equity markets remained upbeat for the 12-month period ending October 31, 2013. The MSCI® ACWI® (All Country World Index) Index gained 23.75% for the period, amid investor preference for higher-risk assets. The period was not without turbulence, however. In the spring and summer, central banks worldwide, especially in the U.S. and China, made clear their intentions to maintain accommodative monetary policies. That stance, combined with modest cyclical improvements around the globe and generally low valuations, underpinned the broad rally in equities. Europe (+32%) shone brightly, with most markets in the region - large and small - registering solid, index-beating gains. Another bright spot was Japan, which, despite a struggling yen and taking a second-half breather, posted a 34% result for the full year. The U.S. - by far the index's biggest constituent - also outperformed the global market with a roughly 28% advance. Meanwhile, Asia-Pacific ex Japan (+14%) lagged, hurt in part by a slowdown in Australia's mining industry as well as currency headwinds. Foreign-exchange and commodity weakness also curbed results in resource-heavy Canada and emerging markets (EM), both of which were up 7%. Country-level EM performance diverged meaningfully for the period, as evidenced by performance in Brazil (-1%), Russia (+12%), India (+1%) and China (+8%).
Comments from Jed Weiss, Portfolio Manager of Fidelity Advisor® International Growth Fund: For the year, the fund's Class Z shares trailed the 26.07% advance of the MSCI® EAFE® Growth Index. (For specific class-level results, please refer to the performance section of this report). Versus the index, picks in emerging markets were a big detractor. A combination of underweighting Europe and disappointing security selection there also hurt, even as Dutch semiconductor equipment company ASML Holding made an outsized individual contribution. Stock picking in Canada detracted, with out-of-index mining companies Goldcorp and Agnico Eagle Mines suffering from falling gold prices. I ultimately sold both stocks. A moderate cash position curbed performance in an up market. On the positive side, stock picking in Hong Kong was helpful - especially positions in casino gaming companies Sands China and Wynn Macau - as was underweighting poor-performing Australia. Another contributor was the fund's out-of-benchmark holdings in companies headquartered in the U.S. but doing all or most of their business abroad. In strong-performing Japan, the impact was mixed, with a detrimental underweighting but favorable stock picking. In this market, the fund's biggest individual detractor was automaker Toyota Motor. Instead of owning this outperforming benchmark component, we held DENSO, a parts supplier whose largest customer is Toyota and whose strong performance tempered the latter's negative relative impact.
The views expressed above reflect those of the portfolio manager(s) only through the end of the period as stated on the cover of this report and do not necessarily represent the views of Fidelity or any other person in the Fidelity organization. Any such views are subject to change at any time based upon market or other conditions and Fidelity disclaims any responsibility to update such views. These views may not be relied on as investment advice and, because investment decisions for a Fidelity fund are based on numerous factors, may not be relied on as an indication of trading intent on behalf of any Fidelity fund.
Annual Report
Shareholder Expense Example
As a shareholder of the Fund, you incur two types of costs: (1) transaction costs, including sales charges (loads) on purchase payments or redemption proceeds, redemption fees and (2) ongoing costs, including management fees, distribution and/or service (12b-1) fees and other Fund expenses. This Example is intended to help you understand your ongoing costs (in dollars) of investing in the Fund and to compare these costs with the ongoing costs of investing in other mutual funds.
The actual expense Example is based on an investment of $1,000 invested at the beginning of the period and held for the entire period (May 1, 2013 to October 31, 2013) for Class A, Class T, Class B, Class C, International Growth and Institutional Class and for the period (August 13, 2013 to October 31, 2013) for Class Z. The hypothetical expense Example is based on an investment of $1,000 invested for the one-half year period (May 1, 2013 to October 31, 2013).
Actual Expenses
The first line of the accompanying table for each class of the Fund provides information about actual account values and actual expenses. You may use the information in this line, together with the amount you invested, to estimate the expenses that you paid over the period. Simply divide your account value by $1,000.00 (for example, an $8,600 account value divided by $1,000.00 = 8.6), then multiply the result by the number in the first line for a class of the Fund under the heading entitled "Expenses Paid During Period" to estimate the expenses you paid on your account during this period. A small balance maintenance fee of $12.00 that is charged once a year may apply for certain accounts with a value of less than $2,000. This fee is not included in the table below. If it was, the estimate of expenses you paid during the period would be higher, and your ending account value lower, by this amount. In addition, the Fund, as a shareholder in the underlying Fidelity Central Funds, will indirectly bear its pro-rata share of the fees and expenses incurred by the underlying Fidelity Central Funds. These fees and expenses are not included in the Fund's annualized expense ratio used to calculate the expense estimate in the table below.
Hypothetical Example for Comparison Purposes
The second line of the accompanying table for each class of the Fund provides information about hypothetical account values and hypothetical expenses based on a Class' actual expense ratio and an assumed rate of return of 5% per year before expenses, which is not the Class' actual return. The hypothetical account values and expenses may not be used to estimate the actual ending account balance or expenses you paid for the period. You may use this information to compare the ongoing costs of investing in the Fund and other funds. To do so, compare this 5% hypothetical example with the 5% hypothetical examples that appear in the shareholder reports of the other funds. A small balance maintenance fee of $12.00 that is charged once a year may apply for certain accounts with a value of less than $2,000. This fee is not included in the table below. If it was, the estimate of expenses you paid during the period would be higher, and your ending account value lower, by this amount. In addition, the Fund, as a shareholder in the underlying Fidelity Central Funds, will indirectly bear its pro-rata share of the fees and expenses incurred by the underlying Fidelity Central Funds. These fees and expenses are not included in the Fund's annualized expense ratio used to calculate the expense estimate in the table below.
Annual Report
Shareholder Expense Example - continued
Please note that the expenses shown in the table are meant to highlight your ongoing costs only and do not reflect any transaction costs. Therefore, the second line of the table is useful in comparing ongoing costs only, and will not help you determine the relative total costs of owning different funds. In addition, if these transactional costs were included, your costs would have been higher.
| Annualized
Expense Ratio B | Beginning
Account Value | Ending
Account Value
October 31, 2013 | Expenses Paid
During Period |
Class A | 1.44% | | | |
Actual | | $ 1,000.00 | $ 1,067.30 | $ 7.50 C |
Hypothetical A | | $ 1,000.00 | $ 1,017.95 | $ 7.32 D |
Class T | 1.70% | | | |
Actual | | $ 1,000.00 | $ 1,066.50 | $ 8.85 C |
Hypothetical A | | $ 1,000.00 | $ 1,016.64 | $ 8.64 D |
Class B | 2.18% | | | |
Actual | | $ 1,000.00 | $ 1,063.40 | $ 11.34 C |
Hypothetical A | | $ 1,000.00 | $ 1,014.22 | $ 11.07 D |
Class C | 2.18% | | | |
Actual | | $ 1,000.00 | $ 1,063.70 | $ 11.34 C |
Hypothetical A | | $ 1,000.00 | $ 1,014.22 | $ 11.07 D |
International Growth | 1.11% | | | |
Actual | | $ 1,000.00 | $ 1,069.00 | $ 5.79 C |
Hypothetical A | | $ 1,000.00 | $ 1,019.61 | $ 5.65 D |
Institutional Class | 1.11% | | | |
Actual | | $ 1,000.00 | $ 1,069.00 | $ 5.79 C |
Hypothetical A | | $ 1,000.00 | $ 1,019.61 | $ 5.65 D |
Class Z | .94% | | | |
Actual | | $ 1,000.00 | $ 1,056.50 | $ 2.12 C |
Hypothetical A | | $ 1,000.00 | $ 1,020.47 | $ 4.79 D |
A 5% return per year before expenses
B Annualized expense ratio reflects expenses net of applicable fee waivers.
C Actual expenses are equal to each Class' annualized expense ratio, multiplied by the average account value over the period, multiplied by 184/365 (to reflect the one-half year period) for Class A, Class T, Class B, Class C, International Growth and Institutional Class and multiplied by 80/365 (to reflect the period August 13, 2013 to October 31, 2013) for Class Z. The fees and expenses of the underlying Fidelity Central Funds in which the Fund invests are not included in each Class' annualized expense ratio.
Annual Report
D Hypothetical expenses are equal to each Class' annualized expense ratio, multiplied by the average account value over the period, multiplied by 184/365 (to reflect the one-half year period). The fees and expenses of the underlying Fidelity Central Funds in which the Fund invests are not included in each Class' annualized expense ratio.
Annual Report
Investment Changes (Unaudited)
Geographic Diversification (% of fund's net assets) |
As of October 31, 2013 |
 | United Kingdom 17.6% | |
 | Japan 16.6% | |
 | United States of America* 14.9% | |
 | Switzerland 12.4% | |
 | Sweden 5.7% | |
 | Belgium 4.8% | |
 | Germany 4.4% | |
 | Australia 3.2% | |
 | France 3.2% | |
 | Other 17.2% | |

Percentages are based on country or territory of incorporation and are adjusted for the effect of futures contracts, if applicable. |
* Includes Short-Term Investments and Net Other Assets (Liabilities). |
As of April 30, 2013 |
| United Kingdom 18.3% | |
| United States of America* 16.4% | |
| Japan 12.5% | |
| Switzerland 10.7% | |
| Sweden 5.4% | |
| Belgium 4.5% | |
| France 4.0% | |
| Australia 3.8% | |
| Germany 3.1% | |
| Other 21.3% | |

Percentages are based on country or territory of incorporation and are adjusted for the effect of futures contracts, if applicable. |
* Includes Short-Term Investments and Net Other Assets (Liabilities). |
Asset Allocation as of October 31, 2013 |
| % of fund's
net assets | % of fund's net assets
6 months ago |
Stocks | 97.9 | 98.6 |
Short-Term Investments and Net Other Assets (Liabilities) | 2.1 | 1.4 |
Top Ten Stocks as of October 31, 2013 |
| % of fund's
net assets | % of fund's net assets
6 months ago |
Nestle SA (Switzerland, Food Products) | 4.3 | 5.2 |
Anheuser-Busch InBev SA NV (Belgium, Beverages) | 3.5 | 3.6 |
Roche Holding AG (participation certificate) (Switzerland, Pharmaceuticals) | 3.3 | 2.5 |
DENSO Corp. (Japan, Auto Components) | 3.0 | 2.2 |
UBS AG (NY Shares) (Switzerland, Capital Markets) | 2.2 | 1.9 |
Linde AG (Germany, Chemicals) | 2.2 | 2.3 |
Keyence Corp. (Japan, Electronic Equipment & Components) | 2.0 | 1.3 |
Prudential PLC (United Kingdom, Insurance) | 1.9 | 0.0 |
SABMiller PLC (United Kingdom, Beverages) | 1.8 | 2.1 |
Novo Nordisk A/S Series B sponsored ADR (Denmark, Pharmaceuticals) | 1.8 | 2.5 |
| 26.0 | |
Market Sectors as of October 31, 2013 |
| % of fund's
net assets | % of fund's net assets
6 months ago |
Consumer Staples | 19.7 | 24.3 |
Consumer Discretionary | 17.1 | 16.2 |
Financials | 15.0 | 11.3 |
Industrials | 14.3 | 15.1 |
Health Care | 11.9 | 11.2 |
Materials | 7.7 | 10.4 |
Information Technology | 7.5 | 6.7 |
Energy | 3.0 | 3.4 |
Telecommunication Services | 1.7 | 0.0 |
Annual Report
Investments October 31, 2013
Showing Percentage of Net Assets
Common Stocks - 97.9% |
| Shares | | Value |
Australia - 3.2% |
Coca-Cola Amatil Ltd. | 391,434 | | $ 4,772,534 |
CSL Ltd. | 141,073 | | 9,266,793 |
Sydney Airport unit | 643,558 | | 2,548,605 |
Transurban Group unit | 347,528 | | 2,332,109 |
TOTAL AUSTRALIA | | 18,920,041 |
Austria - 1.1% |
Andritz AG | 103,997 | | 6,406,331 |
Bailiwick of Jersey - 0.5% |
Informa PLC | 301,577 | | 2,705,454 |
Belgium - 4.8% |
Anheuser-Busch InBev SA NV | 197,091 | | 20,431,189 |
KBC Groupe SA | 83,619 | | 4,558,378 |
Umicore SA | 64,664 | | 3,084,767 |
TOTAL BELGIUM | | 28,074,334 |
Bermuda - 0.4% |
Lazard Ltd. Class A | 65,192 | | 2,519,671 |
Cayman Islands - 2.6% |
Sands China Ltd. | 1,287,200 | | 9,148,036 |
Wynn Macau Ltd. | 1,650,400 | | 6,332,955 |
TOTAL CAYMAN ISLANDS | | 15,480,991 |
Denmark - 1.8% |
Novo Nordisk A/S Series B sponsored ADR | 62,800 | | 10,466,876 |
Finland - 0.9% |
Nokian Tyres PLC | 100,408 | | 5,080,980 |
France - 3.2% |
Danone SA | 80,652 | | 5,981,177 |
Remy Cointreau SA | 26,787 | | 2,643,375 |
Safran SA | 94,400 | | 6,033,678 |
Sanofi SA | 38,874 | | 4,144,872 |
TOTAL FRANCE | | 18,803,102 |
Germany - 4.4% |
Bayer AG | 65,700 | | 8,165,750 |
Deutsche Bank AG | 51,320 | | 2,480,253 |
Deutsche Bank AG (NY Shares) | 800 | | 38,656 |
Linde AG | 67,141 | | 12,757,939 |
Siemens AG sponsored ADR | 20,000 | | 2,560,200 |
TOTAL GERMANY | | 26,002,798 |
Common Stocks - continued |
| Shares | | Value |
India - 0.3% |
Housing Development Finance Corp. Ltd. | 133,476 | | $ 1,852,016 |
Ireland - 1.7% |
CRH PLC sponsored ADR | 185,366 | | 4,537,760 |
James Hardie Industries PLC: | | | |
CDI | 35,635 | | 368,127 |
sponsored ADR (d) | 96,000 | | 4,999,680 |
TOTAL IRELAND | | 9,905,567 |
Israel - 0.3% |
Azrieli Group | 44,900 | | 1,443,930 |
Italy - 0.9% |
Interpump Group SpA | 160,651 | | 1,788,616 |
Prada SpA | 325,300 | | 3,172,021 |
TOTAL ITALY | | 4,960,637 |
Japan - 16.6% |
AEON Mall Co. Ltd. | 101,810 | | 2,891,503 |
Aozora Bank Ltd. | 861,000 | | 2,502,957 |
Autobacs Seven Co. Ltd. | 60,100 | | 876,287 |
DENSO Corp. | 366,500 | | 17,617,075 |
East Japan Railway Co. | 16,900 | | 1,468,115 |
Fanuc Corp. | 31,700 | | 5,084,924 |
Fast Retailing Co. Ltd. | 18,300 | | 6,159,998 |
Japan Tobacco, Inc. | 166,700 | | 6,031,820 |
Keyence Corp. | 27,462 | | 11,769,939 |
Mitsui Fudosan Co. Ltd. | 267,000 | | 8,844,617 |
Nomura Holdings, Inc. | 187,300 | | 1,383,591 |
Seven Bank Ltd. | 808,300 | | 2,860,781 |
Shinsei Bank Ltd. | 1,457,000 | | 3,411,283 |
SHO-BOND Holdings Co. Ltd. | 65,000 | | 3,043,777 |
SoftBank Corp. | 134,600 | | 10,051,781 |
Unicharm Corp. | 54,500 | | 3,500,476 |
USS Co. Ltd. | 458,700 | | 6,717,431 |
Yamato Kogyo Co. Ltd. | 86,100 | | 3,191,228 |
TOTAL JAPAN | | 97,407,583 |
Mexico - 0.3% |
Fomento Economico Mexicano S.A.B. de CV sponsored ADR | 20,755 | | 1,936,442 |
Common Stocks - continued |
| Shares | | Value |
Netherlands - 1.7% |
ASML Holding NV | 56,278 | | $ 5,326,150 |
ING Groep NV (Certificaten Van Aandelen) (a) | 366,557 | | 4,658,106 |
TOTAL NETHERLANDS | | 9,984,256 |
Portugal - 0.8% |
Jeronimo Martins SGPS SA | 265,152 | | 4,899,738 |
South Africa - 0.5% |
Clicks Group Ltd. | 444,126 | | 2,767,285 |
Spain - 1.9% |
Inditex SA (d) | 59,146 | | 9,716,963 |
Prosegur Compania de Seguridad SA (Reg.) | 236,849 | | 1,408,528 |
TOTAL SPAIN | | 11,125,491 |
Sweden - 5.7% |
ASSA ABLOY AB (B Shares) | 138,561 | | 6,878,816 |
Atlas Copco AB (A Shares) | 240,809 | | 6,681,655 |
Fagerhult AB | 49,496 | | 1,520,004 |
H&M Hennes & Mauritz AB (B Shares) | 182,130 | | 7,869,754 |
Intrum Justitia AB | 91,200 | | 2,427,759 |
SKF AB (B Shares) | 153,717 | | 4,072,995 |
Svenska Handelsbanken AB (A Shares) | 72,940 | | 3,304,787 |
Swedish Match Co. AB | 17,272 | | 569,865 |
TOTAL SWEDEN | | 33,325,635 |
Switzerland - 12.4% |
Credit Suisse Group | 74,858 | | 2,328,680 |
Nestle SA | 345,971 | | 24,973,553 |
Novartis AG | 75,374 | | 5,850,725 |
Roche Holding AG (participation certificate) | 70,213 | | 19,438,481 |
Schindler Holding AG: | | | |
(participation certificate) | 25,471 | | 3,612,848 |
(Reg.) | 6,190 | | 880,046 |
Swatch Group AG (Bearer) | 4,040 | | 2,584,692 |
UBS AG (NY Shares) | 661,761 | | 12,811,693 |
TOTAL SWITZERLAND | | 72,480,718 |
Turkey - 1.5% |
Coca-Cola Icecek A/S | 142,997 | | 4,100,978 |
Tupras Turkiye Petrol Rafinelleri A/S | 100,687 | | 2,284,845 |
Turkiye Garanti Bankasi A/S | 640,500 | | 2,579,647 |
TOTAL TURKEY | | 8,965,470 |
Common Stocks - continued |
| Shares | | Value |
United Kingdom - 17.6% |
Babcock International Group PLC | 196,200 | | $ 4,010,985 |
Barclays PLC sponsored ADR (d) | 225,966 | | 3,798,488 |
BG Group PLC | 466,755 | | 9,530,810 |
BHP Billiton PLC ADR (d) | 71,700 | | 4,419,588 |
GlaxoSmithKline PLC sponsored ADR | 175,500 | | 9,236,565 |
InterContinental Hotel Group PLC ADR (d) | 230,330 | | 6,760,186 |
Johnson Matthey PLC | 116,777 | | 5,624,697 |
Prudential PLC | 539,714 | | 11,037,564 |
Reckitt Benckiser Group PLC (d) | 115,645 | | 8,989,413 |
Rexam PLC | 380,064 | | 3,165,805 |
Rolls-Royce Group PLC | 458,237 | | 8,449,478 |
Rotork PLC | 84,800 | | 3,892,773 |
SABMiller PLC | 202,866 | | 10,584,460 |
Serco Group PLC | 345,718 | | 3,087,586 |
Shaftesbury PLC | 154,533 | | 1,471,803 |
Standard Chartered PLC (United Kingdom) | 334,991 | | 8,054,183 |
Unite Group PLC | 197,400 | | 1,253,384 |
TOTAL UNITED KINGDOM | | 103,367,768 |
United States of America - 12.8% |
Autoliv, Inc. | 67,069 | | 5,984,567 |
Berkshire Hathaway, Inc. Class B (a) | 19,184 | | 2,207,695 |
BorgWarner, Inc. | 58,796 | | 6,063,631 |
Cummins, Inc. | 26,082 | | 3,312,936 |
FMC Technologies, Inc. (a) | 49,152 | | 2,484,634 |
Google, Inc. Class A (a) | 2,863 | | 2,950,551 |
KLA-Tencor Corp. | 42,680 | | 2,799,808 |
Martin Marietta Materials, Inc. | 31,700 | | 3,109,453 |
MasterCard, Inc. Class A | 11,450 | | 8,210,795 |
Mead Johnson Nutrition Co. Class A | 76,944 | | 6,283,247 |
Mohawk Industries, Inc. (a) | 22,400 | | 2,966,208 |
National Oilwell Varco, Inc. | 40,272 | | 3,269,281 |
Philip Morris International, Inc. | 43,808 | | 3,904,169 |
PriceSmart, Inc. | 24,500 | | 2,787,855 |
ResMed, Inc. (d) | 60,700 | | 3,140,618 |
Solera Holdings, Inc. | 46,189 | | 2,596,746 |
SS&C Technologies Holdings, Inc. (a) | 66,200 | | 2,601,660 |
Common Stocks - continued |
| Shares | | Value |
United States of America - continued |
Union Pacific Corp. | 16,300 | | $ 2,467,820 |
Visa, Inc. Class A | 39,975 | | 7,861,883 |
TOTAL UNITED STATES OF AMERICA | | 75,003,557 |
TOTAL COMMON STOCKS (Cost $503,021,258) |
573,886,671
|
Nonconvertible Preferred Stocks - 0.0% |
| | | |
United Kingdom - 0.0% |
Rolls-Royce Group PLC Series C
(Cost $61,249) | 37,731,382 | |
60,499
|
Money Market Funds - 5.2% |
| | | |
Fidelity Cash Central Fund, 0.09% (b) | 14,095,092 | | 14,095,092 |
Fidelity Securities Lending Cash Central Fund, 0.09% (b)(c) | 16,477,575 | | 16,477,575 |
TOTAL MONEY MARKET FUNDS (Cost $30,572,667) |
30,572,667
|
TOTAL INVESTMENT PORTFOLIO - 103.1% (Cost $533,655,174) | | 604,519,837 |
NET OTHER ASSETS (LIABILITIES) - (3.1)% | | (18,241,969) |
NET ASSETS - 100% | $ 586,277,868 |
Legend |
(a) Non-income producing |
(b) Affiliated fund that is generally available only to investment companies and other accounts managed by Fidelity Investments. The rate quoted is the annualized seven-day yield of the fund at period end. A complete unaudited listing of the fund's holdings as of its most recent quarter end is available upon request. In addition, each Fidelity Central Fund's financial statements, which are not covered by the Fund's Report of Independent Registered Public Accounting Firm, are available on the SEC's website or upon request. |
(c) Investment made with cash collateral received from securities on loan. |
(d) Security or a portion of the security is on loan at period end. |
Affiliated Central Funds |
Information regarding fiscal year to date income earned by the Fund from investments in Fidelity Central Funds is as follows: |
Fund | Income earned |
Fidelity Cash Central Fund | $ 13,543 |
Fidelity Securities Lending Cash Central Fund | 209,783 |
Total | $ 223,326 |
Other Information |
Categorizations in the Schedule of Investments are based on country or territory of incorporation. |
The following is a summary of the inputs used, as of October 31, 2013, involving the Fund's assets and liabilities carried at fair value. The inputs or methodology used for valuing securities may not be an indication of the risk associated with investing in those securities. For more information on valuation inputs, and their aggregation into the levels used in the tables below, please refer to the Investment Valuation section in the accompanying Notes to Financial Statements. |
Valuation Inputs at Reporting Date: |
Description | Total | Level 1 | Level 2 | Level 3 |
Investments in Securities: | | | | |
Equities: | | | | |
Consumer Discretionary | $ 99,756,238 | $ 68,385,447 | $ 31,370,791 | $ - |
Consumer Staples | 115,157,576 | 60,220,538 | 54,937,038 | - |
Energy | 17,569,570 | 17,569,570 | - | - |
Financials | 88,293,666 | 45,894,331 | 42,399,335 | - |
Health Care | 69,710,680 | 59,715,083 | 9,995,597 | - |
Industrials | 84,031,083 | 74,434,267 | 9,596,816 | - |
Information Technology | 44,117,532 | 32,347,593 | 11,769,939 | - |
Materials | 45,259,044 | 42,067,816 | 3,191,228 | - |
Telecommunication Services | 10,051,781 | - | 10,051,781 | - |
Money Market Funds | 30,572,667 | 30,572,667 | - | - |
Total Investments in Securities: | $ 604,519,837 | $ 431,207,312 | $ 173,312,525 | $ - |
The following is a summary of transfers between Level 1 and Level 2 for the period ended October 31, 2013. Transfers are assumed to have occurred at the beginning of the period, and are primarily attributable to the valuation techniques used for foreign equity securities, as discussed in the accompanying Notes to Financial Statements: |
Transfers | Total |
Level 1 to Level 2 | $ 27,145,883 |
Level 2 to Level 1 | $ 0 |
See accompanying notes which are an integral part of the financial statements.
Annual Report
Statement of Assets and Liabilities
| October 31, 2013 |
| | |
Assets | | |
Investment in securities, at value (including securities loaned of $15,812,983) - See accompanying schedule: Unaffiliated issuers (cost $503,082,507) | $ 573,947,170 | |
Fidelity Central Funds (cost $30,572,667) | 30,572,667 | |
Total Investments (cost $533,655,174) | | $ 604,519,837 |
Cash | | 7,981 |
Receivable for investments sold | | 2,362,573 |
Receivable for fund shares sold | | 3,194,486 |
Dividends receivable | | 767,973 |
Distributions receivable from Fidelity Central Funds | | 6,838 |
Prepaid expenses | | 1,720 |
Other receivables | | 13,074 |
Total assets | | 610,874,482 |
| | |
Liabilities | | |
Payable for investments purchased | $ 7,134,028 | |
Payable for fund shares redeemed | 414,036 | |
Accrued management fee | 337,239 | |
Distribution and service plan fees payable | 38,773 | |
Other affiliated payables | 125,190 | |
Other payables and accrued expenses | 69,773 | |
Collateral on securities loaned, at value | 16,477,575 | |
Total liabilities | | 24,596,614 |
| | |
Net Assets | | $ 586,277,868 |
Net Assets consist of: | | |
Paid in capital | | $ 512,728,833 |
Undistributed net investment income | | 2,476,993 |
Accumulated undistributed net realized gain (loss) on investments and foreign currency transactions | | 210,451 |
Net unrealized appreciation (depreciation) on investments and assets and liabilities in foreign currencies | | 70,861,591 |
Net Assets | | $ 586,277,868 |
See accompanying notes which are an integral part of the financial statements.
Annual Report
Financial Statements - continued
Statement of Assets and Liabilities - continued
| October 31, 2013 |
| | |
Calculation of Maximum Offering Price Class A:
Net Asset Value and redemption price per share ($74,594,798 ÷ 6,919,905 shares) | | $ 10.78 |
| | |
Maximum offering price per share (100/94.25 of $10.78) | | $ 11.44 |
Class T:
Net Asset Value and redemption price per share ($23,117,780 ÷ 2,150,794 shares) | | $ 10.75 |
| | |
Maximum offering price per share (100/96.50 of $10.75) | | $ 11.14 |
Class B:
Net Asset Value and offering price per share ($1,578,643 ÷ 147,175 shares)A | | $ 10.73 |
| | |
Class C:
Net Asset Value and offering price per share ($17,196,098 ÷ 1,608,592 shares)A | | $ 10.69 |
| | |
| | |
International Growth:
Net Asset Value, offering price and redemption price per share ($430,913,552 ÷ 39,735,803 shares) | | $ 10.84 |
| | |
Institutional Class:
Net Asset Value, offering price and redemption price per share ($38,771,323 ÷ 3,577,332 shares) | | $ 10.84 |
| | |
Class Z:
Net Asset Value, offering price and redemption price per share ($105,674 ÷ 9,747 shares) | | $ 10.84 |
A Redemption price per share is equal to net asset value less any applicable contingent deferred sales charge.
See accompanying notes which are an integral part of the financial statements.
Annual Report
Statement of Operations
| Year ended October 31, 2013 |
| | |
Investment Income | | |
Dividends | | $ 8,033,314 |
Interest | | 4 |
Income from Fidelity Central Funds | | 223,326 |
Income before foreign taxes withheld | | 8,256,644 |
Less foreign taxes withheld | | (549,023) |
Total income | | 7,707,621 |
| | |
Expenses | | |
Management fee
Basic fee | $ 2,422,146 | |
Performance adjustment | 192,757 | |
Transfer agent fees | 865,734 | |
Distribution and service plan fees | 312,494 | |
Accounting and security lending fees | 180,016 | |
Custodian fees and expenses | 82,662 | |
Independent trustees' compensation | 1,736 | |
Registration fees | 145,304 | |
Audit | 70,606 | |
Legal | 656 | |
Miscellaneous | 1,779 | |
Total expenses before reductions | 4,275,890 | |
Expense reductions | (61,595) | 4,214,295 |
Net investment income (loss) | | 3,493,326 |
Realized and Unrealized Gain (Loss) Net realized gain (loss) on: | | |
Investment securities: | | |
Unaffiliated issuers | 6,727,492 | |
Foreign currency transactions | 107,488 | |
Futures contracts | (517,867) | |
Total net realized gain (loss) | | 6,317,113 |
Change in net unrealized appreciation (depreciation) on: Investment securities | 60,865,585 | |
Assets and liabilities in foreign currencies | 4,304 | |
Total change in net unrealized appreciation (depreciation) | | 60,869,889 |
Net gain (loss) | | 67,187,002 |
Net increase (decrease) in net assets resulting from operations | | $ 70,680,328 |
See accompanying notes which are an integral part of the financial statements.
Annual Report
Financial Statements - continued
Statement of Changes in Net Assets
| Year ended
October 31,
2013 | Year ended
October 31,
2012 |
Increase (Decrease) in Net Assets | | |
Operations | | |
Net investment income (loss) | $ 3,493,326 | $ 1,377,708 |
Net realized gain (loss) | 6,317,113 | (833,212) |
Change in net unrealized appreciation (depreciation) | 60,869,889 | 11,226,981 |
Net increase (decrease) in net assets resulting
from operations | 70,680,328 | 11,771,477 |
Distributions to shareholders from net investment income | (2,081,336) | (594,738) |
Distributions to shareholders from net realized gain | (113,769) | (48,645) |
Total distributions | (2,195,105) | (643,383) |
Share transactions - net increase (decrease) | 324,915,158 | 115,271,822 |
Redemption fees | 31,216 | 5,972 |
Total increase (decrease) in net assets | 393,431,597 | 126,405,888 |
| | |
Net Assets | | |
Beginning of period | 192,846,271 | 66,440,383 |
End of period (including undistributed net investment income of $2,476,993 and undistributed net investment income of $1,374,430, respectively) | $ 586,277,868 | $ 192,846,271 |
See accompanying notes which are an integral part of the financial statements.
Annual Report
Financial Highlights - Class A
Years ended October 31, | 2013 | 2012 | 2011 | 2010 | 2009 |
Selected Per-Share Data | | | | | |
Net asset value, beginning of period | $ 8.91 | $ 8.09 | $ 8.38 | $ 7.01 | $ 5.46 |
Income from Investment Operations | | | | | |
Net investment income (loss) C | .08 | .08 | .08 | .05 | .05 |
Net realized and unrealized gain (loss) | 1.88 | .81 | (.31) | 1.39 | 1.55 |
Total from investment operations | 1.96 | .89 | (.23) | 1.44 | 1.60 |
Distributions from net investment income | (.08) | (.06) | (.05) | (.05) | (.05) |
Distributions from net realized gain | (.01) | (.01) | (.01) | (.03) | - |
Total distributions | (.09) | (.07) | (.06) | (.07) H | (.05) |
Redemption fees added to paid in capital C, G | - | - | - | - | - |
Net asset value, end of period | $ 10.78 | $ 8.91 | $ 8.09 | $ 8.38 | $ 7.01 |
Total Return A, B | 22.18% | 11.10% | (2.76)% | 20.68% | 29.72% |
Ratios to Average Net Assets D, F | | | | | |
Expenses before reductions | 1.44% | 1.58% | 1.77% | 2.13% | 2.46% |
Expenses net of fee waivers, if any | 1.43% | 1.45% | 1.45% | 1.50% | 1.50% |
Expenses net of all reductions | 1.42% | 1.44% | 1.43% | 1.48% | 1.47% |
Net investment income (loss) | .80% | .99% | .92% | .74% | .85% |
Supplemental Data | | | | | |
Net assets, end of period (000 omitted) | $ 74,595 | $ 21,874 | $ 6,352 | $ 3,084 | $ 1,452 |
Portfolio turnover rate E | 32% | 32% | 68% | 87% | 116% |
A Total returns would have been lower if certain expenses had not been reduced during the applicable periods shown.
B Total returns do not include the effect of the sales charges.
C Calculated based on average shares outstanding during the period.
D Fees and expenses of any underlying Fidelity Central Funds are not included in the Fund's expense ratio. The Fund indirectly bears its proportionate share of the expenses of any underlying Fidelity Central Funds.
E Amount does not include the portfolio activity of any underlying Fidelity Central Funds.
F Expense ratios reflect operating expenses of the class. Expenses before reductions do not reflect amounts reimbursed by the investment adviser or reductions from brokerage service arrangements or reductions from other expense offset arrangements and do not represent the amount paid by the class during periods when reimbursements or reductions occur. Expenses net of fee waivers reflect expenses after reimbursement by the investment adviser but prior to reductions from brokerage service arrangements or other expense offset arrangements. Expenses net of all reductions represent the net expenses paid by the class.
G Amount represents less than $.01 per share.
H Total distributions of $.07 per share is comprised of distributions from net investment income of $.046 and distributions from net realized gain of $.025 per share.
See accompanying notes which are an integral part of the financial statements.
Annual Report
Financial Highlights - Class T
Years ended October 31, | 2013 | 2012 | 2011 | 2010 | 2009 |
Selected Per-Share Data | | | | | |
Net asset value, beginning of period | $ 8.89 | $ 8.08 | $ 8.38 | $ 7.00 | $ 5.45 |
Income from Investment Operations | | | | | |
Net investment income (loss) C | .05 | .06 | .06 | .04 | .03 |
Net realized and unrealized gain (loss) | 1.88 | .81 | (.31) | 1.39 | 1.55 |
Total from investment operations | 1.93 | .87 | (.25) | 1.43 | 1.58 |
Distributions from net investment income | (.07) | (.05) | (.04) | (.02) | (.03) |
Distributions from net realized gain | (.01) | (.01) | (.01) | (.03) | - |
Total distributions | (.07) H | (.06) | (.05) | (.05) | (.03) |
Redemption fees added to paid in capital C, G | - | - | - | - | - |
Net asset value, end of period | $ 10.75 | $ 8.89 | $ 8.08 | $ 8.38 | $ 7.00 |
Total Return A, B | 21.91% | 10.82% | (3.03)% | 20.47% | 29.22% |
Ratios to Average Net Assets D, F | | | | | |
Expenses before reductions | 1.69% | 1.85% | 2.03% | 2.41% | 2.67% |
Expenses net of fee waivers, if any | 1.69% | 1.70% | 1.70% | 1.75% | 1.75% |
Expenses net of all reductions | 1.68% | 1.69% | 1.68% | 1.73% | 1.73% |
Net investment income (loss) | .54% | .74% | .67% | .49% | .59% |
Supplemental Data | | | | | |
Net assets, end of period (000 omitted) | $ 23,118 | $ 10,690 | $ 2,917 | $ 1,034 | $ 532 |
Portfolio turnover rate E | 32% | 32% | 68% | 87% | 116% |
A Total returns would have been lower if certain expenses had not been reduced during the applicable periods shown.
B Total returns do not include the effect of the sales charges.
C Calculated based on average shares outstanding during the period.
D Fees and expenses of any underlying Fidelity Central Funds are not included in the Fund's expense ratio. The Fund indirectly bears its proportionate share of the expenses of any underlying Fidelity Central Funds.
E Amount does not include the portfolio activity of any underlying Fidelity Central Funds.
F Expense ratios reflect operating expenses of the class. Expenses before reductions do not reflect amounts reimbursed by the investment adviser or reductions from brokerage service arrangements or reductions from other expense offset arrangements and do not represent the amount paid by the class during periods when reimbursements or reductions occur. Expenses net of fee waivers reflect expenses after reimbursement by the investment adviser but prior to reductions from brokerage service arrangements or other expense offset arrangements. Expenses net of all reductions represent the net expenses paid by the class.
G Amount represents less than $.01 per share.
H Total distributions of $.07 per share is comprised of distributions from net investment income of $.069 and distributions from net realized gain of $.005 per share.
See accompanying notes which are an integral part of the financial statements.
Annual Report
Financial Highlights - Class B
Years ended October 31, | 2013 | 2012 | 2011 | 2010 | 2009 |
Selected Per-Share Data | | | | | |
Net asset value, beginning of period | $ 8.88 | $ 8.06 | $ 8.36 | $ 6.98 | $ 5.42 |
Income from Investment Operations | | | | | |
Net investment income (loss) C | - G | .02 | .01 | - G | .01 |
Net realized and unrealized gain (loss) | 1.89 | .80 | (.30) | 1.38 | 1.55 |
Total from investment operations | 1.89 | .82 | (.29) | 1.38 | 1.56 |
Distributions from net investment income | (.03) | - | (.01) | - | - |
Distributions from net realized gain | (.01) | - | - G | - | - |
Total distributions | (.04) | - | (.01) | - | - |
Redemption fees added to paid in capital C, G | - | - | - | - | - |
Net asset value, end of period | $ 10.73 | $ 8.88 | $ 8.06 | $ 8.36 | $ 6.98 |
Total Return A, B | 21.35% | 10.17% | (3.47)% | 19.77% | 28.78% |
Ratios to Average Net Assets D, F | | | | | |
Expenses before reductions | 2.19% | 2.35% | 2.55% | 2.87% | 3.17% |
Expenses net of fee waivers, if any | 2.18% | 2.20% | 2.20% | 2.25% | 2.25% |
Expenses net of all reductions | 2.17% | 2.19% | 2.18% | 2.23% | 2.23% |
Net investment income (loss) | .05% | .24% | .17% | (.01)% | .09% |
Supplemental Data | | | | | |
Net assets, end of period (000 omitted) | $ 1,579 | $ 1,116 | $ 473 | $ 581 | $ 328 |
Portfolio turnover rate E | 32% | 32% | 68% | 87% | 116% |
A Total returns would have been lower if certain expenses had not been reduced during the applicable periods shown.
B Total returns do not include the effect of the contingent deferred sales charge.
C Calculated based on average shares outstanding during the period.
D Fees and expenses of any underlying Fidelity Central Funds are not included in the Fund's expense ratio. The Fund indirectly bears its proportionate share of the expenses of any underlying Fidelity Central Funds.
E Amount does not include the portfolio activity of any underlying Fidelity Central Funds.
F Expense ratios reflect operating expenses of the class. Expenses before reductions do not reflect amounts reimbursed by the investment adviser or reductions from brokerage service arrangements or reductions from other expense offset arrangements and do not represent the amount paid by the class during periods when reimbursements or reductions occur. Expenses net of fee waivers reflect expenses after reimbursement by the investment adviser but prior to reductions from brokerage service arrangements or other expense offset arrangements. Expenses net of all reductions represent the net expenses paid by the class.
G Amount represents less than $.01 per share.
See accompanying notes which are an integral part of the financial statements.
Annual Report
Financial Highlights - Class C
Years ended October 31, | 2013 | 2012 | 2011 | 2010 | 2009 |
Selected Per-Share Data | | | | | |
Net asset value, beginning of period | $ 8.84 | $ 8.03 | $ 8.34 | $ 6.98 | $ 5.42 |
Income from Investment Operations | | | | | |
Net investment income (loss) C | .01 | .02 | .01 | - G | .01 |
Net realized and unrealized gain (loss) | 1.87 | .80 | (.31) | 1.38 | 1.55 |
Total from investment operations | 1.88 | .82 | (.30) | 1.38 | 1.56 |
Distributions from net investment income | (.02) | (.01) | (.01) | - | - |
Distributions from net realized gain | (.01) | (.01) | (.01) | (.02) | - |
Total distributions | (.03) | (.01) I | (.01) H | (.02) | - |
Redemption fees added to paid in capital C, G | - | - | - | - | - |
Net asset value, end of period | $ 10.69 | $ 8.84 | $ 8.03 | $ 8.34 | $ 6.98 |
Total Return A, B | 21.29% | 10.27% | (3.57)% | 19.82% | 28.78% |
Ratios to Average Net Assets D, F | | | | | |
Expenses before reductions | 2.19% | 2.33% | 2.52% | 2.89% | 3.21% |
Expenses net of fee waivers, if any | 2.18% | 2.20% | 2.20% | 2.25% | 2.25% |
Expenses net of all reductions | 2.17% | 2.19% | 2.18% | 2.24% | 2.23% |
Net investment income (loss) | .05% | .24% | .17% | (.01)% | .09% |
Supplemental Data | | | | | |
Net assets, end of period (000 omitted) | $ 17,196 | $ 5,648 | $ 2,767 | $ 1,261 | $ 780 |
Portfolio turnover rate E | 32% | 32% | 68% | 87% | 116% |
A Total returns would have been lower if certain expenses had not been reduced during the applicable periods shown.
B Total returns do not include the effect of the contingent deferred sales charge.
C Calculated based on average shares outstanding during the period.
D Fees and expenses of any underlying Fidelity Central Funds are not included in the Fund's expense ratio. The Fund indirectly bears its proportionate share of the expenses of any underlying Fidelity Central Funds.
E Amount does not include the portfolio activity of any underlying Fidelity Central Funds.
F Expense ratios reflect operating expenses of the class. Expenses before reductions do not reflect amounts reimbursed by the investment adviser or reductions from brokerage service arrangements or reductions from other expense offset arrangements and do not represent the amount paid by the class during periods when reimbursements or reductions occur. Expenses net of fee waivers reflect expenses after reimbursement by the investment adviser but prior to reductions from brokerage service arrangements or other expense offset arrangements. Expenses net of all reductions represent the net expenses paid by the class.
G Amount represents less than $.01 per share.
H Total distributions of $.01 per share is comprised of distributions from net investment income of $.008 and distributions from net realized gain of $.005 per share.
I Total distributions of $.01 per share is comprised of distributions from net investment income of $.007 and distributions from net realized gain of $.006 per share.
See accompanying notes which are an integral part of the financial statements.
Annual Report
Financial Highlights - International Growth
Years ended October 31, | 2013 | 2012 | 2011 | 2010 | 2009 |
Selected Per-Share Data | | | | | |
Net asset value, beginning of period | $ 8.95 | $ 8.12 | $ 8.40 | $ 7.02 | $ 5.48 |
Income from Investment Operations | | | | | |
Net investment income (loss) B | .11 | .11 | .10 | .07 | .06 |
Net realized and unrealized gain (loss) | 1.88 | .81 | (.30) | 1.39 | 1.54 |
Total from investment operations | 1.99 | .92 | (.20) | 1.46 | 1.60 |
Distributions from net investment income | (.10) | (.08) | (.07) | (.06) | (.06) |
Distributions from net realized gain | (.01) | (.01) | (.01) | (.03) | - |
Total distributions | (.10) H | (.09) | (.08) | (.08) G | (.06) |
Redemption fees added to paid in capital B, F | - | - | - | - | - |
Net asset value, end of period | $ 10.84 | $ 8.95 | $ 8.12 | $ 8.40 | $ 7.02 |
Total Return A | 22.48% | 11.41% | (2.47)% | 20.97% | 29.77% |
Ratios to Average Net Assets C, E | | | | | |
Expenses before reductions | 1.13% | 1.28% | 1.52% | 1.89% | 2.19% |
Expenses net of fee waivers, if any | 1.13% | 1.20% | 1.20% | 1.25% | 1.25% |
Expenses net of all reductions | 1.11% | 1.19% | 1.18% | 1.23% | 1.23% |
Net investment income (loss) | 1.11% | 1.24% | 1.17% | .99% | 1.09% |
Supplemental Data | | | | | |
Net assets, end of period (000 omitted) | $ 430,914 | $ 149,526 | $ 53,437 | $ 28,454 | $ 18,254 |
Portfolio turnover rate D | 32% | 32% | 68% | 87% | 116% |
A Total returns would have been lower if certain expenses had not been reduced during the applicable periods shown.
B Calculated based on average shares outstanding during the period.
C Fees and expenses of any underlying Fidelity Central Funds are not included in the Fund's expense ratio. The Fund indirectly bears its proportionate share of the expenses of any underlying Fidelity Central Funds.
D Amount does not include the portfolio activity of any underlying Fidelity Central Funds.
E Expense ratios reflect operating expenses of the class. Expenses before reductions do not reflect amounts reimbursed by the investment adviser or reductions from brokerage service arrangements or reductions from other expense offset arrangements and do not represent the amount paid by the class during periods when reimbursements or reductions occur. Expenses net of fee waivers reflect expenses after reimbursement by the investment adviser but prior to reductions from brokerage service arrangements or other expense offset arrangements. Expenses net of all reductions represent the net expenses paid by the class.
F Amount represents less than $.01 per share.
G Total distributions of $.08 per share is comprised of distributions from net investment income of $.057 and distributions from net realized gain of $.025 per share.
H Total distributions of $.10 per share is comprised of distributions from net investment income of $.097 and distributions from net realized gain of $.005 per share.
See accompanying notes which are an integral part of the financial statements.
Annual Report
Financial Highlights - Institutional Class
Years ended October 31, | 2013 | 2012 | 2011 | 2010 | 2009 |
Selected Per-Share Data | | | | | |
Net asset value, beginning of period | $ 8.94 | $ 8.12 | $ 8.40 | $ 7.02 | $ 5.48 |
Income from Investment Operations | | | | | |
Net investment income (loss) B | .11 | .10 | .10 | .07 | .06 |
Net realized and unrealized gain (loss) | 1.90 | .81 | (.30) | 1.39 | 1.54 |
Total from investment operations | 2.01 | .91 | (.20) | 1.46 | 1.60 |
Distributions from net investment income | (.10) | (.08) | (.07) | (.06) | (.06) |
Distributions from net realized gain | (.01) | (.01) | (.01) | (.03) | - |
Total distributions | (.11) | (.09) | (.08) | (.08) G | (.06) |
Redemption fees added to paid in capital B, F | - | - | - | - | - |
Net asset value, end of period | $ 10.84 | $ 8.94 | $ 8.12 | $ 8.40 | $ 7.02 |
Total Return A | 22.66% | 11.28% | (2.47)% | 20.97% | 29.77% |
Ratios to Average Net Assets C, E | | | | | |
Expenses before reductions | 1.11% | 1.27% | 1.50% | 1.92% | 2.01% |
Expenses net of fee waivers, if any | 1.11% | 1.20% | 1.20% | 1.25% | 1.25% |
Expenses net of all reductions | 1.09% | 1.19% | 1.18% | 1.23% | 1.23% |
Net investment income (loss) | 1.13% | 1.24% | 1.17% | .99% | 1.09% |
Supplemental Data | | | | | |
Net assets, end of period (000 omitted) | $ 38,771 | $ 3,992 | $ 493 | $ 113 | $ 36 |
Portfolio turnover rate D | 32% | 32% | 68% | 87% | 116% |
A Total returns would have been lower if certain expenses had not been reduced during the applicable periods shown.
B Calculated based on average shares outstanding during the period.
C Fees and expenses of any underlying Fidelity Central Funds are not included in the Fund's expense ratio. The Fund indirectly bears its proportionate share of the expenses of any underlying Fidelity Central Funds.
D Amount does not include the portfolio activity of any underlying Fidelity Central Funds.
E Expense ratios reflect operating expenses of the class. Expenses before reductions do not reflect amounts reimbursed by the investment adviser or reductions from brokerage service arrangements or reductions from other expense offset arrangements and do not represent the amount paid by the class during periods when reimbursements or reductions occur. Expenses net of fee waivers reflect expenses after reimbursement by the investment adviser but prior to reductions from brokerage service arrangements or other expense offset arrangements. Expenses net of all reductions represent the net expenses paid by the class.
F Amount represents less than $.01 per share.
G Total distributions of $.08 per share is comprised of distributions from net investment income of $.057 and distributions from net realized gain of $.025 per share.
See accompanying notes which are an integral part of the financial statements.
Annual Report
Financial Highlights - Class Z
Year ended October 31, | 2013 G |
Selected Per-Share Data | |
Net asset value, beginning of period | $ 10.26 |
Income from Investment Operations | |
Net investment income (loss) D | .02 |
Net realized and unrealized gain (loss) | .56 |
Total from investment operations | .58 |
Redemption fees added to paid in capital D, I | - |
Net asset value, end of period | $ 10.84 |
Total Return B, C | 5.65% |
Ratios to Average Net Assets E, H | |
Expenses before reductions | .94% A |
Expenses net of fee waivers, if any | .94% A |
Expenses net of all reductions | .93% A |
Net investment income (loss) | .65% A |
Supplemental Data | |
Net assets, end of period (000 omitted) | $ 106 |
Portfolio turnover rate F | 32% |
A Annualized
B Total returns for periods of less than one year are not annualized.
C Total returns would have been lower if certain expenses had not been reduced during the applicable periods shown.
D Calculated based on average shares outstanding during the period.
E Fees and expenses of any underlying Fidelity Central Funds are not included in the Fund's expense ratio. The Fund indirectly bears its proportionate share of the expenses of any underlying Fidelity Central Funds.
F Amount does not include the portfolio activity of any underlying Fidelity Central Funds.
G For the period August 13, 2013 (commencement of sale of shares) to October 31, 2013.
H Expense ratios reflect operating expenses of the class. Expenses before reductions do not reflect amounts reimbursed by the investment adviser or reductions from brokerage service arrangements or reductions from other expense offset arrangements and do not represent the amount paid by the class during periods when reimbursements or reductions occur. Expense ratios before reductions for start-up periods may not be representative of longer-term operating periods. Expenses net of fee waivers reflect expenses after reimbursement by the investment adviser but prior to reductions from brokerage service arrangements or other expense offset arrangements. Expenses net of all reductions represent the net expenses paid by the class.
I Amount represents less than $.01 per share.
See accompanying notes which are an integral part of the financial statements.
Annual Report
Notes to Financial Statements
For the period ended October 31, 2013
1. Organization.
Fidelity International Growth Fund (the Fund) is a fund of Fidelity Investment Trust (the Trust) and is authorized to issue an unlimited number of shares. The Trust is registered under the Investment Company Act of 1940, as amended (the 1940 Act), as an open-end management investment company organized as a Massachusetts business trust. The Fund commenced sale of Class Z shares on August 13, 2013. The Fund offers Class A, Class T, Class C, International Growth, Institutional Class and Class Z shares, each of which, along with Class B shares, has equal rights as to assets and voting privileges. Class B shares are closed to new accounts and additional purchases, except for exchanges and reinvestments. Each class has exclusive voting rights with respect to matters that affect that class. Class B shares will automatically convert to Class A shares after a holding period of seven years from the initial date of purchase.
2. Investments in Fidelity Central Funds.
The Fund invests in Fidelity Central Funds, which are open-end investment companies generally available only to other investment companies and accounts managed by which Fidelity Management & Research Company (FMR) and its affiliates. The Fund's Schedule of Investments lists each of the Fidelity Central Funds held as of period end, if any, as an investment of the Fund, but does not include the underlying holdings of each Fidelity Central Fund. As an Investing Fund, the Fund indirectly bears its proportionate share of the expenses of the underlying Fidelity Central Funds.
The Money Market Central Funds seek preservation of capital and current income and are managed by Fidelity Investments Money Management, Inc. (FIMM), an affiliate of FMR.
A complete unaudited list of holdings for each Fidelity Central Fund is available upon request or at the Securities and Exchange Commission (the SEC) website at www.sec.gov. In addition, the financial statements of the Fidelity Central Funds, which are not covered by the Fund's Report of Independent Registered Public Accounting Firm, are available on the SEC website or upon request.
3. Significant Accounting Policies.
The financial statements have been prepared in conformity with accounting principles generally accepted in the United States of America (GAAP), which require management to make certain estimates and assumptions at the date of the financial statements. Actual results could differ from those estimates. Subsequent events, if any, through the date that the financial statements were issued have been evaluated in the preparation of
Annual Report
3. Significant Accounting Policies - continued
the financial statements. The following summarizes the significant accounting policies of the Fund:
Investment Valuation. Investments are valued as of 4:00 p.m. Eastern time on the last calendar day of the period. In accordance with valuation policies and procedures approved by the Board of Trustees (the Board), the Fund attempts to obtain prices from one or more third party pricing vendors or brokers to value its investments. When current market prices, quotations or currency exchange rates are not readily available or reliable, investments will be fair valued in good faith by the FMR Fair Value Committee (the Committee), in accordance with procedures adopted by the Board. Factors used in determining fair value vary by investment type and may include market or investment specific events. The frequency with which these procedures are used cannot be predicted and they may be utilized to a significant extent. The Committee oversees the Fund's valuation policies and procedures and is responsible for approving and reporting to the Board all fair value determinations.
The Fund categorizes the inputs to valuation techniques used to value its investments into a disclosure hierarchy consisting of three levels as shown below:
Level 1 - quoted prices in active markets for identical investments
Level 2 - other significant observable inputs (including quoted prices for similar investments, interest rates, prepayment speeds, etc.)
Level 3 - unobservable inputs (including the Fund's own assumptions based on the best information available)
Valuation techniques used to value the Fund's investments by major category are as follows:
Equity securities, including restricted securities, for which market quotations are readily available, are valued at the last reported sale price or official closing price as reported by a third party pricing vendor on the primary market or exchange on which they are traded and are categorized as Level 1 in the hierarchy. In the event there were no sales during the day or closing prices are not available, securities are valued at the last quoted bid price or may be valued using the last available price and are generally categorized as Level 2 in the hierarchy. For foreign equity securities, when market or security specific events arise, comparisons to the valuation of American Depositary Receipts (ADRs), futures contracts, Exchange-Traded Funds (ETFs) and certain indexes as well as quoted prices for similar securities may be used and would be categorized as Level 2 in the hierarchy. Utilizing these techniques may result in transfers between Level 1 and Level 2. For equity securities, including restricted securities, where observable inputs are limited, assumptions about market activity and risk are used and these securities may be categorized as Level 3 in the hierarchy.
Annual Report
Notes to Financial Statements - continued
3. Significant Accounting Policies - continued
Investment Valuation - continued
Investments in open-end mutual funds, including the Fidelity Central Funds, are valued at their closing net asset value (NAV) each business day and are categorized as Level 1 in the hierarchy.
Changes in valuation techniques may result in transfers in or out of an assigned level within the disclosure hierarchy. The aggregate value of investments by input level, as of October 31, 2013, including information on transfers between Levels 1 and 2, is included at the end of the Fund's Schedule of Investments.
Foreign Currency. The Fund may use foreign currency contracts to facilitate transactions in foreign-denominated securities. Gains and losses from these transactions may arise from changes in the value of the foreign currency or if the counterparties do not perform under the contracts' terms.
Foreign-denominated assets, including investment securities, and liabilities are translated into U.S. dollars at the exchange rates at period end. Purchases and sales of investment securities, income and dividends received and expenses denominated in foreign currencies are translated into U.S. dollars at the exchange rate in effect on the transaction date.
The effects of exchange rate fluctuations on investments are included with the net realized and unrealized gain (loss) on investment securities. Other foreign currency transactions resulting in realized and unrealized gain (loss) are disclosed separately.
Investment Transactions and Income. For financial reporting purposes, the Fund's investment holdings and NAV include trades executed through the end of the last business day of the period. The NAV per share for processing shareholder transactions is calculated as of the close of business of the New York Stock Exchange (NYSE), normally 4:00 p.m. Eastern time and includes trades executed through the end of the prior business day. Gains and losses on securities sold are determined on the basis of identified cost. Dividend income is recorded on the ex-dividend date, except for certain dividends from foreign securities where the ex-dividend date may have passed, which are recorded as soon as the Fund is informed of the ex-dividend date. Non-cash dividends included in dividend income, if any, are recorded at the fair market value of the securities received. Interest income and distributions from the Fidelity Central Funds are accrued as earned. Interest income includes coupon interest and amortization of premium and accretion of discount on debt securities. Investment income is recorded net of foreign taxes withheld where recovery of such taxes is uncertain.
Class Allocations and Expenses. Investment income, realized and unrealized capital gains and losses, common expenses of the Fund, and certain fund-level expense
Annual Report
3. Significant Accounting Policies - continued
Class Allocations and Expenses - continued
reductions, if any, are allocated daily on a pro-rata basis to each class based on the relative net assets of each class to the total net assets of the Fund. Each class differs with respect to transfer agent and distribution and service plan fees incurred. Certain expense reductions may also differ by class. For the reporting period, the allocated portion of income and expenses to each class as a percent of its average net assets may vary due to the timing of recording these transactions in relation to fluctuating net assets of the classes. Expenses directly attributable to a fund are charged to that fund. Expenses attributable to more than one fund are allocated among the respective funds on the basis of relative net assets or other appropriate methods. Expense estimates are accrued in the period to which they relate and adjustments are made when actual amounts are known.
Income Tax Information and Distributions to Shareholders. Each year, the Fund intends to qualify as a regulated investment company under Subchapter M of the Internal Revenue Code, including distributing substantially all of its taxable income and realized gains. As a result, no provision for U.S. Federal income taxes is required. As of October 31, 2013, the Fund did not have any unrecognized tax benefits in the financial statements; nor is the Fund aware of any tax positions for which it is reasonably possible that the total amounts of unrecognized tax benefits will significantly change in the next twelve months. The Fund files a U.S. federal tax return, in addition to state and local tax returns as required. The Fund's federal income tax returns are subject to examination by the Internal Revenue Service (IRS) for a period of three fiscal years after they are filed. State and local tax returns may be subject to examination for an additional fiscal year depending on the jurisdiction. Foreign taxes are provided for based on the Fund's understanding of the tax rules and rates that exist in the foreign markets in which it invests.
Distributions are declared and recorded on the ex-dividend date. Income dividends and capital gain distributions are declared separately for each class. Income and capital gain distributions are determined in accordance with income tax regulations, which may differ from GAAP. In addition, the Fund claimed a portion of the payment made to redeeming shareholders as a distribution for income tax purposes.
Capital accounts within the financial statements are adjusted for permanent book-tax differences. These adjustments have no impact on net assets or the results of operations. Temporary book-tax differences will reverse in a subsequent period.
Book-tax differences are primarily due to futures contracts, foreign currency transactions, passive foreign investment companies (PFIC), partnerships, capital loss carryforwards, and losses deferred due to wash sales.
Annual Report
Notes to Financial Statements - continued
3. Significant Accounting Policies - continued
Income Tax Information and Distributions to Shareholders - continued
The federal tax cost of investment securities and unrealized appreciation (depreciation) as of period end were as follows:
Gross unrealized appreciation | $ 77,456,036 |
Gross unrealized depreciation | (6,897,408) |
Net unrealized appreciation (depreciation) on securities and other investments | $ 70,558,628 |
| |
Tax Cost | $ 533,961,209 |
The tax-based components of distributable earnings as of period end were as follows:
Undistributed ordinary income | $ 2,476,993 |
Undistributed long-term capital gain | $ 516,487 |
Net unrealized appreciation (depreciation) | $ 70,555,556 |
The tax character of distributions paid was as follows:
| October 31, 2013 | October 31, 2012 |
Ordinary Income | $ 2,195,105 | $ 643,383 |
Short-Term Trading (Redemption) Fees. Shares held by investors in the Fund less than 30 days may have been subject to a redemption fee equal to 1.00% of the net asset value of shares redeemed. All redemption fees, which reduce the proceeds of the shareholder redemption, are retained by the Fund and accounted for as an addition to paid in capital.
New Accounting Pronouncement. The Financial Accounting Standards Board issued in December 2011, Accounting Standard Update No. 2011-11, Disclosures about Offsetting Assets and Liabilities, and in January 2013, Accounting Standards Update No. 2013-1 Clarifying the Scope of Disclosures about Offsetting Assets and Liabilities. These updates create new disclosure requirements requiring entities to disclose both gross and net information for derivatives and other financial instruments that are either offset in the Statement of Assets and Liabilities or subject to an enforceable master netting arrangement or similar agreement. The disclosure requirements are effective for annual reporting periods beginning on or after January 1, 2013, and interim periods within those annual periods. Management expects that the impact of the updates' adoption will be limited to additional financial statement disclosures as applicable.
Annual Report
4. Derivative Instruments.
Risk Exposures and the Use of Derivative Instruments. The Fund's investment objective allows the Fund to enter into various types of derivative contracts, including futures contracts. Derivatives are investments whose value is primarily derived from underlying assets, indices or reference rates and may be transacted on an exchange or over-the-counter (OTC). Derivatives may involve a future commitment to buy or sell a specified asset based on specified terms, to exchange future cash flows at periodic intervals based on a notional principal amount, or for one party to make one or more payments upon the occurrence of specified events in exchange for periodic payments from the other party.
The Fund used derivatives to increase returns and to manage exposure to certain risks as defined below. The success of any strategy involving derivatives depends on analysis of numerous economic factors, and if the strategies for investment do not work as intended, the Fund may not achieve its objectives.
The Fund's use of derivatives increased or decreased its exposure to the following risk:
Equity Risk | Equity risk relates to the fluctuations in the value of financial instruments as a result of changes in market prices (other than those arising from interest rate risk or foreign exchange risk), whether caused by factors specific to an individual investment, its issuer, or all factors affecting all instruments traded in a market or market segment. |
The Fund is also exposed to additional risks from investing in derivatives, such as liquidity risk and counterparty credit risk. Liquidity risk is the risk that the Fund will be unable to close out the derivative in the open market in a timely manner. Counterparty credit risk is the risk that the counterparty will not be able to fulfill its obligation to the Fund. Counterparty credit risk related to exchange-traded futures contracts may be mitigated by the protection provided by the exchange on which they trade.
Investing in derivatives may involve greater risks than investing in the underlying assets directly and, to varying degrees, may involve risk of loss in excess of any initial investment and collateral received and amounts recognized in the Statement of Assets and Liabilities. In addition, there may be the risk that the change in value of the derivative contract does not correspond to the change in value of the underlying instrument.
Futures Contracts. A futures contract is an agreement between two parties to buy or sell a specified underlying instrument for a fixed price at a specified future date. The Fund used futures contracts to manage its exposure to the stock market.
Upon entering into a futures contract, a fund is required to deposit either cash or securities (initial margin) with a clearing broker in an amount equal to a certain percentage of the face value of the contract. Futures contracts are marked-to-market daily and subsequent daily payments (variation margin) are made or received by a fund depending on
Annual Report
Notes to Financial Statements - continued
4. Derivative Instruments - continued
Futures Contracts - continued
the daily fluctuations in the value of the futures contracts and are recorded as unrealized appreciation or (depreciation). This receivable and/or payable, if any, is included in daily variation margin for derivative instruments in the Statement of Assets and Liabilities. Realized gain or (loss) is recorded upon the expiration or closing of a futures contract.
Any open futures contracts at period end are presented in the Schedule of Investments under the caption "Futures Contracts." The underlying face amount at value reflects each contract's exposure to the underlying instrument or index at period end.
During the period the Fund recognized net realized gain (loss) of $(517,867) related to its investment in futures contracts. This amount is included in the Statement of Operations.
5. Purchases and Sales of Investments.
Purchases and sales of securities, other than short-term securities, aggregated $423,057,094 and $105,902,960, respectively.
6. Fees and Other Transactions with Affiliates.
Management Fee. FMR and its affiliates provide the Fund with investment management related services for which the Fund pays a monthly management fee. The management fee is the sum of an individual fund fee rate that is based on an annual rate of .45% of the Fund's average net assets and an annualized group fee rate that averaged .25% during the period. The group fee rate is based upon the average net assets of all the mutual funds advised by FMR, including any mutual funds previously advised by FMR that are currently advised by Fidelity SelectCo, LLC, an affiliate of FMR. The group fee rate decreases as assets under management increase and increases as assets under management decrease. In addition, the management fee is subject to a performance adjustment (up to a maximum of ±.20% of the Fund's average net assets over a 36 month performance period). The upward or downward adjustment to the management fee is based on the relative investment performance of International Growth as compared to an appropriate benchmark index over the same 36 month performance period. For the reporting period, the total annual management fee rate, including the performance adjustment, was .75% of the Fund's average net assets. The performance adjustment included in the management fee rate may be higher or lower than the maximum performance adjustment rate due to the difference between the average net assets for the reporting and performance periods.
Distribution and Service Plan Fees. In accordance with Rule 12b-1 of the 1940 Act, the Fund has adopted separate Distribution and Service Plans for each class of shares.
Annual Report
6. Fees and Other Transactions with Affiliates - continued
Distribution and Service Plan Fees - continued
Certain classes pay Fidelity Distributors Corporation (FDC), an affiliate of FMR, separate Distribution and Service Fees, each of which is based on an annual percentage of each class' average net assets. In addition, FDC may pay financial intermediaries for selling shares of the Fund and providing shareholder support services. For the period, the Distribution and Service Fee rates, total fees and amounts retained by FDC were as follows:
| Distribution
Fee | Service
Fee | Total Fees | Retained
by FDC |
Class A | -% | .25% | $ 111,996 | $ 3,731 |
Class T | .25% | .25% | 74,898 | - |
Class B | .75% | .25% | 12,264 | 9,227 |
Class C | .75% | .25% | 113,336 | 38,127 |
| | | $ 312,494 | $ 51,085 |
Sales Load. FDC may receive a front-end sales charge of up to 5.75% for selling Class A shares and 3.50% for selling Class T shares, some of which is paid to financial intermediaries for selling shares of the Fund. Depending on the holding period, FDC may receive contingent deferred sales charges levied on Class A, Class T, Class B, and Class C redemptions. The deferred sales charges range from 5.00% to 1.00% for Class B shares, 1.00% for Class C shares, 1.00% for certain purchases of Class A shares and .25% for certain purchases of Class T shares.
For the period, sales charge amounts retained by FDC were as follows:
| Retained
by FDC |
Class A | $ 55,379 |
Class T | 12,148 |
Class B* | 741 |
Class C* | 2,285 |
| $ 70,553 |
* When Class B and Class C shares are initially sold, FDC pays commissions from its own resources to financial intermediaries through which the sales
are made.
Transfer Agent Fees. Fidelity Investments Institutional Operations Company, Inc., (FIIOC), an affiliate of FMR, is the transfer, dividend disbursing and shareholder servicing agent for each class of the Fund. FIIOC receives account fees and asset-based fees that vary according to the account size and type of account of the shareholders of the respective classes of the Fund, except for Class Z. FIIOC receives an asset-based fee of
Annual Report
Notes to Financial Statements - continued
6. Fees and Other Transactions with Affiliates - continued
Transfer Agent Fees - continued
Class Z's average net assets. FIIOC pays for typesetting, printing and mailing of shareholder reports, except proxy statements.
For the period, transfer agent fees for each class were as follows:
| Amount | % of
Average
Net Assets |
Class A | $ 133,141 | .29 |
Class T | 45,948 | .30 |
Class B | 3,660 | .30 |
Class C | 33,951 | .30 |
International Growth | 618,957 | .24 |
Institutional Class | 30,066 | .22 |
Class Z | 11 | .05* |
| $ 865,734 | |
* Annualized
Accounting and Security Lending Fees. Fidelity Service Company, Inc. (FSC), an affiliate of FMR, maintains the Fund's accounting records. The accounting fee is based on the level of average net assets for each month. Under a separate contract, FSC administers the security lending program. The security lending fee is based on the number and duration of lending transactions.
Brokerage Commissions. The Fund placed a portion of its portfolio transactions with brokerage firms which are affiliates of the investment adviser. Brokerage commissions are included in net realized gain (loss) and change in net unrealized appreciation (depreciation) in the Statement of Operations. The commissions paid to these affiliated firms were $2,164 for the period.
7. Committed Line of Credit.
The Fund participates with other funds managed by FMR or an affiliate in a $4.25 billion credit facility (the "line of credit") to be utilized for temporary or emergency purposes to fund shareholder redemptions or for other short-term liquidity purposes. The Fund has agreed to pay commitment fees on its pro-rata portion of the line of credit, which amounted to $647 and is reflected in Miscellaneous expenses on the Statement of Operations. During the period, there were no borrowings on this line of credit.
8. Security Lending.
The Fund lends portfolio securities through a lending agent from time to time in order to earn additional income. For equity securities, a lending agent is used and may loan
Annual Report
8. Security Lending - continued
securities to certain qualified borrowers, including Fidelity Capital Markets (FCM), a broker-dealer affiliated with the Fund. On the settlement date of the loan, the Fund receives collateral (in the form of U.S. Treasury obligations, letters of credit and/or cash) against the loaned securities and maintains collateral in an amount not less than 100% of the market value of the loaned securities during the period of the loan. The market value of the loaned securities is determined at the close of business of the Fund and any additional required collateral is delivered to the Fund on the next business day. If the borrower defaults on its obligation to return the securities loaned because of insolvency or other reasons, the Fund may apply collateral received from the borrower against the obligation. The Fund may experience delays and costs in recovering the securities loaned. Any cash collateral received is invested in the Fidelity Securities Lending Cash Central Fund. The value of loaned securities and cash collateral at period end are disclosed on the Fund's Statement of Assets and Liabilities. The value of securities loaned to FCM at period end was $812,318. Security lending income represents the income earned on investing cash collateral, less rebates paid to borrowers and any lending agent fees associated with the loan, plus any premium payments received for lending certain types of securities. Security lending income is presented in the Statement of Operations as a component of income from Fidelity Central Funds. Total security lending income during the period amounted to $209,783, including $4,235 from securities loaned to FCM.
9. Expense Reductions.
FMR voluntarily agreed to reimburse a portion of Class A, Class T, Class B, Class C, International Growth and Institutional Class operating expenses. During the period, this reimbursement reduced expenses as follows:
| Reimbursement |
Class A | $ 1,675 |
Class T | 515 |
Class B | 36 |
Class C | 417 |
International Growth | 10,450 |
Institutional Class | 831 |
| $ 13,924 |
In addition, FMR reimbursed a portion of the Fund's operating expenses during the period in the amount of $1,356.
Annual Report
Notes to Financial Statements - continued
9. Expense Reductions - continued
Commissions paid to certain brokers with whom FMR, or its affiliates, places trades on behalf of the Fund include an amount in addition to trade execution, which may be rebated back to the Fund to offset certain expenses. This amount totaled $46,315 for the period.
10. Distributions to Shareholders.
Distributions to shareholders of each class were as follows:
Years ended October 31, | 2013 | 2012 |
From net investment income | | |
Class A | $ 226,330 | $ 50,503 |
Class T | 86,155 | 18,666 |
Class B | 4,290 | - |
Class C | 14,481 | 2,205 |
International Growth | 1,698,830 | 516,958 |
Institutional Class | 51,250 | 6,406 |
Total | $ 2,081,336 | $ 594,738 |
From net realized gain | | |
Class A | $ 13,472 | $ 4,810 |
Class T | 6,243 | 2,196 |
Class B | 631 | - |
Class C | 3,291 | 1,890 |
International Growth | 87,569 | 39,262 |
Institutional Class | 2,563 | 487 |
Total | $ 113,769 | $ 48,645 |
11. Share Transactions.
Transactions for each class of shares were as follows:
| Shares | Dollars |
Years ended October 31, | 2013 A | 2012 | 2013 A | 2012 |
Class A | | | | |
Shares sold | 5,907,169 | 1,901,699 | $ 58,500,264 | $ 16,560,116 |
Reinvestment of distributions | 24,178 | 5,422 | 218,566 | 42,831 |
Shares redeemed | (1,466,703) | (236,851) | (14,226,261) | (2,015,265) |
Net increase (decrease) | 4,464,644 | 1,670,270 | $ 44,492,569 | $ 14,587,682 |
Class T | | | | |
Shares sold | 1,144,706 | 941,446 | $ 11,429,141 | $ 8,178,600 |
Reinvestment of distributions | 10,086 | 2,626 | 91,076 | 20,742 |
Shares redeemed | (206,178) | (102,766) | (2,020,899) | (866,637) |
Net increase (decrease) | 948,614 | 841,306 | $ 9,499,318 | $ 7,332,705 |
Annual Report
11. Share Transactions - continued
| Shares | Dollars |
Years ended October 31, | 2013 A | 2012 | 2013 A | 2012 |
Class B | | | | |
Shares sold | 70,442 | 92,865 | $ 702,618 | $ 806,549 |
Reinvestment of distributions | 531 | - | 4,806 | - |
Shares redeemed | (49,437) | (25,954) | (483,935) | (218,180) |
Net increase (decrease) | 21,536 | 66,911 | $ 223,489 | $ 588,369 |
Class C | | | | |
Shares sold | 1,392,365 | 400,291 | $ 13,520,584 | $ 3,375,948 |
Reinvestment of distributions | 1,911 | 510 | 17,237 | 4,026 |
Shares redeemed | (424,469) | (106,475) | (4,120,400) | (879,489) |
Net increase (decrease) | 969,807 | 294,326 | $ 9,417,421 | $ 2,500,485 |
International Growth | | | | |
Shares sold | 29,198,608 | 13,301,892 | $ 290,678,738 | $ 114,028,412 |
Reinvestment of distributions | 192,126 | 68,821 | 1,742,585 | 544,378 |
Shares redeemed | (6,365,570) | (3,238,606) | (62,814,771) | (27,713,258) |
Net increase (decrease) | 23,025,164 | 10,132,107 | $ 229,606,552 | $ 86,859,532 |
Institutional Class | | | | |
Shares sold | 3,568,741 | 438,656 | $ 35,951,935 | $ 3,841,370 |
Reinvestment of distributions | 5,682 | 655 | 51,476 | 5,178 |
Shares redeemed | (443,392) | (53,696) | (4,427,602) | (443,499) |
Net increase (decrease) | 3,131,031 | 385,615 | $ 31,575,809 | $ 3,403,049 |
Class Z | | | | |
Shares sold | 9,747 | - | $ 100,000 | $ - |
Reinvestment of distributions | - | - | - | - |
Shares redeemed | - | - | - | - |
Net increase (decrease) | 9,747 | - | $ 100,000 | $ - |
A Share transactions for Class Z are for the period August 13, 2013 (commencement of sale of shares) to October 31, 2013.
12. Other.
The Fund's organizational documents provide former and current trustees and officers with a limited indemnification against liabilities arising in connection with the performance of their duties to the Fund. In the normal course of business, the Fund may also enter into contracts that provide general indemnifications. The Fund's maximum exposure under these arrangements is unknown as this would be dependent on future claims that may be made against the Fund. The risk of material loss from such claims is considered remote.
Annual Report
To the Trustees of Fidelity Investment Trust and the Shareholders of Fidelity International Growth Fund:
In our opinion, the accompanying statement of assets and liabilities, including the schedule of investments, and the related statements of operations and of changes in net assets and the financial highlights present fairly, in all material respects, the financial position of Fidelity International Growth Fund (a fund of Fidelity Investment Trust) at October 31, 2013, the results of its operations for the year then ended, the changes in its net assets for each of the two years in the period then ended and the financial highlights for each of the periods indicated, in conformity with accounting principles generally accepted in the United States of America. These financial statements and financial highlights (hereafter referred to as "financial statements") are the responsibility of the Fidelity International Growth Fund's management. Our responsibility is to express an opinion on these financial statements based on our audits. We conducted our audits of these financial statements in accordance with the standards of the Public Company Accounting Oversight Board (United States). Those standards require that we plan and perform the audit to obtain reasonable assurance about whether the financial statements are free of material misstatement. An audit includes examining, on a test basis, evidence supporting the amounts and disclosures in the financial statements, assessing the accounting principles used and significant estimates made by management, and evaluating the overall financial statement presentation. We believe that our audits, which included confirmation of securities at October 31, 2013 by correspondence with the custodian and brokers, provide a reasonable basis for our opinion.
PricewaterhouseCoopers LLP
Boston, Massachusetts
December 11, 2013
Annual Report
The Trustees, Member of the Advisory Board, and executive officers of the trust and fund, as applicable, are listed below. The Board of Trustees governs the fund and is responsible for protecting the interests of shareholders. The Trustees are experienced executives who meet periodically throughout the year to oversee the fund's activities, review contractual arrangements with companies that provide services to the fund, oversee management of the risks associated with such activities and contractual arrangements, and review the fund's performance. Except for James C. Curvey, Ned C. Lautenbach, Ronald P. O'Hanley, and William S. Stavropoulos, each of the Trustees oversees 171 funds. Mr. Curvey oversees 394 funds. Mr. Lautenbach, Mr. O'Hanley, and Mr. Stavropoulos each oversees 245 funds.
The Trustees hold office without limit in time except that (a) any Trustee may resign; (b) any Trustee may be removed by written instrument, signed by at least two-thirds of the number of Trustees prior to such removal; (c) any Trustee who requests to be retired or who has become incapacitated by illness or injury may be retired by written instrument signed by a majority of the other Trustees; and (d) any Trustee may be removed at any special meeting of shareholders by a two-thirds vote of the outstanding voting securities of the trust. Each Trustee who is not an interested person of the trust and the fund (as defined in the 1940 Act) (Independent Trustee), shall retire not later than the last day of the calendar year in which his or her 75th birthday occurs. The Independent Trustees may waive this mandatory retirement age policy with respect to individual Trustees. The executive officers and Advisory Board Member hold office without limit in time, except that any officer and Advisory Board Member may resign or may be removed by a vote of a majority of the Trustees at any regular meeting or any special meeting of the Trustees. Except as indicated, each individual has held the office shown or other offices in the same company for the past five years.
Experience, Skills, Attributes, and Qualifications of the Fund's Trustees. The Governance and Nominating Committee has adopted a statement of policy that describes the experience, qualifications, attributes, and skills that are necessary and desirable for potential Independent Trustee candidates (Statement of Policy). The Board believes that each Trustee satisfied at the time he or she was initially elected or appointed a Trustee, and continues to satisfy, the standards contemplated by the Statement of Policy. The Governance and Nominating Committee also engages professional search firms to help identify potential Independent Trustee candidates who have the experience, qualifications, attributes, and skills consistent with the Statement of Policy. From time to time, additional criteria based on the composition and skills of the current Independent Trustees, as well as experience or skills that may be appropriate in light of future changes to board composition, business conditions, and regulatory or other developments, have also been considered by the professional search firms and the Governance and Nominating Committee. In addition, the Board takes into account the Trustees' commitment and participation in Board and committee meetings, as well as their leadership of standing and ad hoc committees throughout their tenure.
Annual Report
Trustees and Officers - continued
In determining that a particular Trustee was and continues to be qualified to serve as a Trustee, the Board has considered a variety of criteria, none of which, in isolation, was controlling. The Board believes that, collectively, the Trustees have balanced and diverse experience, qualifications, attributes, and skills, which allow the Board to operate effectively in governing the fund and protecting the interests of shareholders. Information about the specific experience, skills, attributes, and qualifications of each Trustee, which in each case led to the Board's conclusion that the Trustee should serve (or continue to serve) as a trustee of the fund, is provided below.
Board Structure and Oversight Function. James C. Curvey is an interested person (as defined in the 1940 Act) and currently serves as Chairman. The Trustees have determined that an interested Chairman is appropriate and benefits shareholders because an interested Chairman has a personal and professional stake in the quality and continuity of services provided to the fund. Independent Trustees exercise their informed business judgment to appoint an individual of their choosing to serve as Chairman, regardless of whether the Trustee happens to be independent or a member of management. The Independent Trustees have determined that they can act independently and effectively without having an Independent Trustee serve as Chairman and that a key structural component for assuring that they are in a position to do so is for the Independent Trustees to constitute a substantial majority for the Board. The Independent Trustees also regularly meet in executive session. Ned C. Lautenbach serves as Chairman of the Independent Trustees and as such (i) acts as a liaison between the Independent Trustees and management with respect to matters important to the Independent Trustees and (ii) with management prepares agendas for Board meetings.
Fidelity funds are overseen by different Boards of Trustees. The fund's Board oversees Fidelity's equity and high income funds and another Board oversees Fidelity's investment-grade bond, money market, and asset allocation funds. The asset allocation funds may invest in Fidelity funds overseen by the fund's Board. The use of separate Boards, each with its own committee structure, allows the Trustees of each group of Fidelity funds to focus on the unique issues of the funds they oversee, including common research, investment, and operational issues. On occasion, the separate Boards establish joint committees to address issues of overlapping consequences for the Fidelity funds overseen by each Board.
The Trustees operate using a system of committees to facilitate the timely and efficient consideration of all matters of importance to the Trustees, the fund, and fund shareholders and to facilitate compliance with legal and regulatory requirements and oversight of the fund's activities and associated risks. The Board, acting through its committees, has charged FMR and its affiliates with (i) identifying events or circumstances the occurrence of which could have demonstrably adverse effects on the fund's business and/or reputation; (ii) implementing processes and controls to lessen the possibility that such events or circumstances occur or to mitigate the effects of such events or circumstances if they do occur; and (iii) creating and maintaining a system designed to evaluate continuously business and market conditions in order to facilitate the identification and implementation processes described in (i) and (ii) above. Because the day-to-day operations and activities of the fund are carried out by or through FMR, its affiliates and other service providers, the fund's exposure to risks is mitigated but not eliminated by the processes overseen by the Trustees. While each of the Board's committees has responsibility for overseeing different aspects of the fund's activities, oversight is exercised primarily through the Operations, Audit, and Compliance Committees. In addition, the Independent Trustees have worked with FMR to enhance the Board's oversight of investment and financial risks, legal and regulatory risks, technology risks, and operational risks, including the development of additional risk reporting to the Board. For example, a working group comprised of Independent Trustees and FMR has worked and continues to work to review the Fidelity funds' valuation-related activities, reporting and risk management. Appropriate personnel, including but not limited to the fund's Chief Compliance Officer (CCO), FMR's internal auditor, the independent accountants, the fund's Treasurer and portfolio management personnel, make periodic reports to the Board's committees, as appropriate, including an annual review of FMR's risk management program for the Fidelity funds. The responsibilities of each standing committee, including their oversight responsibilities, are described further under "Standing Committees of the Fund's Trustees."
Annual Report
The fund's Statement of Additional Information (SAI) includes more information about the Trustees. To request a free copy, call Fidelity at 1-877-208-0098.
Interested Trustees*:
Correspondence intended for each Trustee who is an interested person may be sent to Fidelity Investments, 245 Summer Street, Boston, Massachusetts 02210.
Name, Year of Birth; Principal Occupations and Other Relevant Experience+ |
James C. Curvey (1935) |
Year of Election or Appointment: 2007 Trustee Chairman of the Board of Trustees |
| Mr. Curvey also serves as Trustee of other Fidelity funds. Mr. Curvey is a Director of Fidelity Investments Money Management, Inc. (2009-present), Director of Fidelity Research & Analysis Co. (2009-present) and Director of FMR and FMR Co., Inc. (2007-present). Mr. Curvey is also Vice Chairman (2007-present) and Director of FMR LLC. In addition, Mr. Curvey serves as an Overseer for the Boston Symphony Orchestra and a member of the Trustees of Villanova University. Previously, Mr. Curvey was the Vice Chairman (2006-2007) and Director (2000-2007) of FMR Corp. |
Ronald P. O'Hanley (1957) |
Year of Election or Appointment: 2011 Trustee |
| Mr. O'Hanley also serves as Trustee of other Fidelity funds. He is Director of Fidelity SelectCo, LLC (2013-present), FMR Co., Inc. (2010-present), Director of Fidelity Investments Money Management, Inc. (2010-present), Director of Fidelity Research & Analysis Company (2010-present), President of Fidelity Asset Management and Corporate Services and a Member of Fidelity's Executive Committee (2010-present). Previously, Mr. O'Hanley served as President and Chief Executive Officer of BNY Mellon Asset Management (2007-2010). Mr. O'Hanley also served as Vice Chairman of Bank New York Mellon Corp. and a member of that firm's Executive Committee. Prior to the 2007 merger of The Bank of New York and Mellon Financial Corporation, he was Vice Chairman of Mellon Financial Corporation and President and Chief Executive Officer of Mellon Asset Management. He joined Mellon in February 1997. Mr. O'Hanley currently serves as Chairman of the Boston Public Library Foundation Board of Directors and sits on the Board of Directors of Beth Israel Deaconess Medical Center, the Board of Trustees of the Marine Biological Laboratory and the Advisory Board of the Maxwell School of Citizenship and Public Administration at Syracuse University. Mr. O'Hanley also chairs the Council on Asset Management for the Financial Services Roundtable and is a member of the Board of Directors of Institutional Investor's U.S. Institute. |
* Trustees have been determined to be "Interested Trustees" by virtue of, among other things, their affiliation with the trust or various entities under common control with FMR.
+ The information above includes each Trustee's principal occupation during the last five years and other information relating to the experience, attributes, and skills relevant to each Trustee's qualifications to serve as a Trustee, which led to the conclusion that each Trustee should serve as a Trustee for the fund.
Annual Report
Independent Trustees:
Correspondence intended for each Independent Trustee (that is, the Trustees other than the Interested Trustees) may be sent to Fidelity Investments, P.O. Box 55235, Boston, Massachusetts 02205-5235.
Name, Year of Birth; Principal Occupations and Other Relevant Experience+ |
Dennis J. Dirks (1948) |
Year of Election or Appointment: 2005 Trustee |
| Mr. Dirks also serves as Trustee of other Fidelity funds. Prior to his retirement in May 2003, Mr. Dirks was Chief Operating Officer and a member of the Board of The Depository Trust & Clearing Corporation (DTCC). He also served as President, Chief Operating Officer, and Board member of The Depository Trust Company (DTC) and President and Board member of the National Securities Clearing Corporation (NSCC). In addition, Mr. Dirks served as Chief Executive Officer and Board member of the Government Securities Clearing Corporation, Chief Executive Officer and Board member of the Mortgage-Backed Securities Clearing Corporation, as a Trustee and a member of the Finance Committee of Manhattan College (2005-2008), and as a Trustee and a member of the Finance Committee of AHRC of Nassau County (2006-2008). Mr. Dirks is a member of the Independent Directors Council (IDC) Governing Council (2010-present) and Board of Directors for The Brookville Center for Children's Services, Inc. (2009-present). |
Alan J. Lacy (1953) |
Year of Election or Appointment: 2008 Trustee |
| Mr. Lacy also serves as Trustee of other Fidelity funds. Mr. Lacy serves as Senior Adviser (2007-present) of Oak Hill Capital Partners, L.P. (private equity). Mr. Lacy also served as Chief Executive Officer (2000-2005) and Vice Chairman (2005-2006) of Sears Holdings Corporation and Sears, Roebuck and Co. (retail). In addition, Mr. Lacy serves as a member of the Board of Directors of Dave & Buster's Entertainment, Inc. (restaurant and entertainment complexes, 2010-present), Earth Fare, Inc. (retail grocery, 2012-present), The Hillman Companies, Inc. (hardware wholesalers, 2010-present), and Bristol-Myers Squibb Company (global pharmaceuticals, 2008-present). Mr. Lacy is a member of the Board of Trustees of The National Parks Conservation Association (2006-present). Previously, Mr. Lacy served as Chairman of the Board of Trustees of the National Parks Conservation Association (2008-2011) and as a member of the Board of Directors for the Western Union Company (global money transfer, 2006-2011). |
Ned C. Lautenbach (1944) |
Year of Election or Appointment: 2000 Trustee Chairman of the Independent Trustees |
| Mr. Lautenbach also serves as Trustee of other Fidelity funds. Mr. Lautenbach currently serves as the Lead Director of the Eaton Corporation Board of Directors (diversified industrial, 1997-present). Mr. Lautenbach is Chairman of the Board of Directors of the Philharmonic Center for the Arts in Naples, Florida (2012-present) and a member of the Council on Foreign Relations (1994-present). Previously, Mr. Lautenbach was a Partner/Advisory Partner at Clayton, Dubilier & Rice, LLC (private equity investment, 1998-2010), as well as a Director of Sony Corporation (2006-2007). |
Joseph Mauriello (1944) |
Year of Election or Appointment: 2008 Trustee |
| Mr. Mauriello also serves as Trustee of other Fidelity funds. Prior to his retirement in January 2006, Mr. Mauriello served in numerous senior management positions including Deputy Chairman and Chief Operating Officer (2004-2005), and Vice Chairman of Financial Services (2002-2004) of KPMG LLP US (professional services, 1965-2005). Mr. Mauriello currently serves as a member of the Board of Directors of XL Group plc. (global insurance and re-insurance, 2006-present). Previously, Mr. Mauriello served as a Director of the Hamilton Funds of the Bank of New York (2006-2007) and of Arcadia Resources Inc. (health care services and products, 2007-2012). |
Robert W. Selander (1950) |
Year of Election or Appointment: 2011 Trustee |
| Mr. Selander also serves as Trustee of other Fidelity funds. Previously, Mr. Selander served as a Member of the Advisory Board of other Fidelity funds (2011), and Executive Vice Chairman (2010), Chief Executive Officer (2009-2010), and President and Chief Executive Officer (1997-2009) of Mastercard, Inc. |
Cornelia M. Small (1944) |
Year of Election or Appointment: 2005 Trustee |
| Ms. Small also serves as Trustee of other Fidelity funds. Ms. Small is a member of the Board of Directors (2009-present) and Chair of the Investment Committee (2010-present) of the Teagle Foundation. Ms. Small also serves on the Investment Committee of the Berkshire Taconic Community Foundation (2008-present). Previously, Ms. Small served as Chairperson (2002-2008) and a member of the Investment Committee and Chairperson (2008-2012) and a member of the Board of Trustees of Smith College. In addition, Ms. Small served as Chief Investment Officer, Director of Global Equity Investments, and a member of the Board of Directors of Scudder, Stevens & Clark and Scudder Kemper Investments. |
William S. Stavropoulos (1939) |
Year of Election or Appointment: 2001 Trustee Vice Chairman of the Independent Trustees |
| Mr. Stavropoulos also serves as Trustee of other Fidelity funds. Mr. Stavropoulos serves as President and Founder of the Michigan Baseball Foundation, the Great Lakes Loons (2007-present). Mr. Stavropoulos is Chairman Emeritus of the Board of Directors of The Dow Chemical Company, where he previously served in numerous senior management positions, including President, CEO (1995-2000; 2002-2004), Chairman of the Executive Committee (2000-2006), and as a member of the Board of Directors (1990-2006). Currently, Mr. Stavropoulos is Chairman of the Board of Directors of Univar Inc. (global distributor of commodity and specialty chemicals), a Director of Teradata Corporation (data warehousing and technology solutions), and Maersk Inc. (industrial conglomerate), and a member of the Advisory Board for Metalmark Capital LLC (private equity investment, 2005-present). Mr. Stavropoulos is an operating advisor to Clayton, Dubilier & Rice, LLC (private equity investment). In addition, Mr. Stavropoulos is a member of the University of Notre Dame Advisory Council for the College of Science, a Trustee of the Rollin L. Gerstacker Foundation, and a Director of the Naples Philharmonic Center for the Arts. Previously, Mr. Stavropoulos served as a Director of Chemical Financial Corporation (bank holding company, 1993-2012) and Tyco International, Ltd. (multinational manufacturing and services, 2007-2012). |
David M. Thomas (1949) |
Year of Election or Appointment: 2008 Trustee |
| Mr. Thomas also serves as Trustee of other Fidelity funds. Mr. Thomas serves as Non-Executive Chairman of the Board of Directors of Fortune Brands Home and Security (home and security products, 2011-present), and as a member of the Board of Directors of Interpublic Group of Companies, Inc. (marketing communication, 2004-present). Previously, Mr. Thomas served as Executive Chairman (2005-2006) and Chairman and Chief Executive Officer (2000-2005) of IMS Health, Inc. (pharmaceutical and healthcare information solutions), and a Director of Fortune Brands, Inc. (consumer products, 2000-2011). |
+ The information above includes each Trustee's principal occupation during the last five years and other information relating to the experience, attributes, and skills relevant to each Trustee's qualifications to serve as a Trustee, which led to the conclusion that each Trustee should serve as a Trustee for the fund.
Advisory Board Member and Executive Officers:
Correspondence intended for each executive officer and Peter S. Lynch may be sent to Fidelity Investments, 245 Summer Street, Boston, Massachusetts 02210. Executive officers appear below in alphabetical order.
Name, Year of Birth; Principal Occupation |
Peter S. Lynch (1944) |
Year of Election or Appointment: 2003 Member of the Advisory Board |
| Mr. Lynch also serves as Member of the Advisory Board of other Fidelity funds. Mr. Lynch is Vice Chairman and a Director of FMR and FMR Co., Inc. In addition, Mr. Lynch serves as a Trustee of Boston College and as the Chairman of the Inner-City Scholarship Fund. Previously, Mr. Lynch served on the Special Olympics International Board of Directors (1997-2006). |
Elizabeth Paige Baumann (1968) |
Year of Election or Appointment: 2012 Anti-Money Laundering (AML) Officer |
| Ms. Baumann also serves as AML Officer of other funds. She is Chief AML Officer of FMR LLC (2012-present) and is an employee of Fidelity Investments. Previously, Ms. Baumann served as Vice President and Deputy Anti-Money Laundering Officer (2007-2012). |
William C. Coffey (1969) |
Year of Election or Appointment: 2009 Assistant Secretary |
| Mr. Coffey also serves as Assistant Secretary of other funds. He is Senior Vice President and Deputy General Counsel of FMR LLC (2010-present), and is an employee of Fidelity Investments. Previously, Mr. Coffey served as Vice President and Associate General Counsel of FMR LLC (2005-2009). |
Jonathan Davis (1968) |
Year of Election or Appointment: 2010 Assistant Treasurer |
| Mr. Davis also serves as Assistant Treasurer of other funds. Mr. Davis is an employee of Fidelity Investments. Previously, Mr. Davis served as Vice President and Associate General Counsel of FMR LLC (2003-2010). |
Adrien E. Deberghes (1967) |
Year of Election or Appointment: 2008 Deputy Treasurer |
| Mr. Deberghes also serves as an officer of other funds. He is an employee of Fidelity Investments (2008-present). Prior to joining Fidelity Investments, Mr. Deberghes was Senior Vice President of Mutual Fund Administration at State Street Corporation (2007-2008), Senior Director of Mutual Fund Administration at Investors Bank & Trust (2005-2007), and Director of Finance for Dunkin' Brands (2000-2005). |
Stephanie J. Dorsey (1969) |
Year of Election or Appointment: 2010 Assistant Treasurer |
| Ms. Dorsey also serves as an officer of other funds. She is an employee of Fidelity Investments (2008-present) and has served in other fund officer roles. Prior to joining Fidelity Investments, Ms. Dorsey served as Treasurer (2004-2008) of the JPMorgan Mutual Funds and Vice President (2004-2008) of JPMorgan Chase Bank. |
Scott C. Goebel (1968) |
Year of Election or Appointment: 2008 Secretary and Chief Legal Officer (CLO) |
| Mr. Goebel serves as Secretary and CLO of other funds. Mr. Goebel also serves as Secretary of Fidelity Investments Money Management, Inc. (FIMM) (2010-present) and Fidelity Research and Analysis Company (FRAC) (2010-present); General Counsel, Secretary, and Senior Vice President of FMR (2008-present) and FMR Co., Inc. (2008-present); Chief Legal Officer of Fidelity Management & Research (Hong Kong) Limited (2008-present) and Assistant Secretary of Fidelity Management & Research (Japan) Inc. (2008-present), and Fidelity Management & Research (U.K.) Inc. (2008-present). Previously, Mr. Goebel served as Secretary and CLO of other Fidelity funds (2008-2013), Assistant Secretary of FIMM (2008-2010), FRAC (2008-2010), and certain funds (2007-2008); and as Vice President and Secretary of Fidelity Distributors Corporation (FDC) (2005-2007). Mr. Goebel has been employed by FMR LLC or an affiliate since 2001. |
Joseph A. Hanlon (1968) |
Year of Election or Appointment: 2012 Chief Compliance Officer |
| Mr. Hanlon also serves as Chief Compliance Officer of other funds. Mr. Hanlon serves as Compliance Officer of FMR, FMR Co., Inc., Fidelity Investments Money Management, Inc. (FIMM), Fidelity Research and Analysis Company (FRAC), and Fidelity Management & Research (Hong Kong) (2009-present), as Senior Vice President of the Fidelity Asset Management Division (2009-present), and is an employee of Fidelity Investments. Previously, Mr. Hanlon served as Compliance Officer of Fidelity Management & Research (Japan) Inc. (2009-2013), Strategic Advisers, Inc. (2009-2013), and Fidelity Management & Research (U.K.) Inc. (2009-2013). |
Bruce T. Herring (1965) |
Year of Election or Appointment: 2006 Vice President of certain Equity Funds |
| Mr. Herring also serves as Vice President of other funds. He serves as Chief Investment Officer of Fidelity Global Asset Allocation (GAA) (2013-present), Chief Investment Officer and Director of Fidelity Management & Research (U.K.) Inc. (2010-present), Group Chief Investment Officer of FMR, and President of Fidelity Research & Analysis Company (2010-present). Previously, Mr. Herring served as Vice President (2005-2006) and Senior Vice President (2006-2007) of Fidelity Management & Research Company, Vice President of FMR Co., Inc. (2001-2007), and as a portfolio manager for Fidelity U.S. Equity Funds. |
Brian B. Hogan (1964) |
Year of Election or Appointment: 2009 Vice President |
| Mr. Hogan also serves as Vice President of other funds. Mr. Hogan serves as President of FMR's Equity Division (2009-present). Previously, Mr. Hogan served as Senior Vice President, Equity Research of FMR (2006-2009) and as a portfolio manager. |
Chris Maher (1972) |
Year of Election or Appointment: 2013 Assistant Treasurer |
| Mr. Maher serves as Assistant Treasurer of other funds. Mr. Maher is Vice President of Valuation Oversight and is an employee of Fidelity Investments. Previously, Mr. Maher served as Vice President of Asset Management Compliance (2013), Vice President of FMR's Program Management Group (2010-2013), and Vice President of Valuation Oversight (2008-2010). |
Christine Reynolds (1958) |
Year of Election or Appointment: 2008 Chief Financial Officer |
| Ms. Reynolds also serves as Chief Financial Officer of other funds. Ms. Reynolds became President of Fidelity Pricing and Cash Management Services (FPCMS) in August 2008. Ms. Reynolds served as Chief Operating Officer of FPCMS (2007-2008). Previously, Ms. Reynolds served as President, Treasurer, and Anti-Money Laundering officer of the Fidelity funds (2004-2007). |
Kenneth B. Robins (1969) |
Year of Election or Appointment: 2008 President and Treasurer |
| Mr. Robins also serves as an officer of other funds. Mr. Robins serves as Executive Vice President of Fidelity Investments Money Management, Inc. (FIMM) (2013-present) and is an employee of Fidelity Investments (2004-present). Previously, Mr. Robins served in other fund officer roles. |
Gary W. Ryan (1958) |
Year of Election or Appointment: 2005 Assistant Treasurer |
| Mr. Ryan also serves as Assistant Treasurer of other funds. Mr. Ryan is an employee of Fidelity Investments and has served in other fund officer roles. Previously, Mr. Ryan served as Vice President of Fund Reporting in Fidelity Pricing and Cash Management Services (FPCMS) (1999-2005). |
Stephen Sadoski (1971) |
Year of Election or Appointment: 2012 Deputy Treasurer |
| Mr. Sadoski also serves as Deputy Treasurer of other funds. He is an employee of Fidelity Investments (2012-present) and has served in another fund officer role. Prior to joining Fidelity Investments, Mr. Sadoski served as an assistant chief accountant in the Division of Investment Management of the Securities and Exchange Commission (SEC) (2009-2012) and as a senior manager at Deloitte & Touche LLP (1997-2009). |
Stacie M. Smith (1974) |
Year of Election or Appointment: 2013 Deputy Treasurer |
| Ms. Smith also serves as an officer of other funds. She is an employee of Fidelity Investments (2009-present) and has served in other fund officer roles. Prior to joining Fidelity Investments, Ms. Smith served as Senior Audit Manager of Ernst & Young LLP (1996-2009). |
Renee Stagnone (1975) |
Year of Election or Appointment: 2013 Deputy Treasurer |
| Ms. Stagnone also serves as Deputy Treasurer of other funds. Ms. Stagnone is an employee of Fidelity Investments. |
Joseph F. Zambello (1957) |
Year of Election or Appointment: 2011 Deputy Treasurer |
| Mr. Zambello also serves as Deputy Treasurer of other funds. Mr. Zambello is an employee of Fidelity Investments. Previously, Mr. Zambello served as Vice President of FMR's Program Management Group (2009-2011) and Vice President of the Transfer Agent Oversight Group (2005-2009). |
Annual Report
The Board of Trustees of Fidelity International Growth Fund voted to pay to shareholders of record at the opening of business on record date, the following distributions per share derived from capital gains realized from sales of portfolio securities, and dividends derived from net investment income:
| Pay Date | Record Date | Dividends | Capital Gains |
Class Z | 12/09/13 | 12/06/13 | $0.062 | $0.009 |
The fund hereby designates as a capital gain dividend with respect to the taxable year ended October 31, 2013, $585,832 or, if subsequently determined to be different, the net capital gain of such year.
The fund will notify shareholders in January 2014 of amounts for use in preparing 2013 income tax returns.
Annual Report
Board Approval of Investment Advisory Contracts and Management Fees
Fidelity International Growth Fund
Each year, the Board of Trustees, including the Independent Trustees (together, the Board), votes on the renewal of the management contract and sub-advisory agreements (together, the Advisory Contracts) for the fund. The Board, assisted by the advice of fund counsel and Independent Trustees' counsel, requests and considers a broad range of information relevant to the renewal of the Advisory Contracts throughout the year.
The Board meets regularly and, at each of its meetings, covers an extensive agenda of topics and materials and considers factors that are relevant to its annual consideration of the renewal of the fund's Advisory Contracts, including the services and support provided to the fund and its shareholders. The Board has established various standing committees, each composed of and chaired by Independent Trustees with varying backgrounds, to which the Board has assigned specific subject matter responsibilities in order to enhance effective decision-making by the Board. The Board, acting directly and through its Committees, requests and receives information concerning the annual consideration of the renewal of the fund's Advisory Contracts. The Board also meets as needed to consider matters specifically related to the Board's annual consideration of the renewal of Advisory Contracts. Members of the Board may also meet with trustees of other Fidelity funds through ad hoc joint committees to discuss certain matters relevant to the Fidelity funds.
At its July 2013 meeting, the Board, including the Independent Trustees, unanimously determined to renew the fund's Advisory Contracts. In reaching its determination, the Board considered all factors it believed relevant, including (i) the nature, extent, and quality of the services to be provided to the fund and its shareholders (including the investment performance of the fund); (ii) the competitiveness of the fund's management fee and total expense ratio relative to peer funds; (iii) the total costs of the services to be provided by and the profits to be realized by Fidelity from its relationship with the fund; (iv) the extent to which economies of scale exist and would be realized as the fund grows; and (v) whether fee levels reflect these economies of scale, if any, for the benefit of fund shareholders.
In considering whether to renew the Advisory Contracts for the fund, the Board reached a determination, with the assistance of fund counsel and Independent Trustees' counsel and through the exercise of its business judgment, that the renewal of the Advisory Contracts was in the best interests of the fund and its shareholders and that the compensation payable under the Advisory Contracts was fair and reasonable. The Board's decision to renew the Advisory Contracts was not based on any single factor, but rather was based on a comprehensive consideration of all the information provided to the Board at its meetings throughout the year. The Board, in reaching its determination to renew the Advisory Contracts, was aware that shareholders in the fund have a broad range of investment choices available to them, including a wide choice among mutual funds offered by Fidelity's competitors, and that the fund's shareholders, who have the opportunity to review and weigh the disclosure provided by the fund in its prospectus and other public disclosures, have chosen to invest in this fund, which is a part of the Fidelity family of funds.
Annual Report
Nature, Extent, and Quality of Services Provided. The Board considered the staffing within the investment adviser, Fidelity Management & Research Company (FMR), and the sub-advisers (together, the Investment Advisers) as it relates to the fund, including the backgrounds of the fund's investment personnel, and also considered the fund's investment objective, strategies, and related investment philosophy. The Independent Trustees also had discussions with senior management of Fidelity's investment operations and investment groups. The Board considered the structure of the portfolio manager compensation program and whether this structure provides appropriate incentives to act in the best interests of the fund.
Resources Dedicated to Investment Management and Support Services. The Board and the Fund Oversight and Research Committees reviewed the general qualifications and capabilities of the Investment Advisers' investment staff, including its size, education, experience, and resources, as well as the Investment Advisers' approach to recruiting, training, managing, and compensating investment personnel. The Board noted that FMR has continued to increase the resources devoted to non-U.S. offices, including expansion of Fidelity's global investment organization. The Board also noted that Fidelity's analysts have extensive resources, tools and capabilities that allow them to conduct sophisticated quantitative and fundamental analysis, as well as credit analysis of issuers, counterparties and guarantors. Further, the Board believes that Fidelity's investment professionals have sufficient access to global information and data so as to provide competitive investment results over time, and that those professionals also have access to sophisticated tools that permit them to assess portfolio construction and risk and performance attribution characteristics continuously, as well as to transmit new information and research conclusions rapidly around the world. Additionally, in its deliberations, the Board considered the Investment Advisers' trading and risk management capabilities and resources, which are an integral part of the investment management process.
Shareholder and Administrative Services. The Board considered (i) the nature, extent, quality, and cost of advisory, administrative, and shareholder services performed by the Investment Advisers and their affiliates under the Advisory Contracts and under separate agreements covering transfer agency, pricing and bookkeeping, and securities lending services for the fund; (ii) the nature and extent of the supervision of third party service providers, principally custodians and subcustodians; and (iii) the resources devoted to, and the record of compliance with, the fund's compliance policies and procedures. The Board also reviewed the allocation of fund brokerage, including allocations to brokers affiliated with the Investment Advisers, the use of brokerage commissions to pay fund expenses, and the use of "soft" commission dollars to pay for research services.
Annual Report
Board Approval of Investment Advisory Contracts and
Management Fees - continued
The Board noted that the growth of fund assets over time across the complex allows Fidelity to reinvest in the development of services designed to enhance the value or convenience of the Fidelity funds as investment vehicles. These services include 24-hour access to account information and market information through telephone representatives and over the Internet, investor education materials and asset allocation tools, and the expanded availability of Fidelity Investor Centers.
Investment in a Large Fund Family. The Board considered the benefits to shareholders of investing in a Fidelity fund, including the benefits of investing in a fund that is part of a large family of funds offering a variety of investment disciplines and providing a large variety of mutual fund investor services. The Board noted that Fidelity had taken, or had made recommendations that resulted in the Fidelity funds taking, a number of actions over the previous year that benefited particular funds, including (i) continuing to dedicate additional resources to investment research and to the support of the senior management team that oversees asset management; (ii) persisting in efforts to enhance Fidelity's global research capabilities; (iii) launching new funds and making other enhancements to meet client needs for global and income-oriented solutions; (iv) continuing to launch dedicated lower cost underlying funds to meet portfolio construction needs related to expanding underlying fund options for Fidelity funds of funds, specifically for the Freedom Fund product lines; (v) rationalizing product lines and gaining increased efficiencies through the mergers of several funds into other funds; (vi) strengthening Fidelity's index fund offerings by reducing investment minimums and adopting or lowering existing expense caps for certain funds and classes; (vii) enhancing Global Asset Allocation product offerings by launching new funds and strategies, including "open architecture" target date funds that utilize affiliated and unaffiliated sub-advisers; (viii) modifying the eligibility criteria for Institutional Class shares of Advisor funds to increase their marketability to a portion of the defined contribution plan market; (ix) creating a new low-cost retirement share class for certain Advisor funds to appeal to large retirement plans; (x) transitioning the management of certain Fidelity commodity funds to Geode Capital Management LLC, a registered commodity pool operator, while retaining administrative responsibilities for the funds; (xi) reorganizing a number of funds; and (xii) taking steps toward establishing a new Fidelity adviser to manage sector-based funds and products.
Investment Performance. The Board considered whether the fund has operated in accordance with its investment objective, as well as its record of compliance with its investment restrictions and its performance history.
The Board took into account discussions with the Investment Advisers about fund investment performance that occur at Board meetings throughout the year. In this regard the Board noted that as part of regularly scheduled fund reviews and other reports to the Board on fund performance, the Board periodically considers annualized return information for the fund, for different time periods, measured against a securities market index ("benchmark index") and a peer group of mutual funds with similar objectives ("peer group"). In its evaluation of fund investment performance, the Board gave particular attention to information indicating changes in performance of certain Fidelity funds for specific time periods and the Investment Advisers' explanations for any overperformance or underperformance.
Annual Report
In addition to reviewing absolute and relative fund performance, the Independent Trustees periodically consider the appropriateness of fund performance metrics in evaluating the results achieved. In general, the Independent Trustees believe that fund performance should be evaluated based on net performance (after fees and expenses) of both the highest performing and lowest performing classes, where applicable, compared to appropriate benchmark indices, over appropriate time periods which may include full market cycles, and compared to peer groups, as applicable, over the same periods, taking into account relevant factors including the following: general market conditions; issuer-specific information; tactical opportunities for investment; and fund cash flows and other factors.
The Independent Trustees recognize that shareholders evaluate performance on a net basis over their own holding periods, for which one-, three-, and five-year periods are used as a proxy. For this reason, the performance information reviewed by the Board also included net cumulative calendar year total return information for the fund and an appropriate benchmark index and peer group for the most recent one-, three-, and five-year periods, as shown below. Returns are shown compared to the 25th percentile (top of box) and 75th percentile (bottom of box) of the peer universe. Returns of the benchmark index are "net MA," i.e., adjusted for tax withholding rates applicable to U.S.-based mutual funds organized as Massachusetts business trusts.
Annual Report
Board Approval of Investment Advisory Contracts and
Management Fees - continued
Fidelity International Growth Fund

The Board also considered that the fund's management fee is subject to upward or downward adjustment depending upon whether, and to what extent, the fund's investment performance for the performance period exceeds, or is exceeded by, a securities index, thus leading to a performance adjustment for the same period. The Board noted that the performance adjustment provides FMR with a strong economic incentive to seek to achieve superior performance for the fund's shareholders and helps to more closely align the interests of FMR and the fund's shareholders.
Based on its review, the Board concluded that the nature, extent, and quality of services provided to the fund under the Advisory Contracts should benefit the fund's shareholders.
Competitiveness of Management Fee and Total Expense Ratio. The Board considered the fund's management fee and total expense ratio compared to "mapped groups" of competitive funds and classes. Fidelity creates "mapped groups" by combining similar Lipper investment objective categories that have comparable management fee characteristics. Combining Lipper investment objective categories aids the Board's management fee and total expense ratio comparisons by broadening the competitive group used for comparison and by reducing the number of universes to which various Fidelity funds are compared.
Management Fee. The Board considered two proprietary management fee comparisons for the 12-month periods shown in the chart below. The group of Lipper funds used by the Board for management fee comparisons is referred to below as the "Total Mapped Group." The Total Mapped Group comparison focuses on a fund's standing in terms of gross management fees before expense reimbursements or caps, and without giving effect to the fund's performance adjustment, relative to the total universe of funds with comparable investment mandates, regardless of whether their management fee structures also are comparable. Funds with comparable investment mandates offer exposure to similar types of securities. Funds with comparable management fee structures have similar management fee contractual arrangements (e.g., flat rate charged for advisory services, all-inclusive fee rate, etc.). "TMG %" represents the percentage of funds in the Total Mapped Group that had management fees that were lower than the fund's. For example, a TMG % of 16% means that 84% of the funds in the Total Mapped Group had higher management fees than the fund. The "Asset-Size Peer Group" (ASPG) comparison focuses on a fund's standing relative to a subset of non-Fidelity funds within the Total Mapped Group that are similar in size and management fee structure. The ASPG represents at least 15% of the funds in the Total Mapped Group with comparable asset size and management fee structures, subject to a minimum of 50 funds (or all funds in the Total Mapped Group if fewer than 50). Additional information, such as the ASPG quartile in which the fund's management fee ranked and the impact of the fund's performance adjustment, is also included in the chart and considered by the Board.
Annual Report
Fidelity International Growth Fund
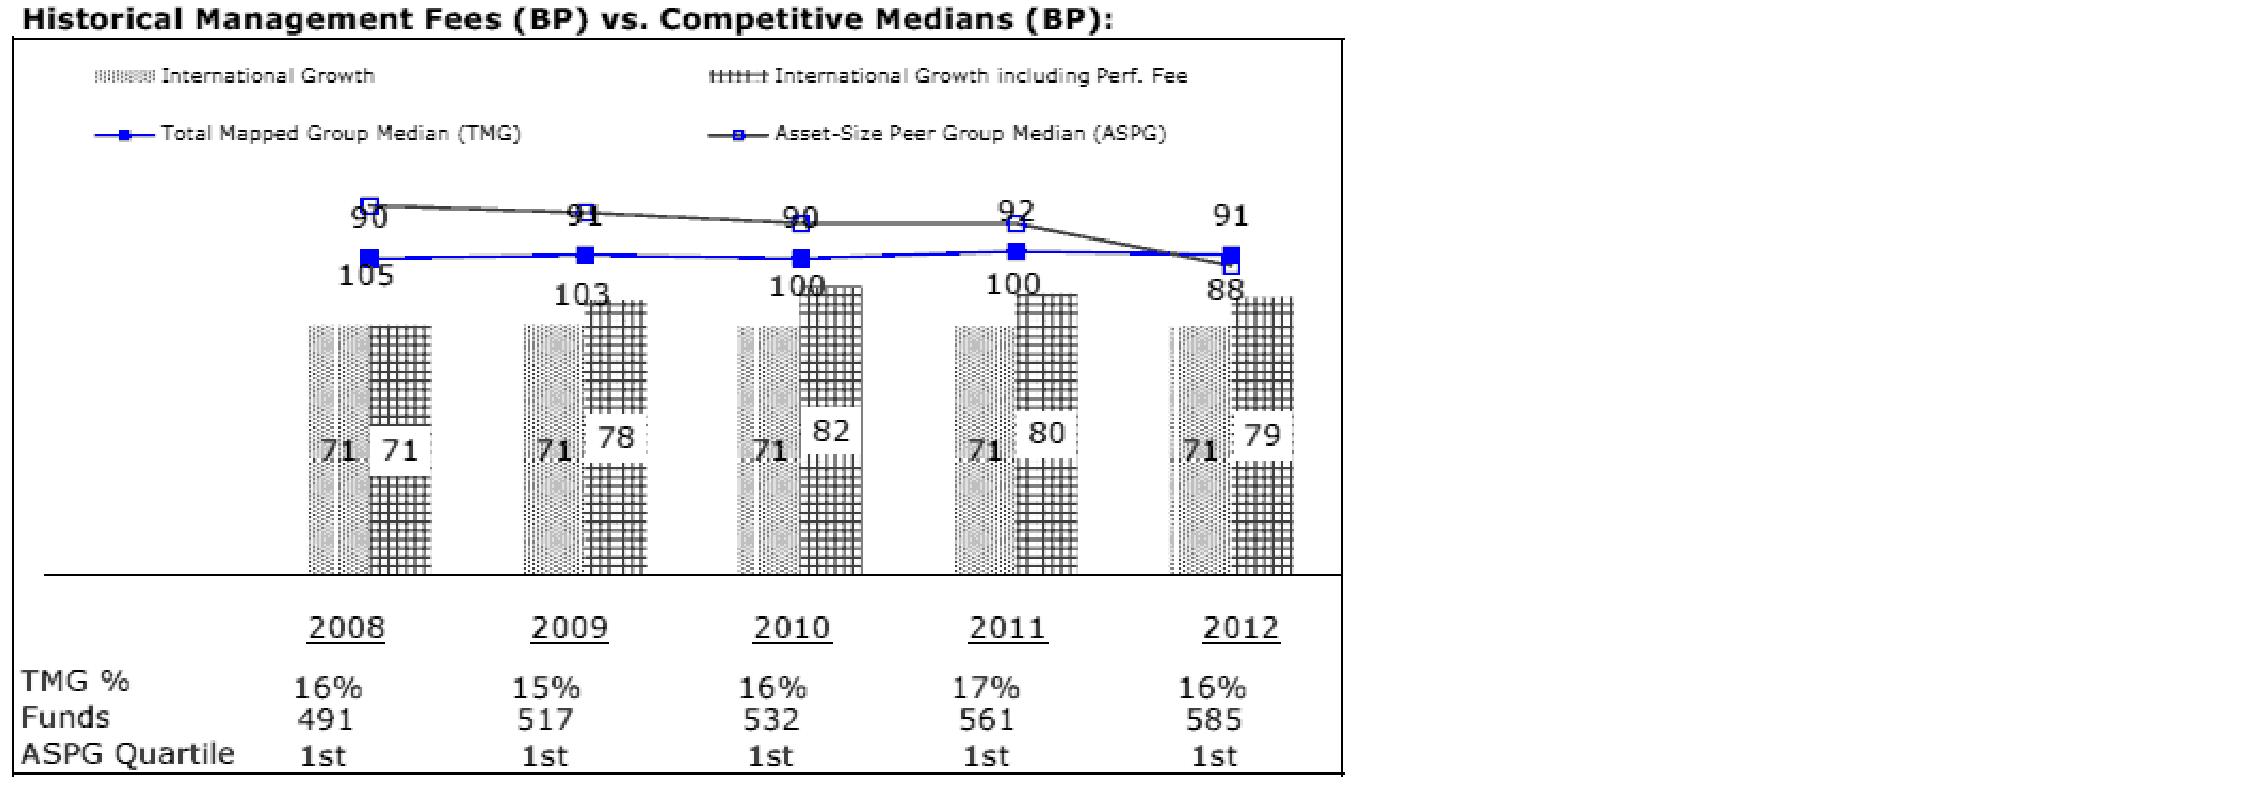
The Board noted that the fund's management fee ranked below the median of its Total Mapped Group and below the median of its ASPG for 2012. The Board also noted the effect of the fund's positive performance adjustment on the fund's management fee ranking.
Annual Report
Board Approval of Investment Advisory Contracts and
Management Fees - continued
Based on its review, the Board concluded that the fund's management fee is fair and reasonable in light of the services that the fund receives and the other factors considered.
Total Expense Ratio. In its review of each class's total expense ratio, the Board considered the fund's management fee as well as other fund or class expenses, as applicable, such as transfer agent fees, pricing and bookkeeping fees, fund-paid 12b-1 fees, and custodial, legal, and audit fees. The Board also noted the effects of any waivers and reimbursements on fees and expenses, as well as the impact of the fund's performance adjustment. As part of its review, the Board also considered the current and historical total expense ratios of each class of the fund compared to competitive fund median expenses. Each class of the fund is compared to those funds and classes in the Total Mapped Group (used by the Board for management fee comparisons) that have a similar sales load structure.
The Board noted that the total expense ratio of each of Class A and the retail class ranked below its competitive median for 2012 and the total expense ratio of each of Class T, Class B, Class C, and Institutional Class ranked above its competitive median for 2012. The Board considered that, in general, various factors can affect total expense ratios. The Board noted that the total expense ratio of Class T was above the competitive median primarily because of higher 12b-1 fees on Class T. Class T has a higher 12b-1 fee, but a lower front-end sales charge, than traditionally priced front-end sales charge classes. The Board considered that Class T is primarily sold load-waived in the retirement plan market where its 0.50% 12b-1 fee is comparable to competing no-load, higher 12b-1 fee classes designed specifically for retirement plans. The Board noted that the fund offers multiple classes, each of which has a different sales load and 12b-1 fee structure, and that the multiple structures are intended to offer a range of pricing options for the intermediary market. The Board also noted that the total expense ratios of the classes vary primarily by the level of their 12b-1 fees, although differences in transfer agent fees may also cause expenses to vary from class to class.
The Board further considered that FMR contractually agreed to reimburse Class A, Class T, Class B, Class C, Institutional Class, and the retail class of the fund to the extent that total operating expenses (excluding interest, taxes, certain securities lending costs, brokerage commissions, extraordinary expenses, and acquired fund fees and expenses, if any), as a percentage of their respective average net assets, exceed 1.45%, 1.70%, 2.20%, 2.20%, 1.20%, and 1.20% through December 31, 2013.
Fees Charged to Other Fidelity Clients. The Board also considered Fidelity fee structures and other information with respect to clients of FMR and its affiliates, such as other mutual funds advised or subadvised by FMR or its affiliates, pension plan clients, and other institutional clients. The Board noted the findings of the 2013 ad hoc joint committee (created with the board of other Fidelity funds), which reviewed and compared Fidelity's institutional investment advisory business with its business of providing services to the Fidelity funds, including the differences in services provided, fees charged, and costs incurred, as well as competition in their respective marketplaces.
Annual Report
Based on its review of total expense ratios and fees charged to other Fidelity clients, the Board concluded that the total expense ratio of each class of the fund was reasonable, although in some cases above the median of the universe presented for comparison, in light of the services that the fund and its shareholders receive and the other factors considered.
Costs of the Services and Profitability. The Board considered the revenues earned and the expenses incurred by Fidelity in conducting the business of developing, marketing, distributing, managing, administering and servicing the fund and servicing the fund's shareholders. The Board also considered the level of Fidelity's profits in respect of all the Fidelity funds.
On an annual basis, FMR presents to the Board Fidelity's profitability for the fund. Fidelity calculates the profitability for each fund, as well as aggregate profitability for groups of Fidelity funds and all Fidelity funds, using a series of detailed revenue and cost allocation methodologies which originate with the books and records of Fidelity on which Fidelity's audited financial statements are based. The Audit Committee of the Board reviews any significant changes from the prior year's methodologies.
PricewaterhouseCoopers LLP (PwC), independent registered public accounting firm and auditor to Fidelity and certain Fidelity funds, has been engaged annually by the Board as part of the Board's assessment of Fidelity's profitability analysis. PwC's engagement includes the review and assessment of the methodologies used by Fidelity in determining the revenues and expenses attributable to Fidelity's mutual fund business, and completion of agreed-upon procedures surrounding the mathematical accuracy of fund profitability and its conformity to allocation methodologies. After considering PwC's reports issued under the engagement and information provided by Fidelity, the Board concluded that while other allocation methods may also be reasonable, Fidelity's profitability methodologies are reasonable in all material respects.
The Board also reviewed Fidelity's non-fund businesses and fall-out benefits related to the mutual fund business as well as cases where Fidelity's affiliates may benefit from or be related to the fund's business.
The Board considered the costs of the services provided by and the profits realized by Fidelity in connection with the operation of the fund and was satisfied that the profitability was not excessive in the circumstances.
Economies of Scale. The Board considered whether there have been economies of scale in respect of the management of the Fidelity funds, whether the Fidelity funds (including the fund) have appropriately benefited from any such economies of scale, and whether there is potential for realization of any further economies of scale. The Board considered the extent to which the fund will benefit from economies of scale through increased services to the fund, through waivers or reimbursements, or through fee or expense reductions. The Board also noted that in 2009, it and the board of other Fidelity funds created an ad hoc committee (the Economies of Scale Committee) to analyze whether FMR attains economies of scale in respect of the management and servicing of the Fidelity funds, whether the Fidelity funds have appropriately benefited from such economies of scale, and whether there is potential for realization of any further economies of scale.
Annual Report
Board Approval of Investment Advisory Contracts and
Management Fees - continued
The Board recognized that the fund's management contract incorporates a "group fee" structure, which provides for lower group fee rates as total fund assets under FMR's management increase, and for higher group fee rates as total fund assets under FMR's management decrease. FMR calculates the group fee rates based on a tiered asset "breakpoint" schedule that varies based on asset class. The Board considered that the group fee is designed to deliver the benefits of economies of scale to fund shareholders when total Fidelity fund assets increase, even if assets of any particular fund are unchanged or have declined, because some portion of Fidelity's costs are attributable to services provided to all Fidelity funds, and all funds benefit if those costs can be allocated among more assets. The Board concluded that, given the group fee structure, fund shareholders will benefit from lower management fees as assets under FMR's management increase at the fund complex level, regardless of whether Fidelity achieves any such economies of scale.
The Board concluded, taking into account the analysis of the Economies of Scale Committee, that economies of scale, if any, are being appropriately shared between fund shareholders and Fidelity.
Amendment to Description of Group Fee Rate. At its July 2013 meeting, the Board voted to approve an amendment to the fund's management contract to modify the description of the "group fee rate" effective August 1, 2013. The Board noted that under the prior description in the contract, the group fee rate was based on the average net assets of all registered investment companies with which FMR has management contracts. Under the contract's tiered asset breakpoint schedule, the group fee rate is lower as total fund assets under FMR's management increase, and higher as total fund assets under FMR's management decrease. The Board considered that the prior description would have excluded the assets of 64 Fidelity sector funds from the group fee rate calculation once Fidelity SelectCo, LLC, an affiliate of FMR, assumed management responsibilities for those funds. The Board noted that modifying the description of the group fee rate to continue to include the assets of those 64 funds for purposes of determining group fee rate breakpoints would avoid an immediate adverse impact on the group fee rate for any fund.
Annual Report
Additional Information Requested by the Board. In order to develop fully the factual basis for consideration of the Fidelity funds' Advisory Contracts, the Board requested and received additional information on certain topics, including: (i) fund performance trends and Fidelity's long-term strategies for certain funds; (ii) the potential to further rationalize the Fidelity fund lineup with the possibility of achieving savings for the funds and Fidelity; (iii) the methodology with respect to competitive fund data and peer group classifications; (iv) the arrangements with, and performance of, certain sub-advisers on behalf of the Fidelity funds, as well as certain proposed participating affiliate arrangements; (v) the realization of fall-out benefits in certain Fidelity business units; (vi) Fidelity's group fee structures, including the rationale for the individual fee rates of certain categories of funds and the definition of group assets; (vii) trends regarding industry use of performance fee structures and the performance adjustment methodologies applicable to the Fidelity funds; (viii) additional competitive analysis regarding the total expenses for certain classes; and (ix) fund profitability methodology, including Fidelity's cost allocation methodology, and the impact of certain factors on fund profitability results.
Based on its evaluation of all of the conclusions noted above, and after considering all factors it believed relevant, the Board ultimately concluded that the advisory fee structures are fair and reasonable, and that the fund's Advisory Contracts should be renewed.
Annual Report
Investment Adviser
Fidelity Management & Research Company
Boston, MA
Investment Sub-Advisers
FMR Co., Inc.
Fidelity Management & Research
(U.K.) Inc.
Fidelity Management & Research
(Hong Kong) Limited
Fidelity Management & Research
(Japan) Inc.
FIL Investment Advisors
FIL Investments (Japan) Limited
FIL Investment Advisors (UK) Limited
General Distributor
Fidelity Distributors Corporation
Smithfield, RI
Transfer and Service Agents
Fidelity Investments Institutional Operations Company, Inc.
Boston, MA
Fidelity Service Company, Inc.
Boston, MA
Custodian
State Street Bank and Trust Company
Quincy, MA
(Fidelity Investment logo)(registered trademark)
AIGFZ-UANN-1213
1.9585036.100
Fidelity®
International Growth Fund
Annual Report
October 31, 2013
(Fidelity Cover Art)
Contents
Performance | (Click Here) | How the fund has done over time. |
Management's Discussion of Fund Performance | (Click Here) | The Portfolio Manager's review of fund performance and strategy. |
Shareholder Expense Example | (Click Here) | An example of shareholder expenses. |
Investment Changes | (Click Here) | A summary of major shifts in the fund's investments over the past six months. |
Investments | (Click Here) | A complete list of the fund's investments with their market values. |
Financial Statements | (Click Here) | Statements of assets and liabilities, operations, and changes in net assets, as well as financial highlights. |
Notes | (Click Here) | Notes to financial statements. |
Report of Independent Registered Public Accounting Firm | (Click Here) | |
Trustees and Officers | (Click Here) | |
Distributions | (Click Here) | |
Board Approval of Investment Advisory Contracts and Management Fees | (Click Here) | |
To view a fund's proxy voting guidelines and proxy voting record for the 12-month period ended June 30, visit http://www.fidelity.com/proxyvotingresults or visit the Securities and Exchange Commission's (SEC) web site at http://www.sec.gov. You may also call 1-800-544-8544 to request a free copy of the proxy voting guidelines.
Standard & Poor's, S&P and S&P 500 are registered service marks of The McGraw-Hill Companies, Inc. and have been licensed for use by Fidelity Distributors Corporation.
Other third-party marks appearing herein are the property of their respective owners.
All other marks appearing herein are registered or unregistered trademarks or service marks of FMR LLC or an affiliated company. © 2013 FMR LLC. All rights reserved.
Annual Report
This report and the financial statements contained herein are submitted for the general information of the shareholders of the fund. This report is not authorized for distribution to prospective investors in the fund unless preceded or accompanied by an effective prospectus.
A fund files its complete schedule of portfolio holdings with the SEC for the first and third quarters of each fiscal year on Form N-Q. Forms N-Q are available on the SEC's web site at http://www.sec.gov. A fund's Forms N-Q may be reviewed and copied at the SEC's Public Reference Room in Washington, DC. Information regarding the operation of the SEC's Public Reference Room may be obtained by calling 1-800-SEC-0330. For a complete list of a fund's portfolio holdings, view the most recent holdings listing, semiannual report, or annual report on Fidelity's web site at http://www.fidelity.com, http://www.advisor.fidelity.com, or http://www.401k.com, as applicable.
NOT FDIC INSURED • MAY LOSE VALUE • NO BANK GUARANTEE
Neither the fund nor Fidelity Distributors Corporation is a bank.
Annual Report
Average annual total return reflects the change in the value of an investment, assuming reinvestment of the class' distributions from dividend income and capital gains (the profits earned upon the sale of securities that have grown in value, if any) and assuming a constant rate of performance each year. The $10,000 table and the fund's returns do not reflect the deduction of taxes that a shareholder would pay on fund distributions or the redemption of fund shares. During periods of reimbursement by Fidelity, a fund's total return will be greater than it would be had the reimbursement not occurred. How a fund did yesterday is no guarantee of how it will do tomorrow.
Average Annual Total Returns
Periods ended October 31, 2013 | Past 1
year | Past 5
years | Life of
fundA |
Fidelity® International Growth Fund | 22.48% | 15.88% | 2.29% |
A From November 1, 2007.
$10,000 Over Life of Fund
Let's say hypothetically that $10,000 was invested in Fidelity® International Growth Fund, a class of the fund, on November 1, 2007, when the fund started. The chart shows how the value of your investment would have changed, and also shows how the MSCI® EAFE® Growth Index performed over the same period.
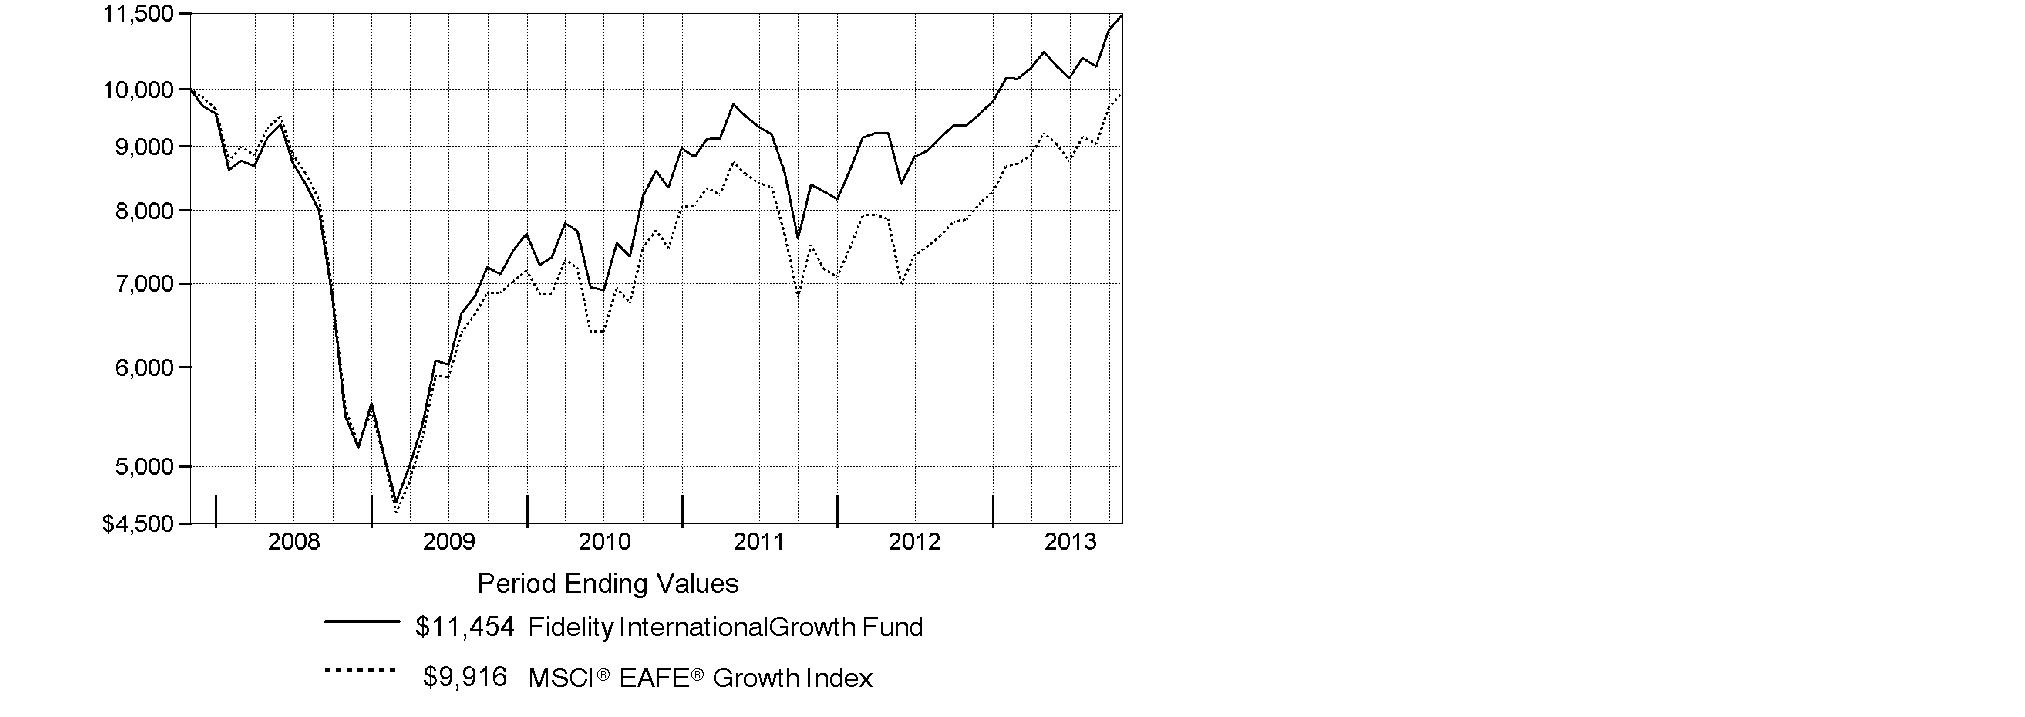
Annual Report
Market Recap: On balance, global equity markets remained upbeat for the 12-month period ending October 31, 2013. The MSCI® ACWI® (All Country World Index) Index gained 23.75% for the period, amid investor preference for higher-risk assets. The period was not without turbulence, however. In the spring and summer, central banks worldwide, especially in the U.S. and China, made clear their intentions to maintain accommodative monetary policies. That stance, combined with modest cyclical improvements around the globe and generally low valuations, underpinned the broad rally in equities. Europe (+32%) shone brightly, with most markets in the region - large and small - registering solid, index-beating gains. Another bright spot was Japan, which, despite a struggling yen and taking a second-half breather, posted a 34% result for the full year. The U.S. - by far the index's biggest constituent - also outperformed the global market with a roughly 28% advance. Meanwhile, Asia-Pacific ex Japan (+14%) lagged, hurt in part by a slowdown in Australia's mining industry as well as currency headwinds. Foreign-exchange and commodity weakness also curbed results in resource-heavy Canada and emerging markets (EM), both of which were up 7%. Country-level EM performance diverged meaningfully for the period, as evidenced by performance in Brazil (-1%), Russia (+12%), India (+1%) and China (+8%).
Comments from Jed Weiss, Portfolio Manager of Fidelity® International Growth Fund: For the year, the fund's Retail Class shares gained 22.48%, trailing the 26.07% advance of the MSCI® EAFE® Growth Index. Versus the index, picks in emerging markets were a big detractor. A combination of underweighting Europe and disappointing security selection here also hurt, even as Dutch semiconductor equipment company ASML Holding made an outsized individual contribution. Stock picking in Canada detracted, with out-of-index mining companies Goldcorp and Agnico Eagle Mines suffering from falling gold prices. I ultimately sold both stocks. A moderate cash position curbed performance in an up market. On the positive side, stock picking in Hong Kong was helpful - especially positions in casino gaming companies Sands China and Wynn Macau - as was underweighting poor-performing Australia. Another contributor was the fund's out-of-benchmark holdings in companies headquartered in the U.S. but doing all or most of their business abroad. In strong-performing Japan, the impact was mixed, with a detrimental underweighting but favorable stock picking. In this market, the fund's biggest individual detractor was automaker Toyota Motor. Instead of owning this outperforming benchmark component, we held DENSO, a parts supplier whose largest customer is Toyota and whose strong performance tempered the latter's negative relative impact.
The views expressed above reflect those of the portfolio manager(s) only through the end of the period as stated on the cover of this report and do not necessarily represent the views of Fidelity or any other person in the Fidelity organization. Any such views are subject to change at any time based upon market or other conditions and Fidelity disclaims any responsibility to update such views. These views may not be relied on as investment advice and, because investment decisions for a Fidelity fund are based on numerous factors, may not be relied on as an indication of trading intent on behalf of any Fidelity fund.
Annual Report
Shareholder Expense Example
As a shareholder of the Fund, you incur two types of costs: (1) transaction costs, including sales charges (loads) on purchase payments or redemption proceeds, redemption fees and (2) ongoing costs, including management fees, distribution and/or service (12b-1) fees and other Fund expenses. This Example is intended to help you understand your ongoing costs (in dollars) of investing in the Fund and to compare these costs with the ongoing costs of investing in other mutual funds.
The actual expense Example is based on an investment of $1,000 invested at the beginning of the period and held for the entire period (May 1, 2013 to October 31, 2013) for Class A, Class T, Class B, Class C, International Growth and Institutional Class and for the period (August 13, 2013 to October 31, 2013) for Class Z. The hypothetical expense Example is based on an investment of $1,000 invested for the one-half year period (May 1, 2013 to October 31, 2013).
Actual Expenses
The first line of the accompanying table for each class of the Fund provides information about actual account values and actual expenses. You may use the information in this line, together with the amount you invested, to estimate the expenses that you paid over the period. Simply divide your account value by $1,000.00 (for example, an $8,600 account value divided by $1,000.00 = 8.6), then multiply the result by the number in the first line for a class of the Fund under the heading entitled "Expenses Paid During Period" to estimate the expenses you paid on your account during this period. A small balance maintenance fee of $12.00 that is charged once a year may apply for certain accounts with a value of less than $2,000. This fee is not included in the table below. If it was, the estimate of expenses you paid during the period would be higher, and your ending account value lower, by this amount. In addition, the Fund, as a shareholder in the underlying Fidelity Central Funds, will indirectly bear its pro-rata share of the fees and expenses incurred by the underlying Fidelity Central Funds. These fees and expenses are not included in the Fund's annualized expense ratio used to calculate the expense estimate in the table below.
Hypothetical Example for Comparison Purposes
The second line of the accompanying table for each class of the Fund provides information about hypothetical account values and hypothetical expenses based on a Class' actual expense ratio and an assumed rate of return of 5% per year before expenses, which is not the Class' actual return. The hypothetical account values and expenses may not be used to estimate the actual ending account balance or expenses you paid for the period. You may use this information to compare the ongoing costs of investing in the Fund and other funds. To do so, compare this 5% hypothetical example with the 5% hypothetical examples that appear in the shareholder reports of the other funds. A small balance maintenance fee of $12.00 that is charged once a year may apply for certain accounts with a value of less than $2,000. This fee is not included in the table below. If it was, the estimate of expenses you paid during the period would be higher, and your ending account value lower, by this amount. In addition, the Fund, as a shareholder in the underlying Fidelity Central Funds, will indirectly bear its pro-rata share of the fees and expenses incurred by the underlying Fidelity Central Funds. These fees and expenses are not included in the Fund's annualized expense ratio used to calculate the expense estimate in the table below.
Annual Report
Shareholder Expense Example - continued
Please note that the expenses shown in the table are meant to highlight your ongoing costs only and do not reflect any transaction costs. Therefore, the second line of the table is useful in comparing ongoing costs only, and will not help you determine the relative total costs of owning different funds. In addition, if these transactional costs were included, your costs would have been higher.
| Annualized
Expense Ratio B | Beginning
Account Value | Ending
Account Value
October 31, 2013 | Expenses Paid
During Period |
Class A | 1.44% | | | |
Actual | | $ 1,000.00 | $ 1,067.30 | $ 7.50 C |
Hypothetical A | | $ 1,000.00 | $ 1,017.95 | $ 7.32 D |
Class T | 1.70% | | | |
Actual | | $ 1,000.00 | $ 1,066.50 | $ 8.85 C |
Hypothetical A | | $ 1,000.00 | $ 1,016.64 | $ 8.64 D |
Class B | 2.18% | | | |
Actual | | $ 1,000.00 | $ 1,063.40 | $ 11.34 C |
Hypothetical A | | $ 1,000.00 | $ 1,014.22 | $ 11.07 D |
Class C | 2.18% | | | |
Actual | | $ 1,000.00 | $ 1,063.70 | $ 11.34 C |
Hypothetical A | | $ 1,000.00 | $ 1,014.22 | $ 11.07 D |
International Growth | 1.11% | | | |
Actual | | $ 1,000.00 | $ 1,069.00 | $ 5.79 C |
Hypothetical A | | $ 1,000.00 | $ 1,019.61 | $ 5.65 D |
Institutional Class | 1.11% | | | |
Actual | | $ 1,000.00 | $ 1,069.00 | $ 5.79 C |
Hypothetical A | | $ 1,000.00 | $ 1,019.61 | $ 5.65 D |
Class Z | .94% | | | |
Actual | | $ 1,000.00 | $ 1,056.50 | $ 2.12 C |
Hypothetical A | | $ 1,000.00 | $ 1,020.47 | $ 4.79 D |
A 5% return per year before expenses
B Annualized expense ratio reflects expenses net of applicable fee waivers.
C Actual expenses are equal to each Class' annualized expense ratio, multiplied by the average account value over the period, multiplied by 184/365 (to reflect the one-half year period) for Class A, Class T, Class B, Class C, International Growth and Institutional Class and multiplied by 80/365 (to reflect the period August 13, 2013 to October 31, 2013) for Class Z. The fees and expenses of the underlying Fidelity Central Funds in which the Fund invests are not included in each Class' annualized expense ratio.
Annual Report
D Hypothetical expenses are equal to each Class' annualized expense ratio, multiplied by the average account value over the period, multiplied by 184/365 (to reflect the one-half year period). The fees and expenses of the underlying Fidelity Central Funds in which the Fund invests are not included in each Class' annualized expense ratio.
Annual Report
Investment Changes (Unaudited)
Geographic Diversification (% of fund's net assets) |
As of October 31, 2013 |
 | United Kingdom 17.6% | |
 | Japan 16.6% | |
 | United States of America* 14.9% | |
 | Switzerland 12.4% | |
 | Sweden 5.7% | |
 | Belgium 4.8% | |
 | Germany 4.4% | |
 | Australia 3.2% | |
 | France 3.2% | |
 | Other 17.2% | |

Percentages are based on country or territory of incorporation and are adjusted for the effect of futures contracts, if applicable. |
* Includes Short-Term Investments and Net Other Assets (Liabilities). |
As of April 30, 2013 |
| United Kingdom 18.3% | |
| United States of America* 16.4% | |
| Japan 12.5% | |
| Switzerland 10.7% | |
| Sweden 5.4% | |
| Belgium 4.5% | |
| France 4.0% | |
| Australia 3.8% | |
| Germany 3.1% | |
 | Other 21.3% | |

Percentages are based on country or territory of incorporation and are adjusted for the effect of futures contracts, if applicable. |
* Includes Short-Term Investments and Net Other Assets (Liabilities). |
Asset Allocation as of October 31, 2013 |
| % of fund's
net assets | % of fund's net assets
6 months ago |
Stocks | 97.9 | 98.6 |
Short-Term Investments and Net Other Assets (Liabilities) | 2.1 | 1.4 |
Top Ten Stocks as of October 31, 2013 |
| % of fund's
net assets | % of fund's net assets
6 months ago |
Nestle SA (Switzerland, Food Products) | 4.3 | 5.2 |
Anheuser-Busch InBev SA NV (Belgium, Beverages) | 3.5 | 3.6 |
Roche Holding AG (participation certificate) (Switzerland, Pharmaceuticals) | 3.3 | 2.5 |
DENSO Corp. (Japan, Auto Components) | 3.0 | 2.2 |
UBS AG (NY Shares) (Switzerland, Capital Markets) | 2.2 | 1.9 |
Linde AG (Germany, Chemicals) | 2.2 | 2.3 |
Keyence Corp. (Japan, Electronic Equipment & Components) | 2.0 | 1.3 |
Prudential PLC (United Kingdom, Insurance) | 1.9 | 0.0 |
SABMiller PLC (United Kingdom, Beverages) | 1.8 | 2.1 |
Novo Nordisk A/S Series B sponsored ADR (Denmark, Pharmaceuticals) | 1.8 | 2.5 |
| 26.0 | |
Market Sectors as of October 31, 2013 |
| % of fund's
net assets | % of fund's net assets
6 months ago |
Consumer Staples | 19.7 | 24.3 |
Consumer Discretionary | 17.1 | 16.2 |
Financials | 15.0 | 11.3 |
Industrials | 14.3 | 15.1 |
Health Care | 11.9 | 11.2 |
Materials | 7.7 | 10.4 |
Information Technology | 7.5 | 6.7 |
Energy | 3.0 | 3.4 |
Telecommunication Services | 1.7 | 0.0 |
Annual Report
Investments October 31, 2013
Showing Percentage of Net Assets
Common Stocks - 97.9% |
| Shares | | Value |
Australia - 3.2% |
Coca-Cola Amatil Ltd. | 391,434 | | $ 4,772,534 |
CSL Ltd. | 141,073 | | 9,266,793 |
Sydney Airport unit | 643,558 | | 2,548,605 |
Transurban Group unit | 347,528 | | 2,332,109 |
TOTAL AUSTRALIA | | 18,920,041 |
Austria - 1.1% |
Andritz AG | 103,997 | | 6,406,331 |
Bailiwick of Jersey - 0.5% |
Informa PLC | 301,577 | | 2,705,454 |
Belgium - 4.8% |
Anheuser-Busch InBev SA NV | 197,091 | | 20,431,189 |
KBC Groupe SA | 83,619 | | 4,558,378 |
Umicore SA | 64,664 | | 3,084,767 |
TOTAL BELGIUM | | 28,074,334 |
Bermuda - 0.4% |
Lazard Ltd. Class A | 65,192 | | 2,519,671 |
Cayman Islands - 2.6% |
Sands China Ltd. | 1,287,200 | | 9,148,036 |
Wynn Macau Ltd. | 1,650,400 | | 6,332,955 |
TOTAL CAYMAN ISLANDS | | 15,480,991 |
Denmark - 1.8% |
Novo Nordisk A/S Series B sponsored ADR | 62,800 | | 10,466,876 |
Finland - 0.9% |
Nokian Tyres PLC | 100,408 | | 5,080,980 |
France - 3.2% |
Danone SA | 80,652 | | 5,981,177 |
Remy Cointreau SA | 26,787 | | 2,643,375 |
Safran SA | 94,400 | | 6,033,678 |
Sanofi SA | 38,874 | | 4,144,872 |
TOTAL FRANCE | | 18,803,102 |
Germany - 4.4% |
Bayer AG | 65,700 | | 8,165,750 |
Deutsche Bank AG | 51,320 | | 2,480,253 |
Deutsche Bank AG (NY Shares) | 800 | | 38,656 |
Linde AG | 67,141 | | 12,757,939 |
Siemens AG sponsored ADR | 20,000 | | 2,560,200 |
TOTAL GERMANY | | 26,002,798 |
Common Stocks - continued |
| Shares | | Value |
India - 0.3% |
Housing Development Finance Corp. Ltd. | 133,476 | | $ 1,852,016 |
Ireland - 1.7% |
CRH PLC sponsored ADR | 185,366 | | 4,537,760 |
James Hardie Industries PLC: | | | |
CDI | 35,635 | | 368,127 |
sponsored ADR (d) | 96,000 | | 4,999,680 |
TOTAL IRELAND | | 9,905,567 |
Israel - 0.3% |
Azrieli Group | 44,900 | | 1,443,930 |
Italy - 0.9% |
Interpump Group SpA | 160,651 | | 1,788,616 |
Prada SpA | 325,300 | | 3,172,021 |
TOTAL ITALY | | 4,960,637 |
Japan - 16.6% |
AEON Mall Co. Ltd. | 101,810 | | 2,891,503 |
Aozora Bank Ltd. | 861,000 | | 2,502,957 |
Autobacs Seven Co. Ltd. | 60,100 | | 876,287 |
DENSO Corp. | 366,500 | | 17,617,075 |
East Japan Railway Co. | 16,900 | | 1,468,115 |
Fanuc Corp. | 31,700 | | 5,084,924 |
Fast Retailing Co. Ltd. | 18,300 | | 6,159,998 |
Japan Tobacco, Inc. | 166,700 | | 6,031,820 |
Keyence Corp. | 27,462 | | 11,769,939 |
Mitsui Fudosan Co. Ltd. | 267,000 | | 8,844,617 |
Nomura Holdings, Inc. | 187,300 | | 1,383,591 |
Seven Bank Ltd. | 808,300 | | 2,860,781 |
Shinsei Bank Ltd. | 1,457,000 | | 3,411,283 |
SHO-BOND Holdings Co. Ltd. | 65,000 | | 3,043,777 |
SoftBank Corp. | 134,600 | | 10,051,781 |
Unicharm Corp. | 54,500 | | 3,500,476 |
USS Co. Ltd. | 458,700 | | 6,717,431 |
Yamato Kogyo Co. Ltd. | 86,100 | | 3,191,228 |
TOTAL JAPAN | | 97,407,583 |
Mexico - 0.3% |
Fomento Economico Mexicano S.A.B. de CV sponsored ADR | 20,755 | | 1,936,442 |
Common Stocks - continued |
| Shares | | Value |
Netherlands - 1.7% |
ASML Holding NV | 56,278 | | $ 5,326,150 |
ING Groep NV (Certificaten Van Aandelen) (a) | 366,557 | | 4,658,106 |
TOTAL NETHERLANDS | | 9,984,256 |
Portugal - 0.8% |
Jeronimo Martins SGPS SA | 265,152 | | 4,899,738 |
South Africa - 0.5% |
Clicks Group Ltd. | 444,126 | | 2,767,285 |
Spain - 1.9% |
Inditex SA (d) | 59,146 | | 9,716,963 |
Prosegur Compania de Seguridad SA (Reg.) | 236,849 | | 1,408,528 |
TOTAL SPAIN | | 11,125,491 |
Sweden - 5.7% |
ASSA ABLOY AB (B Shares) | 138,561 | | 6,878,816 |
Atlas Copco AB (A Shares) | 240,809 | | 6,681,655 |
Fagerhult AB | 49,496 | | 1,520,004 |
H&M Hennes & Mauritz AB (B Shares) | 182,130 | | 7,869,754 |
Intrum Justitia AB | 91,200 | | 2,427,759 |
SKF AB (B Shares) | 153,717 | | 4,072,995 |
Svenska Handelsbanken AB (A Shares) | 72,940 | | 3,304,787 |
Swedish Match Co. AB | 17,272 | | 569,865 |
TOTAL SWEDEN | | 33,325,635 |
Switzerland - 12.4% |
Credit Suisse Group | 74,858 | | 2,328,680 |
Nestle SA | 345,971 | | 24,973,553 |
Novartis AG | 75,374 | | 5,850,725 |
Roche Holding AG (participation certificate) | 70,213 | | 19,438,481 |
Schindler Holding AG: | | | |
(participation certificate) | 25,471 | | 3,612,848 |
(Reg.) | 6,190 | | 880,046 |
Swatch Group AG (Bearer) | 4,040 | | 2,584,692 |
UBS AG (NY Shares) | 661,761 | | 12,811,693 |
TOTAL SWITZERLAND | | 72,480,718 |
Turkey - 1.5% |
Coca-Cola Icecek A/S | 142,997 | | 4,100,978 |
Tupras Turkiye Petrol Rafinelleri A/S | 100,687 | | 2,284,845 |
Turkiye Garanti Bankasi A/S | 640,500 | | 2,579,647 |
TOTAL TURKEY | | 8,965,470 |
Common Stocks - continued |
| Shares | | Value |
United Kingdom - 17.6% |
Babcock International Group PLC | 196,200 | | $ 4,010,985 |
Barclays PLC sponsored ADR (d) | 225,966 | | 3,798,488 |
BG Group PLC | 466,755 | | 9,530,810 |
BHP Billiton PLC ADR (d) | 71,700 | | 4,419,588 |
GlaxoSmithKline PLC sponsored ADR | 175,500 | | 9,236,565 |
InterContinental Hotel Group PLC ADR (d) | 230,330 | | 6,760,186 |
Johnson Matthey PLC | 116,777 | | 5,624,697 |
Prudential PLC | 539,714 | | 11,037,564 |
Reckitt Benckiser Group PLC (d) | 115,645 | | 8,989,413 |
Rexam PLC | 380,064 | | 3,165,805 |
Rolls-Royce Group PLC | 458,237 | | 8,449,478 |
Rotork PLC | 84,800 | | 3,892,773 |
SABMiller PLC | 202,866 | | 10,584,460 |
Serco Group PLC | 345,718 | | 3,087,586 |
Shaftesbury PLC | 154,533 | | 1,471,803 |
Standard Chartered PLC (United Kingdom) | 334,991 | | 8,054,183 |
Unite Group PLC | 197,400 | | 1,253,384 |
TOTAL UNITED KINGDOM | | 103,367,768 |
United States of America - 12.8% |
Autoliv, Inc. | 67,069 | | 5,984,567 |
Berkshire Hathaway, Inc. Class B (a) | 19,184 | | 2,207,695 |
BorgWarner, Inc. | 58,796 | | 6,063,631 |
Cummins, Inc. | 26,082 | | 3,312,936 |
FMC Technologies, Inc. (a) | 49,152 | | 2,484,634 |
Google, Inc. Class A (a) | 2,863 | | 2,950,551 |
KLA-Tencor Corp. | 42,680 | | 2,799,808 |
Martin Marietta Materials, Inc. | 31,700 | | 3,109,453 |
MasterCard, Inc. Class A | 11,450 | | 8,210,795 |
Mead Johnson Nutrition Co. Class A | 76,944 | | 6,283,247 |
Mohawk Industries, Inc. (a) | 22,400 | | 2,966,208 |
National Oilwell Varco, Inc. | 40,272 | | 3,269,281 |
Philip Morris International, Inc. | 43,808 | | 3,904,169 |
PriceSmart, Inc. | 24,500 | | 2,787,855 |
ResMed, Inc. (d) | 60,700 | | 3,140,618 |
Solera Holdings, Inc. | 46,189 | | 2,596,746 |
SS&C Technologies Holdings, Inc. (a) | 66,200 | | 2,601,660 |
Common Stocks - continued |
| Shares | | Value |
United States of America - continued |
Union Pacific Corp. | 16,300 | | $ 2,467,820 |
Visa, Inc. Class A | 39,975 | | 7,861,883 |
TOTAL UNITED STATES OF AMERICA | | 75,003,557 |
TOTAL COMMON STOCKS (Cost $503,021,258) |
573,886,671
|
Nonconvertible Preferred Stocks - 0.0% |
| | | |
United Kingdom - 0.0% |
Rolls-Royce Group PLC Series C
(Cost $61,249) | 37,731,382 | |
60,499
|
Money Market Funds - 5.2% |
| | | |
Fidelity Cash Central Fund, 0.09% (b) | 14,095,092 | | 14,095,092 |
Fidelity Securities Lending Cash Central Fund, 0.09% (b)(c) | 16,477,575 | | 16,477,575 |
TOTAL MONEY MARKET FUNDS (Cost $30,572,667) |
30,572,667
|
TOTAL INVESTMENT PORTFOLIO - 103.1% (Cost $533,655,174) | | 604,519,837 |
NET OTHER ASSETS (LIABILITIES) - (3.1)% | | (18,241,969) |
NET ASSETS - 100% | $ 586,277,868 |
Legend |
(a) Non-income producing |
(b) Affiliated fund that is generally available only to investment companies and other accounts managed by Fidelity Investments. The rate quoted is the annualized seven-day yield of the fund at period end. A complete unaudited listing of the fund's holdings as of its most recent quarter end is available upon request. In addition, each Fidelity Central Fund's financial statements, which are not covered by the Fund's Report of Independent Registered Public Accounting Firm, are available on the SEC's website or upon request. |
(c) Investment made with cash collateral received from securities on loan. |
(d) Security or a portion of the security is on loan at period end. |
Affiliated Central Funds |
Information regarding fiscal year to date income earned by the Fund from investments in Fidelity Central Funds is as follows: |
Fund | Income earned |
Fidelity Cash Central Fund | $ 13,543 |
Fidelity Securities Lending Cash Central Fund | 209,783 |
Total | $ 223,326 |
Other Information |
Categorizations in the Schedule of Investments are based on country or territory of incorporation. |
The following is a summary of the inputs used, as of October 31, 2013, involving the Fund's assets and liabilities carried at fair value. The inputs or methodology used for valuing securities may not be an indication of the risk associated with investing in those securities. For more information on valuation inputs, and their aggregation into the levels used in the tables below, please refer to the Investment Valuation section in the accompanying Notes to Financial Statements. |
Valuation Inputs at Reporting Date: |
Description | Total | Level 1 | Level 2 | Level 3 |
Investments in Securities: | | | | |
Equities: | | | | |
Consumer Discretionary | $ 99,756,238 | $ 68,385,447 | $ 31,370,791 | $ - |
Consumer Staples | 115,157,576 | 60,220,538 | 54,937,038 | - |
Energy | 17,569,570 | 17,569,570 | - | - |
Financials | 88,293,666 | 45,894,331 | 42,399,335 | - |
Health Care | 69,710,680 | 59,715,083 | 9,995,597 | - |
Industrials | 84,031,083 | 74,434,267 | 9,596,816 | - |
Information Technology | 44,117,532 | 32,347,593 | 11,769,939 | - |
Materials | 45,259,044 | 42,067,816 | 3,191,228 | - |
Telecommunication Services | 10,051,781 | - | 10,051,781 | - |
Money Market Funds | 30,572,667 | 30,572,667 | - | - |
Total Investments in Securities: | $ 604,519,837 | $ 431,207,312 | $ 173,312,525 | $ - |
The following is a summary of transfers between Level 1 and Level 2 for the period ended October 31, 2013. Transfers are assumed to have occurred at the beginning of the period, and are primarily attributable to the valuation techniques used for foreign equity securities, as discussed in the accompanying Notes to Financial Statements: |
Transfers | Total |
Level 1 to Level 2 | $ 27,145,883 |
Level 2 to Level 1 | $ 0 |
See accompanying notes which are an integral part of the financial statements.
Annual Report
Statement of Assets and Liabilities
| October 31, 2013 |
| | |
Assets | | |
Investment in securities, at value (including securities loaned of $15,812,983) - See accompanying schedule: Unaffiliated issuers (cost $503,082,507) | $ 573,947,170 | |
Fidelity Central Funds (cost $30,572,667) | 30,572,667 | |
Total Investments (cost $533,655,174) | | $ 604,519,837 |
Cash | | 7,981 |
Receivable for investments sold | | 2,362,573 |
Receivable for fund shares sold | | 3,194,486 |
Dividends receivable | | 767,973 |
Distributions receivable from Fidelity Central Funds | | 6,838 |
Prepaid expenses | | 1,720 |
Other receivables | | 13,074 |
Total assets | | 610,874,482 |
| | |
Liabilities | | |
Payable for investments purchased | $ 7,134,028 | |
Payable for fund shares redeemed | 414,036 | |
Accrued management fee | 337,239 | |
Distribution and service plan fees payable | 38,773 | |
Other affiliated payables | 125,190 | |
Other payables and accrued expenses | 69,773 | |
Collateral on securities loaned, at value | 16,477,575 | |
Total liabilities | | 24,596,614 |
| | |
Net Assets | | $ 586,277,868 |
Net Assets consist of: | | |
Paid in capital | | $ 512,728,833 |
Undistributed net investment income | | 2,476,993 |
Accumulated undistributed net realized gain (loss) on investments and foreign currency transactions | | 210,451 |
Net unrealized appreciation (depreciation) on investments and assets and liabilities in foreign currencies | | 70,861,591 |
Net Assets | | $ 586,277,868 |
See accompanying notes which are an integral part of the financial statements.
Annual Report
Financial Statements - continued
Statement of Assets and Liabilities - continued
| October 31, 2013 |
| | |
Calculation of Maximum Offering Price Class A:
Net Asset Value and redemption price per share ($74,594,798 ÷ 6,919,905 shares) | | $ 10.78 |
| | |
Maximum offering price per share (100/94.25 of $10.78) | | $ 11.44 |
Class T:
Net Asset Value and redemption price per share ($23,117,780 ÷ 2,150,794 shares) | | $ 10.75 |
| | |
Maximum offering price per share (100/96.50 of $10.75) | | $ 11.14 |
Class B:
Net Asset Value and offering price per share ($1,578,643 ÷ 147,175 shares)A | | $ 10.73 |
| | |
Class C:
Net Asset Value and offering price per share ($17,196,098 ÷ 1,608,592 shares)A | | $ 10.69 |
| | |
| | |
International Growth:
Net Asset Value, offering price and redemption price per share ($430,913,552 ÷ 39,735,803 shares) | | $ 10.84 |
| | |
Institutional Class:
Net Asset Value, offering price and redemption price per share ($38,771,323 ÷ 3,577,332 shares) | | $ 10.84 |
| | |
Class Z:
Net Asset Value, offering price and redemption price per share ($105,674 ÷ 9,747 shares) | | $ 10.84 |
A Redemption price per share is equal to net asset value less any applicable contingent deferred sales charge.
See accompanying notes which are an integral part of the financial statements.
Annual Report
Statement of Operations
| Year ended October 31, 2013 |
| | |
Investment Income | | |
Dividends | | $ 8,033,314 |
Interest | | 4 |
Income from Fidelity Central Funds | | 223,326 |
Income before foreign taxes withheld | | 8,256,644 |
Less foreign taxes withheld | | (549,023) |
Total income | | 7,707,621 |
| | |
Expenses | | |
Management fee
Basic fee | $ 2,422,146 | |
Performance adjustment | 192,757 | |
Transfer agent fees | 865,734 | |
Distribution and service plan fees | 312,494 | |
Accounting and security lending fees | 180,016 | |
Custodian fees and expenses | 82,662 | |
Independent trustees' compensation | 1,736 | |
Registration fees | 145,304 | |
Audit | 70,606 | |
Legal | 656 | |
Miscellaneous | 1,779 | |
Total expenses before reductions | 4,275,890 | |
Expense reductions | (61,595) | 4,214,295 |
Net investment income (loss) | | 3,493,326 |
Realized and Unrealized Gain (Loss) Net realized gain (loss) on: | | |
Investment securities: | | |
Unaffiliated issuers | 6,727,492 | |
Foreign currency transactions | 107,488 | |
Futures contracts | (517,867) | |
Total net realized gain (loss) | | 6,317,113 |
Change in net unrealized appreciation (depreciation) on: Investment securities | 60,865,585 | |
Assets and liabilities in foreign currencies | 4,304 | |
Total change in net unrealized appreciation (depreciation) | | 60,869,889 |
Net gain (loss) | | 67,187,002 |
Net increase (decrease) in net assets resulting from operations | | $ 70,680,328 |
See accompanying notes which are an integral part of the financial statements.
Annual Report
Financial Statements - continued
Statement of Changes in Net Assets
| Year ended
October 31,
2013 | Year ended
October 31,
2012 |
Increase (Decrease) in Net Assets | | |
Operations | | |
Net investment income (loss) | $ 3,493,326 | $ 1,377,708 |
Net realized gain (loss) | 6,317,113 | (833,212) |
Change in net unrealized appreciation (depreciation) | 60,869,889 | 11,226,981 |
Net increase (decrease) in net assets resulting
from operations | 70,680,328 | 11,771,477 |
Distributions to shareholders from net investment income | (2,081,336) | (594,738) |
Distributions to shareholders from net realized gain | (113,769) | (48,645) |
Total distributions | (2,195,105) | (643,383) |
Share transactions - net increase (decrease) | 324,915,158 | 115,271,822 |
Redemption fees | 31,216 | 5,972 |
Total increase (decrease) in net assets | 393,431,597 | 126,405,888 |
| | |
Net Assets | | |
Beginning of period | 192,846,271 | 66,440,383 |
End of period (including undistributed net investment income of $2,476,993 and undistributed net investment income of $1,374,430, respectively) | $ 586,277,868 | $ 192,846,271 |
See accompanying notes which are an integral part of the financial statements.
Annual Report
Financial Highlights - Class A
Years ended October 31, | 2013 | 2012 | 2011 | 2010 | 2009 |
Selected Per-Share Data | | | | | |
Net asset value, beginning of period | $ 8.91 | $ 8.09 | $ 8.38 | $ 7.01 | $ 5.46 |
Income from Investment Operations | | | | | |
Net investment income (loss) C | .08 | .08 | .08 | .05 | .05 |
Net realized and unrealized gain (loss) | 1.88 | .81 | (.31) | 1.39 | 1.55 |
Total from investment operations | 1.96 | .89 | (.23) | 1.44 | 1.60 |
Distributions from net investment income | (.08) | (.06) | (.05) | (.05) | (.05) |
Distributions from net realized gain | (.01) | (.01) | (.01) | (.03) | - |
Total distributions | (.09) | (.07) | (.06) | (.07) H | (.05) |
Redemption fees added to paid in capital C, G | - | - | - | - | - |
Net asset value, end of period | $ 10.78 | $ 8.91 | $ 8.09 | $ 8.38 | $ 7.01 |
Total Return A, B | 22.18% | 11.10% | (2.76)% | 20.68% | 29.72% |
Ratios to Average Net Assets D, F | | | | | |
Expenses before reductions | 1.44% | 1.58% | 1.77% | 2.13% | 2.46% |
Expenses net of fee waivers, if any | 1.43% | 1.45% | 1.45% | 1.50% | 1.50% |
Expenses net of all reductions | 1.42% | 1.44% | 1.43% | 1.48% | 1.47% |
Net investment income (loss) | .80% | .99% | .92% | .74% | .85% |
Supplemental Data | | | | | |
Net assets, end of period (000 omitted) | $ 74,595 | $ 21,874 | $ 6,352 | $ 3,084 | $ 1,452 |
Portfolio turnover rate E | 32% | 32% | 68% | 87% | 116% |
A Total returns would have been lower if certain expenses had not been reduced during the applicable periods shown.
B Total returns do not include the effect of the sales charges.
C Calculated based on average shares outstanding during the period.
D Fees and expenses of any underlying Fidelity Central Funds are not included in the Fund's expense ratio. The Fund indirectly bears its proportionate share of the expenses of any underlying Fidelity Central Funds.
E Amount does not include the portfolio activity of any underlying Fidelity Central Funds.
F Expense ratios reflect operating expenses of the class. Expenses before reductions do not reflect amounts reimbursed by the investment adviser or reductions from brokerage service arrangements or reductions from other expense offset arrangements and do not represent the amount paid by the class during periods when reimbursements or reductions occur. Expenses net of fee waivers reflect expenses after reimbursement by the investment adviser but prior to reductions from brokerage service arrangements or other expense offset arrangements. Expenses net of all reductions represent the net expenses paid by the class.
G Amount represents less than $.01 per share.
H Total distributions of $.07 per share is comprised of distributions from net investment income of $.046 and distributions from net realized gain of $.025 per share.
See accompanying notes which are an integral part of the financial statements.
Annual Report
Financial Highlights - Class T
Years ended October 31, | 2013 | 2012 | 2011 | 2010 | 2009 |
Selected Per-Share Data | | | | | |
Net asset value, beginning of period | $ 8.89 | $ 8.08 | $ 8.38 | $ 7.00 | $ 5.45 |
Income from Investment Operations | | | | | |
Net investment income (loss) C | .05 | .06 | .06 | .04 | .03 |
Net realized and unrealized gain (loss) | 1.88 | .81 | (.31) | 1.39 | 1.55 |
Total from investment operations | 1.93 | .87 | (.25) | 1.43 | 1.58 |
Distributions from net investment income | (.07) | (.05) | (.04) | (.02) | (.03) |
Distributions from net realized gain | (.01) | (.01) | (.01) | (.03) | - |
Total distributions | (.07) H | (.06) | (.05) | (.05) | (.03) |
Redemption fees added to paid in capital C, G | - | - | - | - | - |
Net asset value, end of period | $ 10.75 | $ 8.89 | $ 8.08 | $ 8.38 | $ 7.00 |
Total Return A, B | 21.91% | 10.82% | (3.03)% | 20.47% | 29.22% |
Ratios to Average Net Assets D, F | | | | | |
Expenses before reductions | 1.69% | 1.85% | 2.03% | 2.41% | 2.67% |
Expenses net of fee waivers, if any | 1.69% | 1.70% | 1.70% | 1.75% | 1.75% |
Expenses net of all reductions | 1.68% | 1.69% | 1.68% | 1.73% | 1.73% |
Net investment income (loss) | .54% | .74% | .67% | .49% | .59% |
Supplemental Data | | | | | |
Net assets, end of period (000 omitted) | $ 23,118 | $ 10,690 | $ 2,917 | $ 1,034 | $ 532 |
Portfolio turnover rate E | 32% | 32% | 68% | 87% | 116% |
A Total returns would have been lower if certain expenses had not been reduced during the applicable periods shown.
B Total returns do not include the effect of the sales charges.
C Calculated based on average shares outstanding during the period.
D Fees and expenses of any underlying Fidelity Central Funds are not included in the Fund's expense ratio. The Fund indirectly bears its proportionate share of the expenses of any underlying Fidelity Central Funds.
E Amount does not include the portfolio activity of any underlying Fidelity Central Funds.
F Expense ratios reflect operating expenses of the class. Expenses before reductions do not reflect amounts reimbursed by the investment adviser or reductions from brokerage service arrangements or reductions from other expense offset arrangements and do not represent the amount paid by the class during periods when reimbursements or reductions occur. Expenses net of fee waivers reflect expenses after reimbursement by the investment adviser but prior to reductions from brokerage service arrangements or other expense offset arrangements. Expenses net of all reductions represent the net expenses paid by the class.
G Amount represents less than $.01 per share.
H Total distributions of $.07 per share is comprised of distributions from net investment income of $.069 and distributions from net realized gain of $.005 per share.
See accompanying notes which are an integral part of the financial statements.
Annual Report
Financial Highlights - Class B
Years ended October 31, | 2013 | 2012 | 2011 | 2010 | 2009 |
Selected Per-Share Data | | | | | |
Net asset value, beginning of period | $ 8.88 | $ 8.06 | $ 8.36 | $ 6.98 | $ 5.42 |
Income from Investment Operations | | | | | |
Net investment income (loss) C | - G | .02 | .01 | - G | .01 |
Net realized and unrealized gain (loss) | 1.89 | .80 | (.30) | 1.38 | 1.55 |
Total from investment operations | 1.89 | .82 | (.29) | 1.38 | 1.56 |
Distributions from net investment income | (.03) | - | (.01) | - | - |
Distributions from net realized gain | (.01) | - | - G | - | - |
Total distributions | (.04) | - | (.01) | - | - |
Redemption fees added to paid in capital C, G | - | - | - | - | - |
Net asset value, end of period | $ 10.73 | $ 8.88 | $ 8.06 | $ 8.36 | $ 6.98 |
Total Return A, B | 21.35% | 10.17% | (3.47)% | 19.77% | 28.78% |
Ratios to Average Net Assets D, F | | | | | |
Expenses before reductions | 2.19% | 2.35% | 2.55% | 2.87% | 3.17% |
Expenses net of fee waivers, if any | 2.18% | 2.20% | 2.20% | 2.25% | 2.25% |
Expenses net of all reductions | 2.17% | 2.19% | 2.18% | 2.23% | 2.23% |
Net investment income (loss) | .05% | .24% | .17% | (.01)% | .09% |
Supplemental Data | | | | | |
Net assets, end of period (000 omitted) | $ 1,579 | $ 1,116 | $ 473 | $ 581 | $ 328 |
Portfolio turnover rate E | 32% | 32% | 68% | 87% | 116% |
A Total returns would have been lower if certain expenses had not been reduced during the applicable periods shown.
B Total returns do not include the effect of the contingent deferred sales charge.
C Calculated based on average shares outstanding during the period.
D Fees and expenses of any underlying Fidelity Central Funds are not included in the Fund's expense ratio. The Fund indirectly bears its proportionate share of the expenses of any underlying Fidelity Central Funds.
E Amount does not include the portfolio activity of any underlying Fidelity Central Funds.
F Expense ratios reflect operating expenses of the class. Expenses before reductions do not reflect amounts reimbursed by the investment adviser or reductions from brokerage service arrangements or reductions from other expense offset arrangements and do not represent the amount paid by the class during periods when reimbursements or reductions occur. Expenses net of fee waivers reflect expenses after reimbursement by the investment adviser but prior to reductions from brokerage service arrangements or other expense offset arrangements. Expenses net of all reductions represent the net expenses paid by the class.
G Amount represents less than $.01 per share.
See accompanying notes which are an integral part of the financial statements.
Annual Report
Financial Highlights - Class C
Years ended October 31, | 2013 | 2012 | 2011 | 2010 | 2009 |
Selected Per-Share Data | | | | | |
Net asset value, beginning of period | $ 8.84 | $ 8.03 | $ 8.34 | $ 6.98 | $ 5.42 |
Income from Investment Operations | | | | | |
Net investment income (loss) C | .01 | .02 | .01 | - G | .01 |
Net realized and unrealized gain (loss) | 1.87 | .80 | (.31) | 1.38 | 1.55 |
Total from investment operations | 1.88 | .82 | (.30) | 1.38 | 1.56 |
Distributions from net investment income | (.02) | (.01) | (.01) | - | - |
Distributions from net realized gain | (.01) | (.01) | (.01) | (.02) | - |
Total distributions | (.03) | (.01) I | (.01) H | (.02) | - |
Redemption fees added to paid in capital C, G | - | - | - | - | - |
Net asset value, end of period | $ 10.69 | $ 8.84 | $ 8.03 | $ 8.34 | $ 6.98 |
Total Return A, B | 21.29% | 10.27% | (3.57)% | 19.82% | 28.78% |
Ratios to Average Net Assets D, F | | | | | |
Expenses before reductions | 2.19% | 2.33% | 2.52% | 2.89% | 3.21% |
Expenses net of fee waivers, if any | 2.18% | 2.20% | 2.20% | 2.25% | 2.25% |
Expenses net of all reductions | 2.17% | 2.19% | 2.18% | 2.24% | 2.23% |
Net investment income (loss) | .05% | .24% | .17% | (.01)% | .09% |
Supplemental Data | | | | | |
Net assets, end of period (000 omitted) | $ 17,196 | $ 5,648 | $ 2,767 | $ 1,261 | $ 780 |
Portfolio turnover rate E | 32% | 32% | 68% | 87% | 116% |
A Total returns would have been lower if certain expenses had not been reduced during the applicable periods shown.
B Total returns do not include the effect of the contingent deferred sales charge.
C Calculated based on average shares outstanding during the period.
D Fees and expenses of any underlying Fidelity Central Funds are not included in the Fund's expense ratio. The Fund indirectly bears its proportionate share of the expenses of any underlying Fidelity Central Funds.
E Amount does not include the portfolio activity of any underlying Fidelity Central Funds.
F Expense ratios reflect operating expenses of the class. Expenses before reductions do not reflect amounts reimbursed by the investment adviser or reductions from brokerage service arrangements or reductions from other expense offset arrangements and do not represent the amount paid by the class during periods when reimbursements or reductions occur. Expenses net of fee waivers reflect expenses after reimbursement by the investment adviser but prior to reductions from brokerage service arrangements or other expense offset arrangements. Expenses net of all reductions represent the net expenses paid by the class.
G Amount represents less than $.01 per share.
H Total distributions of $.01 per share is comprised of distributions from net investment income of $.008 and distributions from net realized gain of $.005 per share.
I Total distributions of $.01 per share is comprised of distributions from net investment income of $.007 and distributions from net realized gain of $.006 per share.
See accompanying notes which are an integral part of the financial statements.
Annual Report
Financial Highlights - International Growth
Years ended October 31, | 2013 | 2012 | 2011 | 2010 | 2009 |
Selected Per-Share Data | | | | | |
Net asset value, beginning of period | $ 8.95 | $ 8.12 | $ 8.40 | $ 7.02 | $ 5.48 |
Income from Investment Operations | | | | | |
Net investment income (loss) B | .11 | .11 | .10 | .07 | .06 |
Net realized and unrealized gain (loss) | 1.88 | .81 | (.30) | 1.39 | 1.54 |
Total from investment operations | 1.99 | .92 | (.20) | 1.46 | 1.60 |
Distributions from net investment income | (.10) | (.08) | (.07) | (.06) | (.06) |
Distributions from net realized gain | (.01) | (.01) | (.01) | (.03) | - |
Total distributions | (.10) H | (.09) | (.08) | (.08) G | (.06) |
Redemption fees added to paid in capital B, F | - | - | - | - | - |
Net asset value, end of period | $ 10.84 | $ 8.95 | $ 8.12 | $ 8.40 | $ 7.02 |
Total Return A | 22.48% | 11.41% | (2.47)% | 20.97% | 29.77% |
Ratios to Average Net Assets C, E | | | | | |
Expenses before reductions | 1.13% | 1.28% | 1.52% | 1.89% | 2.19% |
Expenses net of fee waivers, if any | 1.13% | 1.20% | 1.20% | 1.25% | 1.25% |
Expenses net of all reductions | 1.11% | 1.19% | 1.18% | 1.23% | 1.23% |
Net investment income (loss) | 1.11% | 1.24% | 1.17% | .99% | 1.09% |
Supplemental Data | | | | | |
Net assets, end of period (000 omitted) | $ 430,914 | $ 149,526 | $ 53,437 | $ 28,454 | $ 18,254 |
Portfolio turnover rate D | 32% | 32% | 68% | 87% | 116% |
A Total returns would have been lower if certain expenses had not been reduced during the applicable periods shown.
B Calculated based on average shares outstanding during the period.
C Fees and expenses of any underlying Fidelity Central Funds are not included in the Fund's expense ratio. The Fund indirectly bears its proportionate share of the expenses of any underlying Fidelity Central Funds.
D Amount does not include the portfolio activity of any underlying Fidelity Central Funds.
E Expense ratios reflect operating expenses of the class. Expenses before reductions do not reflect amounts reimbursed by the investment adviser or reductions from brokerage service arrangements or reductions from other expense offset arrangements and do not represent the amount paid by the class during periods when reimbursements or reductions occur. Expenses net of fee waivers reflect expenses after reimbursement by the investment adviser but prior to reductions from brokerage service arrangements or other expense offset arrangements. Expenses net of all reductions represent the net expenses paid by the class.
F Amount represents less than $.01 per share.
G Total distributions of $.08 per share is comprised of distributions from net investment income of $.057 and distributions from net realized gain of $.025 per share.
H Total distributions of $.10 per share is comprised of distributions from net investment income of $.097 and distributions from net realized gain of $.005 per share.
See accompanying notes which are an integral part of the financial statements.
Annual Report
Financial Highlights - Institutional Class
Years ended October 31, | 2013 | 2012 | 2011 | 2010 | 2009 |
Selected Per-Share Data | | | | | |
Net asset value, beginning of period | $ 8.94 | $ 8.12 | $ 8.40 | $ 7.02 | $ 5.48 |
Income from Investment Operations | | | | | |
Net investment income (loss) B | .11 | .10 | .10 | .07 | .06 |
Net realized and unrealized gain (loss) | 1.90 | .81 | (.30) | 1.39 | 1.54 |
Total from investment operations | 2.01 | .91 | (.20) | 1.46 | 1.60 |
Distributions from net investment income | (.10) | (.08) | (.07) | (.06) | (.06) |
Distributions from net realized gain | (.01) | (.01) | (.01) | (.03) | - |
Total distributions | (.11) | (.09) | (.08) | (.08) G | (.06) |
Redemption fees added to paid in capital B, F | - | - | - | - | - |
Net asset value, end of period | $ 10.84 | $ 8.94 | $ 8.12 | $ 8.40 | $ 7.02 |
Total Return A | 22.66% | 11.28% | (2.47)% | 20.97% | 29.77% |
Ratios to Average Net Assets C, E | | | | | |
Expenses before reductions | 1.11% | 1.27% | 1.50% | 1.92% | 2.01% |
Expenses net of fee waivers, if any | 1.11% | 1.20% | 1.20% | 1.25% | 1.25% |
Expenses net of all reductions | 1.09% | 1.19% | 1.18% | 1.23% | 1.23% |
Net investment income (loss) | 1.13% | 1.24% | 1.17% | .99% | 1.09% |
Supplemental Data | | | | | |
Net assets, end of period (000 omitted) | $ 38,771 | $ 3,992 | $ 493 | $ 113 | $ 36 |
Portfolio turnover rate D | 32% | 32% | 68% | 87% | 116% |
A Total returns would have been lower if certain expenses had not been reduced during the applicable periods shown.
B Calculated based on average shares outstanding during the period.
C Fees and expenses of any underlying Fidelity Central Funds are not included in the Fund's expense ratio. The Fund indirectly bears its proportionate share of the expenses of any underlying Fidelity Central Funds.
D Amount does not include the portfolio activity of any underlying Fidelity Central Funds.
E Expense ratios reflect operating expenses of the class. Expenses before reductions do not reflect amounts reimbursed by the investment adviser or reductions from brokerage service arrangements or reductions from other expense offset arrangements and do not represent the amount paid by the class during periods when reimbursements or reductions occur. Expenses net of fee waivers reflect expenses after reimbursement by the investment adviser but prior to reductions from brokerage service arrangements or other expense offset arrangements. Expenses net of all reductions represent the net expenses paid by the class.
F Amount represents less than $.01 per share.
G Total distributions of $.08 per share is comprised of distributions from net investment income of $.057 and distributions from net realized gain of $.025 per share.
See accompanying notes which are an integral part of the financial statements.
Annual Report
Financial Highlights - Class Z
Year ended October 31, | 2013 G |
Selected Per-Share Data | |
Net asset value, beginning of period | $ 10.26 |
Income from Investment Operations | |
Net investment income (loss) D | .02 |
Net realized and unrealized gain (loss) | .56 |
Total from investment operations | .58 |
Redemption fees added to paid in capital D, I | - |
Net asset value, end of period | $ 10.84 |
Total Return B, C | 5.65% |
Ratios to Average Net Assets E, H | |
Expenses before reductions | .94% A |
Expenses net of fee waivers, if any | .94% A |
Expenses net of all reductions | .93% A |
Net investment income (loss) | .65% A |
Supplemental Data | |
Net assets, end of period (000 omitted) | $ 106 |
Portfolio turnover rate F | 32% |
A Annualized
B Total returns for periods of less than one year are not annualized.
C Total returns would have been lower if certain expenses had not been reduced during the applicable periods shown.
D Calculated based on average shares outstanding during the period.
E Fees and expenses of any underlying Fidelity Central Funds are not included in the Fund's expense ratio. The Fund indirectly bears its proportionate share of the expenses of any underlying Fidelity Central Funds.
F Amount does not include the portfolio activity of any underlying Fidelity Central Funds.
G For the period August 13, 2013 (commencement of sale of shares) to October 31, 2013.
H Expense ratios reflect operating expenses of the class. Expenses before reductions do not reflect amounts reimbursed by the investment adviser or reductions from brokerage service arrangements or reductions from other expense offset arrangements and do not represent the amount paid by the class during periods when reimbursements or reductions occur. Expense ratios before reductions for start-up periods may not be representative of longer-term operating periods. Expenses net of fee waivers reflect expenses after reimbursement by the investment adviser but prior to reductions from brokerage service arrangements or other expense offset arrangements. Expenses net of all reductions represent the net expenses paid by the class.
I Amount represents less than $.01 per share.
See accompanying notes which are an integral part of the financial statements.
Annual Report
Notes to Financial Statements
For the period ended October 31, 2013
1. Organization.
Fidelity International Growth Fund (the Fund) is a fund of Fidelity Investment Trust (the Trust) and is authorized to issue an unlimited number of shares. The Trust is registered under the Investment Company Act of 1940, as amended (the 1940 Act), as an open-end management investment company organized as a Massachusetts business trust. The Fund commenced sale of Class Z shares on August 13, 2013. The Fund offers Class A, Class T, Class C, International Growth, Institutional Class and Class Z shares, each of which, along with Class B shares, has equal rights as to assets and voting privileges. Class B shares are closed to new accounts and additional purchases, except for exchanges and reinvestments. Each class has exclusive voting rights with respect to matters that affect that class. Class B shares will automatically convert to Class A shares after a holding period of seven years from the initial date of purchase.
2. Investments in Fidelity Central Funds.
The Fund invests in Fidelity Central Funds, which are open-end investment companies generally available only to other investment companies and accounts managed by which Fidelity Management & Research Company (FMR) and its affiliates. The Fund's Schedule of Investments lists each of the Fidelity Central Funds held as of period end, if any, as an investment of the Fund, but does not include the underlying holdings of each Fidelity Central Fund. As an Investing Fund, the Fund indirectly bears its proportionate share of the expenses of the underlying Fidelity Central Funds.
The Money Market Central Funds seek preservation of capital and current income and are managed by Fidelity Investments Money Management, Inc. (FIMM), an affiliate of FMR.
A complete unaudited list of holdings for each Fidelity Central Fund is available upon request or at the Securities and Exchange Commission (the SEC) website at www.sec.gov. In addition, the financial statements of the Fidelity Central Funds, which are not covered by the Fund's Report of Independent Registered Public Accounting Firm, are available on the SEC website or upon request.
3. Significant Accounting Policies.
The financial statements have been prepared in conformity with accounting principles generally accepted in the United States of America (GAAP), which require management to make certain estimates and assumptions at the date of the financial statements. Actual results could differ from those estimates. Subsequent events, if any, through the date that the financial statements were issued have been evaluated in the preparation of
Annual Report
3. Significant Accounting Policies - continued
the financial statements. The following summarizes the significant accounting policies of the Fund:
Investment Valuation. Investments are valued as of 4:00 p.m. Eastern time on the last calendar day of the period. In accordance with valuation policies and procedures approved by the Board of Trustees (the Board), the Fund attempts to obtain prices from one or more third party pricing vendors or brokers to value its investments. When current market prices, quotations or currency exchange rates are not readily available or reliable, investments will be fair valued in good faith by the FMR Fair Value Committee (the Committee), in accordance with procedures adopted by the Board. Factors used in determining fair value vary by investment type and may include market or investment specific events. The frequency with which these procedures are used cannot be predicted and they may be utilized to a significant extent. The Committee oversees the Fund's valuation policies and procedures and is responsible for approving and reporting to the Board all fair value determinations.
The Fund categorizes the inputs to valuation techniques used to value its investments into a disclosure hierarchy consisting of three levels as shown below:
Level 1 - quoted prices in active markets for identical investments
Level 2 - other significant observable inputs (including quoted prices for similar investments, interest rates, prepayment speeds, etc.)
Level 3 - unobservable inputs (including the Fund's own assumptions based on the best information available)
Valuation techniques used to value the Fund's investments by major category are as follows:
Equity securities, including restricted securities, for which market quotations are readily available, are valued at the last reported sale price or official closing price as reported by a third party pricing vendor on the primary market or exchange on which they are traded and are categorized as Level 1 in the hierarchy. In the event there were no sales during the day or closing prices are not available, securities are valued at the last quoted bid price or may be valued using the last available price and are generally categorized as Level 2 in the hierarchy. For foreign equity securities, when market or security specific events arise, comparisons to the valuation of American Depositary Receipts (ADRs), futures contracts, Exchange-Traded Funds (ETFs) and certain indexes as well as quoted prices for similar securities may be used and would be categorized as Level 2 in the hierarchy. Utilizing these techniques may result in transfers between Level 1 and Level 2. For equity securities, including restricted securities, where observable inputs are limited, assumptions about market activity and risk are used and these securities may be categorized as Level 3 in the hierarchy.
Annual Report
Notes to Financial Statements - continued
3. Significant Accounting Policies - continued
Investment Valuation - continued
Investments in open-end mutual funds, including the Fidelity Central Funds, are valued at their closing net asset value (NAV) each business day and are categorized as Level 1 in the hierarchy.
Changes in valuation techniques may result in transfers in or out of an assigned level within the disclosure hierarchy. The aggregate value of investments by input level, as of October 31, 2013, including information on transfers between Levels 1 and 2, is included at the end of the Fund's Schedule of Investments.
Foreign Currency. The Fund may use foreign currency contracts to facilitate transactions in foreign-denominated securities. Gains and losses from these transactions may arise from changes in the value of the foreign currency or if the counterparties do not perform under the contracts' terms.
Foreign-denominated assets, including investment securities, and liabilities are translated into U.S. dollars at the exchange rates at period end. Purchases and sales of investment securities, income and dividends received and expenses denominated in foreign currencies are translated into U.S. dollars at the exchange rate in effect on the transaction date.
The effects of exchange rate fluctuations on investments are included with the net realized and unrealized gain (loss) on investment securities. Other foreign currency transactions resulting in realized and unrealized gain (loss) are disclosed separately.
Investment Transactions and Income. For financial reporting purposes, the Fund's investment holdings and NAV include trades executed through the end of the last business day of the period. The NAV per share for processing shareholder transactions is calculated as of the close of business of the New York Stock Exchange (NYSE), normally 4:00 p.m. Eastern time and includes trades executed through the end of the prior business day. Gains and losses on securities sold are determined on the basis of identified cost. Dividend income is recorded on the ex-dividend date, except for certain dividends from foreign securities where the ex-dividend date may have passed, which are recorded as soon as the Fund is informed of the ex-dividend date. Non-cash dividends included in dividend income, if any, are recorded at the fair market value of the securities received. Interest income and distributions from the Fidelity Central Funds are accrued as earned. Interest income includes coupon interest and amortization of premium and accretion of discount on debt securities. Investment income is recorded net of foreign taxes withheld where recovery of such taxes is uncertain.
Class Allocations and Expenses. Investment income, realized and unrealized capital gains and losses, common expenses of the Fund, and certain fund-level expense
Annual Report
3. Significant Accounting Policies - continued
Class Allocations and Expenses - continued
reductions, if any, are allocated daily on a pro-rata basis to each class based on the relative net assets of each class to the total net assets of the Fund. Each class differs with respect to transfer agent and distribution and service plan fees incurred. Certain expense reductions may also differ by class. For the reporting period, the allocated portion of income and expenses to each class as a percent of its average net assets may vary due to the timing of recording these transactions in relation to fluctuating net assets of the classes. Expenses directly attributable to a fund are charged to that fund. Expenses attributable to more than one fund are allocated among the respective funds on the basis of relative net assets or other appropriate methods. Expense estimates are accrued in the period to which they relate and adjustments are made when actual amounts are known.
Income Tax Information and Distributions to Shareholders. Each year, the Fund intends to qualify as a regulated investment company under Subchapter M of the Internal Revenue Code, including distributing substantially all of its taxable income and realized gains. As a result, no provision for U.S. Federal income taxes is required. As of October 31, 2013, the Fund did not have any unrecognized tax benefits in the financial statements; nor is the Fund aware of any tax positions for which it is reasonably possible that the total amounts of unrecognized tax benefits will significantly change in the next twelve months. The Fund files a U.S. federal tax return, in addition to state and local tax returns as required. The Fund's federal income tax returns are subject to examination by the Internal Revenue Service (IRS) for a period of three fiscal years after they are filed. State and local tax returns may be subject to examination for an additional fiscal year depending on the jurisdiction. Foreign taxes are provided for based on the Fund's understanding of the tax rules and rates that exist in the foreign markets in which it invests.
Distributions are declared and recorded on the ex-dividend date. Income dividends and capital gain distributions are declared separately for each class. Income and capital gain distributions are determined in accordance with income tax regulations, which may differ from GAAP. In addition, the Fund claimed a portion of the payment made to redeeming shareholders as a distribution for income tax purposes.
Capital accounts within the financial statements are adjusted for permanent book-tax differences. These adjustments have no impact on net assets or the results of operations. Temporary book-tax differences will reverse in a subsequent period.
Book-tax differences are primarily due to futures contracts, foreign currency transactions, passive foreign investment companies (PFIC), partnerships, capital loss carryforwards, and losses deferred due to wash sales.
Annual Report
Notes to Financial Statements - continued
3. Significant Accounting Policies - continued
Income Tax Information and Distributions to Shareholders - continued
The federal tax cost of investment securities and unrealized appreciation (depreciation) as of period end were as follows:
Gross unrealized appreciation | $ 77,456,036 |
Gross unrealized depreciation | (6,897,408) |
Net unrealized appreciation (depreciation) on securities and other investments | $ 70,558,628 |
| |
Tax Cost | $ 533,961,209 |
The tax-based components of distributable earnings as of period end were as follows:
Undistributed ordinary income | $ 2,476,993 |
Undistributed long-term capital gain | $ 516,487 |
Net unrealized appreciation (depreciation) | $ 70,555,556 |
The tax character of distributions paid was as follows:
| October 31, 2013 | October 31, 2012 |
Ordinary Income | $ 2,195,105 | $ 643,383 |
Short-Term Trading (Redemption) Fees. Shares held by investors in the Fund less than 30 days may have been subject to a redemption fee equal to 1.00% of the net asset value of shares redeemed. All redemption fees, which reduce the proceeds of the shareholder redemption, are retained by the Fund and accounted for as an addition to paid in capital.
New Accounting Pronouncement. The Financial Accounting Standards Board issued in December 2011, Accounting Standard Update No. 2011-11, Disclosures about Offsetting Assets and Liabilities, and in January 2013, Accounting Standards Update No. 2013-1 Clarifying the Scope of Disclosures about Offsetting Assets and Liabilities. These updates create new disclosure requirements requiring entities to disclose both gross and net information for derivatives and other financial instruments that are either offset in the Statement of Assets and Liabilities or subject to an enforceable master netting arrangement or similar agreement. The disclosure requirements are effective for annual reporting periods beginning on or after January 1, 2013, and interim periods within those annual periods. Management expects that the impact of the updates' adoption will be limited to additional financial statement disclosures as applicable.
Annual Report
4. Derivative Instruments.
Risk Exposures and the Use of Derivative Instruments. The Fund's investment objective allows the Fund to enter into various types of derivative contracts, including futures contracts. Derivatives are investments whose value is primarily derived from underlying assets, indices or reference rates and may be transacted on an exchange or over-the-counter (OTC). Derivatives may involve a future commitment to buy or sell a specified asset based on specified terms, to exchange future cash flows at periodic intervals based on a notional principal amount, or for one party to make one or more payments upon the occurrence of specified events in exchange for periodic payments from the other party.
The Fund used derivatives to increase returns and to manage exposure to certain risks as defined below. The success of any strategy involving derivatives depends on analysis of numerous economic factors, and if the strategies for investment do not work as intended, the Fund may not achieve its objectives.
The Fund's use of derivatives increased or decreased its exposure to the following risk:
Equity Risk | Equity risk relates to the fluctuations in the value of financial instruments as a result of changes in market prices (other than those arising from interest rate risk or foreign exchange risk), whether caused by factors specific to an individual investment, its issuer, or all factors affecting all instruments traded in a market or market segment. |
The Fund is also exposed to additional risks from investing in derivatives, such as liquidity risk and counterparty credit risk. Liquidity risk is the risk that the Fund will be unable to close out the derivative in the open market in a timely manner. Counterparty credit risk is the risk that the counterparty will not be able to fulfill its obligation to the Fund. Counterparty credit risk related to exchange-traded futures contracts may be mitigated by the protection provided by the exchange on which they trade.
Investing in derivatives may involve greater risks than investing in the underlying assets directly and, to varying degrees, may involve risk of loss in excess of any initial investment and collateral received and amounts recognized in the Statement of Assets and Liabilities. In addition, there may be the risk that the change in value of the derivative contract does not correspond to the change in value of the underlying instrument.
Futures Contracts. A futures contract is an agreement between two parties to buy or sell a specified underlying instrument for a fixed price at a specified future date. The Fund used futures contracts to manage its exposure to the stock market.
Upon entering into a futures contract, a fund is required to deposit either cash or securities (initial margin) with a clearing broker in an amount equal to a certain percentage of the face value of the contract. Futures contracts are marked-to-market daily and subsequent daily payments (variation margin) are made or received by a fund depending on
Annual Report
Notes to Financial Statements - continued
4. Derivative Instruments - continued
Futures Contracts - continued
the daily fluctuations in the value of the futures contracts and are recorded as unrealized appreciation or (depreciation). This receivable and/or payable, if any, is included in daily variation margin for derivative instruments in the Statement of Assets and Liabilities. Realized gain or (loss) is recorded upon the expiration or closing of a futures contract.
Any open futures contracts at period end are presented in the Schedule of Investments under the caption "Futures Contracts." The underlying face amount at value reflects each contract's exposure to the underlying instrument or index at period end.
During the period the Fund recognized net realized gain (loss) of $(517,867) related to its investment in futures contracts. This amount is included in the Statement of Operations.
5. Purchases and Sales of Investments.
Purchases and sales of securities, other than short-term securities, aggregated $423,057,094 and $105,902,960, respectively.
6. Fees and Other Transactions with Affiliates.
Management Fee. FMR and its affiliates provide the Fund with investment management related services for which the Fund pays a monthly management fee. The management fee is the sum of an individual fund fee rate that is based on an annual rate of .45% of the Fund's average net assets and an annualized group fee rate that averaged .25% during the period. The group fee rate is based upon the average net assets of all the mutual funds advised by FMR, including any mutual funds previously advised by FMR that are currently advised by Fidelity SelectCo, LLC, an affiliate of FMR. The group fee rate decreases as assets under management increase and increases as assets under management decrease. In addition, the management fee is subject to a performance adjustment (up to a maximum of ±.20% of the Fund's average net assets over a 36 month performance period). The upward or downward adjustment to the management fee is based on the relative investment performance of International Growth as compared to an appropriate benchmark index over the same 36 month performance period. For the reporting period, the total annual management fee rate, including the performance adjustment, was .75% of the Fund's average net assets. The performance adjustment included in the management fee rate may be higher or lower than the maximum performance adjustment rate due to the difference between the average net assets for the reporting and performance periods.
Distribution and Service Plan Fees. In accordance with Rule 12b-1 of the 1940 Act, the Fund has adopted separate Distribution and Service Plans for each class of shares.
Annual Report
6. Fees and Other Transactions with Affiliates - continued
Distribution and Service Plan Fees - continued
Certain classes pay Fidelity Distributors Corporation (FDC), an affiliate of FMR, separate Distribution and Service Fees, each of which is based on an annual percentage of each class' average net assets. In addition, FDC may pay financial intermediaries for selling shares of the Fund and providing shareholder support services. For the period, the Distribution and Service Fee rates, total fees and amounts retained by FDC were as follows:
| Distribution
Fee | Service
Fee | Total Fees | Retained
by FDC |
Class A | -% | .25% | $ 111,996 | $ 3,731 |
Class T | .25% | .25% | 74,898 | - |
Class B | .75% | .25% | 12,264 | 9,227 |
Class C | .75% | .25% | 113,336 | 38,127 |
| | | $ 312,494 | $ 51,085 |
Sales Load. FDC may receive a front-end sales charge of up to 5.75% for selling Class A shares and 3.50% for selling Class T shares, some of which is paid to financial intermediaries for selling shares of the Fund. Depending on the holding period, FDC may receive contingent deferred sales charges levied on Class A, Class T, Class B, and Class C redemptions. The deferred sales charges range from 5.00% to 1.00% for Class B shares, 1.00% for Class C shares, 1.00% for certain purchases of Class A shares and .25% for certain purchases of Class T shares.
For the period, sales charge amounts retained by FDC were as follows:
| Retained
by FDC |
Class A | $ 55,379 |
Class T | 12,148 |
Class B* | 741 |
Class C* | 2,285 |
| $ 70,553 |
* When Class B and Class C shares are initially sold, FDC pays commissions from its own resources to financial intermediaries through which the sales
are made.
Transfer Agent Fees. Fidelity Investments Institutional Operations Company, Inc., (FIIOC), an affiliate of FMR, is the transfer, dividend disbursing and shareholder servicing agent for each class of the Fund. FIIOC receives account fees and asset-based fees that vary according to the account size and type of account of the shareholders of the respective classes of the Fund, except for Class Z. FIIOC receives an asset-based fee of
Annual Report
Notes to Financial Statements - continued
6. Fees and Other Transactions with Affiliates - continued
Transfer Agent Fees - continued
Class Z's average net assets. FIIOC pays for typesetting, printing and mailing of shareholder reports, except proxy statements.
For the period, transfer agent fees for each class were as follows:
| Amount | % of
Average
Net Assets |
Class A | $ 133,141 | .29 |
Class T | 45,948 | .30 |
Class B | 3,660 | .30 |
Class C | 33,951 | .30 |
International Growth | 618,957 | .24 |
Institutional Class | 30,066 | .22 |
Class Z | 11 | .05* |
| $ 865,734 | |
* Annualized
Accounting and Security Lending Fees. Fidelity Service Company, Inc. (FSC), an affiliate of FMR, maintains the Fund's accounting records. The accounting fee is based on the level of average net assets for each month. Under a separate contract, FSC administers the security lending program. The security lending fee is based on the number and duration of lending transactions.
Brokerage Commissions. The Fund placed a portion of its portfolio transactions with brokerage firms which are affiliates of the investment adviser. Brokerage commissions are included in net realized gain (loss) and change in net unrealized appreciation (depreciation) in the Statement of Operations. The commissions paid to these affiliated firms were $2,164 for the period.
7. Committed Line of Credit.
The Fund participates with other funds managed by FMR or an affiliate in a $4.25 billion credit facility (the "line of credit") to be utilized for temporary or emergency purposes to fund shareholder redemptions or for other short-term liquidity purposes. The Fund has agreed to pay commitment fees on its pro-rata portion of the line of credit, which amounted to $647 and is reflected in Miscellaneous expenses on the Statement of Operations. During the period, there were no borrowings on this line of credit.
8. Security Lending.
The Fund lends portfolio securities through a lending agent from time to time in order to earn additional income. For equity securities, a lending agent is used and may loan
Annual Report
8. Security Lending - continued
securities to certain qualified borrowers, including Fidelity Capital Markets (FCM), a broker-dealer affiliated with the Fund. On the settlement date of the loan, the Fund receives collateral (in the form of U.S. Treasury obligations, letters of credit and/or cash) against the loaned securities and maintains collateral in an amount not less than 100% of the market value of the loaned securities during the period of the loan. The market value of the loaned securities is determined at the close of business of the Fund and any additional required collateral is delivered to the Fund on the next business day. If the borrower defaults on its obligation to return the securities loaned because of insolvency or other reasons, the Fund may apply collateral received from the borrower against the obligation. The Fund may experience delays and costs in recovering the securities loaned. Any cash collateral received is invested in the Fidelity Securities Lending Cash Central Fund. The value of loaned securities and cash collateral at period end are disclosed on the Fund's Statement of Assets and Liabilities. The value of securities loaned to FCM at period end was $812,318. Security lending income represents the income earned on investing cash collateral, less rebates paid to borrowers and any lending agent fees associated with the loan, plus any premium payments received for lending certain types of securities. Security lending income is presented in the Statement of Operations as a component of income from Fidelity Central Funds. Total security lending income during the period amounted to $209,783, including $4,235 from securities loaned to FCM.
9. Expense Reductions.
FMR voluntarily agreed to reimburse a portion of Class A, Class T, Class B, Class C, International Growth and Institutional Class operating expenses. During the period, this reimbursement reduced expenses as follows:
| Reimbursement |
Class A | $ 1,675 |
Class T | 515 |
Class B | 36 |
Class C | 417 |
International Growth | 10,450 |
Institutional Class | 831 |
| $ 13,924 |
In addition, FMR reimbursed a portion of the Fund's operating expenses during the period in the amount of $1,356.
Annual Report
Notes to Financial Statements - continued
9. Expense Reductions - continued
Commissions paid to certain brokers with whom FMR, or its affiliates, places trades on behalf of the Fund include an amount in addition to trade execution, which may be rebated back to the Fund to offset certain expenses. This amount totaled $46,315 for the period.
10. Distributions to Shareholders.
Distributions to shareholders of each class were as follows:
Years ended October 31, | 2013 | 2012 |
From net investment income | | |
Class A | $ 226,330 | $ 50,503 |
Class T | 86,155 | 18,666 |
Class B | 4,290 | - |
Class C | 14,481 | 2,205 |
International Growth | 1,698,830 | 516,958 |
Institutional Class | 51,250 | 6,406 |
Total | $ 2,081,336 | $ 594,738 |
From net realized gain | | |
Class A | $ 13,472 | $ 4,810 |
Class T | 6,243 | 2,196 |
Class B | 631 | - |
Class C | 3,291 | 1,890 |
International Growth | 87,569 | 39,262 |
Institutional Class | 2,563 | 487 |
Total | $ 113,769 | $ 48,645 |
11. Share Transactions.
Transactions for each class of shares were as follows:
| Shares | Dollars |
Years ended October 31, | 2013 A | 2012 | 2013 A | 2012 |
Class A | | | | |
Shares sold | 5,907,169 | 1,901,699 | $ 58,500,264 | $ 16,560,116 |
Reinvestment of distributions | 24,178 | 5,422 | 218,566 | 42,831 |
Shares redeemed | (1,466,703) | (236,851) | (14,226,261) | (2,015,265) |
Net increase (decrease) | 4,464,644 | 1,670,270 | $ 44,492,569 | $ 14,587,682 |
Class T | | | | |
Shares sold | 1,144,706 | 941,446 | $ 11,429,141 | $ 8,178,600 |
Reinvestment of distributions | 10,086 | 2,626 | 91,076 | 20,742 |
Shares redeemed | (206,178) | (102,766) | (2,020,899) | (866,637) |
Net increase (decrease) | 948,614 | 841,306 | $ 9,499,318 | $ 7,332,705 |
Annual Report
11. Share Transactions - continued
| Shares | Dollars |
Years ended October 31, | 2013 A | 2012 | 2013 A | 2012 |
Class B | | | | |
Shares sold | 70,442 | 92,865 | $ 702,618 | $ 806,549 |
Reinvestment of distributions | 531 | - | 4,806 | - |
Shares redeemed | (49,437) | (25,954) | (483,935) | (218,180) |
Net increase (decrease) | 21,536 | 66,911 | $ 223,489 | $ 588,369 |
Class C | | | | |
Shares sold | 1,392,365 | 400,291 | $ 13,520,584 | $ 3,375,948 |
Reinvestment of distributions | 1,911 | 510 | 17,237 | 4,026 |
Shares redeemed | (424,469) | (106,475) | (4,120,400) | (879,489) |
Net increase (decrease) | 969,807 | 294,326 | $ 9,417,421 | $ 2,500,485 |
International Growth | | | | |
Shares sold | 29,198,608 | 13,301,892 | $ 290,678,738 | $ 114,028,412 |
Reinvestment of distributions | 192,126 | 68,821 | 1,742,585 | 544,378 |
Shares redeemed | (6,365,570) | (3,238,606) | (62,814,771) | (27,713,258) |
Net increase (decrease) | 23,025,164 | 10,132,107 | $ 229,606,552 | $ 86,859,532 |
Institutional Class | | | | |
Shares sold | 3,568,741 | 438,656 | $ 35,951,935 | $ 3,841,370 |
Reinvestment of distributions | 5,682 | 655 | 51,476 | 5,178 |
Shares redeemed | (443,392) | (53,696) | (4,427,602) | (443,499) |
Net increase (decrease) | 3,131,031 | 385,615 | $ 31,575,809 | $ 3,403,049 |
Class Z | | | | |
Shares sold | 9,747 | - | $ 100,000 | $ - |
Reinvestment of distributions | - | - | - | - |
Shares redeemed | - | - | - | - |
Net increase (decrease) | 9,747 | - | $ 100,000 | $ - |
A Share transactions for Class Z are for the period August 13, 2013 (commencement of sale of shares) to October 31, 2013.
12. Other.
The Fund's organizational documents provide former and current trustees and officers with a limited indemnification against liabilities arising in connection with the performance of their duties to the Fund. In the normal course of business, the Fund may also enter into contracts that provide general indemnifications. The Fund's maximum exposure under these arrangements is unknown as this would be dependent on future claims that may be made against the Fund. The risk of material loss from such claims is considered remote.
Annual Report
To the Trustees of Fidelity Investment Trust and the Shareholders of Fidelity International Growth Fund:
In our opinion, the accompanying statement of assets and liabilities, including the schedule of investments, and the related statements of operations and of changes in net assets and the financial highlights present fairly, in all material respects, the financial position of Fidelity International Growth Fund (a fund of Fidelity Investment Trust) at October 31, 2013, the results of its operations for the year then ended, the changes in its net assets for each of the two years in the period then ended and the financial highlights for each of the periods indicated, in conformity with accounting principles generally accepted in the United States of America. These financial statements and financial highlights (hereafter referred to as "financial statements") are the responsibility of the Fidelity International Growth Fund's management. Our responsibility is to express an opinion on these financial statements based on our audits. We conducted our audits of these financial statements in accordance with the standards of the Public Company Accounting Oversight Board (United States). Those standards require that we plan and perform the audit to obtain reasonable assurance about whether the financial statements are free of material misstatement. An audit includes examining, on a test basis, evidence supporting the amounts and disclosures in the financial statements, assessing the accounting principles used and significant estimates made by management, and evaluating the overall financial statement presentation. We believe that our audits, which included confirmation of securities at October 31, 2013 by correspondence with the custodian and brokers, provide a reasonable basis for our opinion.
PricewaterhouseCoopers LLP
Boston, Massachusetts
December 11, 2013
Annual Report
The Trustees, Member of the Advisory Board, and executive officers of the trust and fund, as applicable, are listed below. The Board of Trustees governs the fund and is responsible for protecting the interests of shareholders. The Trustees are experienced executives who meet periodically throughout the year to oversee the fund's activities, review contractual arrangements with companies that provide services to the fund, oversee management of the risks associated with such activities and contractual arrangements, and review the fund's performance. Except for James C. Curvey, Ned C. Lautenbach, Ronald P. O'Hanley, and William S. Stavropoulos, each of the Trustees oversees 171 funds. Mr. Curvey oversees 394 funds. Mr. Lautenbach, Mr. O'Hanley, and Mr. Stavropoulos each oversees 245 funds.
The Trustees hold office without limit in time except that (a) any Trustee may resign; (b) any Trustee may be removed by written instrument, signed by at least two-thirds of the number of Trustees prior to such removal; (c) any Trustee who requests to be retired or who has become incapacitated by illness or injury may be retired by written instrument signed by a majority of the other Trustees; and (d) any Trustee may be removed at any special meeting of shareholders by a two-thirds vote of the outstanding voting securities of the trust. Each Trustee who is not an interested person of the trust and the fund (as defined in the 1940 Act) (Independent Trustee), shall retire not later than the last day of the calendar year in which his or her 75th birthday occurs. The Independent Trustees may waive this mandatory retirement age policy with respect to individual Trustees. The executive officers and Advisory Board Member hold office without limit in time, except that any officer and Advisory Board Member may resign or may be removed by a vote of a majority of the Trustees at any regular meeting or any special meeting of the Trustees. Except as indicated, each individual has held the office shown or other offices in the same company for the past five years.
Experience, Skills, Attributes, and Qualifications of the Fund's Trustees. The Governance and Nominating Committee has adopted a statement of policy that describes the experience, qualifications, attributes, and skills that are necessary and desirable for potential Independent Trustee candidates (Statement of Policy). The Board believes that each Trustee satisfied at the time he or she was initially elected or appointed a Trustee, and continues to satisfy, the standards contemplated by the Statement of Policy. The Governance and Nominating Committee also engages professional search firms to help identify potential Independent Trustee candidates who have the experience, qualifications, attributes, and skills consistent with the Statement of Policy. From time to time, additional criteria based on the composition and skills of the current Independent Trustees, as well as experience or skills that may be appropriate in light of future changes to board composition, business conditions, and regulatory or other developments, have also been considered by the professional search firms and the Governance and Nominating Committee. In addition, the Board takes into account the Trustees' commitment and participation in Board and committee meetings, as well as their leadership of standing and ad hoc committees throughout their tenure.
Annual Report
Trustees and Officers - continued
In determining that a particular Trustee was and continues to be qualified to serve as a Trustee, the Board has considered a variety of criteria, none of which, in isolation, was controlling. The Board believes that, collectively, the Trustees have balanced and diverse experience, qualifications, attributes, and skills, which allow the Board to operate effectively in governing the fund and protecting the interests of shareholders. Information about the specific experience, skills, attributes, and qualifications of each Trustee, which in each case led to the Board's conclusion that the Trustee should serve (or continue to serve) as a trustee of the fund, is provided below.
Board Structure and Oversight Function. James C. Curvey is an interested person (as defined in the 1940 Act) and currently serves as Chairman. The Trustees have determined that an interested Chairman is appropriate and benefits shareholders because an interested Chairman has a personal and professional stake in the quality and continuity of services provided to the fund. Independent Trustees exercise their informed business judgment to appoint an individual of their choosing to serve as Chairman, regardless of whether the Trustee happens to be independent or a member of management. The Independent Trustees have determined that they can act independently and effectively without having an Independent Trustee serve as Chairman and that a key structural component for assuring that they are in a position to do so is for the Independent Trustees to constitute a substantial majority for the Board. The Independent Trustees also regularly meet in executive session. Ned C. Lautenbach serves as Chairman of the Independent Trustees and as such (i) acts as a liaison between the Independent Trustees and management with respect to matters important to the Independent Trustees and (ii) with management prepares agendas for Board meetings.
Fidelity funds are overseen by different Boards of Trustees. The fund's Board oversees Fidelity's equity and high income funds and another Board oversees Fidelity's investment-grade bond, money market, and asset allocation funds. The asset allocation funds may invest in Fidelity funds overseen by the fund's Board. The use of separate Boards, each with its own committee structure, allows the Trustees of each group of Fidelity funds to focus on the unique issues of the funds they oversee, including common research, investment, and operational issues. On occasion, the separate Boards establish joint committees to address issues of overlapping consequences for the Fidelity funds overseen by each Board.
The Trustees operate using a system of committees to facilitate the timely and efficient consideration of all matters of importance to the Trustees, the fund, and fund shareholders and to facilitate compliance with legal and regulatory requirements and oversight of the fund's activities and associated risks. The Board, acting through its committees, has charged FMR and its affiliates with (i) identifying events or circumstances the occurrence of which could have demonstrably adverse effects on the fund's business and/or reputation; (ii) implementing processes and controls to lessen the possibility that such events or circumstances occur or to mitigate the effects of such events or circumstances if they do occur; and (iii) creating and maintaining a system designed to evaluate continuously business and market conditions in order to facilitate the identification and implementation processes described in (i) and (ii) above. Because the day-to-day operations and activities of the fund are carried out by or through FMR, its affiliates and other service providers, the fund's exposure to risks is mitigated but not eliminated by the processes overseen by the Trustees. While each of the Board's committees has responsibility for overseeing different aspects of the fund's activities, oversight is exercised primarily through the Operations, Audit, and Compliance Committees. In addition, the Independent Trustees have worked with FMR to enhance the Board's oversight of investment and financial risks, legal and regulatory risks, technology risks, and operational risks, including the development of additional risk reporting to the Board. For example, a working group comprised of Independent Trustees and FMR has worked and continues to work to review the Fidelity funds' valuation-related activities, reporting and risk management. Appropriate personnel, including but not limited to the fund's Chief Compliance Officer (CCO), FMR's internal auditor, the independent accountants, the fund's Treasurer and portfolio management personnel, make periodic reports to the Board's committees, as appropriate, including an annual review of FMR's risk management program for the Fidelity funds. The responsibilities of each standing committee, including their oversight responsibilities, are described further under "Standing Committees of the Fund's Trustees."
Annual Report
The fund's Statement of Additional Information (SAI) includes more information about the Trustees. To request a free copy, call Fidelity at 1-800-544-8544.
Interested Trustees*:
Correspondence intended for each Trustee who is an interested person may be sent to Fidelity Investments, 245 Summer Street, Boston, Massachusetts 02210.
Name, Year of Birth; Principal Occupations and Other Relevant Experience+ |
James C. Curvey (1935) |
Year of Election or Appointment: 2007 Trustee Chairman of the Board of Trustees |
| Mr. Curvey also serves as Trustee of other Fidelity funds. Mr. Curvey is a Director of Fidelity Investments Money Management, Inc. (2009-present), Director of Fidelity Research & Analysis Co. (2009-present) and Director of FMR and FMR Co., Inc. (2007-present). Mr. Curvey is also Vice Chairman (2007-present) and Director of FMR LLC. In addition, Mr. Curvey serves as an Overseer for the Boston Symphony Orchestra and a member of the Trustees of Villanova University. Previously, Mr. Curvey was the Vice Chairman (2006-2007) and Director (2000-2007) of FMR Corp. |
Ronald P. O'Hanley (1957) |
Year of Election or Appointment: 2011 Trustee |
| Mr. O'Hanley also serves as Trustee of other Fidelity funds. He is Director of Fidelity SelectCo, LLC (2013-present), FMR Co., Inc. (2010-present), Director of Fidelity Investments Money Management, Inc. (2010-present), Director of Fidelity Research & Analysis Company (2010-present), President of Fidelity Asset Management and Corporate Services and a Member of Fidelity's Executive Committee (2010-present). Previously, Mr. O'Hanley served as President and Chief Executive Officer of BNY Mellon Asset Management (2007-2010). Mr. O'Hanley also served as Vice Chairman of Bank New York Mellon Corp. and a member of that firm's Executive Committee. Prior to the 2007 merger of The Bank of New York and Mellon Financial Corporation, he was Vice Chairman of Mellon Financial Corporation and President and Chief Executive Officer of Mellon Asset Management. He joined Mellon in February 1997. Mr. O'Hanley currently serves as Chairman of the Boston Public Library Foundation Board of Directors and sits on the Board of Directors of Beth Israel Deaconess Medical Center, the Board of Trustees of the Marine Biological Laboratory and the Advisory Board of the Maxwell School of Citizenship and Public Administration at Syracuse University. Mr. O'Hanley also chairs the Council on Asset Management for the Financial Services Roundtable and is a member of the Board of Directors of Institutional Investor's U.S. Institute. |
* Trustees have been determined to be "Interested Trustees" by virtue of, among other things, their affiliation with the trust or various entities under common control with FMR.
+ The information above includes each Trustee's principal occupation during the last five years and other information relating to the experience, attributes, and skills relevant to each Trustee's qualifications to serve as a Trustee, which led to the conclusion that each Trustee should serve as a Trustee for the fund.
Annual Report
Independent Trustees:
Correspondence intended for each Independent Trustee (that is, the Trustees other than the Interested Trustees) may be sent to Fidelity Investments, P.O. Box 55235, Boston, Massachusetts 02205-5235.
Name, Year of Birth; Principal Occupations and Other Relevant Experience+ |
Dennis J. Dirks (1948) |
Year of Election or Appointment: 2005 Trustee |
| Mr. Dirks also serves as Trustee of other Fidelity funds. Prior to his retirement in May 2003, Mr. Dirks was Chief Operating Officer and a member of the Board of The Depository Trust & Clearing Corporation (DTCC). He also served as President, Chief Operating Officer, and Board member of The Depository Trust Company (DTC) and President and Board member of the National Securities Clearing Corporation (NSCC). In addition, Mr. Dirks served as Chief Executive Officer and Board member of the Government Securities Clearing Corporation, Chief Executive Officer and Board member of the Mortgage-Backed Securities Clearing Corporation, as a Trustee and a member of the Finance Committee of Manhattan College (2005-2008), and as a Trustee and a member of the Finance Committee of AHRC of Nassau County (2006-2008). Mr. Dirks is a member of the Independent Directors Council (IDC) Governing Council (2010-present) and Board of Directors for The Brookville Center for Children's Services, Inc. (2009-present). |
Alan J. Lacy (1953) |
Year of Election or Appointment: 2008 Trustee |
| Mr. Lacy also serves as Trustee of other Fidelity funds. Mr. Lacy serves as Senior Adviser (2007-present) of Oak Hill Capital Partners, L.P. (private equity). Mr. Lacy also served as Chief Executive Officer (2000-2005) and Vice Chairman (2005-2006) of Sears Holdings Corporation and Sears, Roebuck and Co. (retail). In addition, Mr. Lacy serves as a member of the Board of Directors of Dave & Buster's Entertainment, Inc. (restaurant and entertainment complexes, 2010-present), Earth Fare, Inc. (retail grocery, 2012-present), The Hillman Companies, Inc. (hardware wholesalers, 2010-present), and Bristol-Myers Squibb Company (global pharmaceuticals, 2008-present). Mr. Lacy is a member of the Board of Trustees of The National Parks Conservation Association (2006-present). Previously, Mr. Lacy served as Chairman of the Board of Trustees of the National Parks Conservation Association (2008-2011) and as a member of the Board of Directors for the Western Union Company (global money transfer, 2006-2011). |
Ned C. Lautenbach (1944) |
Year of Election or Appointment: 2000 Trustee Chairman of the Independent Trustees |
| Mr. Lautenbach also serves as Trustee of other Fidelity funds. Mr. Lautenbach currently serves as the Lead Director of the Eaton Corporation Board of Directors (diversified industrial, 1997-present). Mr. Lautenbach is Chairman of the Board of Directors of the Philharmonic Center for the Arts in Naples, Florida (2012-present) and a member of the Council on Foreign Relations (1994-present). Previously, Mr. Lautenbach was a Partner/Advisory Partner at Clayton, Dubilier & Rice, LLC (private equity investment, 1998-2010), as well as a Director of Sony Corporation (2006-2007). |
Joseph Mauriello (1944) |
Year of Election or Appointment: 2008 Trustee |
| Mr. Mauriello also serves as Trustee of other Fidelity funds. Prior to his retirement in January 2006, Mr. Mauriello served in numerous senior management positions including Deputy Chairman and Chief Operating Officer (2004-2005), and Vice Chairman of Financial Services (2002-2004) of KPMG LLP US (professional services, 1965-2005). Mr. Mauriello currently serves as a member of the Board of Directors of XL Group plc. (global insurance and re-insurance, 2006-present). Previously, Mr. Mauriello served as a Director of the Hamilton Funds of the Bank of New York (2006-2007) and of Arcadia Resources Inc. (health care services and products, 2007-2012). |
Robert W. Selander (1950) |
Year of Election or Appointment: 2011 Trustee |
| Mr. Selander also serves as Trustee of other Fidelity funds. Previously, Mr. Selander served as a Member of the Advisory Board of other Fidelity funds (2011), and Executive Vice Chairman (2010), Chief Executive Officer (2009-2010), and President and Chief Executive Officer (1997-2009) of Mastercard, Inc. |
Cornelia M. Small (1944) |
Year of Election or Appointment: 2005 Trustee |
| Ms. Small also serves as Trustee of other Fidelity funds. Ms. Small is a member of the Board of Directors (2009-present) and Chair of the Investment Committee (2010-present) of the Teagle Foundation. Ms. Small also serves on the Investment Committee of the Berkshire Taconic Community Foundation (2008-present). Previously, Ms. Small served as Chairperson (2002-2008) and a member of the Investment Committee and Chairperson (2008-2012) and a member of the Board of Trustees of Smith College. In addition, Ms. Small served as Chief Investment Officer, Director of Global Equity Investments, and a member of the Board of Directors of Scudder, Stevens & Clark and Scudder Kemper Investments. |
William S. Stavropoulos (1939) |
Year of Election or Appointment: 2001 Trustee Vice Chairman of the Independent Trustees |
| Mr. Stavropoulos also serves as Trustee of other Fidelity funds. Mr. Stavropoulos serves as President and Founder of the Michigan Baseball Foundation, the Great Lakes Loons (2007-present). Mr. Stavropoulos is Chairman Emeritus of the Board of Directors of The Dow Chemical Company, where he previously served in numerous senior management positions, including President, CEO (1995-2000; 2002-2004), Chairman of the Executive Committee (2000-2006), and as a member of the Board of Directors (1990-2006). Currently, Mr. Stavropoulos is Chairman of the Board of Directors of Univar Inc. (global distributor of commodity and specialty chemicals), a Director of Teradata Corporation (data warehousing and technology solutions), and Maersk Inc. (industrial conglomerate), and a member of the Advisory Board for Metalmark Capital LLC (private equity investment, 2005-present). Mr. Stavropoulos is an operating advisor to Clayton, Dubilier & Rice, LLC (private equity investment). In addition, Mr. Stavropoulos is a member of the University of Notre Dame Advisory Council for the College of Science, a Trustee of the Rollin L. Gerstacker Foundation, and a Director of the Naples Philharmonic Center for the Arts. Previously, Mr. Stavropoulos served as a Director of Chemical Financial Corporation (bank holding company, 1993-2012) and Tyco International, Ltd. (multinational manufacturing and services, 2007-2012). |
David M. Thomas (1949) |
Year of Election or Appointment: 2008 Trustee |
| Mr. Thomas also serves as Trustee of other Fidelity funds. Mr. Thomas serves as Non-Executive Chairman of the Board of Directors of Fortune Brands Home and Security (home and security products, 2011-present), and as a member of the Board of Directors of Interpublic Group of Companies, Inc. (marketing communication, 2004-present). Previously, Mr. Thomas served as Executive Chairman (2005-2006) and Chairman and Chief Executive Officer (2000-2005) of IMS Health, Inc. (pharmaceutical and healthcare information solutions), and a Director of Fortune Brands, Inc. (consumer products, 2000-2011). |
+ The information above includes each Trustee's principal occupation during the last five years and other information relating to the experience, attributes, and skills relevant to each Trustee's qualifications to serve as a Trustee, which led to the conclusion that each Trustee should serve as a Trustee for the fund.
Advisory Board Member and Executive Officers:
Correspondence intended for each executive officer and Peter S. Lynch may be sent to Fidelity Investments, 245 Summer Street, Boston, Massachusetts 02210. Executive officers appear below in alphabetical order.
Name, Year of Birth; Principal Occupation |
Peter S. Lynch (1944) |
Year of Election or Appointment: 2003 Member of the Advisory Board |
| Mr. Lynch also serves as Member of the Advisory Board of other Fidelity funds. Mr. Lynch is Vice Chairman and a Director of FMR and FMR Co., Inc. In addition, Mr. Lynch serves as a Trustee of Boston College and as the Chairman of the Inner-City Scholarship Fund. Previously, Mr. Lynch served on the Special Olympics International Board of Directors (1997-2006). |
Elizabeth Paige Baumann (1968) |
Year of Election or Appointment: 2012 Anti-Money Laundering (AML) Officer |
| Ms. Baumann also serves as AML Officer of other funds. She is Chief AML Officer of FMR LLC (2012-present) and is an employee of Fidelity Investments. Previously, Ms. Baumann served as Vice President and Deputy Anti-Money Laundering Officer (2007-2012). |
William C. Coffey (1969) |
Year of Election or Appointment: 2009 Assistant Secretary |
| Mr. Coffey also serves as Assistant Secretary of other funds. He is Senior Vice President and Deputy General Counsel of FMR LLC (2010-present), and is an employee of Fidelity Investments. Previously, Mr. Coffey served as Vice President and Associate General Counsel of FMR LLC (2005-2009). |
Jonathan Davis (1968) |
Year of Election or Appointment: 2010 Assistant Treasurer |
| Mr. Davis also serves as Assistant Treasurer of other funds. Mr. Davis is an employee of Fidelity Investments. Previously, Mr. Davis served as Vice President and Associate General Counsel of FMR LLC (2003-2010). |
Adrien E. Deberghes (1967) |
Year of Election or Appointment: 2008 Deputy Treasurer |
| Mr. Deberghes also serves as an officer of other funds. He is an employee of Fidelity Investments (2008-present). Prior to joining Fidelity Investments, Mr. Deberghes was Senior Vice President of Mutual Fund Administration at State Street Corporation (2007-2008), Senior Director of Mutual Fund Administration at Investors Bank & Trust (2005-2007), and Director of Finance for Dunkin' Brands (2000-2005). |
Stephanie J. Dorsey (1969) |
Year of Election or Appointment: 2010 Assistant Treasurer |
| Ms. Dorsey also serves as an officer of other funds. She is an employee of Fidelity Investments (2008-present) and has served in other fund officer roles. Prior to joining Fidelity Investments, Ms. Dorsey served as Treasurer (2004-2008) of the JPMorgan Mutual Funds and Vice President (2004-2008) of JPMorgan Chase Bank. |
Scott C. Goebel (1968) |
Year of Election or Appointment: 2008 Secretary and Chief Legal Officer (CLO) |
| Mr. Goebel serves as Secretary and CLO of other funds. Mr. Goebel also serves as Secretary of Fidelity Investments Money Management, Inc. (FIMM) (2010-present) and Fidelity Research and Analysis Company (FRAC) (2010-present); General Counsel, Secretary, and Senior Vice President of FMR (2008-present) and FMR Co., Inc. (2008-present); Chief Legal Officer of Fidelity Management & Research (Hong Kong) Limited (2008-present) and Assistant Secretary of Fidelity Management & Research (Japan) Inc. (2008-present), and Fidelity Management & Research (U.K.) Inc. (2008-present). Previously, Mr. Goebel served as Secretary and CLO of other Fidelity funds (2008-2013), Assistant Secretary of FIMM (2008-2010), FRAC (2008-2010), and certain funds (2007-2008); and as Vice President and Secretary of Fidelity Distributors Corporation (FDC) (2005-2007). Mr. Goebel has been employed by FMR LLC or an affiliate since 2001. |
Joseph A. Hanlon (1968) |
Year of Election or Appointment: 2012 Chief Compliance Officer |
| Mr. Hanlon also serves as Chief Compliance Officer of other funds. Mr. Hanlon serves as Compliance Officer of FMR, FMR Co., Inc., Fidelity Investments Money Management, Inc. (FIMM), Fidelity Research and Analysis Company (FRAC), and Fidelity Management & Research (Hong Kong) (2009-present), as Senior Vice President of the Fidelity Asset Management Division (2009-present), and is an employee of Fidelity Investments. Previously, Mr. Hanlon served as Compliance Officer of Fidelity Management & Research (Japan) Inc. (2009-2013), Strategic Advisers, Inc. (2009-2013), and Fidelity Management & Research (U.K.) Inc. (2009-2013). |
Bruce T. Herring (1965) |
Year of Election or Appointment: 2006 Vice President of certain Equity Funds |
| Mr. Herring also serves as Vice President of other funds. He serves as Chief Investment Officer of Fidelity Global Asset Allocation (GAA) (2013-present), Chief Investment Officer and Director of Fidelity Management & Research (U.K.) Inc. (2010-present), Group Chief Investment Officer of FMR, and President of Fidelity Research & Analysis Company (2010-present). Previously, Mr. Herring served as Vice President (2005-2006) and Senior Vice President (2006-2007) of Fidelity Management & Research Company, Vice President of FMR Co., Inc. (2001-2007), and as a portfolio manager for Fidelity U.S. Equity Funds. |
Brian B. Hogan (1964) |
Year of Election or Appointment: 2009 Vice President |
| Mr. Hogan also serves as Vice President of other funds. Mr. Hogan serves as President of FMR's Equity Division (2009-present). Previously, Mr. Hogan served as Senior Vice President, Equity Research of FMR (2006-2009) and as a portfolio manager. |
Chris Maher (1972) |
Year of Election or Appointment: 2013 Assistant Treasurer |
| Mr. Maher serves as Assistant Treasurer of other funds. Mr. Maher is Vice President of Valuation Oversight and is an employee of Fidelity Investments. Previously, Mr. Maher served as Vice President of Asset Management Compliance (2013), Vice President of FMR's Program Management Group (2010-2013), and Vice President of Valuation Oversight (2008-2010). |
Christine Reynolds (1958) |
Year of Election or Appointment: 2008 Chief Financial Officer |
| Ms. Reynolds also serves as Chief Financial Officer of other funds. Ms. Reynolds became President of Fidelity Pricing and Cash Management Services (FPCMS) in August 2008. Ms. Reynolds served as Chief Operating Officer of FPCMS (2007-2008). Previously, Ms. Reynolds served as President, Treasurer, and Anti-Money Laundering officer of the Fidelity funds (2004-2007). |
Kenneth B. Robins (1969) |
Year of Election or Appointment: 2008 President and Treasurer |
| Mr. Robins also serves as an officer of other funds. Mr. Robins serves as Executive Vice President of Fidelity Investments Money Management, Inc. (FIMM) (2013-present) and is an employee of Fidelity Investments (2004-present). Previously, Mr. Robins served in other fund officer roles. |
Gary W. Ryan (1958) |
Year of Election or Appointment: 2005 Assistant Treasurer |
| Mr. Ryan also serves as Assistant Treasurer of other funds. Mr. Ryan is an employee of Fidelity Investments and has served in other fund officer roles. Previously, Mr. Ryan served as Vice President of Fund Reporting in Fidelity Pricing and Cash Management Services (FPCMS) (1999-2005). |
Stephen Sadoski (1971) |
Year of Election or Appointment: 2012 Deputy Treasurer |
| Mr. Sadoski also serves as Deputy Treasurer of other funds. He is an employee of Fidelity Investments (2012-present) and has served in another fund officer role. Prior to joining Fidelity Investments, Mr. Sadoski served as an assistant chief accountant in the Division of Investment Management of the Securities and Exchange Commission (SEC) (2009-2012) and as a senior manager at Deloitte & Touche LLP (1997-2009). |
Stacie M. Smith (1974) |
Year of Election or Appointment: 2013 Deputy Treasurer |
| Ms. Smith also serves as an officer of other funds. She is an employee of Fidelity Investments (2009-present) and has served in other fund officer roles. Prior to joining Fidelity Investments, Ms. Smith served as Senior Audit Manager of Ernst & Young LLP (1996-2009). |
Renee Stagnone (1975) |
Year of Election or Appointment: 2013 Deputy Treasurer |
| Ms. Stagnone also serves as Deputy Treasurer of other funds. Ms. Stagnone is an employee of Fidelity Investments. |
Joseph F. Zambello (1957) |
Year of Election or Appointment: 2011 Deputy Treasurer |
| Mr. Zambello also serves as Deputy Treasurer of other funds. Mr. Zambello is an employee of Fidelity Investments. Previously, Mr. Zambello served as Vice President of FMR's Program Management Group (2009-2011) and Vice President of the Transfer Agent Oversight Group (2005-2009). |
Annual Report
The Board of Trustees of Fidelity International Growth Fund voted to pay on December 9, 2013, to shareholders of record at the opening of business on December 6, 2013, a distribution of $0.009 per share derived from capital gains realized from sales of portfolio securities and a dividend of $0.050 per share from net investment income.
The fund hereby designates as a capital gain dividend with respect to the taxable year ended October 31, 2013, $585,832, or, if subsequently determined to be different, the net capital gain of such year.
The fund designates 12% of the dividends distributed during the fiscal year as qualifying for the dividends-received deduction for corporate shareholders.
The fund designates 100% of the dividends distributed in December 2012 during the fiscal year as amounts which may be taken into account as a dividend for the purposes of the maximum rate under section 1(h)(11) of the Internal Revenue Code.
The amounts per share which represent income derived from sources within, and taxes paid to, foreign countries or possessions of the United States are as follows:
| Pay Date | Income | Taxes |
International Growth Fund | 12/10/2012 | $0.050 | $0.0053 |
The fund will notify shareholders in January 2014 of amounts for use in preparing 2013 income tax returns.
Annual Report
Board Approval of Investment Advisory Contracts and Management Fees
Fidelity International Growth Fund
Each year, the Board of Trustees, including the Independent Trustees (together, the Board), votes on the renewal of the management contract and sub-advisory agreements (together, the Advisory Contracts) for the fund. The Board, assisted by the advice of fund counsel and Independent Trustees' counsel, requests and considers a broad range of information relevant to the renewal of the Advisory Contracts throughout the year.
The Board meets regularly and, at each of its meetings, covers an extensive agenda of topics and materials and considers factors that are relevant to its annual consideration of the renewal of the fund's Advisory Contracts, including the services and support provided to the fund and its shareholders. The Board has established various standing committees, each composed of and chaired by Independent Trustees with varying backgrounds, to which the Board has assigned specific subject matter responsibilities in order to enhance effective decision-making by the Board. The Board, acting directly and through its Committees, requests and receives information concerning the annual consideration of the renewal of the fund's Advisory Contracts. The Board also meets as needed to consider matters specifically related to the Board's annual consideration of the renewal of Advisory Contracts. Members of the Board may also meet with trustees of other Fidelity funds through ad hoc joint committees to discuss certain matters relevant to the Fidelity funds.
At its July 2013 meeting, the Board, including the Independent Trustees, unanimously determined to renew the fund's Advisory Contracts. In reaching its determination, the Board considered all factors it believed relevant, including (i) the nature, extent, and quality of the services to be provided to the fund and its shareholders (including the investment performance of the fund); (ii) the competitiveness of the fund's management fee and total expense ratio relative to peer funds; (iii) the total costs of the services to be provided by and the profits to be realized by Fidelity from its relationship with the fund; (iv) the extent to which economies of scale exist and would be realized as the fund grows; and (v) whether fee levels reflect these economies of scale, if any, for the benefit of fund shareholders.
In considering whether to renew the Advisory Contracts for the fund, the Board reached a determination, with the assistance of fund counsel and Independent Trustees' counsel and through the exercise of its business judgment, that the renewal of the Advisory Contracts was in the best interests of the fund and its shareholders and that the compensation payable under the Advisory Contracts was fair and reasonable. The Board's decision to renew the Advisory Contracts was not based on any single factor, but rather was based on a comprehensive consideration of all the information provided to the Board at its meetings throughout the year. The Board, in reaching its determination to renew the Advisory Contracts, was aware that shareholders in the fund have a broad range of investment choices available to them, including a wide choice among mutual funds offered by Fidelity's competitors, and that the fund's shareholders, who have the opportunity to review and weigh the disclosure provided by the fund in its prospectus and other public disclosures, have chosen to invest in this fund, which is a part of the Fidelity family of funds.
Annual Report
Nature, Extent, and Quality of Services Provided. The Board considered the staffing within the investment adviser, Fidelity Management & Research Company (FMR), and the sub-advisers (together, the Investment Advisers) as it relates to the fund, including the backgrounds of the fund's investment personnel, and also considered the fund's investment objective, strategies, and related investment philosophy. The Independent Trustees also had discussions with senior management of Fidelity's investment operations and investment groups. The Board considered the structure of the portfolio manager compensation program and whether this structure provides appropriate incentives to act in the best interests of the fund.
Resources Dedicated to Investment Management and Support Services. The Board and the Fund Oversight and Research Committees reviewed the general qualifications and capabilities of the Investment Advisers' investment staff, including its size, education, experience, and resources, as well as the Investment Advisers' approach to recruiting, training, managing, and compensating investment personnel. The Board noted that FMR has continued to increase the resources devoted to non-U.S. offices, including expansion of Fidelity's global investment organization. The Board also noted that Fidelity's analysts have extensive resources, tools and capabilities that allow them to conduct sophisticated quantitative and fundamental analysis, as well as credit analysis of issuers, counterparties and guarantors. Further, the Board believes that Fidelity's investment professionals have sufficient access to global information and data so as to provide competitive investment results over time, and that those professionals also have access to sophisticated tools that permit them to assess portfolio construction and risk and performance attribution characteristics continuously, as well as to transmit new information and research conclusions rapidly around the world. Additionally, in its deliberations, the Board considered the Investment Advisers' trading and risk management capabilities and resources, which are an integral part of the investment management process.
Shareholder and Administrative Services. The Board considered (i) the nature, extent, quality, and cost of advisory, administrative, and shareholder services performed by the Investment Advisers and their affiliates under the Advisory Contracts and under separate agreements covering transfer agency, pricing and bookkeeping, and securities lending services for the fund; (ii) the nature and extent of the supervision of third party service providers, principally custodians and subcustodians; and (iii) the resources devoted to, and the record of compliance with, the fund's compliance policies and procedures. The Board also reviewed the allocation of fund brokerage, including allocations to brokers affiliated with the Investment Advisers, the use of brokerage commissions to pay fund expenses, and the use of "soft" commission dollars to pay for research services.
Annual Report
Board Approval of Investment Advisory Contracts and
Management Fees - continued
The Board noted that the growth of fund assets over time across the complex allows Fidelity to reinvest in the development of services designed to enhance the value or convenience of the Fidelity funds as investment vehicles. These services include 24-hour access to account information and market information through telephone representatives and over the Internet, investor education materials and asset allocation tools, and the expanded availability of Fidelity Investor Centers.
Investment in a Large Fund Family. The Board considered the benefits to shareholders of investing in a Fidelity fund, including the benefits of investing in a fund that is part of a large family of funds offering a variety of investment disciplines and providing a large variety of mutual fund investor services. The Board noted that Fidelity had taken, or had made recommendations that resulted in the Fidelity funds taking, a number of actions over the previous year that benefited particular funds, including (i) continuing to dedicate additional resources to investment research and to the support of the senior management team that oversees asset management; (ii) persisting in efforts to enhance Fidelity's global research capabilities; (iii) launching new funds and making other enhancements to meet client needs for global and income-oriented solutions; (iv) continuing to launch dedicated lower cost underlying funds to meet portfolio construction needs related to expanding underlying fund options for Fidelity funds of funds, specifically for the Freedom Fund product lines; (v) rationalizing product lines and gaining increased efficiencies through the mergers of several funds into other funds; (vi) strengthening Fidelity's index fund offerings by reducing investment minimums and adopting or lowering existing expense caps for certain funds and classes; (vii) enhancing Global Asset Allocation product offerings by launching new funds and strategies, including "open architecture" target date funds that utilize affiliated and unaffiliated sub-advisers; (viii) modifying the eligibility criteria for Institutional Class shares of Advisor funds to increase their marketability to a portion of the defined contribution plan market; (ix) creating a new low-cost retirement share class for certain Advisor funds to appeal to large retirement plans; (x) transitioning the management of certain Fidelity commodity funds to Geode Capital Management LLC, a registered commodity pool operator, while retaining administrative responsibilities for the funds; (xi) reorganizing a number of funds; and (xii) taking steps toward establishing a new Fidelity adviser to manage sector-based funds and products.
Investment Performance. The Board considered whether the fund has operated in accordance with its investment objective, as well as its record of compliance with its investment restrictions and its performance history.
The Board took into account discussions with the Investment Advisers about fund investment performance that occur at Board meetings throughout the year. In this regard the Board noted that as part of regularly scheduled fund reviews and other reports to the Board on fund performance, the Board periodically considers annualized return information for the fund, for different time periods, measured against a securities market index ("benchmark index") and a peer group of mutual funds with similar objectives ("peer group"). In its evaluation of fund investment performance, the Board gave particular attention to information indicating changes in performance of certain Fidelity funds for specific time periods and the Investment Advisers' explanations for any overperformance or underperformance.
Annual Report
In addition to reviewing absolute and relative fund performance, the Independent Trustees periodically consider the appropriateness of fund performance metrics in evaluating the results achieved. In general, the Independent Trustees believe that fund performance should be evaluated based on net performance (after fees and expenses) of both the highest performing and lowest performing classes, where applicable, compared to appropriate benchmark indices, over appropriate time periods which may include full market cycles, and compared to peer groups, as applicable, over the same periods, taking into account relevant factors including the following: general market conditions; issuer-specific information; tactical opportunities for investment; and fund cash flows and other factors.
The Independent Trustees recognize that shareholders evaluate performance on a net basis over their own holding periods, for which one-, three-, and five-year periods are used as a proxy. For this reason, the performance information reviewed by the Board also included net cumulative calendar year total return information for the fund and an appropriate benchmark index and peer group for the most recent one-, three-, and five-year periods, as shown below. Returns are shown compared to the 25th percentile (top of box) and 75th percentile (bottom of box) of the peer universe. Returns of the benchmark index are "net MA," i.e., adjusted for tax withholding rates applicable to U.S.-based mutual funds organized as Massachusetts business trusts.
Annual Report
Board Approval of Investment Advisory Contracts and
Management Fees - continued
Fidelity International Growth Fund

The Board also considered that the fund's management fee is subject to upward or downward adjustment depending upon whether, and to what extent, the fund's investment performance for the performance period exceeds, or is exceeded by, a securities index, thus leading to a performance adjustment for the same period. The Board noted that the performance adjustment provides FMR with a strong economic incentive to seek to achieve superior performance for the fund's shareholders and helps to more closely align the interests of FMR and the fund's shareholders.
Based on its review, the Board concluded that the nature, extent, and quality of services provided to the fund under the Advisory Contracts should benefit the fund's shareholders.
Competitiveness of Management Fee and Total Expense Ratio. The Board considered the fund's management fee and total expense ratio compared to "mapped groups" of competitive funds and classes. Fidelity creates "mapped groups" by combining similar Lipper investment objective categories that have comparable management fee characteristics. Combining Lipper investment objective categories aids the Board's management fee and total expense ratio comparisons by broadening the competitive group used for comparison and by reducing the number of universes to which various Fidelity funds are compared.
Management Fee. The Board considered two proprietary management fee comparisons for the 12-month periods shown in the chart below. The group of Lipper funds used by the Board for management fee comparisons is referred to below as the "Total Mapped Group." The Total Mapped Group comparison focuses on a fund's standing in terms of gross management fees before expense reimbursements or caps, and without giving effect to the fund's performance adjustment, relative to the total universe of funds with comparable investment mandates, regardless of whether their management fee structures also are comparable. Funds with comparable investment mandates offer exposure to similar types of securities. Funds with comparable management fee structures have similar management fee contractual arrangements (e.g., flat rate charged for advisory services, all-inclusive fee rate, etc.). "TMG %" represents the percentage of funds in the Total Mapped Group that had management fees that were lower than the fund's. For example, a TMG % of 16% means that 84% of the funds in the Total Mapped Group had higher management fees than the fund. The "Asset-Size Peer Group" (ASPG) comparison focuses on a fund's standing relative to a subset of non-Fidelity funds within the Total Mapped Group that are similar in size and management fee structure. The ASPG represents at least 15% of the funds in the Total Mapped Group with comparable asset size and management fee structures, subject to a minimum of 50 funds (or all funds in the Total Mapped Group if fewer than 50). Additional information, such as the ASPG quartile in which the fund's management fee ranked and the impact of the fund's performance adjustment, is also included in the chart and considered by the Board.
Annual Report
Fidelity International Growth Fund

The Board noted that the fund's management fee ranked below the median of its Total Mapped Group and below the median of its ASPG for 2012. The Board also noted the effect of the fund's positive performance adjustment on the fund's management fee ranking.
Annual Report
Board Approval of Investment Advisory Contracts and
Management Fees - continued
Based on its review, the Board concluded that the fund's management fee is fair and reasonable in light of the services that the fund receives and the other factors considered.
Total Expense Ratio. In its review of each class's total expense ratio, the Board considered the fund's management fee as well as other fund or class expenses, as applicable, such as transfer agent fees, pricing and bookkeeping fees, fund-paid 12b-1 fees, and custodial, legal, and audit fees. The Board also noted the effects of any waivers and reimbursements on fees and expenses, as well as the impact of the fund's performance adjustment. As part of its review, the Board also considered the current and historical total expense ratios of each class of the fund compared to competitive fund median expenses. Each class of the fund is compared to those funds and classes in the Total Mapped Group (used by the Board for management fee comparisons) that have a similar sales load structure.
The Board noted that the total expense ratio of each of Class A and the retail class ranked below its competitive median for 2012 and the total expense ratio of each of Class T, Class B, Class C, and Institutional Class ranked above its competitive median for 2012. The Board considered that, in general, various factors can affect total expense ratios. The Board noted that the total expense ratio of Class T was above the competitive median primarily because of higher 12b-1 fees on Class T. Class T has a higher 12b-1 fee, but a lower front-end sales charge, than traditionally priced front-end sales charge classes. The Board considered that Class T is primarily sold load-waived in the retirement plan market where its 0.50% 12b-1 fee is comparable to competing no-load, higher 12b-1 fee classes designed specifically for retirement plans. The Board noted that the fund offers multiple classes, each of which has a different sales load and 12b-1 fee structure, and that the multiple structures are intended to offer a range of pricing options for the intermediary market. The Board also noted that the total expense ratios of the classes vary primarily by the level of their 12b-1 fees, although differences in transfer agent fees may also cause expenses to vary from class to class.
The Board further considered that FMR contractually agreed to reimburse Class A, Class T, Class B, Class C, Institutional Class, and the retail class of the fund to the extent that total operating expenses (excluding interest, taxes, certain securities lending costs, brokerage commissions, extraordinary expenses, and acquired fund fees and expenses, if any), as a percentage of their respective average net assets, exceed 1.45%, 1.70%, 2.20%, 2.20%, 1.20%, and 1.20% through December 31, 2013.
Fees Charged to Other Fidelity Clients. The Board also considered Fidelity fee structures and other information with respect to clients of FMR and its affiliates, such as other mutual funds advised or subadvised by FMR or its affiliates, pension plan clients, and other institutional clients. The Board noted the findings of the 2013 ad hoc joint committee (created with the board of other Fidelity funds), which reviewed and compared Fidelity's institutional investment advisory business with its business of providing services to the Fidelity funds, including the differences in services provided, fees charged, and costs incurred, as well as competition in their respective marketplaces.
Annual Report
Based on its review of total expense ratios and fees charged to other Fidelity clients, the Board concluded that the total expense ratio of each class of the fund was reasonable, although in some cases above the median of the universe presented for comparison, in light of the services that the fund and its shareholders receive and the other factors considered.
Costs of the Services and Profitability. The Board considered the revenues earned and the expenses incurred by Fidelity in conducting the business of developing, marketing, distributing, managing, administering and servicing the fund and servicing the fund's shareholders. The Board also considered the level of Fidelity's profits in respect of all the Fidelity funds.
On an annual basis, FMR presents to the Board Fidelity's profitability for the fund. Fidelity calculates the profitability for each fund, as well as aggregate profitability for groups of Fidelity funds and all Fidelity funds, using a series of detailed revenue and cost allocation methodologies which originate with the books and records of Fidelity on which Fidelity's audited financial statements are based. The Audit Committee of the Board reviews any significant changes from the prior year's methodologies.
PricewaterhouseCoopers LLP (PwC), independent registered public accounting firm and auditor to Fidelity and certain Fidelity funds, has been engaged annually by the Board as part of the Board's assessment of Fidelity's profitability analysis. PwC's engagement includes the review and assessment of the methodologies used by Fidelity in determining the revenues and expenses attributable to Fidelity's mutual fund business, and completion of agreed-upon procedures surrounding the mathematical accuracy of fund profitability and its conformity to allocation methodologies. After considering PwC's reports issued under the engagement and information provided by Fidelity, the Board concluded that while other allocation methods may also be reasonable, Fidelity's profitability methodologies are reasonable in all material respects.
The Board also reviewed Fidelity's non-fund businesses and fall-out benefits related to the mutual fund business as well as cases where Fidelity's affiliates may benefit from or be related to the fund's business.
The Board considered the costs of the services provided by and the profits realized by Fidelity in connection with the operation of the fund and was satisfied that the profitability was not excessive in the circumstances.
Economies of Scale. The Board considered whether there have been economies of scale in respect of the management of the Fidelity funds, whether the Fidelity funds (including the fund) have appropriately benefited from any such economies of scale, and whether there is potential for realization of any further economies of scale. The Board considered the extent to which the fund will benefit from economies of scale through increased services to the fund, through waivers or reimbursements, or through fee or expense reductions. The Board also noted that in 2009, it and the board of other Fidelity funds created an ad hoc committee (the Economies of Scale Committee) to analyze whether FMR attains economies of scale in respect of the management and servicing of the Fidelity funds, whether the Fidelity funds have appropriately benefited from such economies of scale, and whether there is potential for realization of any further economies of scale.
Annual Report
Board Approval of Investment Advisory Contracts and
Management Fees - continued
The Board recognized that the fund's management contract incorporates a "group fee" structure, which provides for lower group fee rates as total fund assets under FMR's management increase, and for higher group fee rates as total fund assets under FMR's management decrease. FMR calculates the group fee rates based on a tiered asset "breakpoint" schedule that varies based on asset class. The Board considered that the group fee is designed to deliver the benefits of economies of scale to fund shareholders when total Fidelity fund assets increase, even if assets of any particular fund are unchanged or have declined, because some portion of Fidelity's costs are attributable to services provided to all Fidelity funds, and all funds benefit if those costs can be allocated among more assets. The Board concluded that, given the group fee structure, fund shareholders will benefit from lower management fees as assets under FMR's management increase at the fund complex level, regardless of whether Fidelity achieves any such economies of scale.
The Board concluded, taking into account the analysis of the Economies of Scale Committee, that economies of scale, if any, are being appropriately shared between fund shareholders and Fidelity.
Amendment to Description of Group Fee Rate. At its July 2013 meeting, the Board voted to approve an amendment to the fund's management contract to modify the description of the "group fee rate" effective August 1, 2013. The Board noted that under the prior description in the contract, the group fee rate was based on the average net assets of all registered investment companies with which FMR has management contracts. Under the contract's tiered asset breakpoint schedule, the group fee rate is lower as total fund assets under FMR's management increase, and higher as total fund assets under FMR's management decrease. The Board considered that the prior description would have excluded the assets of 64 Fidelity sector funds from the group fee rate calculation once Fidelity SelectCo, LLC, an affiliate of FMR, assumed management responsibilities for those funds. The Board noted that modifying the description of the group fee rate to continue to include the assets of those 64 funds for purposes of determining group fee rate breakpoints would avoid an immediate adverse impact on the group fee rate for any fund.
Annual Report
Additional Information Requested by the Board. In order to develop fully the factual basis for consideration of the Fidelity funds' Advisory Contracts, the Board requested and received additional information on certain topics, including: (i) fund performance trends and Fidelity's long-term strategies for certain funds; (ii) the potential to further rationalize the Fidelity fund lineup with the possibility of achieving savings for the funds and Fidelity; (iii) the methodology with respect to competitive fund data and peer group classifications; (iv) the arrangements with, and performance of, certain sub-advisers on behalf of the Fidelity funds, as well as certain proposed participating affiliate arrangements; (v) the realization of fall-out benefits in certain Fidelity business units; (vi) Fidelity's group fee structures, including the rationale for the individual fee rates of certain categories of funds and the definition of group assets; (vii) trends regarding industry use of performance fee structures and the performance adjustment methodologies applicable to the Fidelity funds; (viii) additional competitive analysis regarding the total expenses for certain classes; and (ix) fund profitability methodology, including Fidelity's cost allocation methodology, and the impact of certain factors on fund profitability results.
Based on its evaluation of all of the conclusions noted above, and after considering all factors it believed relevant, the Board ultimately concluded that the advisory fee structures are fair and reasonable, and that the fund's Advisory Contracts should be renewed.
Annual Report
Investment Adviser
Fidelity Management & Research Company
Boston, MA
Investment Sub-Advisers
FMR Co., Inc.
Fidelity Management & Research
(U.K.) Inc.
Fidelity Management & Research
(Hong Kong) Limited
Fidelity Management & Research
(Japan) Inc.
FIL Investment Advisors
FIL Investments (Japan) Limited
FIL Investment Advisors (U.K.) Ltd.
General Distributor
Fidelity Distributors Corporation
Smithfield, RI
Transfer and Service Agent
Fidelity Investments Institutional
Operations Company, Inc.
Boston, MA
Fidelity Service Company, Inc.
Boston, MA
Custodian
State Street Bank and Trust Company
Quincy, MA
The Fidelity Telephone Connection
Mutual Fund 24-Hour Service
Exchanges/Redemptions
and Account Assistance 1-800-544-6666
Product Information 1-800-544-8888
Retirement Accounts 1-800-544-4774
(8 a.m. - 9 p.m.)
TDD Service 1-800-544-0118
for the deaf and hearing impaired
(9 a.m. - 9 p.m. Eastern time)
Fidelity Automated Service
Telephone (FAST®)
1-800-544-5555
Automated line for quickest service
(Fidelity Investment logo)(registered trademark)
Corporate Headquarters
245 Summer St., Boston, MA 02210
www.fidelity.com
IGF-UANN-1213
1.912349.103
(Fidelity Investment logo)(registered trademark)
Fidelity Advisor®
International Growth
Fund - Class A, Class T, Class B
and Class C
Annual Report
October 31, 2013
(Fidelity Cover Art)
Class A, Class T,
Class B, and Class C are
classes of Fidelity®
International Growth Fund
Contents
Performance | (Click Here) | How the fund has done over time. |
Management's Discussion of Fund Performance | (Click Here) | The Portfolio Manager's review of fund performance and strategy. |
Shareholder Expense Example | (Click Here) | An example of shareholder expenses. |
Investment Changes | (Click Here) | A summary of major shifts in the fund's investments over the past six months. |
Investments | (Click Here) | A complete list of the fund's investments with their market values. |
Financial Statements | (Click Here) | Statements of assets and liabilities, operations, and changes in net assets, as well as financial highlights. |
Notes | (Click Here) | Notes to financial statements. |
Report of Independent Registered Public Accounting Firm | (Click Here) | |
Trustees and Officers | (Click Here) | |
Distributions | (Click Here) | |
Board Approval of Investment Advisory Contracts and Management Fees | (Click Here) | |
To view a fund's proxy voting guidelines and proxy voting record for the 12-month period ended June 30, visit http://www.fidelity.com/proxyvotingresults or visit the Securities and Exchange Commission's (SEC) web site at http://www.sec.gov. You may also call 1-877-208-0098 to request a free copy of the proxy voting guidelines.
Standard & Poor's, S&P and S&P 500 are registered service marks of The McGraw-Hill Companies, Inc. and have been licensed for use by Fidelity Distributors Corporation.
Other third-party marks appearing herein are the property of their respective owners.
All other marks appearing herein are registered or unregistered trademarks or service marks of FMR LLC or an affiliated company. © 2013 FMR LLC. All rights reserved.
Annual Report
This report and the financial statements contained herein are submitted for the general information of the shareholders of the fund. This report is not authorized for distribution to prospective investors in the fund unless preceded or accompanied by an effective prospectus.
A fund files its complete schedule of portfolio holdings with the SEC for the first and third quarters of each fiscal year on Form N-Q. Forms N-Q are available on the SEC's web site at http://www.sec.gov. A fund's Forms N-Q may be reviewed and copied at the SEC's Public Reference Room in Washington, DC. Information regarding the operation of the SEC's Public Reference Room may be obtained by calling 1-800-SEC-0330. For a complete list of a fund's portfolio holdings, view the most recent holdings listing, semiannual report, or annual report on Fidelity's web site at http://www.fidelity.com, http://www.advisor.fidelity.com, or http://www.401k.com, as applicable.
NOT FDIC INSURED • MAY LOSE VALUE • NO BANK GUARANTEE
Neither the fund nor Fidelity Distributors Corporation is a bank.
Annual Report
Average annual total return reflects the change in the value of an investment, assuming reinvestment of the class' distributions from dividend income and capital gains (the profits earned upon the sale of securities that have grown in value, if any) and assuming a constant rate of performance each year. The $10,000 table and the fund's returns do not reflect the deduction of taxes that a shareholder would pay on fund distributions or the redemption of fund shares. During periods of reimbursement by Fidelity, a fund's total return will be greater than it would be had the reimbursement not occurred. How a fund did yesterday is no guarantee of how it will do tomorrow.
Average Annual Total Returns
Periods ended October 31, 2013 | Past 1
year | Past 5
years | Life of
fund A |
Class A (incl. 5.75% sales charge) | 15.15% | 14.26% | 1.03% |
Class T (incl. 3.50% sales charge) | 17.65% | 14.50% | 1.17% |
Class B (incl. contingent deferred sales charge) B | 16.35% | 14.53% | 1.12% |
Class C (incl. contingent deferred sales charge) C | 20.29% | 14.76% | 1.27% |
A From November 1, 2007.
B Class B shares' contingent deferred sales charges included in the past one year, past five years, and life of fund total return figures are 5%, 2%, and 1%, respectively.
C Class C shares' contingent deferred sales charges included in the past one year, past five years, and life of fund total return figures are 1%, 0%, and 0%, respectively.
Annual Report
$10,000 Over Life of Fund
Let's say hypothetically that $10,000 was invested in Fidelity Advisor® International Growth Fund - Class A on November 1, 2007, when the fund started, and the current 5.75% sales charge was paid. The chart shows how the value of your investment would have changed, and also shows how the MSCI® EAFE® Growth Index performed over the same period.
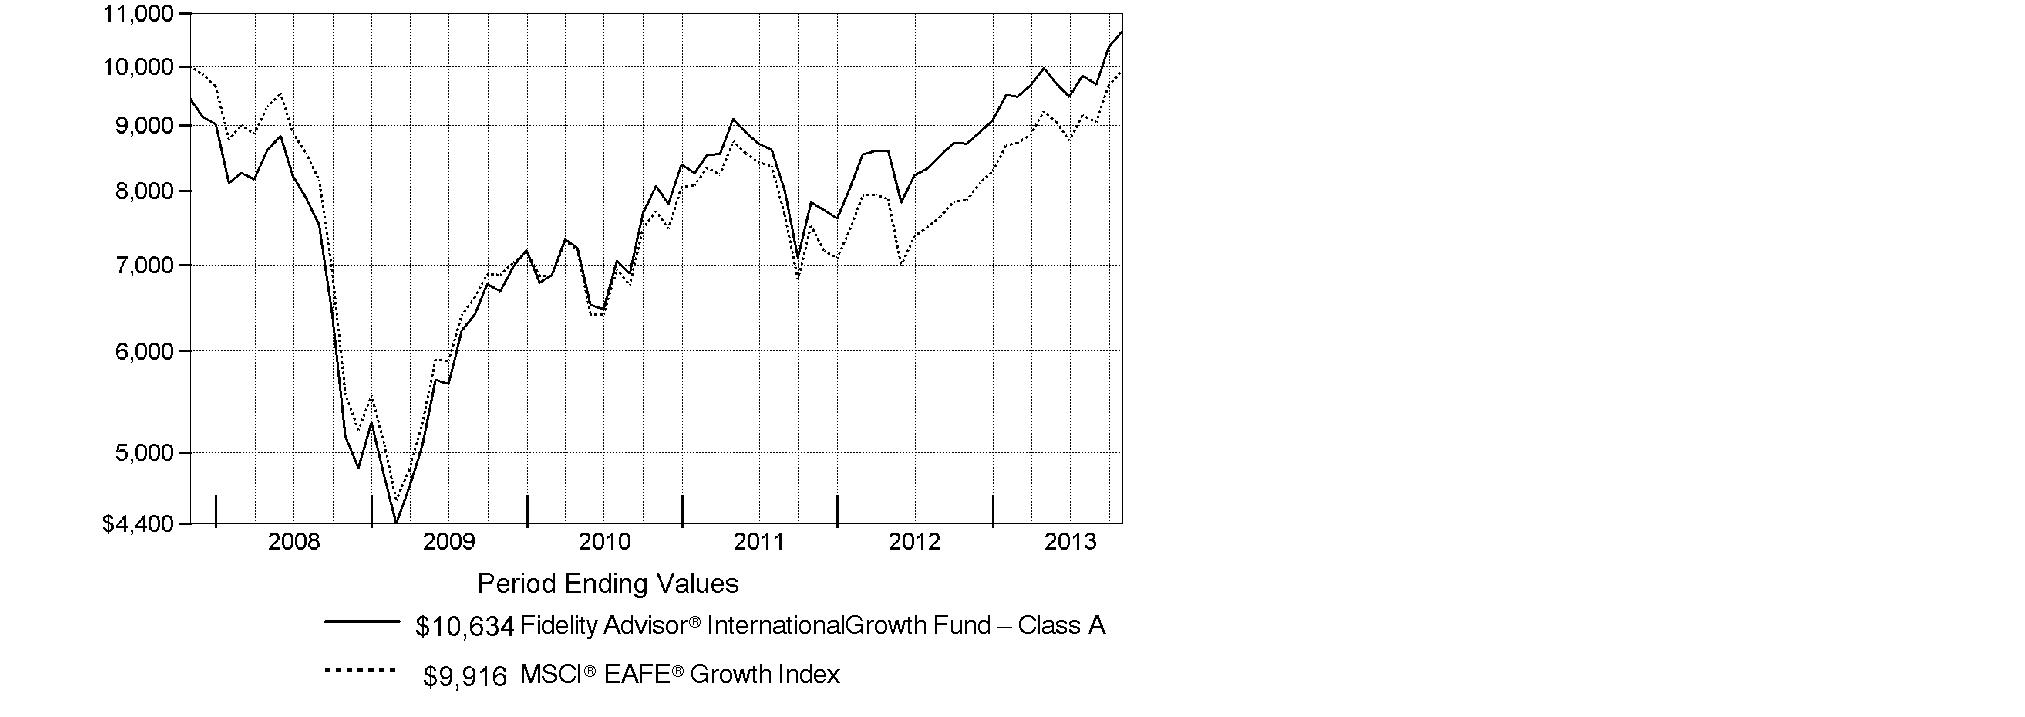
Annual Report
Market Recap: On balance, global equity markets remained upbeat for the 12-month period ending October 31, 2013. The MSCI® ACWI® (All Country World Index) Index gained 23.75% for the period, amid investor preference for higher-risk assets. The period was not without turbulence, however. In the spring and summer, central banks worldwide, especially in the U.S. and China, made clear their intentions to maintain accommodative monetary policies. That stance, combined with modest cyclical improvements around the globe and generally low valuations, underpinned the broad rally in equities. Europe (+32%) shone brightly, with most markets in the region - large and small - registering solid, index-beating gains. Another bright spot was Japan, which, despite a struggling yen and taking a second-half breather, posted a 34% result for the full year. The U.S. - by far the index's biggest constituent - also outperformed the global market with a roughly 28% advance. Meanwhile, Asia-Pacific ex Japan (+14%) lagged, hurt in part by a slowdown in Australia's mining industry as well as currency headwinds. Foreign-exchange and commodity weakness also curbed results in resource-heavy Canada and emerging markets (EM), both of which were up 7%. Country-level EM performance diverged meaningfully for the period, as evidenced by performance in Brazil (-1%), Russia (+12%), India (+1%) and China (+8%).
Comments from Jed Weiss, Portfolio Manager of Fidelity Advisor® International Growth Fund: For the year, the fund's Class A, Class T, Class B and Class C shares returned 22.18%, 21.91%, 21.35% and 21.29%, respectively (excluding sales charges), trailing the 26.07% advance of the MSCI® EAFE® Growth Index. Versus the index, picks in emerging markets were a big detractor. A combination of underweighting Europe and disappointing security selection here also hurt, even as Dutch semiconductor equipment company ASML Holding made an outsized individual contribution. Stock picking in Canada detracted, with out-of-index mining companies Goldcorp and Agnico Eagle Mines suffering from falling gold prices. I ultimately sold both stocks. A moderate cash position curbed performance in an up market. On the positive side, stock picking in Hong Kong was helpful - especially positions in casino gaming companies Sands China and Wynn Macau - as was underweighting poor-performing Australia. Another contributor was the fund's out-of-benchmark holdings in companies headquartered in the U.S. but doing all or most of their business abroad. In strong-performing Japan, the impact was mixed, with a detrimental underweighting but favorable stock picking. In this market, the fund's biggest individual detractor was automaker Toyota Motor. Instead of owning this outperforming benchmark component, we held DENSO, a parts supplier whose largest customer is Toyota and whose strong performance tempered the latter's negative relative impact.
The views expressed above reflect those of the portfolio manager(s) only through the end of the period as stated on the cover of this report and do not necessarily represent the views of Fidelity or any other person in the Fidelity organization. Any such views are subject to change at any time based upon market or other conditions and Fidelity disclaims any responsibility to update such views. These views may not be relied on as investment advice and, because investment decisions for a Fidelity fund are based on numerous factors, may not be relied on as an indication of trading intent on behalf of any Fidelity fund.
Annual Report
Shareholder Expense Example
As a shareholder of the Fund, you incur two types of costs: (1) transaction costs, including sales charges (loads) on purchase payments or redemption proceeds, redemption fees and (2) ongoing costs, including management fees, distribution and/or service (12b-1) fees and other Fund expenses. This Example is intended to help you understand your ongoing costs (in dollars) of investing in the Fund and to compare these costs with the ongoing costs of investing in other mutual funds.
The actual expense Example is based on an investment of $1,000 invested at the beginning of the period and held for the entire period (May 1, 2013 to October 31, 2013) for Class A, Class T, Class B, Class C, International Growth and Institutional Class and for the period (August 13, 2013 to October 31, 2013) for Class Z. The hypothetical expense Example is based on an investment of $1,000 invested for the one-half year period (May 1, 2013 to October 31, 2013).
Actual Expenses
The first line of the accompanying table for each class of the Fund provides information about actual account values and actual expenses. You may use the information in this line, together with the amount you invested, to estimate the expenses that you paid over the period. Simply divide your account value by $1,000.00 (for example, an $8,600 account value divided by $1,000.00 = 8.6), then multiply the result by the number in the first line for a class of the Fund under the heading entitled "Expenses Paid During Period" to estimate the expenses you paid on your account during this period. A small balance maintenance fee of $12.00 that is charged once a year may apply for certain accounts with a value of less than $2,000. This fee is not included in the table below. If it was, the estimate of expenses you paid during the period would be higher, and your ending account value lower, by this amount. In addition, the Fund, as a shareholder in the underlying Fidelity Central Funds, will indirectly bear its pro-rata share of the fees and expenses incurred by the underlying Fidelity Central Funds. These fees and expenses are not included in the Fund's annualized expense ratio used to calculate the expense estimate in the table below.
Hypothetical Example for Comparison Purposes
The second line of the accompanying table for each class of the Fund provides information about hypothetical account values and hypothetical expenses based on a Class' actual expense ratio and an assumed rate of return of 5% per year before expenses, which is not the Class' actual return. The hypothetical account values and expenses may not be used to estimate the actual ending account balance or expenses you paid for the period. You may use this information to compare the ongoing costs of investing in the Fund and other funds. To do so, compare this 5% hypothetical example with the 5% hypothetical examples that appear in the shareholder reports of the other funds. A small balance maintenance fee of $12.00 that is charged once a year may apply for certain accounts with a value of less than $2,000. This fee is not included in the table below. If it was, the estimate of expenses you paid during the period would be higher, and your ending account value lower, by this amount. In addition, the Fund, as a shareholder in the underlying Fidelity Central Funds, will indirectly bear its pro-rata share of the fees and expenses incurred by the underlying Fidelity Central Funds. These fees and expenses are not included in the Fund's annualized expense ratio used to calculate the expense estimate in the table below.
Annual Report
Please note that the expenses shown in the table are meant to highlight your ongoing costs only and do not reflect any transaction costs. Therefore, the second line of the table is useful in comparing ongoing costs only, and will not help you determine the relative total costs of owning different funds. In addition, if these transactional costs were included, your costs would have been higher.
| Annualized
Expense Ratio B | Beginning
Account Value | Ending
Account Value
October 31, 2013 | Expenses Paid
During Period |
Class A | 1.44% | | | |
Actual | | $ 1,000.00 | $ 1,067.30 | $ 7.50 C |
Hypothetical A | | $ 1,000.00 | $ 1,017.95 | $ 7.32 D |
Class T | 1.70% | | | |
Actual | | $ 1,000.00 | $ 1,066.50 | $ 8.85 C |
Hypothetical A | | $ 1,000.00 | $ 1,016.64 | $ 8.64 D |
Class B | 2.18% | | | |
Actual | | $ 1,000.00 | $ 1,063.40 | $ 11.34 C |
Hypothetical A | | $ 1,000.00 | $ 1,014.22 | $ 11.07 D |
Class C | 2.18% | | | |
Actual | | $ 1,000.00 | $ 1,063.70 | $ 11.34 C |
Hypothetical A | | $ 1,000.00 | $ 1,014.22 | $ 11.07 D |
International Growth | 1.11% | | | |
Actual | | $ 1,000.00 | $ 1,069.00 | $ 5.79 C |
Hypothetical A | | $ 1,000.00 | $ 1,019.61 | $ 5.65 D |
Institutional Class | 1.11% | | | |
Actual | | $ 1,000.00 | $ 1,069.00 | $ 5.79 C |
Hypothetical A | | $ 1,000.00 | $ 1,019.61 | $ 5.65 D |
Class Z | .94% | | | |
Actual | | $ 1,000.00 | $ 1,056.50 | $ 2.12 C |
Hypothetical A | | $ 1,000.00 | $ 1,020.47 | $ 4.79 D |
A 5% return per year before expenses
B Annualized expense ratio reflects expenses net of applicable fee waivers.
C Actual expenses are equal to each Class' annualized expense ratio, multiplied by the average account value over the period, multiplied by 184/365 (to reflect the one-half year period) for Class A, Class T, Class B, Class C, International Growth and Institutional Class and multiplied by 80/365 (to reflect the period August 13, 2013 to October 31, 2013) for Class Z. The fees and expenses of the underlying Fidelity Central Funds in which the Fund invests are not included in each Class' annualized expense ratio.
Annual Report
Shareholder Expense Example - continued
D Hypothetical expenses are equal to each Class' annualized expense ratio, multiplied by the average account value over the period, multiplied by 184/365 (to reflect the one-half year period). The fees and expenses of the underlying Fidelity Central Funds in which the Fund invests are not included in each Class' annualized expense ratio.
Annual Report
Investment Changes (Unaudited)
Geographic Diversification (% of fund's net assets) |
As of October 31, 2013 |
 | United Kingdom 17.6% | |
 | Japan 16.6% | |
 | United States of America* 14.9% | |
 | Switzerland 12.4% | |
 | Sweden 5.7% | |
 | Belgium 4.8% | |
 | Germany 4.4% | |
 | Australia 3.2% | |
 | France 3.2% | |
 | Other 17.2% | |

Percentages are based on country or territory of incorporation and are adjusted for the effect of futures contracts, if applicable. |
* Includes Short-Term Investments and Net Other Assets (Liabilities). |
As of April 30, 2013 |
| United Kingdom 18.3% | |
| United States of America* 16.4% | |
| Japan 12.5% | |
| Switzerland 10.7% | |
| Sweden 5.4% | |
| Belgium 4.5% | |
| France 4.0% | |
| Australia 3.8% | |
| Germany 3.1% | |
| Other 21.3% | |

Percentages are based on country or territory of incorporation and are adjusted for the effect of futures contracts, if applicable. |
* Includes Short-Term Investments and Net Other Assets (Liabilities). |
Asset Allocation as of October 31, 2013 |
| % of fund's
net assets | % of fund's net assets
6 months ago |
Stocks | 97.9 | 98.6 |
Short-Term Investments and Net Other Assets (Liabilities) | 2.1 | 1.4 |
Top Ten Stocks as of October 31, 2013 |
| % of fund's
net assets | % of fund's net assets
6 months ago |
Nestle SA (Switzerland, Food Products) | 4.3 | 5.2 |
Anheuser-Busch InBev SA NV (Belgium, Beverages) | 3.5 | 3.6 |
Roche Holding AG (participation certificate) (Switzerland, Pharmaceuticals) | 3.3 | 2.5 |
DENSO Corp. (Japan, Auto Components) | 3.0 | 2.2 |
UBS AG (NY Shares) (Switzerland, Capital Markets) | 2.2 | 1.9 |
Linde AG (Germany, Chemicals) | 2.2 | 2.3 |
Keyence Corp. (Japan, Electronic Equipment & Components) | 2.0 | 1.3 |
Prudential PLC (United Kingdom, Insurance) | 1.9 | 0.0 |
SABMiller PLC (United Kingdom, Beverages) | 1.8 | 2.1 |
Novo Nordisk A/S Series B sponsored ADR (Denmark, Pharmaceuticals) | 1.8 | 2.5 |
| 26.0 | |
Market Sectors as of October 31, 2013 |
| % of fund's
net assets | % of fund's net assets
6 months ago |
Consumer Staples | 19.7 | 24.3 |
Consumer Discretionary | 17.1 | 16.2 |
Financials | 15.0 | 11.3 |
Industrials | 14.3 | 15.1 |
Health Care | 11.9 | 11.2 |
Materials | 7.7 | 10.4 |
Information Technology | 7.5 | 6.7 |
Energy | 3.0 | 3.4 |
Telecommunication Services | 1.7 | 0.0 |
Annual Report
Investments October 31, 2013
Showing Percentage of Net Assets
Common Stocks - 97.9% |
| Shares | | Value |
Australia - 3.2% |
Coca-Cola Amatil Ltd. | 391,434 | | $ 4,772,534 |
CSL Ltd. | 141,073 | | 9,266,793 |
Sydney Airport unit | 643,558 | | 2,548,605 |
Transurban Group unit | 347,528 | | 2,332,109 |
TOTAL AUSTRALIA | | 18,920,041 |
Austria - 1.1% |
Andritz AG | 103,997 | | 6,406,331 |
Bailiwick of Jersey - 0.5% |
Informa PLC | 301,577 | | 2,705,454 |
Belgium - 4.8% |
Anheuser-Busch InBev SA NV | 197,091 | | 20,431,189 |
KBC Groupe SA | 83,619 | | 4,558,378 |
Umicore SA | 64,664 | | 3,084,767 |
TOTAL BELGIUM | | 28,074,334 |
Bermuda - 0.4% |
Lazard Ltd. Class A | 65,192 | | 2,519,671 |
Cayman Islands - 2.6% |
Sands China Ltd. | 1,287,200 | | 9,148,036 |
Wynn Macau Ltd. | 1,650,400 | | 6,332,955 |
TOTAL CAYMAN ISLANDS | | 15,480,991 |
Denmark - 1.8% |
Novo Nordisk A/S Series B sponsored ADR | 62,800 | | 10,466,876 |
Finland - 0.9% |
Nokian Tyres PLC | 100,408 | | 5,080,980 |
France - 3.2% |
Danone SA | 80,652 | | 5,981,177 |
Remy Cointreau SA | 26,787 | | 2,643,375 |
Safran SA | 94,400 | | 6,033,678 |
Sanofi SA | 38,874 | | 4,144,872 |
TOTAL FRANCE | | 18,803,102 |
Germany - 4.4% |
Bayer AG | 65,700 | | 8,165,750 |
Deutsche Bank AG | 51,320 | | 2,480,253 |
Deutsche Bank AG (NY Shares) | 800 | | 38,656 |
Linde AG | 67,141 | | 12,757,939 |
Siemens AG sponsored ADR | 20,000 | | 2,560,200 |
TOTAL GERMANY | | 26,002,798 |
Common Stocks - continued |
| Shares | | Value |
India - 0.3% |
Housing Development Finance Corp. Ltd. | 133,476 | | $ 1,852,016 |
Ireland - 1.7% |
CRH PLC sponsored ADR | 185,366 | | 4,537,760 |
James Hardie Industries PLC: | | | |
CDI | 35,635 | | 368,127 |
sponsored ADR (d) | 96,000 | | 4,999,680 |
TOTAL IRELAND | | 9,905,567 |
Israel - 0.3% |
Azrieli Group | 44,900 | | 1,443,930 |
Italy - 0.9% |
Interpump Group SpA | 160,651 | | 1,788,616 |
Prada SpA | 325,300 | | 3,172,021 |
TOTAL ITALY | | 4,960,637 |
Japan - 16.6% |
AEON Mall Co. Ltd. | 101,810 | | 2,891,503 |
Aozora Bank Ltd. | 861,000 | | 2,502,957 |
Autobacs Seven Co. Ltd. | 60,100 | | 876,287 |
DENSO Corp. | 366,500 | | 17,617,075 |
East Japan Railway Co. | 16,900 | | 1,468,115 |
Fanuc Corp. | 31,700 | | 5,084,924 |
Fast Retailing Co. Ltd. | 18,300 | | 6,159,998 |
Japan Tobacco, Inc. | 166,700 | | 6,031,820 |
Keyence Corp. | 27,462 | | 11,769,939 |
Mitsui Fudosan Co. Ltd. | 267,000 | | 8,844,617 |
Nomura Holdings, Inc. | 187,300 | | 1,383,591 |
Seven Bank Ltd. | 808,300 | | 2,860,781 |
Shinsei Bank Ltd. | 1,457,000 | | 3,411,283 |
SHO-BOND Holdings Co. Ltd. | 65,000 | | 3,043,777 |
SoftBank Corp. | 134,600 | | 10,051,781 |
Unicharm Corp. | 54,500 | | 3,500,476 |
USS Co. Ltd. | 458,700 | | 6,717,431 |
Yamato Kogyo Co. Ltd. | 86,100 | | 3,191,228 |
TOTAL JAPAN | | 97,407,583 |
Mexico - 0.3% |
Fomento Economico Mexicano S.A.B. de CV sponsored ADR | 20,755 | | 1,936,442 |
Common Stocks - continued |
| Shares | | Value |
Netherlands - 1.7% |
ASML Holding NV | 56,278 | | $ 5,326,150 |
ING Groep NV (Certificaten Van Aandelen) (a) | 366,557 | | 4,658,106 |
TOTAL NETHERLANDS | | 9,984,256 |
Portugal - 0.8% |
Jeronimo Martins SGPS SA | 265,152 | | 4,899,738 |
South Africa - 0.5% |
Clicks Group Ltd. | 444,126 | | 2,767,285 |
Spain - 1.9% |
Inditex SA (d) | 59,146 | | 9,716,963 |
Prosegur Compania de Seguridad SA (Reg.) | 236,849 | | 1,408,528 |
TOTAL SPAIN | | 11,125,491 |
Sweden - 5.7% |
ASSA ABLOY AB (B Shares) | 138,561 | | 6,878,816 |
Atlas Copco AB (A Shares) | 240,809 | | 6,681,655 |
Fagerhult AB | 49,496 | | 1,520,004 |
H&M Hennes & Mauritz AB (B Shares) | 182,130 | | 7,869,754 |
Intrum Justitia AB | 91,200 | | 2,427,759 |
SKF AB (B Shares) | 153,717 | | 4,072,995 |
Svenska Handelsbanken AB (A Shares) | 72,940 | | 3,304,787 |
Swedish Match Co. AB | 17,272 | | 569,865 |
TOTAL SWEDEN | | 33,325,635 |
Switzerland - 12.4% |
Credit Suisse Group | 74,858 | | 2,328,680 |
Nestle SA | 345,971 | | 24,973,553 |
Novartis AG | 75,374 | | 5,850,725 |
Roche Holding AG (participation certificate) | 70,213 | | 19,438,481 |
Schindler Holding AG: | | | |
(participation certificate) | 25,471 | | 3,612,848 |
(Reg.) | 6,190 | | 880,046 |
Swatch Group AG (Bearer) | 4,040 | | 2,584,692 |
UBS AG (NY Shares) | 661,761 | | 12,811,693 |
TOTAL SWITZERLAND | | 72,480,718 |
Turkey - 1.5% |
Coca-Cola Icecek A/S | 142,997 | | 4,100,978 |
Tupras Turkiye Petrol Rafinelleri A/S | 100,687 | | 2,284,845 |
Turkiye Garanti Bankasi A/S | 640,500 | | 2,579,647 |
TOTAL TURKEY | | 8,965,470 |
Common Stocks - continued |
| Shares | | Value |
United Kingdom - 17.6% |
Babcock International Group PLC | 196,200 | | $ 4,010,985 |
Barclays PLC sponsored ADR (d) | 225,966 | | 3,798,488 |
BG Group PLC | 466,755 | | 9,530,810 |
BHP Billiton PLC ADR (d) | 71,700 | | 4,419,588 |
GlaxoSmithKline PLC sponsored ADR | 175,500 | | 9,236,565 |
InterContinental Hotel Group PLC ADR (d) | 230,330 | | 6,760,186 |
Johnson Matthey PLC | 116,777 | | 5,624,697 |
Prudential PLC | 539,714 | | 11,037,564 |
Reckitt Benckiser Group PLC (d) | 115,645 | | 8,989,413 |
Rexam PLC | 380,064 | | 3,165,805 |
Rolls-Royce Group PLC | 458,237 | | 8,449,478 |
Rotork PLC | 84,800 | | 3,892,773 |
SABMiller PLC | 202,866 | | 10,584,460 |
Serco Group PLC | 345,718 | | 3,087,586 |
Shaftesbury PLC | 154,533 | | 1,471,803 |
Standard Chartered PLC (United Kingdom) | 334,991 | | 8,054,183 |
Unite Group PLC | 197,400 | | 1,253,384 |
TOTAL UNITED KINGDOM | | 103,367,768 |
United States of America - 12.8% |
Autoliv, Inc. | 67,069 | | 5,984,567 |
Berkshire Hathaway, Inc. Class B (a) | 19,184 | | 2,207,695 |
BorgWarner, Inc. | 58,796 | | 6,063,631 |
Cummins, Inc. | 26,082 | | 3,312,936 |
FMC Technologies, Inc. (a) | 49,152 | | 2,484,634 |
Google, Inc. Class A (a) | 2,863 | | 2,950,551 |
KLA-Tencor Corp. | 42,680 | | 2,799,808 |
Martin Marietta Materials, Inc. | 31,700 | | 3,109,453 |
MasterCard, Inc. Class A | 11,450 | | 8,210,795 |
Mead Johnson Nutrition Co. Class A | 76,944 | | 6,283,247 |
Mohawk Industries, Inc. (a) | 22,400 | | 2,966,208 |
National Oilwell Varco, Inc. | 40,272 | | 3,269,281 |
Philip Morris International, Inc. | 43,808 | | 3,904,169 |
PriceSmart, Inc. | 24,500 | | 2,787,855 |
ResMed, Inc. (d) | 60,700 | | 3,140,618 |
Solera Holdings, Inc. | 46,189 | | 2,596,746 |
SS&C Technologies Holdings, Inc. (a) | 66,200 | | 2,601,660 |
Common Stocks - continued |
| Shares | | Value |
United States of America - continued |
Union Pacific Corp. | 16,300 | | $ 2,467,820 |
Visa, Inc. Class A | 39,975 | | 7,861,883 |
TOTAL UNITED STATES OF AMERICA | | 75,003,557 |
TOTAL COMMON STOCKS (Cost $503,021,258) |
573,886,671
|
Nonconvertible Preferred Stocks - 0.0% |
| | | |
United Kingdom - 0.0% |
Rolls-Royce Group PLC Series C
(Cost $61,249) | 37,731,382 | |
60,499
|
Money Market Funds - 5.2% |
| | | |
Fidelity Cash Central Fund, 0.09% (b) | 14,095,092 | | 14,095,092 |
Fidelity Securities Lending Cash Central Fund, 0.09% (b)(c) | 16,477,575 | | 16,477,575 |
TOTAL MONEY MARKET FUNDS (Cost $30,572,667) |
30,572,667
|
TOTAL INVESTMENT PORTFOLIO - 103.1% (Cost $533,655,174) | | 604,519,837 |
NET OTHER ASSETS (LIABILITIES) - (3.1)% | | (18,241,969) |
NET ASSETS - 100% | $ 586,277,868 |
Legend |
(a) Non-income producing |
(b) Affiliated fund that is generally available only to investment companies and other accounts managed by Fidelity Investments. The rate quoted is the annualized seven-day yield of the fund at period end. A complete unaudited listing of the fund's holdings as of its most recent quarter end is available upon request. In addition, each Fidelity Central Fund's financial statements, which are not covered by the Fund's Report of Independent Registered Public Accounting Firm, are available on the SEC's website or upon request. |
(c) Investment made with cash collateral received from securities on loan. |
(d) Security or a portion of the security is on loan at period end. |
Affiliated Central Funds |
Information regarding fiscal year to date income earned by the Fund from investments in Fidelity Central Funds is as follows: |
Fund | Income earned |
Fidelity Cash Central Fund | $ 13,543 |
Fidelity Securities Lending Cash Central Fund | 209,783 |
Total | $ 223,326 |
Other Information |
Categorizations in the Schedule of Investments are based on country or territory of incorporation. |
The following is a summary of the inputs used, as of October 31, 2013, involving the Fund's assets and liabilities carried at fair value. The inputs or methodology used for valuing securities may not be an indication of the risk associated with investing in those securities. For more information on valuation inputs, and their aggregation into the levels used in the tables below, please refer to the Investment Valuation section in the accompanying Notes to Financial Statements. |
Valuation Inputs at Reporting Date: |
Description | Total | Level 1 | Level 2 | Level 3 |
Investments in Securities: | | | | |
Equities: | | | | |
Consumer Discretionary | $ 99,756,238 | $ 68,385,447 | $ 31,370,791 | $ - |
Consumer Staples | 115,157,576 | 60,220,538 | 54,937,038 | - |
Energy | 17,569,570 | 17,569,570 | - | - |
Financials | 88,293,666 | 45,894,331 | 42,399,335 | - |
Health Care | 69,710,680 | 59,715,083 | 9,995,597 | - |
Industrials | 84,031,083 | 74,434,267 | 9,596,816 | - |
Information Technology | 44,117,532 | 32,347,593 | 11,769,939 | - |
Materials | 45,259,044 | 42,067,816 | 3,191,228 | - |
Telecommunication Services | 10,051,781 | - | 10,051,781 | - |
Money Market Funds | 30,572,667 | 30,572,667 | - | - |
Total Investments in Securities: | $ 604,519,837 | $ 431,207,312 | $ 173,312,525 | $ - |
The following is a summary of transfers between Level 1 and Level 2 for the period ended October 31, 2013. Transfers are assumed to have occurred at the beginning of the period, and are primarily attributable to the valuation techniques used for foreign equity securities, as discussed in the accompanying Notes to Financial Statements: |
Transfers | Total |
Level 1 to Level 2 | $ 27,145,883 |
Level 2 to Level 1 | $ 0 |
See accompanying notes which are an integral part of the financial statements.
Annual Report
Statement of Assets and Liabilities
| October 31, 2013 |
| | |
Assets | | |
Investment in securities, at value (including securities loaned of $15,812,983) - See accompanying schedule: Unaffiliated issuers (cost $503,082,507) | $ 573,947,170 | |
Fidelity Central Funds (cost $30,572,667) | 30,572,667 | |
Total Investments (cost $533,655,174) | | $ 604,519,837 |
Cash | | 7,981 |
Receivable for investments sold | | 2,362,573 |
Receivable for fund shares sold | | 3,194,486 |
Dividends receivable | | 767,973 |
Distributions receivable from Fidelity Central Funds | | 6,838 |
Prepaid expenses | | 1,720 |
Other receivables | | 13,074 |
Total assets | | 610,874,482 |
| | |
Liabilities | | |
Payable for investments purchased | $ 7,134,028 | |
Payable for fund shares redeemed | 414,036 | |
Accrued management fee | 337,239 | |
Distribution and service plan fees payable | 38,773 | |
Other affiliated payables | 125,190 | |
Other payables and accrued expenses | 69,773 | |
Collateral on securities loaned, at value | 16,477,575 | |
Total liabilities | | 24,596,614 |
| | |
Net Assets | | $ 586,277,868 |
Net Assets consist of: | | |
Paid in capital | | $ 512,728,833 |
Undistributed net investment income | | 2,476,993 |
Accumulated undistributed net realized gain (loss) on investments and foreign currency transactions | | 210,451 |
Net unrealized appreciation (depreciation) on investments and assets and liabilities in foreign currencies | | 70,861,591 |
Net Assets | | $ 586,277,868 |
See accompanying notes which are an integral part of the financial statements.
Annual Report
Statement of Assets and Liabilities - continued
| October 31, 2013 |
| | |
Calculation of Maximum Offering Price Class A:
Net Asset Value and redemption price per share ($74,594,798 ÷ 6,919,905 shares) | | $ 10.78 |
| | |
Maximum offering price per share (100/94.25 of $10.78) | | $ 11.44 |
Class T:
Net Asset Value and redemption price per share ($23,117,780 ÷ 2,150,794 shares) | | $ 10.75 |
| | |
Maximum offering price per share (100/96.50 of $10.75) | | $ 11.14 |
Class B:
Net Asset Value and offering price per share ($1,578,643 ÷ 147,175 shares)A | | $ 10.73 |
| | |
Class C:
Net Asset Value and offering price per share ($17,196,098 ÷ 1,608,592 shares)A | | $ 10.69 |
| | |
| | |
International Growth:
Net Asset Value, offering price and redemption price per share ($430,913,552 ÷ 39,735,803 shares) | | $ 10.84 |
| | |
Institutional Class:
Net Asset Value, offering price and redemption price per share ($38,771,323 ÷ 3,577,332 shares) | | $ 10.84 |
| | |
Class Z:
Net Asset Value, offering price and redemption price per share ($105,674 ÷ 9,747 shares) | | $ 10.84 |
A Redemption price per share is equal to net asset value less any applicable contingent deferred sales charge.
See accompanying notes which are an integral part of the financial statements.
Annual Report
Financial Statements - continued
Statement of Operations
| Year ended October 31, 2013 |
| | |
Investment Income | | |
Dividends | | $ 8,033,314 |
Interest | | 4 |
Income from Fidelity Central Funds | | 223,326 |
Income before foreign taxes withheld | | 8,256,644 |
Less foreign taxes withheld | | (549,023) |
Total income | | 7,707,621 |
| | |
Expenses | | |
Management fee
Basic fee | $ 2,422,146 | |
Performance adjustment | 192,757 | |
Transfer agent fees | 865,734 | |
Distribution and service plan fees | 312,494 | |
Accounting and security lending fees | 180,016 | |
Custodian fees and expenses | 82,662 | |
Independent trustees' compensation | 1,736 | |
Registration fees | 145,304 | |
Audit | 70,606 | |
Legal | 656 | |
Miscellaneous | 1,779 | |
Total expenses before reductions | 4,275,890 | |
Expense reductions | (61,595) | 4,214,295 |
Net investment income (loss) | | 3,493,326 |
Realized and Unrealized Gain (Loss) Net realized gain (loss) on: | | |
Investment securities: | | |
Unaffiliated issuers | 6,727,492 | |
Foreign currency transactions | 107,488 | |
Futures contracts | (517,867) | |
Total net realized gain (loss) | | 6,317,113 |
Change in net unrealized appreciation (depreciation) on: Investment securities | 60,865,585 | |
Assets and liabilities in foreign currencies | 4,304 | |
Total change in net unrealized appreciation (depreciation) | | 60,869,889 |
Net gain (loss) | | 67,187,002 |
Net increase (decrease) in net assets resulting from operations | | $ 70,680,328 |
See accompanying notes which are an integral part of the financial statements.
Annual Report
Statement of Changes in Net Assets
| Year ended
October 31,
2013 | Year ended
October 31,
2012 |
Increase (Decrease) in Net Assets | | |
Operations | | |
Net investment income (loss) | $ 3,493,326 | $ 1,377,708 |
Net realized gain (loss) | 6,317,113 | (833,212) |
Change in net unrealized appreciation (depreciation) | 60,869,889 | 11,226,981 |
Net increase (decrease) in net assets resulting
from operations | 70,680,328 | 11,771,477 |
Distributions to shareholders from net investment income | (2,081,336) | (594,738) |
Distributions to shareholders from net realized gain | (113,769) | (48,645) |
Total distributions | (2,195,105) | (643,383) |
Share transactions - net increase (decrease) | 324,915,158 | 115,271,822 |
Redemption fees | 31,216 | 5,972 |
Total increase (decrease) in net assets | 393,431,597 | 126,405,888 |
| | |
Net Assets | | |
Beginning of period | 192,846,271 | 66,440,383 |
End of period (including undistributed net investment income of $2,476,993 and undistributed net investment income of $1,374,430, respectively) | $ 586,277,868 | $ 192,846,271 |
See accompanying notes which are an integral part of the financial statements.
Annual Report
Financial Highlights - Class A
Years ended October 31, | 2013 | 2012 | 2011 | 2010 | 2009 |
Selected Per-Share Data | | | | | |
Net asset value, beginning of period | $ 8.91 | $ 8.09 | $ 8.38 | $ 7.01 | $ 5.46 |
Income from Investment Operations | | | | | |
Net investment income (loss) C | .08 | .08 | .08 | .05 | .05 |
Net realized and unrealized gain (loss) | 1.88 | .81 | (.31) | 1.39 | 1.55 |
Total from investment operations | 1.96 | .89 | (.23) | 1.44 | 1.60 |
Distributions from net investment income | (.08) | (.06) | (.05) | (.05) | (.05) |
Distributions from net realized gain | (.01) | (.01) | (.01) | (.03) | - |
Total distributions | (.09) | (.07) | (.06) | (.07) H | (.05) |
Redemption fees added to paid in capital C, G | - | - | - | - | - |
Net asset value, end of period | $ 10.78 | $ 8.91 | $ 8.09 | $ 8.38 | $ 7.01 |
Total Return A, B | 22.18% | 11.10% | (2.76)% | 20.68% | 29.72% |
Ratios to Average Net Assets D, F | | | | | |
Expenses before reductions | 1.44% | 1.58% | 1.77% | 2.13% | 2.46% |
Expenses net of fee waivers, if any | 1.43% | 1.45% | 1.45% | 1.50% | 1.50% |
Expenses net of all reductions | 1.42% | 1.44% | 1.43% | 1.48% | 1.47% |
Net investment income (loss) | .80% | .99% | .92% | .74% | .85% |
Supplemental Data | | | | | |
Net assets, end of period (000 omitted) | $ 74,595 | $ 21,874 | $ 6,352 | $ 3,084 | $ 1,452 |
Portfolio turnover rate E | 32% | 32% | 68% | 87% | 116% |
A Total returns would have been lower if certain expenses had not been reduced during the applicable periods shown.
B Total returns do not include the effect of the sales charges.
C Calculated based on average shares outstanding during the period.
D Fees and expenses of any underlying Fidelity Central Funds are not included in the Fund's expense ratio. The Fund indirectly bears its proportionate share of the expenses of any underlying Fidelity Central Funds.
E Amount does not include the portfolio activity of any underlying Fidelity Central Funds.
F Expense ratios reflect operating expenses of the class. Expenses before reductions do not reflect amounts reimbursed by the investment adviser or reductions from brokerage service arrangements or reductions from other expense offset arrangements and do not represent the amount paid by the class during periods when reimbursements or reductions occur. Expenses net of fee waivers reflect expenses after reimbursement by the investment adviser but prior to reductions from brokerage service arrangements or other expense offset arrangements. Expenses net of all reductions represent the net expenses paid by the class.
G Amount represents less than $.01 per share.
H Total distributions of $.07 per share is comprised of distributions from net investment income of $.046 and distributions from net realized gain of $.025 per share.
See accompanying notes which are an integral part of the financial statements.
Annual Report
Financial Highlights - Class T
Years ended October 31, | 2013 | 2012 | 2011 | 2010 | 2009 |
Selected Per-Share Data | | | | | |
Net asset value, beginning of period | $ 8.89 | $ 8.08 | $ 8.38 | $ 7.00 | $ 5.45 |
Income from Investment Operations | | | | | |
Net investment income (loss) C | .05 | .06 | .06 | .04 | .03 |
Net realized and unrealized gain (loss) | 1.88 | .81 | (.31) | 1.39 | 1.55 |
Total from investment operations | 1.93 | .87 | (.25) | 1.43 | 1.58 |
Distributions from net investment income | (.07) | (.05) | (.04) | (.02) | (.03) |
Distributions from net realized gain | (.01) | (.01) | (.01) | (.03) | - |
Total distributions | (.07) H | (.06) | (.05) | (.05) | (.03) |
Redemption fees added to paid in capital C, G | - | - | - | - | - |
Net asset value, end of period | $ 10.75 | $ 8.89 | $ 8.08 | $ 8.38 | $ 7.00 |
Total Return A, B | 21.91% | 10.82% | (3.03)% | 20.47% | 29.22% |
Ratios to Average Net Assets D, F | | | | | |
Expenses before reductions | 1.69% | 1.85% | 2.03% | 2.41% | 2.67% |
Expenses net of fee waivers, if any | 1.69% | 1.70% | 1.70% | 1.75% | 1.75% |
Expenses net of all reductions | 1.68% | 1.69% | 1.68% | 1.73% | 1.73% |
Net investment income (loss) | .54% | .74% | .67% | .49% | .59% |
Supplemental Data | | | | | |
Net assets, end of period (000 omitted) | $ 23,118 | $ 10,690 | $ 2,917 | $ 1,034 | $ 532 |
Portfolio turnover rate E | 32% | 32% | 68% | 87% | 116% |
A Total returns would have been lower if certain expenses had not been reduced during the applicable periods shown.
B Total returns do not include the effect of the sales charges.
C Calculated based on average shares outstanding during the period.
D Fees and expenses of any underlying Fidelity Central Funds are not included in the Fund's expense ratio. The Fund indirectly bears its proportionate share of the expenses of any underlying Fidelity Central Funds.
E Amount does not include the portfolio activity of any underlying Fidelity Central Funds.
F Expense ratios reflect operating expenses of the class. Expenses before reductions do not reflect amounts reimbursed by the investment adviser or reductions from brokerage service arrangements or reductions from other expense offset arrangements and do not represent the amount paid by the class during periods when reimbursements or reductions occur. Expenses net of fee waivers reflect expenses after reimbursement by the investment adviser but prior to reductions from brokerage service arrangements or other expense offset arrangements. Expenses net of all reductions represent the net expenses paid by the class.
G Amount represents less than $.01 per share.
H Total distributions of $.07 per share is comprised of distributions from net investment income of $.069 and distributions from net realized gain of $.005 per share.
See accompanying notes which are an integral part of the financial statements.
Annual Report
Financial Highlights - Class B
Years ended October 31, | 2013 | 2012 | 2011 | 2010 | 2009 |
Selected Per-Share Data | | | | | |
Net asset value, beginning of period | $ 8.88 | $ 8.06 | $ 8.36 | $ 6.98 | $ 5.42 |
Income from Investment Operations | | | | | |
Net investment income (loss) C | - G | .02 | .01 | - G | .01 |
Net realized and unrealized gain (loss) | 1.89 | .80 | (.30) | 1.38 | 1.55 |
Total from investment operations | 1.89 | .82 | (.29) | 1.38 | 1.56 |
Distributions from net investment income | (.03) | - | (.01) | - | - |
Distributions from net realized gain | (.01) | - | - G | - | - |
Total distributions | (.04) | - | (.01) | - | - |
Redemption fees added to paid in capital C, G | - | - | - | - | - |
Net asset value, end of period | $ 10.73 | $ 8.88 | $ 8.06 | $ 8.36 | $ 6.98 |
Total Return A, B | 21.35% | 10.17% | (3.47)% | 19.77% | 28.78% |
Ratios to Average Net Assets D, F | | | | | |
Expenses before reductions | 2.19% | 2.35% | 2.55% | 2.87% | 3.17% |
Expenses net of fee waivers, if any | 2.18% | 2.20% | 2.20% | 2.25% | 2.25% |
Expenses net of all reductions | 2.17% | 2.19% | 2.18% | 2.23% | 2.23% |
Net investment income (loss) | .05% | .24% | .17% | (.01)% | .09% |
Supplemental Data | | | | | |
Net assets, end of period (000 omitted) | $ 1,579 | $ 1,116 | $ 473 | $ 581 | $ 328 |
Portfolio turnover rate E | 32% | 32% | 68% | 87% | 116% |
A Total returns would have been lower if certain expenses had not been reduced during the applicable periods shown.
B Total returns do not include the effect of the contingent deferred sales charge.
C Calculated based on average shares outstanding during the period.
D Fees and expenses of any underlying Fidelity Central Funds are not included in the Fund's expense ratio. The Fund indirectly bears its proportionate share of the expenses of any underlying Fidelity Central Funds.
E Amount does not include the portfolio activity of any underlying Fidelity Central Funds.
F Expense ratios reflect operating expenses of the class. Expenses before reductions do not reflect amounts reimbursed by the investment adviser or reductions from brokerage service arrangements or reductions from other expense offset arrangements and do not represent the amount paid by the class during periods when reimbursements or reductions occur. Expenses net of fee waivers reflect expenses after reimbursement by the investment adviser but prior to reductions from brokerage service arrangements or other expense offset arrangements. Expenses net of all reductions represent the net expenses paid by the class.
G Amount represents less than $.01 per share.
See accompanying notes which are an integral part of the financial statements.
Annual Report
Financial Highlights - Class C
Years ended October 31, | 2013 | 2012 | 2011 | 2010 | 2009 |
Selected Per-Share Data | | | | | |
Net asset value, beginning of period | $ 8.84 | $ 8.03 | $ 8.34 | $ 6.98 | $ 5.42 |
Income from Investment Operations | | | | | |
Net investment income (loss) C | .01 | .02 | .01 | - G | .01 |
Net realized and unrealized gain (loss) | 1.87 | .80 | (.31) | 1.38 | 1.55 |
Total from investment operations | 1.88 | .82 | (.30) | 1.38 | 1.56 |
Distributions from net investment income | (.02) | (.01) | (.01) | - | - |
Distributions from net realized gain | (.01) | (.01) | (.01) | (.02) | - |
Total distributions | (.03) | (.01) I | (.01) H | (.02) | - |
Redemption fees added to paid in capital C, G | - | - | - | - | - |
Net asset value, end of period | $ 10.69 | $ 8.84 | $ 8.03 | $ 8.34 | $ 6.98 |
Total Return A, B | 21.29% | 10.27% | (3.57)% | 19.82% | 28.78% |
Ratios to Average Net Assets D, F | | | | | |
Expenses before reductions | 2.19% | 2.33% | 2.52% | 2.89% | 3.21% |
Expenses net of fee waivers, if any | 2.18% | 2.20% | 2.20% | 2.25% | 2.25% |
Expenses net of all reductions | 2.17% | 2.19% | 2.18% | 2.24% | 2.23% |
Net investment income (loss) | .05% | .24% | .17% | (.01)% | .09% |
Supplemental Data | | | | | |
Net assets, end of period (000 omitted) | $ 17,196 | $ 5,648 | $ 2,767 | $ 1,261 | $ 780 |
Portfolio turnover rate E | 32% | 32% | 68% | 87% | 116% |
A Total returns would have been lower if certain expenses had not been reduced during the applicable periods shown.
B Total returns do not include the effect of the contingent deferred sales charge.
C Calculated based on average shares outstanding during the period.
D Fees and expenses of any underlying Fidelity Central Funds are not included in the Fund's expense ratio. The Fund indirectly bears its proportionate share of the expenses of any underlying Fidelity Central Funds.
E Amount does not include the portfolio activity of any underlying Fidelity Central Funds.
F Expense ratios reflect operating expenses of the class. Expenses before reductions do not reflect amounts reimbursed by the investment adviser or reductions from brokerage service arrangements or reductions from other expense offset arrangements and do not represent the amount paid by the class during periods when reimbursements or reductions occur. Expenses net of fee waivers reflect expenses after reimbursement by the investment adviser but prior to reductions from brokerage service arrangements or other expense offset arrangements. Expenses net of all reductions represent the net expenses paid by the class.
G Amount represents less than $.01 per share.
H Total distributions of $.01 per share is comprised of distributions from net investment income of $.008 and distributions from net realized gain of $.005 per share.
I Total distributions of $.01 per share is comprised of distributions from net investment income of $.007 and distributions from net realized gain of $.006 per share.
See accompanying notes which are an integral part of the financial statements.
Annual Report
Financial Highlights - International Growth
Years ended October 31, | 2013 | 2012 | 2011 | 2010 | 2009 |
Selected Per-Share Data | | | | | |
Net asset value, beginning of period | $ 8.95 | $ 8.12 | $ 8.40 | $ 7.02 | $ 5.48 |
Income from Investment Operations | | | | | |
Net investment income (loss) B | .11 | .11 | .10 | .07 | .06 |
Net realized and unrealized gain (loss) | 1.88 | .81 | (.30) | 1.39 | 1.54 |
Total from investment operations | 1.99 | .92 | (.20) | 1.46 | 1.60 |
Distributions from net investment income | (.10) | (.08) | (.07) | (.06) | (.06) |
Distributions from net realized gain | (.01) | (.01) | (.01) | (.03) | - |
Total distributions | (.10) H | (.09) | (.08) | (.08) G | (.06) |
Redemption fees added to paid in capital B, F | - | - | - | - | - |
Net asset value, end of period | $ 10.84 | $ 8.95 | $ 8.12 | $ 8.40 | $ 7.02 |
Total Return A | 22.48% | 11.41% | (2.47)% | 20.97% | 29.77% |
Ratios to Average Net Assets C, E | | | | | |
Expenses before reductions | 1.13% | 1.28% | 1.52% | 1.89% | 2.19% |
Expenses net of fee waivers, if any | 1.13% | 1.20% | 1.20% | 1.25% | 1.25% |
Expenses net of all reductions | 1.11% | 1.19% | 1.18% | 1.23% | 1.23% |
Net investment income (loss) | 1.11% | 1.24% | 1.17% | .99% | 1.09% |
Supplemental Data | | | | | |
Net assets, end of period (000 omitted) | $ 430,914 | $ 149,526 | $ 53,437 | $ 28,454 | $ 18,254 |
Portfolio turnover rate D | 32% | 32% | 68% | 87% | 116% |
A Total returns would have been lower if certain expenses had not been reduced during the applicable periods shown.
B Calculated based on average shares outstanding during the period.
C Fees and expenses of any underlying Fidelity Central Funds are not included in the Fund's expense ratio. The Fund indirectly bears its proportionate share of the expenses of any underlying Fidelity Central Funds.
D Amount does not include the portfolio activity of any underlying Fidelity Central Funds.
E Expense ratios reflect operating expenses of the class. Expenses before reductions do not reflect amounts reimbursed by the investment adviser or reductions from brokerage service arrangements or reductions from other expense offset arrangements and do not represent the amount paid by the class during periods when reimbursements or reductions occur. Expenses net of fee waivers reflect expenses after reimbursement by the investment adviser but prior to reductions from brokerage service arrangements or other expense offset arrangements. Expenses net of all reductions represent the net expenses paid by the class.
F Amount represents less than $.01 per share.
G Total distributions of $.08 per share is comprised of distributions from net investment income of $.057 and distributions from net realized gain of $.025 per share.
H Total distributions of $.10 per share is comprised of distributions from net investment income of $.097 and distributions from net realized gain of $.005 per share.
See accompanying notes which are an integral part of the financial statements.
Annual Report
Financial Highlights - Institutional Class
Years ended October 31, | 2013 | 2012 | 2011 | 2010 | 2009 |
Selected Per-Share Data | | | | | |
Net asset value, beginning of period | $ 8.94 | $ 8.12 | $ 8.40 | $ 7.02 | $ 5.48 |
Income from Investment Operations | | | | | |
Net investment income (loss) B | .11 | .10 | .10 | .07 | .06 |
Net realized and unrealized gain (loss) | 1.90 | .81 | (.30) | 1.39 | 1.54 |
Total from investment operations | 2.01 | .91 | (.20) | 1.46 | 1.60 |
Distributions from net investment income | (.10) | (.08) | (.07) | (.06) | (.06) |
Distributions from net realized gain | (.01) | (.01) | (.01) | (.03) | - |
Total distributions | (.11) | (.09) | (.08) | (.08) G | (.06) |
Redemption fees added to paid in capital B, F | - | - | - | - | - |
Net asset value, end of period | $ 10.84 | $ 8.94 | $ 8.12 | $ 8.40 | $ 7.02 |
Total Return A | 22.66% | 11.28% | (2.47)% | 20.97% | 29.77% |
Ratios to Average Net Assets C, E | | | | | |
Expenses before reductions | 1.11% | 1.27% | 1.50% | 1.92% | 2.01% |
Expenses net of fee waivers, if any | 1.11% | 1.20% | 1.20% | 1.25% | 1.25% |
Expenses net of all reductions | 1.09% | 1.19% | 1.18% | 1.23% | 1.23% |
Net investment income (loss) | 1.13% | 1.24% | 1.17% | .99% | 1.09% |
Supplemental Data | | | | | |
Net assets, end of period (000 omitted) | $ 38,771 | $ 3,992 | $ 493 | $ 113 | $ 36 |
Portfolio turnover rate D | 32% | 32% | 68% | 87% | 116% |
A Total returns would have been lower if certain expenses had not been reduced during the applicable periods shown.
B Calculated based on average shares outstanding during the period.
C Fees and expenses of any underlying Fidelity Central Funds are not included in the Fund's expense ratio. The Fund indirectly bears its proportionate share of the expenses of any underlying Fidelity Central Funds.
D Amount does not include the portfolio activity of any underlying Fidelity Central Funds.
E Expense ratios reflect operating expenses of the class. Expenses before reductions do not reflect amounts reimbursed by the investment adviser or reductions from brokerage service arrangements or reductions from other expense offset arrangements and do not represent the amount paid by the class during periods when reimbursements or reductions occur. Expenses net of fee waivers reflect expenses after reimbursement by the investment adviser but prior to reductions from brokerage service arrangements or other expense offset arrangements. Expenses net of all reductions represent the net expenses paid by the class.
F Amount represents less than $.01 per share.
G Total distributions of $.08 per share is comprised of distributions from net investment income of $.057 and distributions from net realized gain of $.025 per share.
See accompanying notes which are an integral part of the financial statements.
Annual Report
Financial Highlights - Class Z
Year ended October 31, | 2013 G |
Selected Per-Share Data | |
Net asset value, beginning of period | $ 10.26 |
Income from Investment Operations | |
Net investment income (loss) D | .02 |
Net realized and unrealized gain (loss) | .56 |
Total from investment operations | .58 |
Redemption fees added to paid in capital D, I | - |
Net asset value, end of period | $ 10.84 |
Total Return B, C | 5.65% |
Ratios to Average Net Assets E, H | |
Expenses before reductions | .94% A |
Expenses net of fee waivers, if any | .94% A |
Expenses net of all reductions | .93% A |
Net investment income (loss) | .65% A |
Supplemental Data | |
Net assets, end of period (000 omitted) | $ 106 |
Portfolio turnover rate F | 32% |
A Annualized
B Total returns for periods of less than one year are not annualized.
C Total returns would have been lower if certain expenses had not been reduced during the applicable periods shown.
D Calculated based on average shares outstanding during the period.
E Fees and expenses of any underlying Fidelity Central Funds are not included in the Fund's expense ratio. The Fund indirectly bears its proportionate share of the expenses of any underlying Fidelity Central Funds.
F Amount does not include the portfolio activity of any underlying Fidelity Central Funds.
G For the period August 13, 2013 (commencement of sale of shares) to October 31, 2013.
H Expense ratios reflect operating expenses of the class. Expenses before reductions do not reflect amounts reimbursed by the investment adviser or reductions from brokerage service arrangements or reductions from other expense offset arrangements and do not represent the amount paid by the class during periods when reimbursements or reductions occur. Expense ratios before reductions for start-up periods may not be representative of longer-term operating periods. Expenses net of fee waivers reflect expenses after reimbursement by the investment adviser but prior to reductions from brokerage service arrangements or other expense offset arrangements. Expenses net of all reductions represent the net expenses paid by the class.
I Amount represents less than $.01 per share.
See accompanying notes which are an integral part of the financial statements.
Annual Report
Notes to Financial Statements
For the period ended October 31, 2013
1. Organization.
Fidelity International Growth Fund (the Fund) is a fund of Fidelity Investment Trust (the Trust) and is authorized to issue an unlimited number of shares. The Trust is registered under the Investment Company Act of 1940, as amended (the 1940 Act), as an open-end management investment company organized as a Massachusetts business trust. The Fund commenced sale of Class Z shares on August 13, 2013. The Fund offers Class A, Class T, Class C, International Growth, Institutional Class and Class Z shares, each of which, along with Class B shares, has equal rights as to assets and voting privileges. Class B shares are closed to new accounts and additional purchases, except for exchanges and reinvestments. Each class has exclusive voting rights with respect to matters that affect that class. Class B shares will automatically convert to Class A shares after a holding period of seven years from the initial date of purchase.
2. Investments in Fidelity Central Funds.
The Fund invests in Fidelity Central Funds, which are open-end investment companies generally available only to other investment companies and accounts managed by which Fidelity Management & Research Company (FMR) and its affiliates. The Fund's Schedule of Investments lists each of the Fidelity Central Funds held as of period end, if any, as an investment of the Fund, but does not include the underlying holdings of each Fidelity Central Fund. As an Investing Fund, the Fund indirectly bears its proportionate share of the expenses of the underlying Fidelity Central Funds.
The Money Market Central Funds seek preservation of capital and current income and are managed by Fidelity Investments Money Management, Inc. (FIMM), an affiliate of FMR.
A complete unaudited list of holdings for each Fidelity Central Fund is available upon request or at the Securities and Exchange Commission (the SEC) website at www.sec.gov. In addition, the financial statements of the Fidelity Central Funds, which are not covered by the Fund's Report of Independent Registered Public Accounting Firm, are available on the SEC website or upon request.
3. Significant Accounting Policies.
The financial statements have been prepared in conformity with accounting principles generally accepted in the United States of America (GAAP), which require management to make certain estimates and assumptions at the date of the financial statements. Actual results could differ from those estimates. Subsequent events, if any, through the date that the financial statements were issued have been evaluated in the preparation of
Annual Report
3. Significant Accounting Policies - continued
the financial statements. The following summarizes the significant accounting policies of the Fund:
Investment Valuation. Investments are valued as of 4:00 p.m. Eastern time on the last calendar day of the period. In accordance with valuation policies and procedures approved by the Board of Trustees (the Board), the Fund attempts to obtain prices from one or more third party pricing vendors or brokers to value its investments. When current market prices, quotations or currency exchange rates are not readily available or reliable, investments will be fair valued in good faith by the FMR Fair Value Committee (the Committee), in accordance with procedures adopted by the Board. Factors used in determining fair value vary by investment type and may include market or investment specific events. The frequency with which these procedures are used cannot be predicted and they may be utilized to a significant extent. The Committee oversees the Fund's valuation policies and procedures and is responsible for approving and reporting to the Board all fair value determinations.
The Fund categorizes the inputs to valuation techniques used to value its investments into a disclosure hierarchy consisting of three levels as shown below:
Level 1 - quoted prices in active markets for identical investments
Level 2 - other significant observable inputs (including quoted prices for similar investments, interest rates, prepayment speeds, etc.)
Level 3 - unobservable inputs (including the Fund's own assumptions based on the best information available)
Valuation techniques used to value the Fund's investments by major category are as follows:
Equity securities, including restricted securities, for which market quotations are readily available, are valued at the last reported sale price or official closing price as reported by a third party pricing vendor on the primary market or exchange on which they are traded and are categorized as Level 1 in the hierarchy. In the event there were no sales during the day or closing prices are not available, securities are valued at the last quoted bid price or may be valued using the last available price and are generally categorized as Level 2 in the hierarchy. For foreign equity securities, when market or security specific events arise, comparisons to the valuation of American Depositary Receipts (ADRs), futures contracts, Exchange-Traded Funds (ETFs) and certain indexes as well as quoted prices for similar securities may be used and would be categorized as Level 2 in the hierarchy. Utilizing these techniques may result in transfers between Level 1 and Level 2. For equity securities, including restricted securities, where observable inputs are limited, assumptions about market activity and risk are used and these securities may be categorized as Level 3 in the hierarchy.
Annual Report
Notes to Financial Statements - continued
3. Significant Accounting Policies - continued
Investment Valuation - continued
Investments in open-end mutual funds, including the Fidelity Central Funds, are valued at their closing net asset value (NAV) each business day and are categorized as Level 1 in the hierarchy.
Changes in valuation techniques may result in transfers in or out of an assigned level within the disclosure hierarchy. The aggregate value of investments by input level, as of October 31, 2013, including information on transfers between Levels 1 and 2, is included at the end of the Fund's Schedule of Investments.
Foreign Currency. The Fund may use foreign currency contracts to facilitate transactions in foreign-denominated securities. Gains and losses from these transactions may arise from changes in the value of the foreign currency or if the counterparties do not perform under the contracts' terms.
Foreign-denominated assets, including investment securities, and liabilities are translated into U.S. dollars at the exchange rates at period end. Purchases and sales of investment securities, income and dividends received and expenses denominated in foreign currencies are translated into U.S. dollars at the exchange rate in effect on the transaction date.
The effects of exchange rate fluctuations on investments are included with the net realized and unrealized gain (loss) on investment securities. Other foreign currency transactions resulting in realized and unrealized gain (loss) are disclosed separately.
Investment Transactions and Income. For financial reporting purposes, the Fund's investment holdings and NAV include trades executed through the end of the last business day of the period. The NAV per share for processing shareholder transactions is calculated as of the close of business of the New York Stock Exchange (NYSE), normally 4:00 p.m. Eastern time and includes trades executed through the end of the prior business day. Gains and losses on securities sold are determined on the basis of identified cost. Dividend income is recorded on the ex-dividend date, except for certain dividends from foreign securities where the ex-dividend date may have passed, which are recorded as soon as the Fund is informed of the ex-dividend date. Non-cash dividends included in dividend income, if any, are recorded at the fair market value of the securities received. Interest income and distributions from the Fidelity Central Funds are accrued as earned. Interest income includes coupon interest and amortization of premium and accretion of discount on debt securities. Investment income is recorded net of foreign taxes withheld where recovery of such taxes is uncertain.
Class Allocations and Expenses. Investment income, realized and unrealized capital gains and losses, common expenses of the Fund, and certain fund-level expense
Annual Report
3. Significant Accounting Policies - continued
Class Allocations and Expenses - continued
reductions, if any, are allocated daily on a pro-rata basis to each class based on the relative net assets of each class to the total net assets of the Fund. Each class differs with respect to transfer agent and distribution and service plan fees incurred. Certain expense reductions may also differ by class. For the reporting period, the allocated portion of income and expenses to each class as a percent of its average net assets may vary due to the timing of recording these transactions in relation to fluctuating net assets of the classes. Expenses directly attributable to a fund are charged to that fund. Expenses attributable to more than one fund are allocated among the respective funds on the basis of relative net assets or other appropriate methods. Expense estimates are accrued in the period to which they relate and adjustments are made when actual amounts are known.
Income Tax Information and Distributions to Shareholders. Each year, the Fund intends to qualify as a regulated investment company under Subchapter M of the Internal Revenue Code, including distributing substantially all of its taxable income and realized gains. As a result, no provision for U.S. Federal income taxes is required. As of October 31, 2013, the Fund did not have any unrecognized tax benefits in the financial statements; nor is the Fund aware of any tax positions for which it is reasonably possible that the total amounts of unrecognized tax benefits will significantly change in the next twelve months. The Fund files a U.S. federal tax return, in addition to state and local tax returns as required. The Fund's federal income tax returns are subject to examination by the Internal Revenue Service (IRS) for a period of three fiscal years after they are filed. State and local tax returns may be subject to examination for an additional fiscal year depending on the jurisdiction. Foreign taxes are provided for based on the Fund's understanding of the tax rules and rates that exist in the foreign markets in which it invests.
Distributions are declared and recorded on the ex-dividend date. Income dividends and capital gain distributions are declared separately for each class. Income and capital gain distributions are determined in accordance with income tax regulations, which may differ from GAAP. In addition, the Fund claimed a portion of the payment made to redeeming shareholders as a distribution for income tax purposes.
Capital accounts within the financial statements are adjusted for permanent book-tax differences. These adjustments have no impact on net assets or the results of operations. Temporary book-tax differences will reverse in a subsequent period.
Book-tax differences are primarily due to futures contracts, foreign currency transactions, passive foreign investment companies (PFIC), partnerships, capital loss carryforwards, and losses deferred due to wash sales.
Annual Report
Notes to Financial Statements - continued
3. Significant Accounting Policies - continued
Income Tax Information and Distributions to Shareholders - continued
The federal tax cost of investment securities and unrealized appreciation (depreciation) as of period end were as follows:
Gross unrealized appreciation | $ 77,456,036 |
Gross unrealized depreciation | (6,897,408) |
Net unrealized appreciation (depreciation) on securities and other investments | $ 70,558,628 |
| |
Tax Cost | $ 533,961,209 |
The tax-based components of distributable earnings as of period end were as follows:
Undistributed ordinary income | $ 2,476,993 |
Undistributed long-term capital gain | $ 516,487 |
Net unrealized appreciation (depreciation) | $ 70,555,556 |
The tax character of distributions paid was as follows:
| October 31, 2013 | October 31, 2012 |
Ordinary Income | $ 2,195,105 | $ 643,383 |
Short-Term Trading (Redemption) Fees. Shares held by investors in the Fund less than 30 days may have been subject to a redemption fee equal to 1.00% of the net asset value of shares redeemed. All redemption fees, which reduce the proceeds of the shareholder redemption, are retained by the Fund and accounted for as an addition to paid in capital.
New Accounting Pronouncement. The Financial Accounting Standards Board issued in December 2011, Accounting Standard Update No. 2011-11, Disclosures about Offsetting Assets and Liabilities, and in January 2013, Accounting Standards Update No. 2013-1 Clarifying the Scope of Disclosures about Offsetting Assets and Liabilities. These updates create new disclosure requirements requiring entities to disclose both gross and net information for derivatives and other financial instruments that are either offset in the Statement of Assets and Liabilities or subject to an enforceable master netting arrangement or similar agreement. The disclosure requirements are effective for annual reporting periods beginning on or after January 1, 2013, and interim periods within those annual periods. Management expects that the impact of the updates' adoption will be limited to additional financial statement disclosures as applicable.
Annual Report
4. Derivative Instruments.
Risk Exposures and the Use of Derivative Instruments. The Fund's investment objective allows the Fund to enter into various types of derivative contracts, including futures contracts. Derivatives are investments whose value is primarily derived from underlying assets, indices or reference rates and may be transacted on an exchange or over-the-counter (OTC). Derivatives may involve a future commitment to buy or sell a specified asset based on specified terms, to exchange future cash flows at periodic intervals based on a notional principal amount, or for one party to make one or more payments upon the occurrence of specified events in exchange for periodic payments from the other party.
The Fund used derivatives to increase returns and to manage exposure to certain risks as defined below. The success of any strategy involving derivatives depends on analysis of numerous economic factors, and if the strategies for investment do not work as intended, the Fund may not achieve its objectives.
The Fund's use of derivatives increased or decreased its exposure to the following risk:
Equity Risk | Equity risk relates to the fluctuations in the value of financial instruments as a result of changes in market prices (other than those arising from interest rate risk or foreign exchange risk), whether caused by factors specific to an individual investment, its issuer, or all factors affecting all instruments traded in a market or market segment. |
The Fund is also exposed to additional risks from investing in derivatives, such as liquidity risk and counterparty credit risk. Liquidity risk is the risk that the Fund will be unable to close out the derivative in the open market in a timely manner. Counterparty credit risk is the risk that the counterparty will not be able to fulfill its obligation to the Fund. Counterparty credit risk related to exchange-traded futures contracts may be mitigated by the protection provided by the exchange on which they trade.
Investing in derivatives may involve greater risks than investing in the underlying assets directly and, to varying degrees, may involve risk of loss in excess of any initial investment and collateral received and amounts recognized in the Statement of Assets and Liabilities. In addition, there may be the risk that the change in value of the derivative contract does not correspond to the change in value of the underlying instrument.
Futures Contracts. A futures contract is an agreement between two parties to buy or sell a specified underlying instrument for a fixed price at a specified future date. The Fund used futures contracts to manage its exposure to the stock market.
Upon entering into a futures contract, a fund is required to deposit either cash or securities (initial margin) with a clearing broker in an amount equal to a certain percentage of the face value of the contract. Futures contracts are marked-to-market daily and subsequent daily payments (variation margin) are made or received by a fund depending on
Annual Report
Notes to Financial Statements - continued
4. Derivative Instruments - continued
Futures Contracts - continued
the daily fluctuations in the value of the futures contracts and are recorded as unrealized appreciation or (depreciation). This receivable and/or payable, if any, is included in daily variation margin for derivative instruments in the Statement of Assets and Liabilities. Realized gain or (loss) is recorded upon the expiration or closing of a futures contract.
Any open futures contracts at period end are presented in the Schedule of Investments under the caption "Futures Contracts." The underlying face amount at value reflects each contract's exposure to the underlying instrument or index at period end.
During the period the Fund recognized net realized gain (loss) of $(517,867) related to its investment in futures contracts. This amount is included in the Statement of Operations.
5. Purchases and Sales of Investments.
Purchases and sales of securities, other than short-term securities, aggregated $423,057,094 and $105,902,960, respectively.
6. Fees and Other Transactions with Affiliates.
Management Fee. FMR and its affiliates provide the Fund with investment management related services for which the Fund pays a monthly management fee. The management fee is the sum of an individual fund fee rate that is based on an annual rate of .45% of the Fund's average net assets and an annualized group fee rate that averaged .25% during the period. The group fee rate is based upon the average net assets of all the mutual funds advised by FMR, including any mutual funds previously advised by FMR that are currently advised by Fidelity SelectCo, LLC, an affiliate of FMR. The group fee rate decreases as assets under management increase and increases as assets under management decrease. In addition, the management fee is subject to a performance adjustment (up to a maximum of ±.20% of the Fund's average net assets over a 36 month performance period). The upward or downward adjustment to the management fee is based on the relative investment performance of International Growth as compared to an appropriate benchmark index over the same 36 month performance period. For the reporting period, the total annual management fee rate, including the performance adjustment, was .75% of the Fund's average net assets. The performance adjustment included in the management fee rate may be higher or lower than the maximum performance adjustment rate due to the difference between the average net assets for the reporting and performance periods.
Distribution and Service Plan Fees. In accordance with Rule 12b-1 of the 1940 Act, the Fund has adopted separate Distribution and Service Plans for each class of shares.
Annual Report
6. Fees and Other Transactions with Affiliates - continued
Distribution and Service Plan Fees - continued
Certain classes pay Fidelity Distributors Corporation (FDC), an affiliate of FMR, separate Distribution and Service Fees, each of which is based on an annual percentage of each class' average net assets. In addition, FDC may pay financial intermediaries for selling shares of the Fund and providing shareholder support services. For the period, the Distribution and Service Fee rates, total fees and amounts retained by FDC were as follows:
| Distribution
Fee | Service
Fee | Total Fees | Retained
by FDC |
Class A | -% | .25% | $ 111,996 | $ 3,731 |
Class T | .25% | .25% | 74,898 | - |
Class B | .75% | .25% | 12,264 | 9,227 |
Class C | .75% | .25% | 113,336 | 38,127 |
| | | $ 312,494 | $ 51,085 |
Sales Load. FDC may receive a front-end sales charge of up to 5.75% for selling Class A shares and 3.50% for selling Class T shares, some of which is paid to financial intermediaries for selling shares of the Fund. Depending on the holding period, FDC may receive contingent deferred sales charges levied on Class A, Class T, Class B, and Class C redemptions. The deferred sales charges range from 5.00% to 1.00% for Class B shares, 1.00% for Class C shares, 1.00% for certain purchases of Class A shares and .25% for certain purchases of Class T shares.
For the period, sales charge amounts retained by FDC were as follows:
| Retained
by FDC |
Class A | $ 55,379 |
Class T | 12,148 |
Class B* | 741 |
Class C* | 2,285 |
| $ 70,553 |
* When Class B and Class C shares are initially sold, FDC pays commissions from its own resources to financial intermediaries through which the sales
are made.
Transfer Agent Fees. Fidelity Investments Institutional Operations Company, Inc., (FIIOC), an affiliate of FMR, is the transfer, dividend disbursing and shareholder servicing agent for each class of the Fund. FIIOC receives account fees and asset-based fees that vary according to the account size and type of account of the shareholders of the respective classes of the Fund, except for Class Z. FIIOC receives an asset-based fee of
Annual Report
Notes to Financial Statements - continued
6. Fees and Other Transactions with Affiliates - continued
Transfer Agent Fees - continued
Class Z's average net assets. FIIOC pays for typesetting, printing and mailing of shareholder reports, except proxy statements.
For the period, transfer agent fees for each class were as follows:
| Amount | % of
Average
Net Assets |
Class A | $ 133,141 | .29 |
Class T | 45,948 | .30 |
Class B | 3,660 | .30 |
Class C | 33,951 | .30 |
International Growth | 618,957 | .24 |
Institutional Class | 30,066 | .22 |
Class Z | 11 | .05* |
| $ 865,734 | |
* Annualized
Accounting and Security Lending Fees. Fidelity Service Company, Inc. (FSC), an affiliate of FMR, maintains the Fund's accounting records. The accounting fee is based on the level of average net assets for each month. Under a separate contract, FSC administers the security lending program. The security lending fee is based on the number and duration of lending transactions.
Brokerage Commissions. The Fund placed a portion of its portfolio transactions with brokerage firms which are affiliates of the investment adviser. Brokerage commissions are included in net realized gain (loss) and change in net unrealized appreciation (depreciation) in the Statement of Operations. The commissions paid to these affiliated firms were $2,164 for the period.
7. Committed Line of Credit.
The Fund participates with other funds managed by FMR or an affiliate in a $4.25 billion credit facility (the "line of credit") to be utilized for temporary or emergency purposes to fund shareholder redemptions or for other short-term liquidity purposes. The Fund has agreed to pay commitment fees on its pro-rata portion of the line of credit, which amounted to $647 and is reflected in Miscellaneous expenses on the Statement of Operations. During the period, there were no borrowings on this line of credit.
8. Security Lending.
The Fund lends portfolio securities through a lending agent from time to time in order to earn additional income. For equity securities, a lending agent is used and may loan
Annual Report
8. Security Lending - continued
securities to certain qualified borrowers, including Fidelity Capital Markets (FCM), a broker-dealer affiliated with the Fund. On the settlement date of the loan, the Fund receives collateral (in the form of U.S. Treasury obligations, letters of credit and/or cash) against the loaned securities and maintains collateral in an amount not less than 100% of the market value of the loaned securities during the period of the loan. The market value of the loaned securities is determined at the close of business of the Fund and any additional required collateral is delivered to the Fund on the next business day. If the borrower defaults on its obligation to return the securities loaned because of insolvency or other reasons, the Fund may apply collateral received from the borrower against the obligation. The Fund may experience delays and costs in recovering the securities loaned. Any cash collateral received is invested in the Fidelity Securities Lending Cash Central Fund. The value of loaned securities and cash collateral at period end are disclosed on the Fund's Statement of Assets and Liabilities. The value of securities loaned to FCM at period end was $812,318. Security lending income represents the income earned on investing cash collateral, less rebates paid to borrowers and any lending agent fees associated with the loan, plus any premium payments received for lending certain types of securities. Security lending income is presented in the Statement of Operations as a component of income from Fidelity Central Funds. Total security lending income during the period amounted to $209,783, including $4,235 from securities loaned to FCM.
9. Expense Reductions.
FMR voluntarily agreed to reimburse a portion of Class A, Class T, Class B, Class C, International Growth and Institutional Class operating expenses. During the period, this reimbursement reduced expenses as follows:
| Reimbursement |
Class A | $ 1,675 |
Class T | 515 |
Class B | 36 |
Class C | 417 |
International Growth | 10,450 |
Institutional Class | 831 |
| $ 13,924 |
In addition, FMR reimbursed a portion of the Fund's operating expenses during the period in the amount of $1,356.
Annual Report
Notes to Financial Statements - continued
9. Expense Reductions - continued
Commissions paid to certain brokers with whom FMR, or its affiliates, places trades on behalf of the Fund include an amount in addition to trade execution, which may be rebated back to the Fund to offset certain expenses. This amount totaled $46,315 for the period.
10. Distributions to Shareholders.
Distributions to shareholders of each class were as follows:
Years ended October 31, | 2013 | 2012 |
From net investment income | | |
Class A | $ 226,330 | $ 50,503 |
Class T | 86,155 | 18,666 |
Class B | 4,290 | - |
Class C | 14,481 | 2,205 |
International Growth | 1,698,830 | 516,958 |
Institutional Class | 51,250 | 6,406 |
Total | $ 2,081,336 | $ 594,738 |
From net realized gain | | |
Class A | $ 13,472 | $ 4,810 |
Class T | 6,243 | 2,196 |
Class B | 631 | - |
Class C | 3,291 | 1,890 |
International Growth | 87,569 | 39,262 |
Institutional Class | 2,563 | 487 |
Total | $ 113,769 | $ 48,645 |
11. Share Transactions.
Transactions for each class of shares were as follows:
| Shares | Dollars |
Years ended October 31, | 2013 A | 2012 | 2013 A | 2012 |
Class A | | | | |
Shares sold | 5,907,169 | 1,901,699 | $ 58,500,264 | $ 16,560,116 |
Reinvestment of distributions | 24,178 | 5,422 | 218,566 | 42,831 |
Shares redeemed | (1,466,703) | (236,851) | (14,226,261) | (2,015,265) |
Net increase (decrease) | 4,464,644 | 1,670,270 | $ 44,492,569 | $ 14,587,682 |
Class T | | | | |
Shares sold | 1,144,706 | 941,446 | $ 11,429,141 | $ 8,178,600 |
Reinvestment of distributions | 10,086 | 2,626 | 91,076 | 20,742 |
Shares redeemed | (206,178) | (102,766) | (2,020,899) | (866,637) |
Net increase (decrease) | 948,614 | 841,306 | $ 9,499,318 | $ 7,332,705 |
Annual Report
11. Share Transactions - continued
| Shares | Dollars |
Years ended October 31, | 2013 A | 2012 | 2013 A | 2012 |
Class B | | | | |
Shares sold | 70,442 | 92,865 | $ 702,618 | $ 806,549 |
Reinvestment of distributions | 531 | - | 4,806 | - |
Shares redeemed | (49,437) | (25,954) | (483,935) | (218,180) |
Net increase (decrease) | 21,536 | 66,911 | $ 223,489 | $ 588,369 |
Class C | | | | |
Shares sold | 1,392,365 | 400,291 | $ 13,520,584 | $ 3,375,948 |
Reinvestment of distributions | 1,911 | 510 | 17,237 | 4,026 |
Shares redeemed | (424,469) | (106,475) | (4,120,400) | (879,489) |
Net increase (decrease) | 969,807 | 294,326 | $ 9,417,421 | $ 2,500,485 |
International Growth | | | | |
Shares sold | 29,198,608 | 13,301,892 | $ 290,678,738 | $ 114,028,412 |
Reinvestment of distributions | 192,126 | 68,821 | 1,742,585 | 544,378 |
Shares redeemed | (6,365,570) | (3,238,606) | (62,814,771) | (27,713,258) |
Net increase (decrease) | 23,025,164 | 10,132,107 | $ 229,606,552 | $ 86,859,532 |
Institutional Class | | | | |
Shares sold | 3,568,741 | 438,656 | $ 35,951,935 | $ 3,841,370 |
Reinvestment of distributions | 5,682 | 655 | 51,476 | 5,178 |
Shares redeemed | (443,392) | (53,696) | (4,427,602) | (443,499) |
Net increase (decrease) | 3,131,031 | 385,615 | $ 31,575,809 | $ 3,403,049 |
Class Z | | | | |
Shares sold | 9,747 | - | $ 100,000 | $ - |
Reinvestment of distributions | - | - | - | - |
Shares redeemed | - | - | - | - |
Net increase (decrease) | 9,747 | - | $ 100,000 | $ - |
A Share transactions for Class Z are for the period August 13, 2013 (commencement of sale of shares) to October 31, 2013.
12. Other.
The Fund's organizational documents provide former and current trustees and officers with a limited indemnification against liabilities arising in connection with the performance of their duties to the Fund. In the normal course of business, the Fund may also enter into contracts that provide general indemnifications. The Fund's maximum exposure under these arrangements is unknown as this would be dependent on future claims that may be made against the Fund. The risk of material loss from such claims is considered remote.
Annual Report
To the Trustees of Fidelity Investment Trust and the Shareholders of Fidelity International Growth Fund:
In our opinion, the accompanying statement of assets and liabilities, including the schedule of investments, and the related statements of operations and of changes in net assets and the financial highlights present fairly, in all material respects, the financial position of Fidelity International Growth Fund (a fund of Fidelity Investment Trust) at October 31, 2013, the results of its operations for the year then ended, the changes in its net assets for each of the two years in the period then ended and the financial highlights for each of the periods indicated, in conformity with accounting principles generally accepted in the United States of America. These financial statements and financial highlights (hereafter referred to as "financial statements") are the responsibility of the Fidelity International Growth Fund's management. Our responsibility is to express an opinion on these financial statements based on our audits. We conducted our audits of these financial statements in accordance with the standards of the Public Company Accounting Oversight Board (United States). Those standards require that we plan and perform the audit to obtain reasonable assurance about whether the financial statements are free of material misstatement. An audit includes examining, on a test basis, evidence supporting the amounts and disclosures in the financial statements, assessing the accounting principles used and significant estimates made by management, and evaluating the overall financial statement presentation. We believe that our audits, which included confirmation of securities at October 31, 2013 by correspondence with the custodian and brokers, provide a reasonable basis for our opinion.
PricewaterhouseCoopers LLP
Boston, Massachusetts
December 11, 2013
Annual Report
The Trustees, Member of the Advisory Board, and executive officers of the trust and fund, as applicable, are listed below. The Board of Trustees governs the fund and is responsible for protecting the interests of shareholders. The Trustees are experienced executives who meet periodically throughout the year to oversee the fund's activities, review contractual arrangements with companies that provide services to the fund, oversee management of the risks associated with such activities and contractual arrangements, and review the fund's performance. Except for James C. Curvey, Ned C. Lautenbach, Ronald P. O'Hanley, and William S. Stavropoulos, each of the Trustees oversees 171 funds. Mr. Curvey oversees 394 funds. Mr. Lautenbach, Mr. O'Hanley, and Mr. Stavropoulos each oversees 245 funds.
The Trustees hold office without limit in time except that (a) any Trustee may resign; (b) any Trustee may be removed by written instrument, signed by at least two-thirds of the number of Trustees prior to such removal; (c) any Trustee who requests to be retired or who has become incapacitated by illness or injury may be retired by written instrument signed by a majority of the other Trustees; and (d) any Trustee may be removed at any special meeting of shareholders by a two-thirds vote of the outstanding voting securities of the trust. Each Trustee who is not an interested person of the trust and the fund (as defined in the 1940 Act) (Independent Trustee), shall retire not later than the last day of the calendar year in which his or her 75th birthday occurs. The Independent Trustees may waive this mandatory retirement age policy with respect to individual Trustees. The executive officers and Advisory Board Member hold office without limit in time, except that any officer and Advisory Board Member may resign or may be removed by a vote of a majority of the Trustees at any regular meeting or any special meeting of the Trustees. Except as indicated, each individual has held the office shown or other offices in the same company for the past five years.
Experience, Skills, Attributes, and Qualifications of the Fund's Trustees. The Governance and Nominating Committee has adopted a statement of policy that describes the experience, qualifications, attributes, and skills that are necessary and desirable for potential Independent Trustee candidates (Statement of Policy). The Board believes that each Trustee satisfied at the time he or she was initially elected or appointed a Trustee, and continues to satisfy, the standards contemplated by the Statement of Policy. The Governance and Nominating Committee also engages professional search firms to help identify potential Independent Trustee candidates who have the experience, qualifications, attributes, and skills consistent with the Statement of Policy. From time to time, additional criteria based on the composition and skills of the current Independent Trustees, as well as experience or skills that may be appropriate in light of future changes to board composition, business conditions, and regulatory or other developments, have also been considered by the professional search firms and the Governance and Nominating Committee. In addition, the Board takes into account the Trustees' commitment and participation in Board and committee meetings, as well as their leadership of standing and ad hoc committees throughout their tenure.
Annual Report
Trustees and Officers - continued
In determining that a particular Trustee was and continues to be qualified to serve as a Trustee, the Board has considered a variety of criteria, none of which, in isolation, was controlling. The Board believes that, collectively, the Trustees have balanced and diverse experience, qualifications, attributes, and skills, which allow the Board to operate effectively in governing the fund and protecting the interests of shareholders. Information about the specific experience, skills, attributes, and qualifications of each Trustee, which in each case led to the Board's conclusion that the Trustee should serve (or continue to serve) as a trustee of the fund, is provided below.
Board Structure and Oversight Function. James C. Curvey is an interested person (as defined in the 1940 Act) and currently serves as Chairman. The Trustees have determined that an interested Chairman is appropriate and benefits shareholders because an interested Chairman has a personal and professional stake in the quality and continuity of services provided to the fund. Independent Trustees exercise their informed business judgment to appoint an individual of their choosing to serve as Chairman, regardless of whether the Trustee happens to be independent or a member of management. The Independent Trustees have determined that they can act independently and effectively without having an Independent Trustee serve as Chairman and that a key structural component for assuring that they are in a position to do so is for the Independent Trustees to constitute a substantial majority for the Board. The Independent Trustees also regularly meet in executive session. Ned C. Lautenbach serves as Chairman of the Independent Trustees and as such (i) acts as a liaison between the Independent Trustees and management with respect to matters important to the Independent Trustees and (ii) with management prepares agendas for Board meetings.
Fidelity funds are overseen by different Boards of Trustees. The fund's Board oversees Fidelity's equity and high income funds and another Board oversees Fidelity's investment-grade bond, money market, and asset allocation funds. The asset allocation funds may invest in Fidelity funds overseen by the fund's Board. The use of separate Boards, each with its own committee structure, allows the Trustees of each group of Fidelity funds to focus on the unique issues of the funds they oversee, including common research, investment, and operational issues. On occasion, the separate Boards establish joint committees to address issues of overlapping consequences for the Fidelity funds overseen by each Board.
The Trustees operate using a system of committees to facilitate the timely and efficient consideration of all matters of importance to the Trustees, the fund, and fund shareholders and to facilitate compliance with legal and regulatory requirements and oversight of the fund's activities and associated risks. The Board, acting through its committees, has charged FMR and its affiliates with (i) identifying events or circumstances the occurrence of which could have demonstrably adverse effects on the fund's business and/or reputation; (ii) implementing processes and controls to lessen the possibility that such events or circumstances occur or to mitigate the effects of such events or circumstances if they do occur; and (iii) creating and maintaining a system designed to evaluate continuously business and market conditions in order to facilitate the identification and implementation processes described in (i) and (ii) above. Because the day-to-day operations and activities of the fund are carried out by or through FMR, its affiliates and other service providers, the fund's exposure to risks is mitigated but not eliminated by the processes overseen by the Trustees. While each of the Board's committees has responsibility for overseeing different aspects of the fund's activities, oversight is exercised primarily through the Operations, Audit, and Compliance Committees. In addition, the Independent Trustees have worked with FMR to enhance the Board's oversight of investment and financial risks, legal and regulatory risks, technology risks, and operational risks, including the development of additional risk reporting to the Board. For example, a working group comprised of Independent Trustees and FMR has worked and continues to work to review the Fidelity funds' valuation-related activities, reporting and risk management. Appropriate personnel, including but not limited to the fund's Chief Compliance Officer (CCO), FMR's internal auditor, the independent accountants, the fund's Treasurer and portfolio management personnel, make periodic reports to the Board's committees, as appropriate, including an annual review of FMR's risk management program for the Fidelity funds. The responsibilities of each standing committee, including their oversight responsibilities, are described further under "Standing Committees of the Fund's Trustees."
Annual Report
The fund's Statement of Additional Information (SAI) includes more information about the Trustees. To request a free copy, call Fidelity at 1-877-208-0098.
Interested Trustees*:
Correspondence intended for each Trustee who is an interested person may be sent to Fidelity Investments, 245 Summer Street, Boston, Massachusetts 02210.
Name, Year of Birth; Principal Occupations and Other Relevant Experience+ |
James C. Curvey (1935) |
Year of Election or Appointment: 2007 Trustee Chairman of the Board of Trustees |
| Mr. Curvey also serves as Trustee of other Fidelity funds. Mr. Curvey is a Director of Fidelity Investments Money Management, Inc. (2009-present), Director of Fidelity Research & Analysis Co. (2009-present) and Director of FMR and FMR Co., Inc. (2007-present). Mr. Curvey is also Vice Chairman (2007-present) and Director of FMR LLC. In addition, Mr. Curvey serves as an Overseer for the Boston Symphony Orchestra and a member of the Trustees of Villanova University. Previously, Mr. Curvey was the Vice Chairman (2006-2007) and Director (2000-2007) of FMR Corp. |
Ronald P. O'Hanley (1957) |
Year of Election or Appointment: 2011 Trustee |
| Mr. O'Hanley also serves as Trustee of other Fidelity funds. He is Director of Fidelity SelectCo, LLC (2013-present), FMR Co., Inc. (2010-present), Director of Fidelity Investments Money Management, Inc. (2010-present), Director of Fidelity Research & Analysis Company (2010-present), President of Fidelity Asset Management and Corporate Services and a Member of Fidelity's Executive Committee (2010-present). Previously, Mr. O'Hanley served as President and Chief Executive Officer of BNY Mellon Asset Management (2007-2010). Mr. O'Hanley also served as Vice Chairman of Bank New York Mellon Corp. and a member of that firm's Executive Committee. Prior to the 2007 merger of The Bank of New York and Mellon Financial Corporation, he was Vice Chairman of Mellon Financial Corporation and President and Chief Executive Officer of Mellon Asset Management. He joined Mellon in February 1997. Mr. O'Hanley currently serves as Chairman of the Boston Public Library Foundation Board of Directors and sits on the Board of Directors of Beth Israel Deaconess Medical Center, the Board of Trustees of the Marine Biological Laboratory and the Advisory Board of the Maxwell School of Citizenship and Public Administration at Syracuse University. Mr. O'Hanley also chairs the Council on Asset Management for the Financial Services Roundtable and is a member of the Board of Directors of Institutional Investor's U.S. Institute. |
* Trustees have been determined to be "Interested Trustees" by virtue of, among other things, their affiliation with the trust or various entities under common control with FMR.
+ The information above includes each Trustee's principal occupation during the last five years and other information relating to the experience, attributes, and skills relevant to each Trustee's qualifications to serve as a Trustee, which led to the conclusion that each Trustee should serve as a Trustee for the fund.
Annual Report
Independent Trustees:
Correspondence intended for each Independent Trustee (that is, the Trustees other than the Interested Trustees) may be sent to Fidelity Investments, P.O. Box 55235, Boston, Massachusetts 02205-5235.
Name, Year of Birth; Principal Occupations and Other Relevant Experience+ |
Dennis J. Dirks (1948) |
Year of Election or Appointment: 2005 Trustee |
| Mr. Dirks also serves as Trustee of other Fidelity funds. Prior to his retirement in May 2003, Mr. Dirks was Chief Operating Officer and a member of the Board of The Depository Trust & Clearing Corporation (DTCC). He also served as President, Chief Operating Officer, and Board member of The Depository Trust Company (DTC) and President and Board member of the National Securities Clearing Corporation (NSCC). In addition, Mr. Dirks served as Chief Executive Officer and Board member of the Government Securities Clearing Corporation, Chief Executive Officer and Board member of the Mortgage-Backed Securities Clearing Corporation, as a Trustee and a member of the Finance Committee of Manhattan College (2005-2008), and as a Trustee and a member of the Finance Committee of AHRC of Nassau County (2006-2008). Mr. Dirks is a member of the Independent Directors Council (IDC) Governing Council (2010-present) and Board of Directors for The Brookville Center for Children's Services, Inc. (2009-present). |
Alan J. Lacy (1953) |
Year of Election or Appointment: 2008 Trustee |
| Mr. Lacy also serves as Trustee of other Fidelity funds. Mr. Lacy serves as Senior Adviser (2007-present) of Oak Hill Capital Partners, L.P. (private equity). Mr. Lacy also served as Chief Executive Officer (2000-2005) and Vice Chairman (2005-2006) of Sears Holdings Corporation and Sears, Roebuck and Co. (retail). In addition, Mr. Lacy serves as a member of the Board of Directors of Dave & Buster's Entertainment, Inc. (restaurant and entertainment complexes, 2010-present), Earth Fare, Inc. (retail grocery, 2012-present), The Hillman Companies, Inc. (hardware wholesalers, 2010-present), and Bristol-Myers Squibb Company (global pharmaceuticals, 2008-present). Mr. Lacy is a member of the Board of Trustees of The National Parks Conservation Association (2006-present). Previously, Mr. Lacy served as Chairman of the Board of Trustees of the National Parks Conservation Association (2008-2011) and as a member of the Board of Directors for the Western Union Company (global money transfer, 2006-2011). |
Ned C. Lautenbach (1944) |
Year of Election or Appointment: 2000 Trustee Chairman of the Independent Trustees |
| Mr. Lautenbach also serves as Trustee of other Fidelity funds. Mr. Lautenbach currently serves as the Lead Director of the Eaton Corporation Board of Directors (diversified industrial, 1997-present). Mr. Lautenbach is Chairman of the Board of Directors of the Philharmonic Center for the Arts in Naples, Florida (2012-present) and a member of the Council on Foreign Relations (1994-present). Previously, Mr. Lautenbach was a Partner/Advisory Partner at Clayton, Dubilier & Rice, LLC (private equity investment, 1998-2010), as well as a Director of Sony Corporation (2006-2007). |
Joseph Mauriello (1944) |
Year of Election or Appointment: 2008 Trustee |
| Mr. Mauriello also serves as Trustee of other Fidelity funds. Prior to his retirement in January 2006, Mr. Mauriello served in numerous senior management positions including Deputy Chairman and Chief Operating Officer (2004-2005), and Vice Chairman of Financial Services (2002-2004) of KPMG LLP US (professional services, 1965-2005). Mr. Mauriello currently serves as a member of the Board of Directors of XL Group plc. (global insurance and re-insurance, 2006-present). Previously, Mr. Mauriello served as a Director of the Hamilton Funds of the Bank of New York (2006-2007) and of Arcadia Resources Inc. (health care services and products, 2007-2012). |
Robert W. Selander (1950) |
Year of Election or Appointment: 2011 Trustee |
| Mr. Selander also serves as Trustee of other Fidelity funds. Previously, Mr. Selander served as a Member of the Advisory Board of other Fidelity funds (2011), and Executive Vice Chairman (2010), Chief Executive Officer (2009-2010), and President and Chief Executive Officer (1997-2009) of Mastercard, Inc. |
Cornelia M. Small (1944) |
Year of Election or Appointment: 2005 Trustee |
| Ms. Small also serves as Trustee of other Fidelity funds. Ms. Small is a member of the Board of Directors (2009-present) and Chair of the Investment Committee (2010-present) of the Teagle Foundation. Ms. Small also serves on the Investment Committee of the Berkshire Taconic Community Foundation (2008-present). Previously, Ms. Small served as Chairperson (2002-2008) and a member of the Investment Committee and Chairperson (2008-2012) and a member of the Board of Trustees of Smith College. In addition, Ms. Small served as Chief Investment Officer, Director of Global Equity Investments, and a member of the Board of Directors of Scudder, Stevens & Clark and Scudder Kemper Investments. |
William S. Stavropoulos (1939) |
Year of Election or Appointment: 2001 Trustee Vice Chairman of the Independent Trustees |
| Mr. Stavropoulos also serves as Trustee of other Fidelity funds. Mr. Stavropoulos serves as President and Founder of the Michigan Baseball Foundation, the Great Lakes Loons (2007-present). Mr. Stavropoulos is Chairman Emeritus of the Board of Directors of The Dow Chemical Company, where he previously served in numerous senior management positions, including President, CEO (1995-2000; 2002-2004), Chairman of the Executive Committee (2000-2006), and as a member of the Board of Directors (1990-2006). Currently, Mr. Stavropoulos is Chairman of the Board of Directors of Univar Inc. (global distributor of commodity and specialty chemicals), a Director of Teradata Corporation (data warehousing and technology solutions), and Maersk Inc. (industrial conglomerate), and a member of the Advisory Board for Metalmark Capital LLC (private equity investment, 2005-present). Mr. Stavropoulos is an operating advisor to Clayton, Dubilier & Rice, LLC (private equity investment). In addition, Mr. Stavropoulos is a member of the University of Notre Dame Advisory Council for the College of Science, a Trustee of the Rollin L. Gerstacker Foundation, and a Director of the Naples Philharmonic Center for the Arts. Previously, Mr. Stavropoulos served as a Director of Chemical Financial Corporation (bank holding company, 1993-2012) and Tyco International, Ltd. (multinational manufacturing and services, 2007-2012). |
David M. Thomas (1949) |
Year of Election or Appointment: 2008 Trustee |
| Mr. Thomas also serves as Trustee of other Fidelity funds. Mr. Thomas serves as Non-Executive Chairman of the Board of Directors of Fortune Brands Home and Security (home and security products, 2011-present), and as a member of the Board of Directors of Interpublic Group of Companies, Inc. (marketing communication, 2004-present). Previously, Mr. Thomas served as Executive Chairman (2005-2006) and Chairman and Chief Executive Officer (2000-2005) of IMS Health, Inc. (pharmaceutical and healthcare information solutions), and a Director of Fortune Brands, Inc. (consumer products, 2000-2011). |
+ The information above includes each Trustee's principal occupation during the last five years and other information relating to the experience, attributes, and skills relevant to each Trustee's qualifications to serve as a Trustee, which led to the conclusion that each Trustee should serve as a Trustee for the fund.
Advisory Board Member and Executive Officers:
Correspondence intended for each executive officer and Peter S. Lynch may be sent to Fidelity Investments, 245 Summer Street, Boston, Massachusetts 02210.
Executive officers appear below in alphabetical order.
Name, Year of Birth; Principal Occupation |
Peter S. Lynch (1944) |
Year of Election or Appointment: 2003 Member of the Advisory Board |
| Mr. Lynch also serves as Member of the Advisory Board of other Fidelity funds. Mr. Lynch is Vice Chairman and a Director of FMR and FMR Co., Inc. In addition, Mr. Lynch serves as a Trustee of Boston College and as the Chairman of the Inner-City Scholarship Fund. Previously, Mr. Lynch served on the Special Olympics International Board of Directors (1997-2006). |
Elizabeth Paige Baumann (1968) |
Year of Election or Appointment: 2012 Anti-Money Laundering (AML) Officer |
| Ms. Baumann also serves as AML Officer of other funds. She is Chief AML Officer of FMR LLC (2012-present) and is an employee of Fidelity Investments. Previously, Ms. Baumann served as Vice President and Deputy Anti-Money Laundering Officer (2007-2012). |
William C. Coffey (1969) |
Year of Election or Appointment: 2009 Assistant Secretary |
| Mr. Coffey also serves as Assistant Secretary of other funds. He is Senior Vice President and Deputy General Counsel of FMR LLC (2010-present), and is an employee of Fidelity Investments. Previously, Mr. Coffey served as Vice President and Associate General Counsel of FMR LLC (2005-2009). |
Jonathan Davis (1968) |
Year of Election or Appointment: 2010 Assistant Treasurer |
| Mr. Davis also serves as Assistant Treasurer of other funds. Mr. Davis is an employee of Fidelity Investments. Previously, Mr. Davis served as Vice President and Associate General Counsel of FMR LLC (2003-2010). |
Adrien E. Deberghes (1967) |
Year of Election or Appointment: 2008 Deputy Treasurer |
| Mr. Deberghes also serves as an officer of other funds. He is an employee of Fidelity Investments (2008-present). Prior to joining Fidelity Investments, Mr. Deberghes was Senior Vice President of Mutual Fund Administration at State Street Corporation (2007-2008), Senior Director of Mutual Fund Administration at Investors Bank & Trust (2005-2007), and Director of Finance for Dunkin' Brands (2000-2005). |
Stephanie J. Dorsey (1969) |
Year of Election or Appointment: 2010 Assistant Treasurer |
| Ms. Dorsey also serves as an officer of other funds. She is an employee of Fidelity Investments (2008-present) and has served in other fund officer roles. Prior to joining Fidelity Investments, Ms. Dorsey served as Treasurer (2004-2008) of the JPMorgan Mutual Funds and Vice President (2004-2008) of JPMorgan Chase Bank. |
Scott C. Goebel (1968) |
Year of Election or Appointment: 2008 Secretary and Chief Legal Officer (CLO) |
| Mr. Goebel serves as Secretary and CLO of other funds. Mr. Goebel also serves as Secretary of Fidelity Investments Money Management, Inc. (FIMM) (2010-present) and Fidelity Research and Analysis Company (FRAC) (2010-present); General Counsel, Secretary, and Senior Vice President of FMR (2008-present) and FMR Co., Inc. (2008-present); Chief Legal Officer of Fidelity Management & Research (Hong Kong) Limited (2008-present) and Assistant Secretary of Fidelity Management & Research (Japan) Inc. (2008-present), and Fidelity Management & Research (U.K.) Inc. (2008-present). Previously, Mr. Goebel served as Secretary and CLO of other Fidelity funds (2008-2013), Assistant Secretary of FIMM (2008-2010), FRAC (2008-2010), and certain funds (2007-2008); and as Vice President and Secretary of Fidelity Distributors Corporation (FDC) (2005-2007). Mr. Goebel has been employed by FMR LLC or an affiliate since 2001. |
Joseph A. Hanlon (1968) |
Year of Election or Appointment: 2012 Chief Compliance Officer |
| Mr. Hanlon also serves as Chief Compliance Officer of other funds. Mr. Hanlon serves as Compliance Officer of FMR, FMR Co., Inc., Fidelity Investments Money Management, Inc. (FIMM), Fidelity Research and Analysis Company (FRAC), and Fidelity Management & Research (Hong Kong) (2009-present), as Senior Vice President of the Fidelity Asset Management Division (2009-present), and is an employee of Fidelity Investments. Previously, Mr. Hanlon served as Compliance Officer of Fidelity Management & Research (Japan) Inc. (2009-2013), Strategic Advisers, Inc. (2009-2013), and Fidelity Management & Research (U.K.) Inc. (2009-2013). |
Bruce T. Herring (1965) |
Year of Election or Appointment: 2006 Vice President of certain Equity Funds |
| Mr. Herring also serves as Vice President of other funds. He serves as Chief Investment Officer of Fidelity Global Asset Allocation (GAA) (2013-present), Chief Investment Officer and Director of Fidelity Management & Research (U.K.) Inc. (2010-present), Group Chief Investment Officer of FMR, and President of Fidelity Research & Analysis Company (2010-present). Previously, Mr. Herring served as Vice President (2005-2006) and Senior Vice President (2006-2007) of Fidelity Management & Research Company, Vice President of FMR Co., Inc. (2001-2007), and as a portfolio manager for Fidelity U.S. Equity Funds. |
Brian B. Hogan (1964) |
Year of Election or Appointment: 2009 Vice President |
| Mr. Hogan also serves as Vice President of other funds. Mr. Hogan serves as President of FMR's Equity Division (2009-present). Previously, Mr. Hogan served as Senior Vice President, Equity Research of FMR (2006-2009) and as a portfolio manager. |
Chris Maher (1972) |
Year of Election or Appointment: 2013 Assistant Treasurer |
| Mr. Maher serves as Assistant Treasurer of other funds. Mr. Maher is Vice President of Valuation Oversight and is an employee of Fidelity Investments. Previously, Mr. Maher served as Vice President of Asset Management Compliance (2013), Vice President of FMR's Program Management Group (2010-2013), and Vice President of Valuation Oversight (2008-2010). |
Christine Reynolds (1958) |
Year of Election or Appointment: 2008 Chief Financial Officer |
| Ms. Reynolds also serves as Chief Financial Officer of other funds. Ms. Reynolds became President of Fidelity Pricing and Cash Management Services (FPCMS) in August 2008. Ms. Reynolds served as Chief Operating Officer of FPCMS (2007-2008). Previously, Ms. Reynolds served as President, Treasurer, and Anti-Money Laundering officer of the Fidelity funds (2004-2007). |
Kenneth B. Robins (1969) |
Year of Election or Appointment: 2008 President and Treasurer |
| Mr. Robins also serves as an officer of other funds. Mr. Robins serves as Executive Vice President of Fidelity Investments Money Management, Inc. (FIMM) (2013-present) and is an employee of Fidelity Investments (2004-present). Previously, Mr. Robins served in other fund officer roles. |
Gary W. Ryan (1958) |
Year of Election or Appointment: 2005 Assistant Treasurer |
| Mr. Ryan also serves as Assistant Treasurer of other funds. Mr. Ryan is an employee of Fidelity Investments and has served in other fund officer roles. Previously, Mr. Ryan served as Vice President of Fund Reporting in Fidelity Pricing and Cash Management Services (FPCMS) (1999-2005). |
Stephen Sadoski (1971) |
Year of Election or Appointment: 2012 Deputy Treasurer |
| Mr. Sadoski also serves as Deputy Treasurer of other funds. He is an employee of Fidelity Investments (2012-present) and has served in another fund officer role. Prior to joining Fidelity Investments, Mr. Sadoski served as an assistant chief accountant in the Division of Investment Management of the Securities and Exchange Commission (SEC) (2009-2012) and as a senior manager at Deloitte & Touche LLP (1997-2009). |
Stacie M. Smith (1974) |
Year of Election or Appointment: 2013 Deputy Treasurer |
| Ms. Smith also serves as an officer of other funds. She is an employee of Fidelity Investments (2009-present) and has served in other fund officer roles. Prior to joining Fidelity Investments, Ms. Smith served as Senior Audit Manager of Ernst & Young LLP (1996-2009). |
Renee Stagnone (1975) |
Year of Election or Appointment: 2013 Deputy Treasurer |
| Ms. Stagnone also serves as Deputy Treasurer of other funds. Ms. Stagnone is an employee of Fidelity Investments. |
Joseph F. Zambello (1957) |
Year of Election or Appointment: 2011 Deputy Treasurer |
| Mr. Zambello also serves as Deputy Treasurer of other funds. Mr. Zambello is an employee of Fidelity Investments. Previously, Mr. Zambello served as Vice President of FMR's Program Management Group (2009-2011) and Vice President of the Transfer Agent Oversight Group (2005-2009). |
Annual Report
The Board of Trustees of Fidelity International Growth Fund voted to pay to shareholders of record at the opening of business on record date, the following distributions per share derived from capital gains realized from sales of portfolio securities, and dividends derived from net investment income:
| Pay Date | Record Date | Dividends | Capital Gains |
Class A | 12/09/13 | 12/06/13 | $0.034 | $0.009 |
| | | | |
Class T | 12/09/13 | 12/06/13 | $0.018 | $0.009 |
| | | | |
Class B | 12/09/13 | 12/06/13 | $0.000 | $0.009 |
| | | | |
Class C | 12/09/13 | 12/06/13 | $0.000 | $0.009 |
The fund hereby designates as a capital gain dividend with respect to the taxable year ended October 31, 2013, $585,832, or, if subsequently determined to be different, the net capital gain of such year.
Class A designates 14%, Class T designates 16%, Class B designates 29%, and Class C designates 40% of the dividends distributed in December 2012 as indicated in the Corporate Qualifying memo distributed by the Tax department, during the fiscal year as qualifying for the dividends received deduction for corporate shareholders.
Class A, Class T, Class B, and Class C designates 100% of the dividends distributed during the fiscal year as amounts which may be taken into account as a dividend for purposes of the maximum rate under section 1(h)(11) of the Internal Revenue Code.
The amounts per share which represent income derived from sources within, and taxes paid to, foreign countries or possessions of the United States are as follows:
| Pay Date | Income | Taxes |
Class A | 12/10/2012 | $0.044 | $0.0053 |
| | | |
Class T | 12/10/2012 | $0.037 | $0.0053 |
| | | |
Class B | 12/10/2012 | $0.021 | $0.0053 |
| | | |
Class C | 12/10/2012 | $0.015 | $0.0053 |
The fund will notify shareholders in January 2014 of amounts for use in preparing 2013 income tax returns.
Annual Report
Board Approval of Investment Advisory Contracts and Management Fees
Fidelity International Growth Fund
Each year, the Board of Trustees, including the Independent Trustees (together, the Board), votes on the renewal of the management contract and sub-advisory agreements (together, the Advisory Contracts) for the fund. The Board, assisted by the advice of fund counsel and Independent Trustees' counsel, requests and considers a broad range of information relevant to the renewal of the Advisory Contracts throughout the year.
The Board meets regularly and, at each of its meetings, covers an extensive agenda of topics and materials and considers factors that are relevant to its annual consideration of the renewal of the fund's Advisory Contracts, including the services and support provided to the fund and its shareholders. The Board has established various standing committees, each composed of and chaired by Independent Trustees with varying backgrounds, to which the Board has assigned specific subject matter responsibilities in order to enhance effective decision-making by the Board. The Board, acting directly and through its Committees, requests and receives information concerning the annual consideration of the renewal of the fund's Advisory Contracts. The Board also meets as needed to consider matters specifically related to the Board's annual consideration of the renewal of Advisory Contracts. Members of the Board may also meet with trustees of other Fidelity funds through ad hoc joint committees to discuss certain matters relevant to the Fidelity funds.
At its July 2013 meeting, the Board, including the Independent Trustees, unanimously determined to renew the fund's Advisory Contracts. In reaching its determination, the Board considered all factors it believed relevant, including (i) the nature, extent, and quality of the services to be provided to the fund and its shareholders (including the investment performance of the fund); (ii) the competitiveness of the fund's management fee and total expense ratio relative to peer funds; (iii) the total costs of the services to be provided by and the profits to be realized by Fidelity from its relationship with the fund; (iv) the extent to which economies of scale exist and would be realized as the fund grows; and (v) whether fee levels reflect these economies of scale, if any, for the benefit of fund shareholders.
In considering whether to renew the Advisory Contracts for the fund, the Board reached a determination, with the assistance of fund counsel and Independent Trustees' counsel and through the exercise of its business judgment, that the renewal of the Advisory Contracts was in the best interests of the fund and its shareholders and that the compensation payable under the Advisory Contracts was fair and reasonable. The Board's decision to renew the Advisory Contracts was not based on any single factor, but rather was based on a comprehensive consideration of all the information provided to the Board at its meetings throughout the year. The Board, in reaching its determination to renew the Advisory Contracts, was aware that shareholders in the fund have a broad range of investment choices available to them, including a wide choice among mutual funds offered by Fidelity's competitors, and that the fund's shareholders, who have the opportunity to review and weigh the disclosure provided by the fund in its prospectus and other public disclosures, have chosen to invest in this fund, which is a part of the Fidelity family of funds.
Annual Report
Board Approval of Investment Advisory Contracts and
Management Fees - continued
Nature, Extent, and Quality of Services Provided. The Board considered the staffing within the investment adviser, Fidelity Management & Research Company (FMR), and the sub-advisers (together, the Investment Advisers) as it relates to the fund, including the backgrounds of the fund's investment personnel, and also considered the fund's investment objective, strategies, and related investment philosophy. The Independent Trustees also had discussions with senior management of Fidelity's investment operations and investment groups. The Board considered the structure of the portfolio manager compensation program and whether this structure provides appropriate incentives to act in the best interests of the fund.
Resources Dedicated to Investment Management and Support Services. The Board and the Fund Oversight and Research Committees reviewed the general qualifications and capabilities of the Investment Advisers' investment staff, including its size, education, experience, and resources, as well as the Investment Advisers' approach to recruiting, training, managing, and compensating investment personnel. The Board noted that FMR has continued to increase the resources devoted to non-U.S. offices, including expansion of Fidelity's global investment organization. The Board also noted that Fidelity's analysts have extensive resources, tools and capabilities that allow them to conduct sophisticated quantitative and fundamental analysis, as well as credit analysis of issuers, counterparties and guarantors. Further, the Board believes that Fidelity's investment professionals have sufficient access to global information and data so as to provide competitive investment results over time, and that those professionals also have access to sophisticated tools that permit them to assess portfolio construction and risk and performance attribution characteristics continuously, as well as to transmit new information and research conclusions rapidly around the world. Additionally, in its deliberations, the Board considered the Investment Advisers' trading and risk management capabilities and resources, which are an integral part of the investment management process.
Shareholder and Administrative Services. The Board considered (i) the nature, extent, quality, and cost of advisory, administrative, and shareholder services performed by the Investment Advisers and their affiliates under the Advisory Contracts and under separate agreements covering transfer agency, pricing and bookkeeping, and securities lending services for the fund; (ii) the nature and extent of the supervision of third party service providers, principally custodians and subcustodians; and (iii) the resources devoted to, and the record of compliance with, the fund's compliance policies and procedures. The Board also reviewed the allocation of fund brokerage, including allocations to brokers affiliated with the Investment Advisers, the use of brokerage commissions to pay fund expenses, and the use of "soft" commission dollars to pay for research services.
Annual Report
The Board noted that the growth of fund assets over time across the complex allows Fidelity to reinvest in the development of services designed to enhance the value or convenience of the Fidelity funds as investment vehicles. These services include 24-hour access to account information and market information through telephone representatives and over the Internet, investor education materials and asset allocation tools, and the expanded availability of Fidelity Investor Centers.
Investment in a Large Fund Family. The Board considered the benefits to shareholders of investing in a Fidelity fund, including the benefits of investing in a fund that is part of a large family of funds offering a variety of investment disciplines and providing a large variety of mutual fund investor services. The Board noted that Fidelity had taken, or had made recommendations that resulted in the Fidelity funds taking, a number of actions over the previous year that benefited particular funds, including (i) continuing to dedicate additional resources to investment research and to the support of the senior management team that oversees asset management; (ii) persisting in efforts to enhance Fidelity's global research capabilities; (iii) launching new funds and making other enhancements to meet client needs for global and income-oriented solutions; (iv) continuing to launch dedicated lower cost underlying funds to meet portfolio construction needs related to expanding underlying fund options for Fidelity funds of funds, specifically for the Freedom Fund product lines; (v) rationalizing product lines and gaining increased efficiencies through the mergers of several funds into other funds; (vi) strengthening Fidelity's index fund offerings by reducing investment minimums and adopting or lowering existing expense caps for certain funds and classes; (vii) enhancing Global Asset Allocation product offerings by launching new funds and strategies, including "open architecture" target date funds that utilize affiliated and unaffiliated sub-advisers; (viii) modifying the eligibility criteria for Institutional Class shares of Advisor funds to increase their marketability to a portion of the defined contribution plan market; (ix) creating a new low-cost retirement share class for certain Advisor funds to appeal to large retirement plans; (x) transitioning the management of certain Fidelity commodity funds to Geode Capital Management LLC, a registered commodity pool operator, while retaining administrative responsibilities for the funds; (xi) reorganizing a number of funds; and (xii) taking steps toward establishing a new Fidelity adviser to manage sector-based funds and products.
Investment Performance. The Board considered whether the fund has operated in accordance with its investment objective, as well as its record of compliance with its investment restrictions and its performance history.
The Board took into account discussions with the Investment Advisers about fund investment performance that occur at Board meetings throughout the year. In this regard the Board noted that as part of regularly scheduled fund reviews and other reports to the Board on fund performance, the Board periodically considers annualized return information for the fund, for different time periods, measured against a securities market index ("benchmark index") and a peer group of mutual funds with similar objectives ("peer group"). In its evaluation of fund investment performance, the Board gave particular attention to information indicating changes in performance of certain Fidelity funds for specific time periods and the Investment Advisers' explanations for any overperformance or underperformance.
Annual Report
Board Approval of Investment Advisory Contracts and
Management Fees - continued
In addition to reviewing absolute and relative fund performance, the Independent Trustees periodically consider the appropriateness of fund performance metrics in evaluating the results achieved. In general, the Independent Trustees believe that fund performance should be evaluated based on net performance (after fees and expenses) of both the highest performing and lowest performing classes, where applicable, compared to appropriate benchmark indices, over appropriate time periods which may include full market cycles, and compared to peer groups, as applicable, over the same periods, taking into account relevant factors including the following: general market conditions; issuer-specific information; tactical opportunities for investment; and fund cash flows and other factors.
The Independent Trustees recognize that shareholders evaluate performance on a net basis over their own holding periods, for which one-, three-, and five-year periods are used as a proxy. For this reason, the performance information reviewed by the Board also included net cumulative calendar year total return information for the fund and an appropriate benchmark index and peer group for the most recent one-, three-, and five-year periods, as shown below. Returns are shown compared to the 25th percentile (top of box) and 75th percentile (bottom of box) of the peer universe. Returns of the benchmark index are "net MA," i.e., adjusted for tax withholding rates applicable to U.S.-based mutual funds organized as Massachusetts business trusts.
Annual Report
Fidelity International Growth Fund
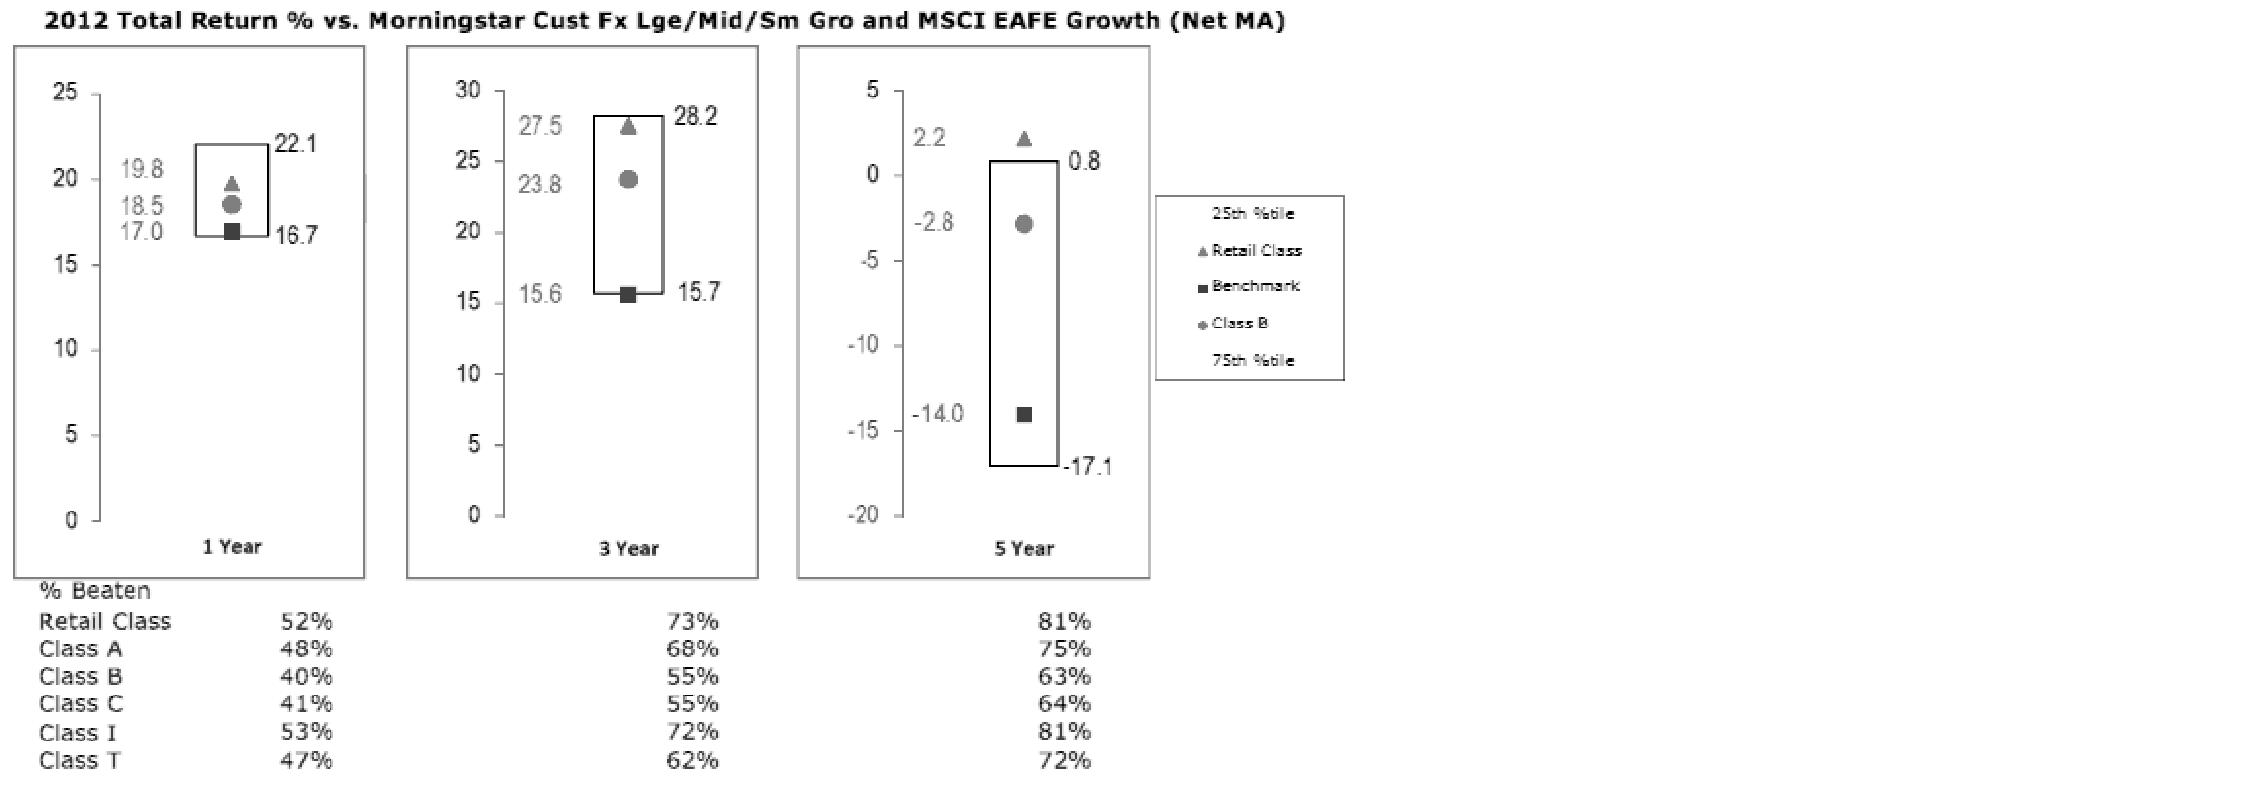
The Board also considered that the fund's management fee is subject to upward or downward adjustment depending upon whether, and to what extent, the fund's investment performance for the performance period exceeds, or is exceeded by, a securities index, thus leading to a performance adjustment for the same period. The Board noted that the performance adjustment provides FMR with a strong economic incentive to seek to achieve superior performance for the fund's shareholders and helps to more closely align the interests of FMR and the fund's shareholders.
Based on its review, the Board concluded that the nature, extent, and quality of services provided to the fund under the Advisory Contracts should benefit the fund's shareholders.
Competitiveness of Management Fee and Total Expense Ratio. The Board considered the fund's management fee and total expense ratio compared to "mapped groups" of competitive funds and classes. Fidelity creates "mapped groups" by combining similar Lipper investment objective categories that have comparable management fee characteristics. Combining Lipper investment objective categories aids the Board's management fee and total expense ratio comparisons by broadening the competitive group used for comparison and by reducing the number of universes to which various Fidelity funds are compared.
Management Fee. The Board considered two proprietary management fee comparisons for the 12-month periods shown in the chart below. The group of Lipper funds used by the Board for management fee comparisons is referred to below as the "Total Mapped Group." The Total Mapped Group comparison focuses on a fund's standing in terms of gross management fees before expense reimbursements or caps, and without giving effect to the fund's performance adjustment, relative to the total universe of funds with comparable investment mandates, regardless of whether their management fee structures also are comparable. Funds with comparable investment mandates offer exposure to similar types of securities. Funds with comparable management fee structures have similar management fee contractual arrangements (e.g., flat rate charged for advisory services, all-inclusive fee rate, etc.). "TMG %" represents the percentage of funds in the Total Mapped Group that had management fees that were lower than the fund's. For example, a TMG % of 16% means that 84% of the funds in the Total Mapped Group had higher management fees than the fund. The "Asset-Size Peer Group" (ASPG) comparison focuses on a fund's standing relative to a subset of non-Fidelity funds within the Total Mapped Group that are similar in size and management fee structure. The ASPG represents at least 15% of the funds in the Total Mapped Group with comparable asset size and management fee structures, subject to a minimum of 50 funds (or all funds in the Total Mapped Group if fewer than 50). Additional information, such as the ASPG quartile in which the fund's management fee ranked and the impact of the fund's performance adjustment, is also included in the chart and considered by the Board.
Annual Report
Board Approval of Investment Advisory Contracts and
Management Fees - continued
Fidelity International Growth Fund

The Board noted that the fund's management fee ranked below the median of its Total Mapped Group and below the median of its ASPG for 2012. The Board also noted the effect of the fund's positive performance adjustment on the fund's management fee ranking.
Annual Report
Based on its review, the Board concluded that the fund's management fee is fair and reasonable in light of the services that the fund receives and the other factors considered.
Total Expense Ratio. In its review of each class's total expense ratio, the Board considered the fund's management fee as well as other fund or class expenses, as applicable, such as transfer agent fees, pricing and bookkeeping fees, fund-paid 12b-1 fees, and custodial, legal, and audit fees. The Board also noted the effects of any waivers and reimbursements on fees and expenses, as well as the impact of the fund's performance adjustment. As part of its review, the Board also considered the current and historical total expense ratios of each class of the fund compared to competitive fund median expenses. Each class of the fund is compared to those funds and classes in the Total Mapped Group (used by the Board for management fee comparisons) that have a similar sales load structure.
The Board noted that the total expense ratio of each of Class A and the retail class ranked below its competitive median for 2012 and the total expense ratio of each of Class T, Class B, Class C, and Institutional Class ranked above its competitive median for 2012. The Board considered that, in general, various factors can affect total expense ratios. The Board noted that the total expense ratio of Class T was above the competitive median primarily because of higher 12b-1 fees on Class T. Class T has a higher 12b-1 fee, but a lower front-end sales charge, than traditionally priced front-end sales charge classes. The Board considered that Class T is primarily sold load-waived in the retirement plan market where its 0.50% 12b-1 fee is comparable to competing no-load, higher 12b-1 fee classes designed specifically for retirement plans. The Board noted that the fund offers multiple classes, each of which has a different sales load and 12b-1 fee structure, and that the multiple structures are intended to offer a range of pricing options for the intermediary market. The Board also noted that the total expense ratios of the classes vary primarily by the level of their 12b-1 fees, although differences in transfer agent fees may also cause expenses to vary from class to class.
The Board further considered that FMR contractually agreed to reimburse Class A, Class T, Class B, Class C, Institutional Class, and the retail class of the fund to the extent that total operating expenses (excluding interest, taxes, certain securities lending costs, brokerage commissions, extraordinary expenses, and acquired fund fees and expenses, if any), as a percentage of their respective average net assets, exceed 1.45%, 1.70%, 2.20%, 2.20%, 1.20%, and 1.20% through December 31, 2013.
Fees Charged to Other Fidelity Clients. The Board also considered Fidelity fee structures and other information with respect to clients of FMR and its affiliates, such as other mutual funds advised or subadvised by FMR or its affiliates, pension plan clients, and other institutional clients. The Board noted the findings of the 2013 ad hoc joint committee (created with the board of other Fidelity funds), which reviewed and compared Fidelity's institutional investment advisory business with its business of providing services to the Fidelity funds, including the differences in services provided, fees charged, and costs incurred, as well as competition in their respective marketplaces.
Annual Report
Board Approval of Investment Advisory Contracts and
Management Fees - continued
Based on its review of total expense ratios and fees charged to other Fidelity clients, the Board concluded that the total expense ratio of each class of the fund was reasonable, although in some cases above the median of the universe presented for comparison, in light of the services that the fund and its shareholders receive and the other factors considered.
Costs of the Services and Profitability. The Board considered the revenues earned and the expenses incurred by Fidelity in conducting the business of developing, marketing, distributing, managing, administering and servicing the fund and servicing the fund's shareholders. The Board also considered the level of Fidelity's profits in respect of all the Fidelity funds.
On an annual basis, FMR presents to the Board Fidelity's profitability for the fund. Fidelity calculates the profitability for each fund, as well as aggregate profitability for groups of Fidelity funds and all Fidelity funds, using a series of detailed revenue and cost allocation methodologies which originate with the books and records of Fidelity on which Fidelity's audited financial statements are based. The Audit Committee of the Board reviews any significant changes from the prior year's methodologies.
PricewaterhouseCoopers LLP (PwC), independent registered public accounting firm and auditor to Fidelity and certain Fidelity funds, has been engaged annually by the Board as part of the Board's assessment of Fidelity's profitability analysis. PwC's engagement includes the review and assessment of the methodologies used by Fidelity in determining the revenues and expenses attributable to Fidelity's mutual fund business, and completion of agreed-upon procedures surrounding the mathematical accuracy of fund profitability and its conformity to allocation methodologies. After considering PwC's reports issued under the engagement and information provided by Fidelity, the Board concluded that while other allocation methods may also be reasonable, Fidelity's profitability methodologies are reasonable in all material respects.
The Board also reviewed Fidelity's non-fund businesses and fall-out benefits related to the mutual fund business as well as cases where Fidelity's affiliates may benefit from or be related to the fund's business.
The Board considered the costs of the services provided by and the profits realized by Fidelity in connection with the operation of the fund and was satisfied that the profitability was not excessive in the circumstances.
Economies of Scale. The Board considered whether there have been economies of scale in respect of the management of the Fidelity funds, whether the Fidelity funds (including the fund) have appropriately benefited from any such economies of scale, and whether there is potential for realization of any further economies of scale. The Board considered the extent to which the fund will benefit from economies of scale through increased services to the fund, through waivers or reimbursements, or through fee or expense reductions. The Board also noted that in 2009, it and the board of other Fidelity funds created an ad hoc committee (the Economies of Scale Committee) to analyze whether FMR attains economies of scale in respect of the management and servicing of the Fidelity funds, whether the Fidelity funds have appropriately benefited from such economies of scale, and whether there is potential for realization of any further economies of scale.
Annual Report
The Board recognized that the fund's management contract incorporates a "group fee" structure, which provides for lower group fee rates as total fund assets under FMR's management increase, and for higher group fee rates as total fund assets under FMR's management decrease. FMR calculates the group fee rates based on a tiered asset "breakpoint" schedule that varies based on asset class. The Board considered that the group fee is designed to deliver the benefits of economies of scale to fund shareholders when total Fidelity fund assets increase, even if assets of any particular fund are unchanged or have declined, because some portion of Fidelity's costs are attributable to services provided to all Fidelity funds, and all funds benefit if those costs can be allocated among more assets. The Board concluded that, given the group fee structure, fund shareholders will benefit from lower management fees as assets under FMR's management increase at the fund complex level, regardless of whether Fidelity achieves any such economies of scale.
The Board concluded, taking into account the analysis of the Economies of Scale Committee, that economies of scale, if any, are being appropriately shared between fund shareholders and Fidelity.
Amendment to Description of Group Fee Rate. At its July 2013 meeting, the Board voted to approve an amendment to the fund's management contract to modify the description of the "group fee rate" effective August 1, 2013. The Board noted that under the prior description in the contract, the group fee rate was based on the average net assets of all registered investment companies with which FMR has management contracts. Under the contract's tiered asset breakpoint schedule, the group fee rate is lower as total fund assets under FMR's management increase, and higher as total fund assets under FMR's management decrease. The Board considered that the prior description would have excluded the assets of 64 Fidelity sector funds from the group fee rate calculation once Fidelity SelectCo, LLC, an affiliate of FMR, assumed management responsibilities for those funds. The Board noted that modifying the description of the group fee rate to continue to include the assets of those 64 funds for purposes of determining group fee rate breakpoints would avoid an immediate adverse impact on the group fee rate for any fund.
Annual Report
Board Approval of Investment Advisory Contracts and
Management Fees - continued
Additional Information Requested by the Board. In order to develop fully the factual basis for consideration of the Fidelity funds' Advisory Contracts, the Board requested and received additional information on certain topics, including: (i) fund performance trends and Fidelity's long-term strategies for certain funds; (ii) the potential to further rationalize the Fidelity fund lineup with the possibility of achieving savings for the funds and Fidelity; (iii) the methodology with respect to competitive fund data and peer group classifications; (iv) the arrangements with, and performance of, certain sub-advisers on behalf of the Fidelity funds, as well as certain proposed participating affiliate arrangements; (v) the realization of fall-out benefits in certain Fidelity business units; (vi) Fidelity's group fee structures, including the rationale for the individual fee rates of certain categories of funds and the definition of group assets; (vii) trends regarding industry use of performance fee structures and the performance adjustment methodologies applicable to the Fidelity funds; (viii) additional competitive analysis regarding the total expenses for certain classes; and (ix) fund profitability methodology, including Fidelity's cost allocation methodology, and the impact of certain factors on fund profitability results.
Based on its evaluation of all of the conclusions noted above, and after considering all factors it believed relevant, the Board ultimately concluded that the advisory fee structures are fair and reasonable, and that the fund's Advisory Contracts should be renewed.
Annual Report
Investment Adviser
Fidelity Management & Research Company
Boston, MA
Investment Sub-Advisers
FMR Co., Inc.
Fidelity Management & Research
(U.K.) Inc.
Fidelity Management & Research
(Hong Kong) Limited
Fidelity Management & Research
(Japan) Inc.
FIL Investment Advisors
FIL Investments (Japan) Limited
FIL Investment Advisors (UK) Limited
General Distributor
Fidelity Distributors Corporation
Smithfield, RI
Transfer and Service Agents
Fidelity Investments Institutional Operations Company, Inc.
Boston, MA
Fidelity Service Company, Inc.
Boston, MA
Custodian
State Street Bank and Trust Company
Quincy, MA
(Fidelity Investment logo)(registered trademark)
AIGF-UANN-1213
1.853348.105
(Fidelity Investment logo)(registered trademark)
Fidelity Advisor®
International Growth
Fund - Institutional Class
Annual Report
October 31, 2013
(Fidelity Cover Art)
Institutional Class is
a class of Fidelity®
International Growth Fund
Contents
Performance | (Click Here) | How the fund has done over time. |
Management's Discussion of Fund Performance | (Click Here) | The Portfolio Manager's review of fund performance and strategy. |
Shareholder Expense Example | (Click Here) | An example of shareholder expenses. |
Investment Changes | (Click Here) | A summary of major shifts in the fund's investments over the past six months. |
Investments | (Click Here) | A complete list of the fund's investments with their market values. |
Financial Statements | (Click Here) | Statements of assets and liabilities, operations, and changes in net assets, as well as financial highlights. |
Notes | (Click Here) | Notes to financial statements. |
Report of Independent Registered Public Accounting Firm | (Click Here) | |
Trustees and Officers | (Click Here) | |
Distributions | (Click Here) | |
Board Approval of Investment Advisory Contracts and Management Fees | (Click Here) | |
To view a fund's proxy voting guidelines and proxy voting record for the 12-month period ended June 30, visit http://www.fidelity.com/proxyvotingresults or visit the Securities and Exchange Commission's (SEC) web site at http://www.sec.gov. You may also call 1-877-208-0098 to request a free copy of the proxy voting guidelines.
Standard & Poor's, S&P and S&P 500 are registered service marks of The McGraw-Hill Companies, Inc. and have been licensed for use by Fidelity Distributors Corporation.
Other third-party marks appearing herein are the property of their respective owners.
All other marks appearing herein are registered or unregistered trademarks or service marks of FMR LLC or an affiliated company. © 2013 FMR LLC. All rights reserved.
Annual Report
This report and the financial statements contained herein are submitted for the general information of the shareholders of the fund. This report is not authorized for distribution to prospective investors in the fund unless preceded or accompanied by an effective prospectus.
A fund files its complete schedule of portfolio holdings with the SEC for the first and third quarters of each fiscal year on Form N-Q. Forms N-Q are available on the SEC's web site at http://www.sec.gov. A fund's Forms N-Q may be reviewed and copied at the SEC's Public Reference Room in Washington, DC. Information regarding the operation of the SEC's Public Reference Room may be obtained by calling 1-800-SEC-0330. For a complete list of a fund's portfolio holdings, view the most recent holdings listing, semiannual report, or annual report on Fidelity's web site at http://www.fidelity.com, http://www.advisor.fidelity.com, or http://www.401k.com, as applicable.
NOT FDIC INSURED • MAY LOSE VALUE • NO BANK GUARANTEE
Neither the fund nor Fidelity Distributors Corporation is a bank.
Annual Report
Average annual total return reflects the change in the value of an investment, assuming reinvestment of the class' distributions from dividend income and capital gains (the profits earned upon the sale of securities that have grown in value, if any) and assuming a constant rate of performance each year. The $10,000 table and the fund's returns do not reflect the deduction of taxes that a shareholder would pay on fund distributions or the redemption of fund shares. During periods of reimbursement by Fidelity, a fund's total return will be greater than it would be had the reimbursement not occurred. How a fund did yesterday is no guarantee of how it will do tomorrow.
Average Annual Total Returns
Periods ended October 31, 2013 | Past 1
year | Past 5
years | Life of
fund A |
Institutional Class | 22.66% | 15.88% | 2.29% |
A From November 1, 2007.
$10,000 Over Life of Fund
Let's say hypothetically that $10,000 was invested in Fidelity Advisor® International Growth Fund - Institutional Class on November 1, 2007, when the fund started. The chart shows how the value of your investment would have changed, and also shows how the MSCI® EAFE® Growth Index performed over the same period.
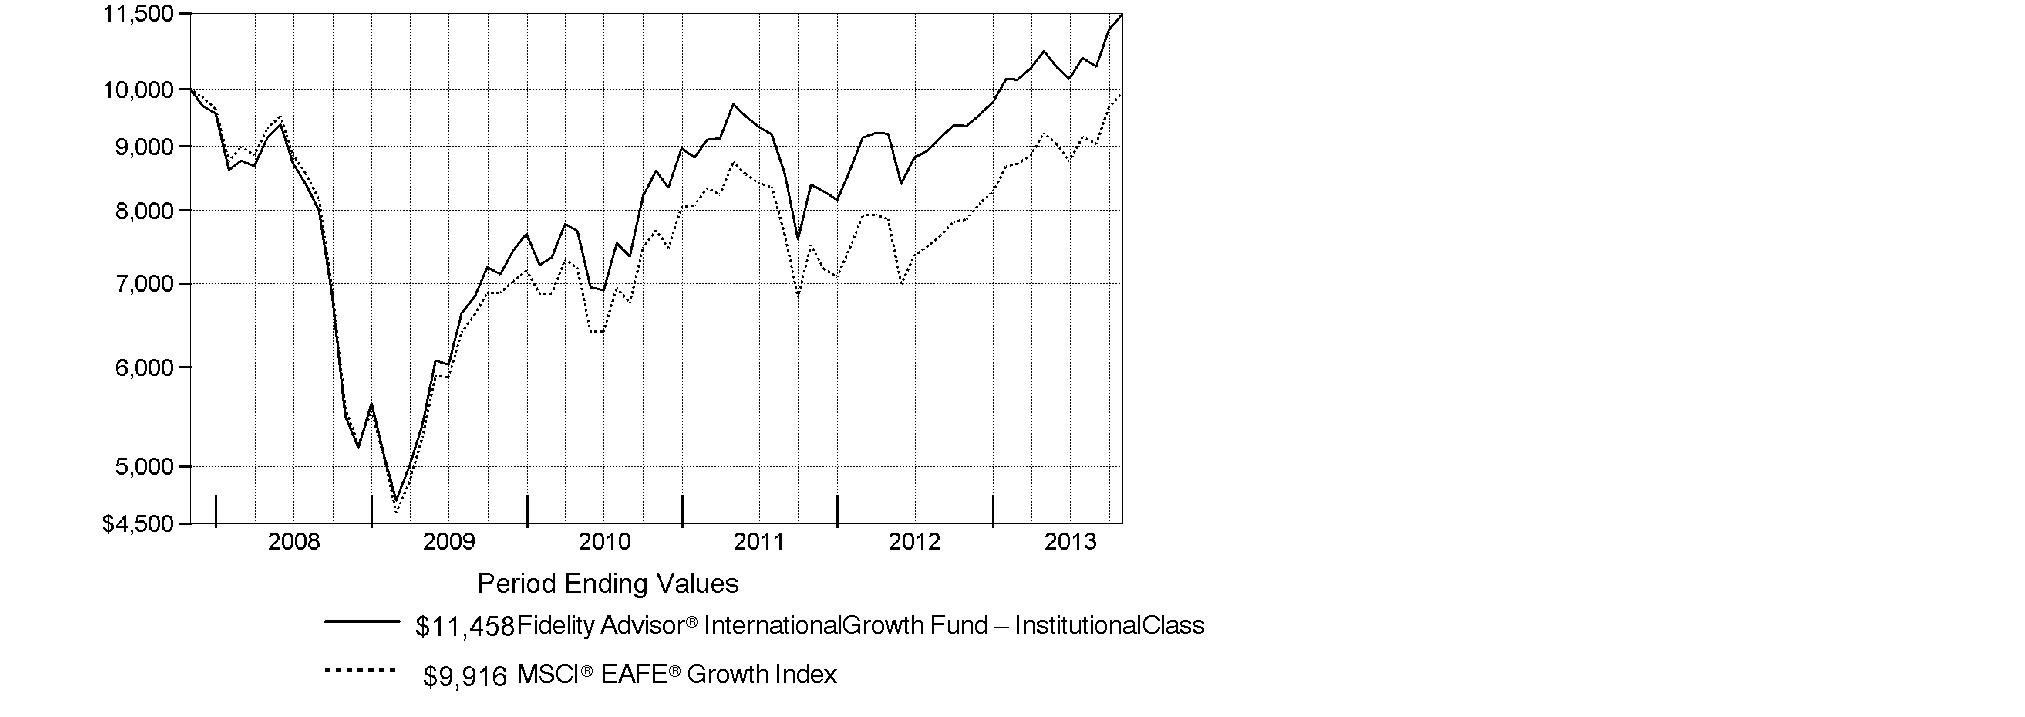
Annual Report
Market Recap: On balance, global equity markets remained upbeat for the 12-month period ending October 31, 2013. The MSCI® ACWI® (All Country World Index) Index gained 23.75% for the period, amid investor preference for higher-risk assets. The period was not without turbulence, however. In the spring and summer, central banks worldwide, especially in the U.S. and China, made clear their intentions to maintain accommodative monetary policies. That stance, combined with modest cyclical improvements around the globe and generally low valuations, underpinned the broad rally in equities. Europe (+32%) shone brightly, with most markets in the region - large and small - registering solid, index-beating gains. Another bright spot was Japan, which, despite a struggling yen and taking a second-half breather, posted a 34% result for the full year. The U.S. - by far the index's biggest constituent - also outperformed the global market with a roughly 28% advance. Meanwhile, Asia-Pacific ex Japan (+14%) lagged, hurt in part by a slowdown in Australia's mining industry as well as currency headwinds. Foreign-exchange and commodity weakness also curbed results in resource-heavy Canada and emerging markets (EM), both of which were up 7%. Country-level EM performance diverged meaningfully for the period, as evidenced by performance in Brazil (-1%), Russia (+12%), India (+1%) and China (+8%).
Comments from Jed Weiss, Portfolio Manager of Fidelity Advisor® International Growth Fund: For the year, the fund's Institutional Class shares gained 22.66%, trailing the 26.07% advance of the MSCI® EAFE® Growth Index. Versus the index, picks in emerging markets were a big detractor. A combination of underweighting in Europe and disappointing security selection here also hurt, even as Dutch semiconductor equipment company ASML Holding made an outsized individual contribution. Stock picking in Canada detracted, with out-of-index mining companies Goldcorp and Agnico Eagle Mines suffering from falling gold prices. I ultimately sold both stocks. A moderate cash position also curbed performance in an up market. On the positive side, stock picking in Hong Kong was helpful - especially positions in casino gaming companies Sands China and Wynn Macau - as was underweighting poor-performing Australia. Another contributor was the fund's out-of-benchmark holdings in companies headquartered in the U.S. but doing all or most of their business abroad. In strong-performing Japan, the impact was mixed, with a detrimental underweighting but favorable stock picking. In this market, the fund's biggest individual detractor was automaker Toyota Motor. Instead of owning this outperforming benchmark component, we held DENSO, a parts supplier whose largest customer is Toyota and whose strong performance tempered the latter's negative relative impact.
The views expressed above reflect those of the portfolio manager(s) only through the end of the period as stated on the cover of this report and do not necessarily represent the views of Fidelity or any other person in the Fidelity organization. Any such views are subject to change at any time based upon market or other conditions and Fidelity disclaims any responsibility to update such views. These views may not be relied on as investment advice and, because investment decisions for a Fidelity fund are based on numerous factors, may not be relied on as an indication of trading intent on behalf of any Fidelity fund.
Annual Report
Shareholder Expense Example
As a shareholder of the Fund, you incur two types of costs: (1) transaction costs, including sales charges (loads) on purchase payments or redemption proceeds, redemption fees and (2) ongoing costs, including management fees, distribution and/or service (12b-1) fees and other Fund expenses. This Example is intended to help you understand your ongoing costs (in dollars) of investing in the Fund and to compare these costs with the ongoing costs of investing in other mutual funds.
The actual expense Example is based on an investment of $1,000 invested at the beginning of the period and held for the entire period (May 1, 2013 to October 31, 2013) for Class A, Class T, Class B, Class C, International Growth and Institutional Class and for the period (August 13, 2013 to October 31, 2013) for Class Z. The hypothetical expense Example is based on an investment of $1,000 invested for the one-half year period (May 1, 2013 to October 31, 2013).
Actual Expenses
The first line of the accompanying table for each class of the Fund provides information about actual account values and actual expenses. You may use the information in this line, together with the amount you invested, to estimate the expenses that you paid over the period. Simply divide your account value by $1,000.00 (for example, an $8,600 account value divided by $1,000.00 = 8.6), then multiply the result by the number in the first line for a class of the Fund under the heading entitled "Expenses Paid During Period" to estimate the expenses you paid on your account during this period. A small balance maintenance fee of $12.00 that is charged once a year may apply for certain accounts with a value of less than $2,000. This fee is not included in the table below. If it was, the estimate of expenses you paid during the period would be higher, and your ending account value lower, by this amount. In addition, the Fund, as a shareholder in the underlying Fidelity Central Funds, will indirectly bear its pro-rata share of the fees and expenses incurred by the underlying Fidelity Central Funds. These fees and expenses are not included in the Fund's annualized expense ratio used to calculate the expense estimate in the table below.
Hypothetical Example for Comparison Purposes
The second line of the accompanying table for each class of the Fund provides information about hypothetical account values and hypothetical expenses based on a Class' actual expense ratio and an assumed rate of return of 5% per year before expenses, which is not the Class' actual return. The hypothetical account values and expenses may not be used to estimate the actual ending account balance or expenses you paid for the period. You may use this information to compare the ongoing costs of investing in the Fund and other funds. To do so, compare this 5% hypothetical example with the 5% hypothetical examples that appear in the shareholder reports of the other funds. A small balance maintenance fee of $12.00 that is charged once a year may apply for certain accounts with a value of less than $2,000. This fee is not included in the table below. If it was, the estimate of expenses you paid during the period would be higher, and your ending account value lower, by this amount. In addition, the Fund, as a shareholder in the underlying Fidelity Central Funds, will indirectly bear its pro-rata share of the fees and expenses incurred by the underlying Fidelity Central Funds. These fees and expenses are not included in the Fund's annualized expense ratio used to calculate the expense estimate in the table below.
Annual Report
Shareholder Expense Example - continued
Please note that the expenses shown in the table are meant to highlight your ongoing costs only and do not reflect any transaction costs. Therefore, the second line of the table is useful in comparing ongoing costs only, and will not help you determine the relative total costs of owning different funds. In addition, if these transactional costs were included, your costs would have been higher.
| Annualized
Expense Ratio B | Beginning
Account Value | Ending
Account Value
October 31, 2013 | Expenses Paid
During Period |
Class A | 1.44% | | | |
Actual | | $ 1,000.00 | $ 1,067.30 | $ 7.50 C |
Hypothetical A | | $ 1,000.00 | $ 1,017.95 | $ 7.32 D |
Class T | 1.70% | | | |
Actual | | $ 1,000.00 | $ 1,066.50 | $ 8.85 C |
Hypothetical A | | $ 1,000.00 | $ 1,016.64 | $ 8.64 D |
Class B | 2.18% | | | |
Actual | | $ 1,000.00 | $ 1,063.40 | $ 11.34 C |
Hypothetical A | | $ 1,000.00 | $ 1,014.22 | $ 11.07 D |
Class C | 2.18% | | | |
Actual | | $ 1,000.00 | $ 1,063.70 | $ 11.34 C |
Hypothetical A | | $ 1,000.00 | $ 1,014.22 | $ 11.07 D |
International Growth | 1.11% | | | |
Actual | | $ 1,000.00 | $ 1,069.00 | $ 5.79 C |
Hypothetical A | | $ 1,000.00 | $ 1,019.61 | $ 5.65 D |
Institutional Class | 1.11% | | | |
Actual | | $ 1,000.00 | $ 1,069.00 | $ 5.79 C |
Hypothetical A | | $ 1,000.00 | $ 1,019.61 | $ 5.65 D |
Class Z | .94% | | | |
Actual | | $ 1,000.00 | $ 1,056.50 | $ 2.12 C |
Hypothetical A | | $ 1,000.00 | $ 1,020.47 | $ 4.79 D |
A 5% return per year before expenses
B Annualized expense ratio reflects expenses net of applicable fee waivers.
C Actual expenses are equal to each Class' annualized expense ratio, multiplied by the average account value over the period, multiplied by 184/365 (to reflect the one-half year period) for Class A, Class T, Class B, Class C, International Growth and Institutional Class and multiplied by 80/365 (to reflect the period August 13, 2013 to October 31, 2013) for Class Z. The fees and expenses of the underlying Fidelity Central Funds in which the Fund invests are not included in each Class' annualized expense ratio.
Annual Report
D Hypothetical expenses are equal to each Class' annualized expense ratio, multiplied by the average account value over the period, multiplied by 184/365 (to reflect the one-half year period). The fees and expenses of the underlying Fidelity Central Funds in which the Fund invests are not included in each Class' annualized expense ratio.
Annual Report
Investment Changes (Unaudited)
Geographic Diversification (% of fund's net assets) |
As of October 31, 2013 |
 | United Kingdom 17.6% | |
 | Japan 16.6% | |
 | United States of America* 14.9% | |
 | Switzerland 12.4% | |
 | Sweden 5.7% | |
 | Belgium 4.8% | |
 | Germany 4.4% | |
 | Australia 3.2% | |
 | France 3.2% | |
 | Other 17.2% | |

Percentages are based on country or territory of incorporation and are adjusted for the effect of futures contracts, if applicable. |
* Includes Short-Term Investments and Net Other Assets (Liabilities). |
As of April 30, 2013 |
| United Kingdom 18.3% | |
| United States of America* 16.4% | |
| Japan 12.5% | |
| Switzerland 10.7% | |
| Sweden 5.4% | |
| Belgium 4.5% | |
| France 4.0% | |
| Australia 3.8% | |
| Germany 3.1% | |
| Other 21.3% | |

Percentages are based on country or territory of incorporation and are adjusted for the effect of futures contracts, if applicable. |
* Includes Short-Term Investments and Net Other Assets (Liabilities). |
Asset Allocation as of October 31, 2013 |
| % of fund's
net assets | % of fund's net assets
6 months ago |
Stocks | 97.9 | 98.6 |
Short-Term Investments and Net Other Assets (Liabilities) | 2.1 | 1.4 |
Top Ten Stocks as of October 31, 2013 |
| % of fund's
net assets | % of fund's net assets
6 months ago |
Nestle SA (Switzerland, Food Products) | 4.3 | 5.2 |
Anheuser-Busch InBev SA NV (Belgium, Beverages) | 3.5 | 3.6 |
Roche Holding AG (participation certificate) (Switzerland, Pharmaceuticals) | 3.3 | 2.5 |
DENSO Corp. (Japan, Auto Components) | 3.0 | 2.2 |
UBS AG (NY Shares) (Switzerland, Capital Markets) | 2.2 | 1.9 |
Linde AG (Germany, Chemicals) | 2.2 | 2.3 |
Keyence Corp. (Japan, Electronic Equipment & Components) | 2.0 | 1.3 |
Prudential PLC (United Kingdom, Insurance) | 1.9 | 0.0 |
SABMiller PLC (United Kingdom, Beverages) | 1.8 | 2.1 |
Novo Nordisk A/S Series B sponsored ADR (Denmark, Pharmaceuticals) | 1.8 | 2.5 |
| 26.0 | |
Market Sectors as of October 31, 2013 |
| % of fund's
net assets | % of fund's net assets
6 months ago |
Consumer Staples | 19.7 | 24.3 |
Consumer Discretionary | 17.1 | 16.2 |
Financials | 15.0 | 11.3 |
Industrials | 14.3 | 15.1 |
Health Care | 11.9 | 11.2 |
Materials | 7.7 | 10.4 |
Information Technology | 7.5 | 6.7 |
Energy | 3.0 | 3.4 |
Telecommunication Services | 1.7 | 0.0 |
Annual Report
Investments October 31, 2013
Showing Percentage of Net Assets
Common Stocks - 97.9% |
| Shares | | Value |
Australia - 3.2% |
Coca-Cola Amatil Ltd. | 391,434 | | $ 4,772,534 |
CSL Ltd. | 141,073 | | 9,266,793 |
Sydney Airport unit | 643,558 | | 2,548,605 |
Transurban Group unit | 347,528 | | 2,332,109 |
TOTAL AUSTRALIA | | 18,920,041 |
Austria - 1.1% |
Andritz AG | 103,997 | | 6,406,331 |
Bailiwick of Jersey - 0.5% |
Informa PLC | 301,577 | | 2,705,454 |
Belgium - 4.8% |
Anheuser-Busch InBev SA NV | 197,091 | | 20,431,189 |
KBC Groupe SA | 83,619 | | 4,558,378 |
Umicore SA | 64,664 | | 3,084,767 |
TOTAL BELGIUM | | 28,074,334 |
Bermuda - 0.4% |
Lazard Ltd. Class A | 65,192 | | 2,519,671 |
Cayman Islands - 2.6% |
Sands China Ltd. | 1,287,200 | | 9,148,036 |
Wynn Macau Ltd. | 1,650,400 | | 6,332,955 |
TOTAL CAYMAN ISLANDS | | 15,480,991 |
Denmark - 1.8% |
Novo Nordisk A/S Series B sponsored ADR | 62,800 | | 10,466,876 |
Finland - 0.9% |
Nokian Tyres PLC | 100,408 | | 5,080,980 |
France - 3.2% |
Danone SA | 80,652 | | 5,981,177 |
Remy Cointreau SA | 26,787 | | 2,643,375 |
Safran SA | 94,400 | | 6,033,678 |
Sanofi SA | 38,874 | | 4,144,872 |
TOTAL FRANCE | | 18,803,102 |
Germany - 4.4% |
Bayer AG | 65,700 | | 8,165,750 |
Deutsche Bank AG | 51,320 | | 2,480,253 |
Deutsche Bank AG (NY Shares) | 800 | | 38,656 |
Linde AG | 67,141 | | 12,757,939 |
Siemens AG sponsored ADR | 20,000 | | 2,560,200 |
TOTAL GERMANY | | 26,002,798 |
Common Stocks - continued |
| Shares | | Value |
India - 0.3% |
Housing Development Finance Corp. Ltd. | 133,476 | | $ 1,852,016 |
Ireland - 1.7% |
CRH PLC sponsored ADR | 185,366 | | 4,537,760 |
James Hardie Industries PLC: | | | |
CDI | 35,635 | | 368,127 |
sponsored ADR (d) | 96,000 | | 4,999,680 |
TOTAL IRELAND | | 9,905,567 |
Israel - 0.3% |
Azrieli Group | 44,900 | | 1,443,930 |
Italy - 0.9% |
Interpump Group SpA | 160,651 | | 1,788,616 |
Prada SpA | 325,300 | | 3,172,021 |
TOTAL ITALY | | 4,960,637 |
Japan - 16.6% |
AEON Mall Co. Ltd. | 101,810 | | 2,891,503 |
Aozora Bank Ltd. | 861,000 | | 2,502,957 |
Autobacs Seven Co. Ltd. | 60,100 | | 876,287 |
DENSO Corp. | 366,500 | | 17,617,075 |
East Japan Railway Co. | 16,900 | | 1,468,115 |
Fanuc Corp. | 31,700 | | 5,084,924 |
Fast Retailing Co. Ltd. | 18,300 | | 6,159,998 |
Japan Tobacco, Inc. | 166,700 | | 6,031,820 |
Keyence Corp. | 27,462 | | 11,769,939 |
Mitsui Fudosan Co. Ltd. | 267,000 | | 8,844,617 |
Nomura Holdings, Inc. | 187,300 | | 1,383,591 |
Seven Bank Ltd. | 808,300 | | 2,860,781 |
Shinsei Bank Ltd. | 1,457,000 | | 3,411,283 |
SHO-BOND Holdings Co. Ltd. | 65,000 | | 3,043,777 |
SoftBank Corp. | 134,600 | | 10,051,781 |
Unicharm Corp. | 54,500 | | 3,500,476 |
USS Co. Ltd. | 458,700 | | 6,717,431 |
Yamato Kogyo Co. Ltd. | 86,100 | | 3,191,228 |
TOTAL JAPAN | | 97,407,583 |
Mexico - 0.3% |
Fomento Economico Mexicano S.A.B. de CV sponsored ADR | 20,755 | | 1,936,442 |
Common Stocks - continued |
| Shares | | Value |
Netherlands - 1.7% |
ASML Holding NV | 56,278 | | $ 5,326,150 |
ING Groep NV (Certificaten Van Aandelen) (a) | 366,557 | | 4,658,106 |
TOTAL NETHERLANDS | | 9,984,256 |
Portugal - 0.8% |
Jeronimo Martins SGPS SA | 265,152 | | 4,899,738 |
South Africa - 0.5% |
Clicks Group Ltd. | 444,126 | | 2,767,285 |
Spain - 1.9% |
Inditex SA (d) | 59,146 | | 9,716,963 |
Prosegur Compania de Seguridad SA (Reg.) | 236,849 | | 1,408,528 |
TOTAL SPAIN | | 11,125,491 |
Sweden - 5.7% |
ASSA ABLOY AB (B Shares) | 138,561 | | 6,878,816 |
Atlas Copco AB (A Shares) | 240,809 | | 6,681,655 |
Fagerhult AB | 49,496 | | 1,520,004 |
H&M Hennes & Mauritz AB (B Shares) | 182,130 | | 7,869,754 |
Intrum Justitia AB | 91,200 | | 2,427,759 |
SKF AB (B Shares) | 153,717 | | 4,072,995 |
Svenska Handelsbanken AB (A Shares) | 72,940 | | 3,304,787 |
Swedish Match Co. AB | 17,272 | | 569,865 |
TOTAL SWEDEN | | 33,325,635 |
Switzerland - 12.4% |
Credit Suisse Group | 74,858 | | 2,328,680 |
Nestle SA | 345,971 | | 24,973,553 |
Novartis AG | 75,374 | | 5,850,725 |
Roche Holding AG (participation certificate) | 70,213 | | 19,438,481 |
Schindler Holding AG: | | | |
(participation certificate) | 25,471 | | 3,612,848 |
(Reg.) | 6,190 | | 880,046 |
Swatch Group AG (Bearer) | 4,040 | | 2,584,692 |
UBS AG (NY Shares) | 661,761 | | 12,811,693 |
TOTAL SWITZERLAND | | 72,480,718 |
Turkey - 1.5% |
Coca-Cola Icecek A/S | 142,997 | | 4,100,978 |
Tupras Turkiye Petrol Rafinelleri A/S | 100,687 | | 2,284,845 |
Turkiye Garanti Bankasi A/S | 640,500 | | 2,579,647 |
TOTAL TURKEY | | 8,965,470 |
Common Stocks - continued |
| Shares | | Value |
United Kingdom - 17.6% |
Babcock International Group PLC | 196,200 | | $ 4,010,985 |
Barclays PLC sponsored ADR (d) | 225,966 | | 3,798,488 |
BG Group PLC | 466,755 | | 9,530,810 |
BHP Billiton PLC ADR (d) | 71,700 | | 4,419,588 |
GlaxoSmithKline PLC sponsored ADR | 175,500 | | 9,236,565 |
InterContinental Hotel Group PLC ADR (d) | 230,330 | | 6,760,186 |
Johnson Matthey PLC | 116,777 | | 5,624,697 |
Prudential PLC | 539,714 | | 11,037,564 |
Reckitt Benckiser Group PLC (d) | 115,645 | | 8,989,413 |
Rexam PLC | 380,064 | | 3,165,805 |
Rolls-Royce Group PLC | 458,237 | | 8,449,478 |
Rotork PLC | 84,800 | | 3,892,773 |
SABMiller PLC | 202,866 | | 10,584,460 |
Serco Group PLC | 345,718 | | 3,087,586 |
Shaftesbury PLC | 154,533 | | 1,471,803 |
Standard Chartered PLC (United Kingdom) | 334,991 | | 8,054,183 |
Unite Group PLC | 197,400 | | 1,253,384 |
TOTAL UNITED KINGDOM | | 103,367,768 |
United States of America - 12.8% |
Autoliv, Inc. | 67,069 | | 5,984,567 |
Berkshire Hathaway, Inc. Class B (a) | 19,184 | | 2,207,695 |
BorgWarner, Inc. | 58,796 | | 6,063,631 |
Cummins, Inc. | 26,082 | | 3,312,936 |
FMC Technologies, Inc. (a) | 49,152 | | 2,484,634 |
Google, Inc. Class A (a) | 2,863 | | 2,950,551 |
KLA-Tencor Corp. | 42,680 | | 2,799,808 |
Martin Marietta Materials, Inc. | 31,700 | | 3,109,453 |
MasterCard, Inc. Class A | 11,450 | | 8,210,795 |
Mead Johnson Nutrition Co. Class A | 76,944 | | 6,283,247 |
Mohawk Industries, Inc. (a) | 22,400 | | 2,966,208 |
National Oilwell Varco, Inc. | 40,272 | | 3,269,281 |
Philip Morris International, Inc. | 43,808 | | 3,904,169 |
PriceSmart, Inc. | 24,500 | | 2,787,855 |
ResMed, Inc. (d) | 60,700 | | 3,140,618 |
Solera Holdings, Inc. | 46,189 | | 2,596,746 |
SS&C Technologies Holdings, Inc. (a) | 66,200 | | 2,601,660 |
Common Stocks - continued |
| Shares | | Value |
United States of America - continued |
Union Pacific Corp. | 16,300 | | $ 2,467,820 |
Visa, Inc. Class A | 39,975 | | 7,861,883 |
TOTAL UNITED STATES OF AMERICA | | 75,003,557 |
TOTAL COMMON STOCKS (Cost $503,021,258) |
573,886,671
|
Nonconvertible Preferred Stocks - 0.0% |
| | | |
United Kingdom - 0.0% |
Rolls-Royce Group PLC Series C
(Cost $61,249) | 37,731,382 | |
60,499
|
Money Market Funds - 5.2% |
| | | |
Fidelity Cash Central Fund, 0.09% (b) | 14,095,092 | | 14,095,092 |
Fidelity Securities Lending Cash Central Fund, 0.09% (b)(c) | 16,477,575 | | 16,477,575 |
TOTAL MONEY MARKET FUNDS (Cost $30,572,667) |
30,572,667
|
TOTAL INVESTMENT PORTFOLIO - 103.1% (Cost $533,655,174) | | 604,519,837 |
NET OTHER ASSETS (LIABILITIES) - (3.1)% | | (18,241,969) |
NET ASSETS - 100% | $ 586,277,868 |
Legend |
(a) Non-income producing |
(b) Affiliated fund that is generally available only to investment companies and other accounts managed by Fidelity Investments. The rate quoted is the annualized seven-day yield of the fund at period end. A complete unaudited listing of the fund's holdings as of its most recent quarter end is available upon request. In addition, each Fidelity Central Fund's financial statements, which are not covered by the Fund's Report of Independent Registered Public Accounting Firm, are available on the SEC's website or upon request. |
(c) Investment made with cash collateral received from securities on loan. |
(d) Security or a portion of the security is on loan at period end. |
Affiliated Central Funds |
Information regarding fiscal year to date income earned by the Fund from investments in Fidelity Central Funds is as follows: |
Fund | Income earned |
Fidelity Cash Central Fund | $ 13,543 |
Fidelity Securities Lending Cash Central Fund | 209,783 |
Total | $ 223,326 |
Other Information |
Categorizations in the Schedule of Investments are based on country or territory of incorporation. |
The following is a summary of the inputs used, as of October 31, 2013, involving the Fund's assets and liabilities carried at fair value. The inputs or methodology used for valuing securities may not be an indication of the risk associated with investing in those securities. For more information on valuation inputs, and their aggregation into the levels used in the tables below, please refer to the Investment Valuation section in the accompanying Notes to Financial Statements. |
Valuation Inputs at Reporting Date: |
Description | Total | Level 1 | Level 2 | Level 3 |
Investments in Securities: | | | | |
Equities: | | | | |
Consumer Discretionary | $ 99,756,238 | $ 68,385,447 | $ 31,370,791 | $ - |
Consumer Staples | 115,157,576 | 60,220,538 | 54,937,038 | - |
Energy | 17,569,570 | 17,569,570 | - | - |
Financials | 88,293,666 | 45,894,331 | 42,399,335 | - |
Health Care | 69,710,680 | 59,715,083 | 9,995,597 | - |
Industrials | 84,031,083 | 74,434,267 | 9,596,816 | - |
Information Technology | 44,117,532 | 32,347,593 | 11,769,939 | - |
Materials | 45,259,044 | 42,067,816 | 3,191,228 | - |
Telecommunication Services | 10,051,781 | - | 10,051,781 | - |
Money Market Funds | 30,572,667 | 30,572,667 | - | - |
Total Investments in Securities: | $ 604,519,837 | $ 431,207,312 | $ 173,312,525 | $ - |
The following is a summary of transfers between Level 1 and Level 2 for the period ended October 31, 2013. Transfers are assumed to have occurred at the beginning of the period, and are primarily attributable to the valuation techniques used for foreign equity securities, as discussed in the accompanying Notes to Financial Statements: |
Transfers | Total |
Level 1 to Level 2 | $ 27,145,883 |
Level 2 to Level 1 | $ 0 |
See accompanying notes which are an integral part of the financial statements.
Annual Report
Statement of Assets and Liabilities
| October 31, 2013 |
| | |
Assets | | |
Investment in securities, at value (including securities loaned of $15,812,983) - See accompanying schedule: Unaffiliated issuers (cost $503,082,507) | $ 573,947,170 | |
Fidelity Central Funds (cost $30,572,667) | 30,572,667 | |
Total Investments (cost $533,655,174) | | $ 604,519,837 |
Cash | | 7,981 |
Receivable for investments sold | | 2,362,573 |
Receivable for fund shares sold | | 3,194,486 |
Dividends receivable | | 767,973 |
Distributions receivable from Fidelity Central Funds | | 6,838 |
Prepaid expenses | | 1,720 |
Other receivables | | 13,074 |
Total assets | | 610,874,482 |
| | |
Liabilities | | |
Payable for investments purchased | $ 7,134,028 | |
Payable for fund shares redeemed | 414,036 | |
Accrued management fee | 337,239 | |
Distribution and service plan fees payable | 38,773 | |
Other affiliated payables | 125,190 | |
Other payables and accrued expenses | 69,773 | |
Collateral on securities loaned, at value | 16,477,575 | |
Total liabilities | | 24,596,614 |
| | |
Net Assets | | $ 586,277,868 |
Net Assets consist of: | | |
Paid in capital | | $ 512,728,833 |
Undistributed net investment income | | 2,476,993 |
Accumulated undistributed net realized gain (loss) on investments and foreign currency transactions | | 210,451 |
Net unrealized appreciation (depreciation) on investments and assets and liabilities in foreign currencies | | 70,861,591 |
Net Assets | | $ 586,277,868 |
See accompanying notes which are an integral part of the financial statements.
Annual Report
Financial Statements - continued
Statement of Assets and Liabilities - continued
| October 31, 2013 |
| | |
Calculation of Maximum Offering Price Class A:
Net Asset Value and redemption price per share ($74,594,798 ÷ 6,919,905 shares) | | $ 10.78 |
| | |
Maximum offering price per share (100/94.25 of $10.78) | | $ 11.44 |
Class T:
Net Asset Value and redemption price per share ($23,117,780 ÷ 2,150,794 shares) | | $ 10.75 |
| | |
Maximum offering price per share (100/96.50 of $10.75) | | $ 11.14 |
Class B:
Net Asset Value and offering price per share ($1,578,643 ÷ 147,175 shares)A | | $ 10.73 |
| | |
Class C:
Net Asset Value and offering price per share ($17,196,098 ÷ 1,608,592 shares)A | | $ 10.69 |
| | |
| | |
International Growth:
Net Asset Value, offering price and redemption price per share ($430,913,552 ÷ 39,735,803 shares) | | $ 10.84 |
| | |
Institutional Class:
Net Asset Value, offering price and redemption price per share ($38,771,323 ÷ 3,577,332 shares) | | $ 10.84 |
| | |
Class Z:
Net Asset Value, offering price and redemption price per share ($105,674 ÷ 9,747 shares) | | $ 10.84 |
A Redemption price per share is equal to net asset value less any applicable contingent deferred sales charge.
See accompanying notes which are an integral part of the financial statements.
Annual Report
Statement of Operations
| Year ended October 31, 2013 |
| | |
Investment Income | | |
Dividends | | $ 8,033,314 |
Interest | | 4 |
Income from Fidelity Central Funds | | 223,326 |
Income before foreign taxes withheld | | 8,256,644 |
Less foreign taxes withheld | | (549,023) |
Total income | | 7,707,621 |
| | |
Expenses | | |
Management fee
Basic fee | $ 2,422,146 | |
Performance adjustment | 192,757 | |
Transfer agent fees | 865,734 | |
Distribution and service plan fees | 312,494 | |
Accounting and security lending fees | 180,016 | |
Custodian fees and expenses | 82,662 | |
Independent trustees' compensation | 1,736 | |
Registration fees | 145,304 | |
Audit | 70,606 | |
Legal | 656 | |
Miscellaneous | 1,779 | |
Total expenses before reductions | 4,275,890 | |
Expense reductions | (61,595) | 4,214,295 |
Net investment income (loss) | | 3,493,326 |
Realized and Unrealized Gain (Loss) Net realized gain (loss) on: | | |
Investment securities: | | |
Unaffiliated issuers | 6,727,492 | |
Foreign currency transactions | 107,488 | |
Futures contracts | (517,867) | |
Total net realized gain (loss) | | 6,317,113 |
Change in net unrealized appreciation (depreciation) on: Investment securities | 60,865,585 | |
Assets and liabilities in foreign currencies | 4,304 | |
Total change in net unrealized appreciation (depreciation) | | 60,869,889 |
Net gain (loss) | | 67,187,002 |
Net increase (decrease) in net assets resulting from operations | | $ 70,680,328 |
See accompanying notes which are an integral part of the financial statements.
Annual Report
Financial Statements - continued
Statement of Changes in Net Assets
| Year ended
October 31,
2013 | Year ended
October 31,
2012 |
Increase (Decrease) in Net Assets | | |
Operations | | |
Net investment income (loss) | $ 3,493,326 | $ 1,377,708 |
Net realized gain (loss) | 6,317,113 | (833,212) |
Change in net unrealized appreciation (depreciation) | 60,869,889 | 11,226,981 |
Net increase (decrease) in net assets resulting
from operations | 70,680,328 | 11,771,477 |
Distributions to shareholders from net investment income | (2,081,336) | (594,738) |
Distributions to shareholders from net realized gain | (113,769) | (48,645) |
Total distributions | (2,195,105) | (643,383) |
Share transactions - net increase (decrease) | 324,915,158 | 115,271,822 |
Redemption fees | 31,216 | 5,972 |
Total increase (decrease) in net assets | 393,431,597 | 126,405,888 |
| | |
Net Assets | | |
Beginning of period | 192,846,271 | 66,440,383 |
End of period (including undistributed net investment income of $2,476,993 and undistributed net investment income of $1,374,430, respectively) | $ 586,277,868 | $ 192,846,271 |
See accompanying notes which are an integral part of the financial statements.
Annual Report
Financial Highlights - Class A
Years ended October 31, | 2013 | 2012 | 2011 | 2010 | 2009 |
Selected Per-Share Data | | | | | |
Net asset value, beginning of period | $ 8.91 | $ 8.09 | $ 8.38 | $ 7.01 | $ 5.46 |
Income from Investment Operations | | | | | |
Net investment income (loss) C | .08 | .08 | .08 | .05 | .05 |
Net realized and unrealized gain (loss) | 1.88 | .81 | (.31) | 1.39 | 1.55 |
Total from investment operations | 1.96 | .89 | (.23) | 1.44 | 1.60 |
Distributions from net investment income | (.08) | (.06) | (.05) | (.05) | (.05) |
Distributions from net realized gain | (.01) | (.01) | (.01) | (.03) | - |
Total distributions | (.09) | (.07) | (.06) | (.07) H | (.05) |
Redemption fees added to paid in capital C, G | - | - | - | - | - |
Net asset value, end of period | $ 10.78 | $ 8.91 | $ 8.09 | $ 8.38 | $ 7.01 |
Total Return A, B | 22.18% | 11.10% | (2.76)% | 20.68% | 29.72% |
Ratios to Average Net Assets D, F | | | | | |
Expenses before reductions | 1.44% | 1.58% | 1.77% | 2.13% | 2.46% |
Expenses net of fee waivers, if any | 1.43% | 1.45% | 1.45% | 1.50% | 1.50% |
Expenses net of all reductions | 1.42% | 1.44% | 1.43% | 1.48% | 1.47% |
Net investment income (loss) | .80% | .99% | .92% | .74% | .85% |
Supplemental Data | | | | | |
Net assets, end of period (000 omitted) | $ 74,595 | $ 21,874 | $ 6,352 | $ 3,084 | $ 1,452 |
Portfolio turnover rate E | 32% | 32% | 68% | 87% | 116% |
A Total returns would have been lower if certain expenses had not been reduced during the applicable periods shown.
B Total returns do not include the effect of the sales charges.
C Calculated based on average shares outstanding during the period.
D Fees and expenses of any underlying Fidelity Central Funds are not included in the Fund's expense ratio. The Fund indirectly bears its proportionate share of the expenses of any underlying Fidelity Central Funds.
E Amount does not include the portfolio activity of any underlying Fidelity Central Funds.
F Expense ratios reflect operating expenses of the class. Expenses before reductions do not reflect amounts reimbursed by the investment adviser or reductions from brokerage service arrangements or reductions from other expense offset arrangements and do not represent the amount paid by the class during periods when reimbursements or reductions occur. Expenses net of fee waivers reflect expenses after reimbursement by the investment adviser but prior to reductions from brokerage service arrangements or other expense offset arrangements. Expenses net of all reductions represent the net expenses paid by the class.
G Amount represents less than $.01 per share.
H Total distributions of $.07 per share is comprised of distributions from net investment income of $.046 and distributions from net realized gain of $.025 per share.
See accompanying notes which are an integral part of the financial statements.
Annual Report
Financial Highlights - Class T
Years ended October 31, | 2013 | 2012 | 2011 | 2010 | 2009 |
Selected Per-Share Data | | | | | |
Net asset value, beginning of period | $ 8.89 | $ 8.08 | $ 8.38 | $ 7.00 | $ 5.45 |
Income from Investment Operations | | | | | |
Net investment income (loss) C | .05 | .06 | .06 | .04 | .03 |
Net realized and unrealized gain (loss) | 1.88 | .81 | (.31) | 1.39 | 1.55 |
Total from investment operations | 1.93 | .87 | (.25) | 1.43 | 1.58 |
Distributions from net investment income | (.07) | (.05) | (.04) | (.02) | (.03) |
Distributions from net realized gain | (.01) | (.01) | (.01) | (.03) | - |
Total distributions | (.07) H | (.06) | (.05) | (.05) | (.03) |
Redemption fees added to paid in capital C, G | - | - | - | - | - |
Net asset value, end of period | $ 10.75 | $ 8.89 | $ 8.08 | $ 8.38 | $ 7.00 |
Total Return A, B | 21.91% | 10.82% | (3.03)% | 20.47% | 29.22% |
Ratios to Average Net Assets D, F | | | | | |
Expenses before reductions | 1.69% | 1.85% | 2.03% | 2.41% | 2.67% |
Expenses net of fee waivers, if any | 1.69% | 1.70% | 1.70% | 1.75% | 1.75% |
Expenses net of all reductions | 1.68% | 1.69% | 1.68% | 1.73% | 1.73% |
Net investment income (loss) | .54% | .74% | .67% | .49% | .59% |
Supplemental Data | | | | | |
Net assets, end of period (000 omitted) | $ 23,118 | $ 10,690 | $ 2,917 | $ 1,034 | $ 532 |
Portfolio turnover rate E | 32% | 32% | 68% | 87% | 116% |
A Total returns would have been lower if certain expenses had not been reduced during the applicable periods shown.
B Total returns do not include the effect of the sales charges.
C Calculated based on average shares outstanding during the period.
D Fees and expenses of any underlying Fidelity Central Funds are not included in the Fund's expense ratio. The Fund indirectly bears its proportionate share of the expenses of any underlying Fidelity Central Funds.
E Amount does not include the portfolio activity of any underlying Fidelity Central Funds.
F Expense ratios reflect operating expenses of the class. Expenses before reductions do not reflect amounts reimbursed by the investment adviser or reductions from brokerage service arrangements or reductions from other expense offset arrangements and do not represent the amount paid by the class during periods when reimbursements or reductions occur. Expenses net of fee waivers reflect expenses after reimbursement by the investment adviser but prior to reductions from brokerage service arrangements or other expense offset arrangements. Expenses net of all reductions represent the net expenses paid by the class.
G Amount represents less than $.01 per share.
H Total distributions of $.07 per share is comprised of distributions from net investment income of $.069 and distributions from net realized gain of $.005 per share.
See accompanying notes which are an integral part of the financial statements.
Annual Report
Financial Highlights - Class B
Years ended October 31, | 2013 | 2012 | 2011 | 2010 | 2009 |
Selected Per-Share Data | | | | | |
Net asset value, beginning of period | $ 8.88 | $ 8.06 | $ 8.36 | $ 6.98 | $ 5.42 |
Income from Investment Operations | | | | | |
Net investment income (loss) C | - G | .02 | .01 | - G | .01 |
Net realized and unrealized gain (loss) | 1.89 | .80 | (.30) | 1.38 | 1.55 |
Total from investment operations | 1.89 | .82 | (.29) | 1.38 | 1.56 |
Distributions from net investment income | (.03) | - | (.01) | - | - |
Distributions from net realized gain | (.01) | - | - G | - | - |
Total distributions | (.04) | - | (.01) | - | - |
Redemption fees added to paid in capital C, G | - | - | - | - | - |
Net asset value, end of period | $ 10.73 | $ 8.88 | $ 8.06 | $ 8.36 | $ 6.98 |
Total Return A, B | 21.35% | 10.17% | (3.47)% | 19.77% | 28.78% |
Ratios to Average Net Assets D, F | | | | | |
Expenses before reductions | 2.19% | 2.35% | 2.55% | 2.87% | 3.17% |
Expenses net of fee waivers, if any | 2.18% | 2.20% | 2.20% | 2.25% | 2.25% |
Expenses net of all reductions | 2.17% | 2.19% | 2.18% | 2.23% | 2.23% |
Net investment income (loss) | .05% | .24% | .17% | (.01)% | .09% |
Supplemental Data | | | | | |
Net assets, end of period (000 omitted) | $ 1,579 | $ 1,116 | $ 473 | $ 581 | $ 328 |
Portfolio turnover rate E | 32% | 32% | 68% | 87% | 116% |
A Total returns would have been lower if certain expenses had not been reduced during the applicable periods shown.
B Total returns do not include the effect of the contingent deferred sales charge.
C Calculated based on average shares outstanding during the period.
D Fees and expenses of any underlying Fidelity Central Funds are not included in the Fund's expense ratio. The Fund indirectly bears its proportionate share of the expenses of any underlying Fidelity Central Funds.
E Amount does not include the portfolio activity of any underlying Fidelity Central Funds.
F Expense ratios reflect operating expenses of the class. Expenses before reductions do not reflect amounts reimbursed by the investment adviser or reductions from brokerage service arrangements or reductions from other expense offset arrangements and do not represent the amount paid by the class during periods when reimbursements or reductions occur. Expenses net of fee waivers reflect expenses after reimbursement by the investment adviser but prior to reductions from brokerage service arrangements or other expense offset arrangements. Expenses net of all reductions represent the net expenses paid by the class.
G Amount represents less than $.01 per share.
See accompanying notes which are an integral part of the financial statements.
Annual Report
Financial Highlights - Class C
Years ended October 31, | 2013 | 2012 | 2011 | 2010 | 2009 |
Selected Per-Share Data | | | | | |
Net asset value, beginning of period | $ 8.84 | $ 8.03 | $ 8.34 | $ 6.98 | $ 5.42 |
Income from Investment Operations | | | | | |
Net investment income (loss) C | .01 | .02 | .01 | - G | .01 |
Net realized and unrealized gain (loss) | 1.87 | .80 | (.31) | 1.38 | 1.55 |
Total from investment operations | 1.88 | .82 | (.30) | 1.38 | 1.56 |
Distributions from net investment income | (.02) | (.01) | (.01) | - | - |
Distributions from net realized gain | (.01) | (.01) | (.01) | (.02) | - |
Total distributions | (.03) | (.01) I | (.01) H | (.02) | - |
Redemption fees added to paid in capital C, G | - | - | - | - | - |
Net asset value, end of period | $ 10.69 | $ 8.84 | $ 8.03 | $ 8.34 | $ 6.98 |
Total Return A, B | 21.29% | 10.27% | (3.57)% | 19.82% | 28.78% |
Ratios to Average Net Assets D, F | | | | | |
Expenses before reductions | 2.19% | 2.33% | 2.52% | 2.89% | 3.21% |
Expenses net of fee waivers, if any | 2.18% | 2.20% | 2.20% | 2.25% | 2.25% |
Expenses net of all reductions | 2.17% | 2.19% | 2.18% | 2.24% | 2.23% |
Net investment income (loss) | .05% | .24% | .17% | (.01)% | .09% |
Supplemental Data | | | | | |
Net assets, end of period (000 omitted) | $ 17,196 | $ 5,648 | $ 2,767 | $ 1,261 | $ 780 |
Portfolio turnover rate E | 32% | 32% | 68% | 87% | 116% |
A Total returns would have been lower if certain expenses had not been reduced during the applicable periods shown.
B Total returns do not include the effect of the contingent deferred sales charge.
C Calculated based on average shares outstanding during the period.
D Fees and expenses of any underlying Fidelity Central Funds are not included in the Fund's expense ratio. The Fund indirectly bears its proportionate share of the expenses of any underlying Fidelity Central Funds.
E Amount does not include the portfolio activity of any underlying Fidelity Central Funds.
F Expense ratios reflect operating expenses of the class. Expenses before reductions do not reflect amounts reimbursed by the investment adviser or reductions from brokerage service arrangements or reductions from other expense offset arrangements and do not represent the amount paid by the class during periods when reimbursements or reductions occur. Expenses net of fee waivers reflect expenses after reimbursement by the investment adviser but prior to reductions from brokerage service arrangements or other expense offset arrangements. Expenses net of all reductions represent the net expenses paid by the class.
G Amount represents less than $.01 per share.
H Total distributions of $.01 per share is comprised of distributions from net investment income of $.008 and distributions from net realized gain of $.005 per share.
I Total distributions of $.01 per share is comprised of distributions from net investment income of $.007 and distributions from net realized gain of $.006 per share.
See accompanying notes which are an integral part of the financial statements.
Annual Report
Financial Highlights - International Growth
Years ended October 31, | 2013 | 2012 | 2011 | 2010 | 2009 |
Selected Per-Share Data | | | | | |
Net asset value, beginning of period | $ 8.95 | $ 8.12 | $ 8.40 | $ 7.02 | $ 5.48 |
Income from Investment Operations | | | | | |
Net investment income (loss) B | .11 | .11 | .10 | .07 | .06 |
Net realized and unrealized gain (loss) | 1.88 | .81 | (.30) | 1.39 | 1.54 |
Total from investment operations | 1.99 | .92 | (.20) | 1.46 | 1.60 |
Distributions from net investment income | (.10) | (.08) | (.07) | (.06) | (.06) |
Distributions from net realized gain | (.01) | (.01) | (.01) | (.03) | - |
Total distributions | (.10) H | (.09) | (.08) | (.08) G | (.06) |
Redemption fees added to paid in capital B, F | - | - | - | - | - |
Net asset value, end of period | $ 10.84 | $ 8.95 | $ 8.12 | $ 8.40 | $ 7.02 |
Total Return A | 22.48% | 11.41% | (2.47)% | 20.97% | 29.77% |
Ratios to Average Net Assets C, E | | | | | |
Expenses before reductions | 1.13% | 1.28% | 1.52% | 1.89% | 2.19% |
Expenses net of fee waivers, if any | 1.13% | 1.20% | 1.20% | 1.25% | 1.25% |
Expenses net of all reductions | 1.11% | 1.19% | 1.18% | 1.23% | 1.23% |
Net investment income (loss) | 1.11% | 1.24% | 1.17% | .99% | 1.09% |
Supplemental Data | | | | | |
Net assets, end of period (000 omitted) | $ 430,914 | $ 149,526 | $ 53,437 | $ 28,454 | $ 18,254 |
Portfolio turnover rate D | 32% | 32% | 68% | 87% | 116% |
A Total returns would have been lower if certain expenses had not been reduced during the applicable periods shown.
B Calculated based on average shares outstanding during the period.
C Fees and expenses of any underlying Fidelity Central Funds are not included in the Fund's expense ratio. The Fund indirectly bears its proportionate share of the expenses of any underlying Fidelity Central Funds.
D Amount does not include the portfolio activity of any underlying Fidelity Central Funds.
E Expense ratios reflect operating expenses of the class. Expenses before reductions do not reflect amounts reimbursed by the investment adviser or reductions from brokerage service arrangements or reductions from other expense offset arrangements and do not represent the amount paid by the class during periods when reimbursements or reductions occur. Expenses net of fee waivers reflect expenses after reimbursement by the investment adviser but prior to reductions from brokerage service arrangements or other expense offset arrangements. Expenses net of all reductions represent the net expenses paid by the class.
F Amount represents less than $.01 per share.
G Total distributions of $.08 per share is comprised of distributions from net investment income of $.057 and distributions from net realized gain of $.025 per share.
H Total distributions of $.10 per share is comprised of distributions from net investment income of $.097 and distributions from net realized gain of $.005 per share.
See accompanying notes which are an integral part of the financial statements.
Annual Report
Financial Highlights - Institutional Class
Years ended October 31, | 2013 | 2012 | 2011 | 2010 | 2009 |
Selected Per-Share Data | | | | | |
Net asset value, beginning of period | $ 8.94 | $ 8.12 | $ 8.40 | $ 7.02 | $ 5.48 |
Income from Investment Operations | | | | | |
Net investment income (loss) B | .11 | .10 | .10 | .07 | .06 |
Net realized and unrealized gain (loss) | 1.90 | .81 | (.30) | 1.39 | 1.54 |
Total from investment operations | 2.01 | .91 | (.20) | 1.46 | 1.60 |
Distributions from net investment income | (.10) | (.08) | (.07) | (.06) | (.06) |
Distributions from net realized gain | (.01) | (.01) | (.01) | (.03) | - |
Total distributions | (.11) | (.09) | (.08) | (.08) G | (.06) |
Redemption fees added to paid in capital B, F | - | - | - | - | - |
Net asset value, end of period | $ 10.84 | $ 8.94 | $ 8.12 | $ 8.40 | $ 7.02 |
Total Return A | 22.66% | 11.28% | (2.47)% | 20.97% | 29.77% |
Ratios to Average Net Assets C, E | | | | | |
Expenses before reductions | 1.11% | 1.27% | 1.50% | 1.92% | 2.01% |
Expenses net of fee waivers, if any | 1.11% | 1.20% | 1.20% | 1.25% | 1.25% |
Expenses net of all reductions | 1.09% | 1.19% | 1.18% | 1.23% | 1.23% |
Net investment income (loss) | 1.13% | 1.24% | 1.17% | .99% | 1.09% |
Supplemental Data | | | | | |
Net assets, end of period (000 omitted) | $ 38,771 | $ 3,992 | $ 493 | $ 113 | $ 36 |
Portfolio turnover rate D | 32% | 32% | 68% | 87% | 116% |
A Total returns would have been lower if certain expenses had not been reduced during the applicable periods shown.
B Calculated based on average shares outstanding during the period.
C Fees and expenses of any underlying Fidelity Central Funds are not included in the Fund's expense ratio. The Fund indirectly bears its proportionate share of the expenses of any underlying Fidelity Central Funds.
D Amount does not include the portfolio activity of any underlying Fidelity Central Funds.
E Expense ratios reflect operating expenses of the class. Expenses before reductions do not reflect amounts reimbursed by the investment adviser or reductions from brokerage service arrangements or reductions from other expense offset arrangements and do not represent the amount paid by the class during periods when reimbursements or reductions occur. Expenses net of fee waivers reflect expenses after reimbursement by the investment adviser but prior to reductions from brokerage service arrangements or other expense offset arrangements. Expenses net of all reductions represent the net expenses paid by the class.
F Amount represents less than $.01 per share.
G Total distributions of $.08 per share is comprised of distributions from net investment income of $.057 and distributions from net realized gain of $.025 per share.
See accompanying notes which are an integral part of the financial statements.
Annual Report
Financial Highlights - Class Z
Year ended October 31, | 2013 G |
Selected Per-Share Data | |
Net asset value, beginning of period | $ 10.26 |
Income from Investment Operations | |
Net investment income (loss) D | .02 |
Net realized and unrealized gain (loss) | .56 |
Total from investment operations | .58 |
Redemption fees added to paid in capital D, I | - |
Net asset value, end of period | $ 10.84 |
Total Return B, C | 5.65% |
Ratios to Average Net Assets E, H | |
Expenses before reductions | .94% A |
Expenses net of fee waivers, if any | .94% A |
Expenses net of all reductions | .93% A |
Net investment income (loss) | .65% A |
Supplemental Data | |
Net assets, end of period (000 omitted) | $ 106 |
Portfolio turnover rate F | 32% |
A Annualized
B Total returns for periods of less than one year are not annualized.
C Total returns would have been lower if certain expenses had not been reduced during the applicable periods shown.
D Calculated based on average shares outstanding during the period.
E Fees and expenses of any underlying Fidelity Central Funds are not included in the Fund's expense ratio. The Fund indirectly bears its proportionate share of the expenses of any underlying Fidelity Central Funds.
F Amount does not include the portfolio activity of any underlying Fidelity Central Funds.
G For the period August 13, 2013 (commencement of sale of shares) to October 31, 2013.
H Expense ratios reflect operating expenses of the class. Expenses before reductions do not reflect amounts reimbursed by the investment adviser or reductions from brokerage service arrangements or reductions from other expense offset arrangements and do not represent the amount paid by the class during periods when reimbursements or reductions occur. Expense ratios before reductions for start-up periods may not be representative of longer-term operating periods. Expenses net of fee waivers reflect expenses after reimbursement by the investment adviser but prior to reductions from brokerage service arrangements or other expense offset arrangements. Expenses net of all reductions represent the net expenses paid by the class.
I Amount represents less than $.01 per share.
See accompanying notes which are an integral part of the financial statements.
Annual Report
Notes to Financial Statements
For the period ended October 31, 2013
1. Organization.
Fidelity International Growth Fund (the Fund) is a fund of Fidelity Investment Trust (the Trust) and is authorized to issue an unlimited number of shares. The Trust is registered under the Investment Company Act of 1940, as amended (the 1940 Act), as an open-end management investment company organized as a Massachusetts business trust. The Fund commenced sale of Class Z shares on August 13, 2013. The Fund offers Class A, Class T, Class C, International Growth, Institutional Class and Class Z shares, each of which, along with Class B shares, has equal rights as to assets and voting privileges. Class B shares are closed to new accounts and additional purchases, except for exchanges and reinvestments. Each class has exclusive voting rights with respect to matters that affect that class. Class B shares will automatically convert to Class A shares after a holding period of seven years from the initial date of purchase.
2. Investments in Fidelity Central Funds.
The Fund invests in Fidelity Central Funds, which are open-end investment companies generally available only to other investment companies and accounts managed by which Fidelity Management & Research Company (FMR) and its affiliates. The Fund's Schedule of Investments lists each of the Fidelity Central Funds held as of period end, if any, as an investment of the Fund, but does not include the underlying holdings of each Fidelity Central Fund. As an Investing Fund, the Fund indirectly bears its proportionate share of the expenses of the underlying Fidelity Central Funds.
The Money Market Central Funds seek preservation of capital and current income and are managed by Fidelity Investments Money Management, Inc. (FIMM), an affiliate of FMR.
A complete unaudited list of holdings for each Fidelity Central Fund is available upon request or at the Securities and Exchange Commission (the SEC) website at www.sec.gov. In addition, the financial statements of the Fidelity Central Funds, which are not covered by the Fund's Report of Independent Registered Public Accounting Firm, are available on the SEC website or upon request.
3. Significant Accounting Policies.
The financial statements have been prepared in conformity with accounting principles generally accepted in the United States of America (GAAP), which require management to make certain estimates and assumptions at the date of the financial statements. Actual results could differ from those estimates. Subsequent events, if any, through the date that the financial statements were issued have been evaluated in the preparation of
Annual Report
3. Significant Accounting Policies - continued
the financial statements. The following summarizes the significant accounting policies of the Fund:
Investment Valuation. Investments are valued as of 4:00 p.m. Eastern time on the last calendar day of the period. In accordance with valuation policies and procedures approved by the Board of Trustees (the Board), the Fund attempts to obtain prices from one or more third party pricing vendors or brokers to value its investments. When current market prices, quotations or currency exchange rates are not readily available or reliable, investments will be fair valued in good faith by the FMR Fair Value Committee (the Committee), in accordance with procedures adopted by the Board. Factors used in determining fair value vary by investment type and may include market or investment specific events. The frequency with which these procedures are used cannot be predicted and they may be utilized to a significant extent. The Committee oversees the Fund's valuation policies and procedures and is responsible for approving and reporting to the Board all fair value determinations.
The Fund categorizes the inputs to valuation techniques used to value its investments into a disclosure hierarchy consisting of three levels as shown below:
Level 1 - quoted prices in active markets for identical investments
Level 2 - other significant observable inputs (including quoted prices for similar investments, interest rates, prepayment speeds, etc.)
Level 3 - unobservable inputs (including the Fund's own assumptions based on the best information available)
Valuation techniques used to value the Fund's investments by major category are as follows:
Equity securities, including restricted securities, for which market quotations are readily available, are valued at the last reported sale price or official closing price as reported by a third party pricing vendor on the primary market or exchange on which they are traded and are categorized as Level 1 in the hierarchy. In the event there were no sales during the day or closing prices are not available, securities are valued at the last quoted bid price or may be valued using the last available price and are generally categorized as Level 2 in the hierarchy. For foreign equity securities, when market or security specific events arise, comparisons to the valuation of American Depositary Receipts (ADRs), futures contracts, Exchange-Traded Funds (ETFs) and certain indexes as well as quoted prices for similar securities may be used and would be categorized as Level 2 in the hierarchy. Utilizing these techniques may result in transfers between Level 1 and Level 2. For equity securities, including restricted securities, where observable inputs are limited, assumptions about market activity and risk are used and these securities may be categorized as Level 3 in the hierarchy.
Annual Report
Notes to Financial Statements - continued
3. Significant Accounting Policies - continued
Investment Valuation - continued
Investments in open-end mutual funds, including the Fidelity Central Funds, are valued at their closing net asset value (NAV) each business day and are categorized as Level 1 in the hierarchy.
Changes in valuation techniques may result in transfers in or out of an assigned level within the disclosure hierarchy. The aggregate value of investments by input level, as of October 31, 2013, including information on transfers between Levels 1 and 2, is included at the end of the Fund's Schedule of Investments.
Foreign Currency. The Fund may use foreign currency contracts to facilitate transactions in foreign-denominated securities. Gains and losses from these transactions may arise from changes in the value of the foreign currency or if the counterparties do not perform under the contracts' terms.
Foreign-denominated assets, including investment securities, and liabilities are translated into U.S. dollars at the exchange rates at period end. Purchases and sales of investment securities, income and dividends received and expenses denominated in foreign currencies are translated into U.S. dollars at the exchange rate in effect on the transaction date.
The effects of exchange rate fluctuations on investments are included with the net realized and unrealized gain (loss) on investment securities. Other foreign currency transactions resulting in realized and unrealized gain (loss) are disclosed separately.
Investment Transactions and Income. For financial reporting purposes, the Fund's investment holdings and NAV include trades executed through the end of the last business day of the period. The NAV per share for processing shareholder transactions is calculated as of the close of business of the New York Stock Exchange (NYSE), normally 4:00 p.m. Eastern time and includes trades executed through the end of the prior business day. Gains and losses on securities sold are determined on the basis of identified cost. Dividend income is recorded on the ex-dividend date, except for certain dividends from foreign securities where the ex-dividend date may have passed, which are recorded as soon as the Fund is informed of the ex-dividend date. Non-cash dividends included in dividend income, if any, are recorded at the fair market value of the securities received. Interest income and distributions from the Fidelity Central Funds are accrued as earned. Interest income includes coupon interest and amortization of premium and accretion of discount on debt securities. Investment income is recorded net of foreign taxes withheld where recovery of such taxes is uncertain.
Class Allocations and Expenses. Investment income, realized and unrealized capital gains and losses, common expenses of the Fund, and certain fund-level expense
Annual Report
3. Significant Accounting Policies - continued
Class Allocations and Expenses - continued
reductions, if any, are allocated daily on a pro-rata basis to each class based on the relative net assets of each class to the total net assets of the Fund. Each class differs with respect to transfer agent and distribution and service plan fees incurred. Certain expense reductions may also differ by class. For the reporting period, the allocated portion of income and expenses to each class as a percent of its average net assets may vary due to the timing of recording these transactions in relation to fluctuating net assets of the classes. Expenses directly attributable to a fund are charged to that fund. Expenses attributable to more than one fund are allocated among the respective funds on the basis of relative net assets or other appropriate methods. Expense estimates are accrued in the period to which they relate and adjustments are made when actual amounts are known.
Income Tax Information and Distributions to Shareholders. Each year, the Fund intends to qualify as a regulated investment company under Subchapter M of the Internal Revenue Code, including distributing substantially all of its taxable income and realized gains. As a result, no provision for U.S. Federal income taxes is required. As of October 31, 2013, the Fund did not have any unrecognized tax benefits in the financial statements; nor is the Fund aware of any tax positions for which it is reasonably possible that the total amounts of unrecognized tax benefits will significantly change in the next twelve months. The Fund files a U.S. federal tax return, in addition to state and local tax returns as required. The Fund's federal income tax returns are subject to examination by the Internal Revenue Service (IRS) for a period of three fiscal years after they are filed. State and local tax returns may be subject to examination for an additional fiscal year depending on the jurisdiction. Foreign taxes are provided for based on the Fund's understanding of the tax rules and rates that exist in the foreign markets in which it invests.
Distributions are declared and recorded on the ex-dividend date. Income dividends and capital gain distributions are declared separately for each class. Income and capital gain distributions are determined in accordance with income tax regulations, which may differ from GAAP. In addition, the Fund claimed a portion of the payment made to redeeming shareholders as a distribution for income tax purposes.
Capital accounts within the financial statements are adjusted for permanent book-tax differences. These adjustments have no impact on net assets or the results of operations. Temporary book-tax differences will reverse in a subsequent period.
Book-tax differences are primarily due to futures contracts, foreign currency transactions, passive foreign investment companies (PFIC), partnerships, capital loss carryforwards, and losses deferred due to wash sales.
Annual Report
Notes to Financial Statements - continued
3. Significant Accounting Policies - continued
Income Tax Information and Distributions to Shareholders - continued
The federal tax cost of investment securities and unrealized appreciation (depreciation) as of period end were as follows:
Gross unrealized appreciation | $ 77,456,036 |
Gross unrealized depreciation | (6,897,408) |
Net unrealized appreciation (depreciation) on securities and other investments | $ 70,558,628 |
| |
Tax Cost | $ 533,961,209 |
The tax-based components of distributable earnings as of period end were as follows:
Undistributed ordinary income | $ 2,476,993 |
Undistributed long-term capital gain | $ 516,487 |
Net unrealized appreciation (depreciation) | $ 70,555,556 |
The tax character of distributions paid was as follows:
| October 31, 2013 | October 31, 2012 |
Ordinary Income | $ 2,195,105 | $ 643,383 |
Short-Term Trading (Redemption) Fees. Shares held by investors in the Fund less than 30 days may have been subject to a redemption fee equal to 1.00% of the net asset value of shares redeemed. All redemption fees, which reduce the proceeds of the shareholder redemption, are retained by the Fund and accounted for as an addition to paid in capital.
New Accounting Pronouncement. The Financial Accounting Standards Board issued in December 2011, Accounting Standard Update No. 2011-11, Disclosures about Offsetting Assets and Liabilities, and in January 2013, Accounting Standards Update No. 2013-1 Clarifying the Scope of Disclosures about Offsetting Assets and Liabilities. These updates create new disclosure requirements requiring entities to disclose both gross and net information for derivatives and other financial instruments that are either offset in the Statement of Assets and Liabilities or subject to an enforceable master netting arrangement or similar agreement. The disclosure requirements are effective for annual reporting periods beginning on or after January 1, 2013, and interim periods within those annual periods. Management expects that the impact of the updates' adoption will be limited to additional financial statement disclosures as applicable.
Annual Report
4. Derivative Instruments.
Risk Exposures and the Use of Derivative Instruments. The Fund's investment objective allows the Fund to enter into various types of derivative contracts, including futures contracts. Derivatives are investments whose value is primarily derived from underlying assets, indices or reference rates and may be transacted on an exchange or over-the-counter (OTC). Derivatives may involve a future commitment to buy or sell a specified asset based on specified terms, to exchange future cash flows at periodic intervals based on a notional principal amount, or for one party to make one or more payments upon the occurrence of specified events in exchange for periodic payments from the other party.
The Fund used derivatives to increase returns and to manage exposure to certain risks as defined below. The success of any strategy involving derivatives depends on analysis of numerous economic factors, and if the strategies for investment do not work as intended, the Fund may not achieve its objectives.
The Fund's use of derivatives increased or decreased its exposure to the following risk:
Equity Risk | Equity risk relates to the fluctuations in the value of financial instruments as a result of changes in market prices (other than those arising from interest rate risk or foreign exchange risk), whether caused by factors specific to an individual investment, its issuer, or all factors affecting all instruments traded in a market or market segment. |
The Fund is also exposed to additional risks from investing in derivatives, such as liquidity risk and counterparty credit risk. Liquidity risk is the risk that the Fund will be unable to close out the derivative in the open market in a timely manner. Counterparty credit risk is the risk that the counterparty will not be able to fulfill its obligation to the Fund. Counterparty credit risk related to exchange-traded futures contracts may be mitigated by the protection provided by the exchange on which they trade.
Investing in derivatives may involve greater risks than investing in the underlying assets directly and, to varying degrees, may involve risk of loss in excess of any initial investment and collateral received and amounts recognized in the Statement of Assets and Liabilities. In addition, there may be the risk that the change in value of the derivative contract does not correspond to the change in value of the underlying instrument.
Futures Contracts. A futures contract is an agreement between two parties to buy or sell a specified underlying instrument for a fixed price at a specified future date. The Fund used futures contracts to manage its exposure to the stock market.
Upon entering into a futures contract, a fund is required to deposit either cash or securities (initial margin) with a clearing broker in an amount equal to a certain percentage of the face value of the contract. Futures contracts are marked-to-market daily and subsequent daily payments (variation margin) are made or received by a fund depending on
Annual Report
Notes to Financial Statements - continued
4. Derivative Instruments - continued
Futures Contracts - continued
the daily fluctuations in the value of the futures contracts and are recorded as unrealized appreciation or (depreciation). This receivable and/or payable, if any, is included in daily variation margin for derivative instruments in the Statement of Assets and Liabilities. Realized gain or (loss) is recorded upon the expiration or closing of a futures contract.
Any open futures contracts at period end are presented in the Schedule of Investments under the caption "Futures Contracts." The underlying face amount at value reflects each contract's exposure to the underlying instrument or index at period end.
During the period the Fund recognized net realized gain (loss) of $(517,867) related to its investment in futures contracts. This amount is included in the Statement of Operations.
5. Purchases and Sales of Investments.
Purchases and sales of securities, other than short-term securities, aggregated $423,057,094 and $105,902,960, respectively.
6. Fees and Other Transactions with Affiliates.
Management Fee. FMR and its affiliates provide the Fund with investment management related services for which the Fund pays a monthly management fee. The management fee is the sum of an individual fund fee rate that is based on an annual rate of .45% of the Fund's average net assets and an annualized group fee rate that averaged .25% during the period. The group fee rate is based upon the average net assets of all the mutual funds advised by FMR, including any mutual funds previously advised by FMR that are currently advised by Fidelity SelectCo, LLC, an affiliate of FMR. The group fee rate decreases as assets under management increase and increases as assets under management decrease. In addition, the management fee is subject to a performance adjustment (up to a maximum of ±.20% of the Fund's average net assets over a 36 month performance period). The upward or downward adjustment to the management fee is based on the relative investment performance of International Growth as compared to an appropriate benchmark index over the same 36 month performance period. For the reporting period, the total annual management fee rate, including the performance adjustment, was .75% of the Fund's average net assets. The performance adjustment included in the management fee rate may be higher or lower than the maximum performance adjustment rate due to the difference between the average net assets for the reporting and performance periods.
Distribution and Service Plan Fees. In accordance with Rule 12b-1 of the 1940 Act, the Fund has adopted separate Distribution and Service Plans for each class of shares.
Annual Report
6. Fees and Other Transactions with Affiliates - continued
Distribution and Service Plan Fees - continued
Certain classes pay Fidelity Distributors Corporation (FDC), an affiliate of FMR, separate Distribution and Service Fees, each of which is based on an annual percentage of each class' average net assets. In addition, FDC may pay financial intermediaries for selling shares of the Fund and providing shareholder support services. For the period, the Distribution and Service Fee rates, total fees and amounts retained by FDC were as follows:
| Distribution
Fee | Service
Fee | Total Fees | Retained
by FDC |
Class A | -% | .25% | $ 111,996 | $ 3,731 |
Class T | .25% | .25% | 74,898 | - |
Class B | .75% | .25% | 12,264 | 9,227 |
Class C | .75% | .25% | 113,336 | 38,127 |
| | | $ 312,494 | $ 51,085 |
Sales Load. FDC may receive a front-end sales charge of up to 5.75% for selling Class A shares and 3.50% for selling Class T shares, some of which is paid to financial intermediaries for selling shares of the Fund. Depending on the holding period, FDC may receive contingent deferred sales charges levied on Class A, Class T, Class B, and Class C redemptions. The deferred sales charges range from 5.00% to 1.00% for Class B shares, 1.00% for Class C shares, 1.00% for certain purchases of Class A shares and .25% for certain purchases of Class T shares.
For the period, sales charge amounts retained by FDC were as follows:
| Retained
by FDC |
Class A | $ 55,379 |
Class T | 12,148 |
Class B* | 741 |
Class C* | 2,285 |
| $ 70,553 |
* When Class B and Class C shares are initially sold, FDC pays commissions from its own resources to financial intermediaries through which the sales
are made.
Transfer Agent Fees. Fidelity Investments Institutional Operations Company, Inc., (FIIOC), an affiliate of FMR, is the transfer, dividend disbursing and shareholder servicing agent for each class of the Fund. FIIOC receives account fees and asset-based fees that vary according to the account size and type of account of the shareholders of the respective classes of the Fund, except for Class Z. FIIOC receives an asset-based fee of
Annual Report
Notes to Financial Statements - continued
6. Fees and Other Transactions with Affiliates - continued
Transfer Agent Fees - continued
Class Z's average net assets. FIIOC pays for typesetting, printing and mailing of shareholder reports, except proxy statements.
For the period, transfer agent fees for each class were as follows:
| Amount | % of
Average
Net Assets |
Class A | $ 133,141 | .29 |
Class T | 45,948 | .30 |
Class B | 3,660 | .30 |
Class C | 33,951 | .30 |
International Growth | 618,957 | .24 |
Institutional Class | 30,066 | .22 |
Class Z | 11 | .05* |
| $ 865,734 | |
* Annualized
Accounting and Security Lending Fees. Fidelity Service Company, Inc. (FSC), an affiliate of FMR, maintains the Fund's accounting records. The accounting fee is based on the level of average net assets for each month. Under a separate contract, FSC administers the security lending program. The security lending fee is based on the number and duration of lending transactions.
Brokerage Commissions. The Fund placed a portion of its portfolio transactions with brokerage firms which are affiliates of the investment adviser. Brokerage commissions are included in net realized gain (loss) and change in net unrealized appreciation (depreciation) in the Statement of Operations. The commissions paid to these affiliated firms were $2,164 for the period.
7. Committed Line of Credit.
The Fund participates with other funds managed by FMR or an affiliate in a $4.25 billion credit facility (the "line of credit") to be utilized for temporary or emergency purposes to fund shareholder redemptions or for other short-term liquidity purposes. The Fund has agreed to pay commitment fees on its pro-rata portion of the line of credit, which amounted to $647 and is reflected in Miscellaneous expenses on the Statement of Operations. During the period, there were no borrowings on this line of credit.
8. Security Lending.
The Fund lends portfolio securities through a lending agent from time to time in order to earn additional income. For equity securities, a lending agent is used and may loan
Annual Report
8. Security Lending - continued
securities to certain qualified borrowers, including Fidelity Capital Markets (FCM), a broker-dealer affiliated with the Fund. On the settlement date of the loan, the Fund receives collateral (in the form of U.S. Treasury obligations, letters of credit and/or cash) against the loaned securities and maintains collateral in an amount not less than 100% of the market value of the loaned securities during the period of the loan. The market value of the loaned securities is determined at the close of business of the Fund and any additional required collateral is delivered to the Fund on the next business day. If the borrower defaults on its obligation to return the securities loaned because of insolvency or other reasons, the Fund may apply collateral received from the borrower against the obligation. The Fund may experience delays and costs in recovering the securities loaned. Any cash collateral received is invested in the Fidelity Securities Lending Cash Central Fund. The value of loaned securities and cash collateral at period end are disclosed on the Fund's Statement of Assets and Liabilities. The value of securities loaned to FCM at period end was $812,318. Security lending income represents the income earned on investing cash collateral, less rebates paid to borrowers and any lending agent fees associated with the loan, plus any premium payments received for lending certain types of securities. Security lending income is presented in the Statement of Operations as a component of income from Fidelity Central Funds. Total security lending income during the period amounted to $209,783, including $4,235 from securities loaned to FCM.
9. Expense Reductions.
FMR voluntarily agreed to reimburse a portion of Class A, Class T, Class B, Class C, International Growth and Institutional Class operating expenses. During the period, this reimbursement reduced expenses as follows:
| Reimbursement |
Class A | $ 1,675 |
Class T | 515 |
Class B | 36 |
Class C | 417 |
International Growth | 10,450 |
Institutional Class | 831 |
| $ 13,924 |
In addition, FMR reimbursed a portion of the Fund's operating expenses during the period in the amount of $1,356.
Annual Report
Notes to Financial Statements - continued
9. Expense Reductions - continued
Commissions paid to certain brokers with whom FMR, or its affiliates, places trades on behalf of the Fund include an amount in addition to trade execution, which may be rebated back to the Fund to offset certain expenses. This amount totaled $46,315 for the period.
10. Distributions to Shareholders.
Distributions to shareholders of each class were as follows:
Years ended October 31, | 2013 | 2012 |
From net investment income | | |
Class A | $ 226,330 | $ 50,503 |
Class T | 86,155 | 18,666 |
Class B | 4,290 | - |
Class C | 14,481 | 2,205 |
International Growth | 1,698,830 | 516,958 |
Institutional Class | 51,250 | 6,406 |
Total | $ 2,081,336 | $ 594,738 |
From net realized gain | | |
Class A | $ 13,472 | $ 4,810 |
Class T | 6,243 | 2,196 |
Class B | 631 | - |
Class C | 3,291 | 1,890 |
International Growth | 87,569 | 39,262 |
Institutional Class | 2,563 | 487 |
Total | $ 113,769 | $ 48,645 |
11. Share Transactions.
Transactions for each class of shares were as follows:
| Shares | Dollars |
Years ended October 31, | 2013 A | 2012 | 2013 A | 2012 |
Class A | | | | |
Shares sold | 5,907,169 | 1,901,699 | $ 58,500,264 | $ 16,560,116 |
Reinvestment of distributions | 24,178 | 5,422 | 218,566 | 42,831 |
Shares redeemed | (1,466,703) | (236,851) | (14,226,261) | (2,015,265) |
Net increase (decrease) | 4,464,644 | 1,670,270 | $ 44,492,569 | $ 14,587,682 |
Class T | | | | |
Shares sold | 1,144,706 | 941,446 | $ 11,429,141 | $ 8,178,600 |
Reinvestment of distributions | 10,086 | 2,626 | 91,076 | 20,742 |
Shares redeemed | (206,178) | (102,766) | (2,020,899) | (866,637) |
Net increase (decrease) | 948,614 | 841,306 | $ 9,499,318 | $ 7,332,705 |
Annual Report
11. Share Transactions - continued
| Shares | Dollars |
Years ended October 31, | 2013 A | 2012 | 2013 A | 2012 |
Class B | | | | |
Shares sold | 70,442 | 92,865 | $ 702,618 | $ 806,549 |
Reinvestment of distributions | 531 | - | 4,806 | - |
Shares redeemed | (49,437) | (25,954) | (483,935) | (218,180) |
Net increase (decrease) | 21,536 | 66,911 | $ 223,489 | $ 588,369 |
Class C | | | | |
Shares sold | 1,392,365 | 400,291 | $ 13,520,584 | $ 3,375,948 |
Reinvestment of distributions | 1,911 | 510 | 17,237 | 4,026 |
Shares redeemed | (424,469) | (106,475) | (4,120,400) | (879,489) |
Net increase (decrease) | 969,807 | 294,326 | $ 9,417,421 | $ 2,500,485 |
International Growth | | | | |
Shares sold | 29,198,608 | 13,301,892 | $ 290,678,738 | $ 114,028,412 |
Reinvestment of distributions | 192,126 | 68,821 | 1,742,585 | 544,378 |
Shares redeemed | (6,365,570) | (3,238,606) | (62,814,771) | (27,713,258) |
Net increase (decrease) | 23,025,164 | 10,132,107 | $ 229,606,552 | $ 86,859,532 |
Institutional Class | | | | |
Shares sold | 3,568,741 | 438,656 | $ 35,951,935 | $ 3,841,370 |
Reinvestment of distributions | 5,682 | 655 | 51,476 | 5,178 |
Shares redeemed | (443,392) | (53,696) | (4,427,602) | (443,499) |
Net increase (decrease) | 3,131,031 | 385,615 | $ 31,575,809 | $ 3,403,049 |
Class Z | | | | |
Shares sold | 9,747 | - | $ 100,000 | $ - |
Reinvestment of distributions | - | - | - | - |
Shares redeemed | - | - | - | - |
Net increase (decrease) | 9,747 | - | $ 100,000 | $ - |
A Share transactions for Class Z are for the period August 13, 2013 (commencement of sale of shares) to October 31, 2013.
12. Other.
The Fund's organizational documents provide former and current trustees and officers with a limited indemnification against liabilities arising in connection with the performance of their duties to the Fund. In the normal course of business, the Fund may also enter into contracts that provide general indemnifications. The Fund's maximum exposure under these arrangements is unknown as this would be dependent on future claims that may be made against the Fund. The risk of material loss from such claims is considered remote.
Annual Report
To the Trustees of Fidelity Investment Trust and the Shareholders of Fidelity International Growth Fund:
In our opinion, the accompanying statement of assets and liabilities, including the schedule of investments, and the related statements of operations and of changes in net assets and the financial highlights present fairly, in all material respects, the financial position of Fidelity International Growth Fund (a fund of Fidelity Investment Trust) at October 31, 2013, the results of its operations for the year then ended, the changes in its net assets for each of the two years in the period then ended and the financial highlights for each of the periods indicated, in conformity with accounting principles generally accepted in the United States of America. These financial statements and financial highlights (hereafter referred to as "financial statements") are the responsibility of the Fidelity International Growth Fund's management. Our responsibility is to express an opinion on these financial statements based on our audits. We conducted our audits of these financial statements in accordance with the standards of the Public Company Accounting Oversight Board (United States). Those standards require that we plan and perform the audit to obtain reasonable assurance about whether the financial statements are free of material misstatement. An audit includes examining, on a test basis, evidence supporting the amounts and disclosures in the financial statements, assessing the accounting principles used and significant estimates made by management, and evaluating the overall financial statement presentation. We believe that our audits, which included confirmation of securities at October 31, 2013 by correspondence with the custodian and brokers, provide a reasonable basis for our opinion.
PricewaterhouseCoopers LLP
Boston, Massachusetts
December 11, 2013
Annual Report
The Trustees, Member of the Advisory Board, and executive officers of the trust and fund, as applicable, are listed below. The Board of Trustees governs the fund and is responsible for protecting the interests of shareholders. The Trustees are experienced executives who meet periodically throughout the year to oversee the fund's activities, review contractual arrangements with companies that provide services to the fund, oversee management of the risks associated with such activities and contractual arrangements, and review the fund's performance. Except for James C. Curvey, Ned C. Lautenbach, Ronald P. O'Hanley, and William S. Stavropoulos, each of the Trustees oversees 171 funds. Mr. Curvey oversees 394 funds. Mr. Lautenbach, Mr. O'Hanley, and Mr. Stavropoulos each oversees 245 funds.
The Trustees hold office without limit in time except that (a) any Trustee may resign; (b) any Trustee may be removed by written instrument, signed by at least two-thirds of the number of Trustees prior to such removal; (c) any Trustee who requests to be retired or who has become incapacitated by illness or injury may be retired by written instrument signed by a majority of the other Trustees; and (d) any Trustee may be removed at any special meeting of shareholders by a two-thirds vote of the outstanding voting securities of the trust. Each Trustee who is not an interested person of the trust and the fund (as defined in the 1940 Act) (Independent Trustee), shall retire not later than the last day of the calendar year in which his or her 75th birthday occurs. The Independent Trustees may waive this mandatory retirement age policy with respect to individual Trustees. The executive officers and Advisory Board Member hold office without limit in time, except that any officer and Advisory Board Member may resign or may be removed by a vote of a majority of the Trustees at any regular meeting or any special meeting of the Trustees. Except as indicated, each individual has held the office shown or other offices in the same company for the past five years.
Experience, Skills, Attributes, and Qualifications of the Fund's Trustees. The Governance and Nominating Committee has adopted a statement of policy that describes the experience, qualifications, attributes, and skills that are necessary and desirable for potential Independent Trustee candidates (Statement of Policy). The Board believes that each Trustee satisfied at the time he or she was initially elected or appointed a Trustee, and continues to satisfy, the standards contemplated by the Statement of Policy. The Governance and Nominating Committee also engages professional search firms to help identify potential Independent Trustee candidates who have the experience, qualifications, attributes, and skills consistent with the Statement of Policy. From time to time, additional criteria based on the composition and skills of the current Independent Trustees, as well as experience or skills that may be appropriate in light of future changes to board composition, business conditions, and regulatory or other developments, have also been considered by the professional search firms and the Governance and Nominating Committee. In addition, the Board takes into account the Trustees' commitment and participation in Board and committee meetings, as well as their leadership of standing and ad hoc committees throughout their tenure.
Annual Report
Trustees and Officers - continued
In determining that a particular Trustee was and continues to be qualified to serve as a Trustee, the Board has considered a variety of criteria, none of which, in isolation, was controlling. The Board believes that, collectively, the Trustees have balanced and diverse experience, qualifications, attributes, and skills, which allow the Board to operate effectively in governing the fund and protecting the interests of shareholders. Information about the specific experience, skills, attributes, and qualifications of each Trustee, which in each case led to the Board's conclusion that the Trustee should serve (or continue to serve) as a trustee of the fund, is provided below.
Board Structure and Oversight Function. James C. Curvey is an interested person (as defined in the 1940 Act) and currently serves as Chairman. The Trustees have determined that an interested Chairman is appropriate and benefits shareholders because an interested Chairman has a personal and professional stake in the quality and continuity of services provided to the fund. Independent Trustees exercise their informed business judgment to appoint an individual of their choosing to serve as Chairman, regardless of whether the Trustee happens to be independent or a member of management. The Independent Trustees have determined that they can act independently and effectively without having an Independent Trustee serve as Chairman and that a key structural component for assuring that they are in a position to do so is for the Independent Trustees to constitute a substantial majority for the Board. The Independent Trustees also regularly meet in executive session. Ned C. Lautenbach serves as Chairman of the Independent Trustees and as such (i) acts as a liaison between the Independent Trustees and management with respect to matters important to the Independent Trustees and (ii) with management prepares agendas for Board meetings.
Fidelity funds are overseen by different Boards of Trustees. The fund's Board oversees Fidelity's equity and high income funds and another Board oversees Fidelity's investment-grade bond, money market, and asset allocation funds. The asset allocation funds may invest in Fidelity funds overseen by the fund's Board. The use of separate Boards, each with its own committee structure, allows the Trustees of each group of Fidelity funds to focus on the unique issues of the funds they oversee, including common research, investment, and operational issues. On occasion, the separate Boards establish joint committees to address issues of overlapping consequences for the Fidelity funds overseen by each Board.
The Trustees operate using a system of committees to facilitate the timely and efficient consideration of all matters of importance to the Trustees, the fund, and fund shareholders and to facilitate compliance with legal and regulatory requirements and oversight of the fund's activities and associated risks. The Board, acting through its committees, has charged FMR and its affiliates with (i) identifying events or circumstances the occurrence of which could have demonstrably adverse effects on the fund's business and/or reputation; (ii) implementing processes and controls to lessen the possibility that such events or circumstances occur or to mitigate the effects of such events or circumstances if they do occur; and (iii) creating and maintaining a system designed to evaluate continuously business and market conditions in order to facilitate the identification and implementation processes described in (i) and (ii) above. Because the day-to-day operations and activities of the fund are carried out by or through FMR, its affiliates and other service providers, the fund's exposure to risks is mitigated but not eliminated by the processes overseen by the Trustees. While each of the Board's committees has responsibility for overseeing different aspects of the fund's activities, oversight is exercised primarily through the Operations, Audit, and Compliance Committees. In addition, the Independent Trustees have worked with FMR to enhance the Board's oversight of investment and financial risks, legal and regulatory risks, technology risks, and operational risks, including the development of additional risk reporting to the Board. For example, a working group comprised of Independent Trustees and FMR has worked and continues to work to review the Fidelity funds' valuation-related activities, reporting and risk management. Appropriate personnel, including but not limited to the fund's Chief Compliance Officer (CCO), FMR's internal auditor, the independent accountants, the fund's Treasurer and portfolio management personnel, make periodic reports to the Board's committees, as appropriate, including an annual review of FMR's risk management program for the Fidelity funds. The responsibilities of each standing committee, including their oversight responsibilities, are described further under "Standing Committees of the Fund's Trustees."
Annual Report
The fund's Statement of Additional Information (SAI) includes more information about the Trustees. To request a free copy, call Fidelity at 1-877-208-0098.
Interested Trustees*:
Correspondence intended for each Trustee who is an interested person may be sent to Fidelity Investments, 245 Summer Street, Boston, Massachusetts 02210.
Name, Year of Birth; Principal Occupations and Other Relevant Experience+ |
James C. Curvey (1935) |
Year of Election or Appointment: 2007 Trustee Chairman of the Board of Trustees |
| Mr. Curvey also serves as Trustee of other Fidelity funds. Mr. Curvey is a Director of Fidelity Investments Money Management, Inc. (2009-present), Director of Fidelity Research & Analysis Co. (2009-present) and Director of FMR and FMR Co., Inc. (2007-present). Mr. Curvey is also Vice Chairman (2007-present) and Director of FMR LLC. In addition, Mr. Curvey serves as an Overseer for the Boston Symphony Orchestra and a member of the Trustees of Villanova University. Previously, Mr. Curvey was the Vice Chairman (2006-2007) and Director (2000-2007) of FMR Corp. |
Ronald P. O'Hanley (1957) |
Year of Election or Appointment: 2011 Trustee |
| Mr. O'Hanley also serves as Trustee of other Fidelity funds. He is Director of Fidelity SelectCo, LLC (2013-present), FMR Co., Inc. (2010-present), Director of Fidelity Investments Money Management, Inc. (2010-present), Director of Fidelity Research & Analysis Company (2010-present), President of Fidelity Asset Management and Corporate Services and a Member of Fidelity's Executive Committee (2010-present). Previously, Mr. O'Hanley served as President and Chief Executive Officer of BNY Mellon Asset Management (2007-2010). Mr. O'Hanley also served as Vice Chairman of Bank New York Mellon Corp. and a member of that firm's Executive Committee. Prior to the 2007 merger of The Bank of New York and Mellon Financial Corporation, he was Vice Chairman of Mellon Financial Corporation and President and Chief Executive Officer of Mellon Asset Management. He joined Mellon in February 1997. Mr. O'Hanley currently serves as Chairman of the Boston Public Library Foundation Board of Directors and sits on the Board of Directors of Beth Israel Deaconess Medical Center, the Board of Trustees of the Marine Biological Laboratory and the Advisory Board of the Maxwell School of Citizenship and Public Administration at Syracuse University. Mr. O'Hanley also chairs the Council on Asset Management for the Financial Services Roundtable and is a member of the Board of Directors of Institutional Investor's U.S. Institute. |
* Trustees have been determined to be "Interested Trustees" by virtue of, among other things, their affiliation with the trust or various entities under common control with FMR.
+ The information above includes each Trustee's principal occupation during the last five years and other information relating to the experience, attributes, and skills relevant to each Trustee's qualifications to serve as a Trustee, which led to the conclusion that each Trustee should serve as a Trustee for the fund.
Annual Report
Independent Trustees:
Correspondence intended for each Independent Trustee (that is, the Trustees other than the Interested Trustees) may be sent to Fidelity Investments, P.O. Box 55235, Boston, Massachusetts 02205-5235.
Name, Year of Birth; Principal Occupations and Other Relevant Experience+ |
Dennis J. Dirks (1948) |
Year of Election or Appointment: 2005 Trustee |
| Mr. Dirks also serves as Trustee of other Fidelity funds. Prior to his retirement in May 2003, Mr. Dirks was Chief Operating Officer and a member of the Board of The Depository Trust & Clearing Corporation (DTCC). He also served as President, Chief Operating Officer, and Board member of The Depository Trust Company (DTC) and President and Board member of the National Securities Clearing Corporation (NSCC). In addition, Mr. Dirks served as Chief Executive Officer and Board member of the Government Securities Clearing Corporation, Chief Executive Officer and Board member of the Mortgage-Backed Securities Clearing Corporation, as a Trustee and a member of the Finance Committee of Manhattan College (2005-2008), and as a Trustee and a member of the Finance Committee of AHRC of Nassau County (2006-2008). Mr. Dirks is a member of the Independent Directors Council (IDC) Governing Council (2010-present) and Board of Directors for The Brookville Center for Children's Services, Inc. (2009-present). |
Alan J. Lacy (1953) |
Year of Election or Appointment: 2008 Trustee |
| Mr. Lacy also serves as Trustee of other Fidelity funds. Mr. Lacy serves as Senior Adviser (2007-present) of Oak Hill Capital Partners, L.P. (private equity). Mr. Lacy also served as Chief Executive Officer (2000-2005) and Vice Chairman (2005-2006) of Sears Holdings Corporation and Sears, Roebuck and Co. (retail). In addition, Mr. Lacy serves as a member of the Board of Directors of Dave & Buster's Entertainment, Inc. (restaurant and entertainment complexes, 2010-present), Earth Fare, Inc. (retail grocery, 2012-present), The Hillman Companies, Inc. (hardware wholesalers, 2010-present), and Bristol-Myers Squibb Company (global pharmaceuticals, 2008-present). Mr. Lacy is a member of the Board of Trustees of The National Parks Conservation Association (2006-present). Previously, Mr. Lacy served as Chairman of the Board of Trustees of the National Parks Conservation Association (2008-2011) and as a member of the Board of Directors for the Western Union Company (global money transfer, 2006-2011). |
Ned C. Lautenbach (1944) |
Year of Election or Appointment: 2000 Trustee Chairman of the Independent Trustees |
| Mr. Lautenbach also serves as Trustee of other Fidelity funds. Mr. Lautenbach currently serves as the Lead Director of the Eaton Corporation Board of Directors (diversified industrial, 1997-present). Mr. Lautenbach is Chairman of the Board of Directors of the Philharmonic Center for the Arts in Naples, Florida (2012-present) and a member of the Council on Foreign Relations (1994-present). Previously, Mr. Lautenbach was a Partner/Advisory Partner at Clayton, Dubilier & Rice, LLC (private equity investment, 1998-2010), as well as a Director of Sony Corporation (2006-2007). |
Joseph Mauriello (1944) |
Year of Election or Appointment: 2008 Trustee |
| Mr. Mauriello also serves as Trustee of other Fidelity funds. Prior to his retirement in January 2006, Mr. Mauriello served in numerous senior management positions including Deputy Chairman and Chief Operating Officer (2004-2005), and Vice Chairman of Financial Services (2002-2004) of KPMG LLP US (professional services, 1965-2005). Mr. Mauriello currently serves as a member of the Board of Directors of XL Group plc. (global insurance and re-insurance, 2006-present). Previously, Mr. Mauriello served as a Director of the Hamilton Funds of the Bank of New York (2006-2007) and of Arcadia Resources Inc. (health care services and products, 2007-2012). |
Robert W. Selander (1950) |
Year of Election or Appointment: 2011 Trustee |
| Mr. Selander also serves as Trustee of other Fidelity funds. Previously, Mr. Selander served as a Member of the Advisory Board of other Fidelity funds (2011), and Executive Vice Chairman (2010), Chief Executive Officer (2009-2010), and President and Chief Executive Officer (1997-2009) of Mastercard, Inc. |
Cornelia M. Small (1944) |
Year of Election or Appointment: 2005 Trustee |
| Ms. Small also serves as Trustee of other Fidelity funds. Ms. Small is a member of the Board of Directors (2009-present) and Chair of the Investment Committee (2010-present) of the Teagle Foundation. Ms. Small also serves on the Investment Committee of the Berkshire Taconic Community Foundation (2008-present). Previously, Ms. Small served as Chairperson (2002-2008) and a member of the Investment Committee and Chairperson (2008-2012) and a member of the Board of Trustees of Smith College. In addition, Ms. Small served as Chief Investment Officer, Director of Global Equity Investments, and a member of the Board of Directors of Scudder, Stevens & Clark and Scudder Kemper Investments. |
William S. Stavropoulos (1939) |
Year of Election or Appointment: 2001 Trustee Vice Chairman of the Independent Trustees |
| Mr. Stavropoulos also serves as Trustee of other Fidelity funds. Mr. Stavropoulos serves as President and Founder of the Michigan Baseball Foundation, the Great Lakes Loons (2007-present). Mr. Stavropoulos is Chairman Emeritus of the Board of Directors of The Dow Chemical Company, where he previously served in numerous senior management positions, including President, CEO (1995-2000; 2002-2004), Chairman of the Executive Committee (2000-2006), and as a member of the Board of Directors (1990-2006). Currently, Mr. Stavropoulos is Chairman of the Board of Directors of Univar Inc. (global distributor of commodity and specialty chemicals), a Director of Teradata Corporation (data warehousing and technology solutions), and Maersk Inc. (industrial conglomerate), and a member of the Advisory Board for Metalmark Capital LLC (private equity investment, 2005-present). Mr. Stavropoulos is an operating advisor to Clayton, Dubilier & Rice, LLC (private equity investment). In addition, Mr. Stavropoulos is a member of the University of Notre Dame Advisory Council for the College of Science, a Trustee of the Rollin L. Gerstacker Foundation, and a Director of the Naples Philharmonic Center for the Arts. Previously, Mr. Stavropoulos served as a Director of Chemical Financial Corporation (bank holding company, 1993-2012) and Tyco International, Ltd. (multinational manufacturing and services, 2007-2012). |
David M. Thomas (1949) |
Year of Election or Appointment: 2008 Trustee |
| Mr. Thomas also serves as Trustee of other Fidelity funds. Mr. Thomas serves as Non-Executive Chairman of the Board of Directors of Fortune Brands Home and Security (home and security products, 2011-present), and as a member of the Board of Directors of Interpublic Group of Companies, Inc. (marketing communication, 2004-present). Previously, Mr. Thomas served as Executive Chairman (2005-2006) and Chairman and Chief Executive Officer (2000-2005) of IMS Health, Inc. (pharmaceutical and healthcare information solutions), and a Director of Fortune Brands, Inc. (consumer products, 2000-2011). |
+ The information above includes each Trustee's principal occupation during the last five years and other information relating to the experience, attributes, and skills relevant to each Trustee's qualifications to serve as a Trustee, which led to the conclusion that each Trustee should serve as a Trustee for the fund.
Advisory Board Member and Executive Officers:
Correspondence intended for each executive officer and Peter S. Lynch may be sent to Fidelity Investments, 245 Summer Street, Boston, Massachusetts 02210.
Executive officers appear below in alphabetical order.
Name, Year of Birth; Principal Occupation |
Peter S. Lynch (1944) |
Year of Election or Appointment: 2003 Member of the Advisory Board |
| Mr. Lynch also serves as Member of the Advisory Board of other Fidelity funds. Mr. Lynch is Vice Chairman and a Director of FMR and FMR Co., Inc. In addition, Mr. Lynch serves as a Trustee of Boston College and as the Chairman of the Inner-City Scholarship Fund. Previously, Mr. Lynch served on the Special Olympics International Board of Directors (1997-2006). |
Elizabeth Paige Baumann (1968) |
Year of Election or Appointment: 2012 Anti-Money Laundering (AML) Officer |
| Ms. Baumann also serves as AML Officer of other funds. She is Chief AML Officer of FMR LLC (2012-present) and is an employee of Fidelity Investments. Previously, Ms. Baumann served as Vice President and Deputy Anti-Money Laundering Officer (2007-2012). |
William C. Coffey (1969) |
Year of Election or Appointment: 2009 Assistant Secretary |
| Mr. Coffey also serves as Assistant Secretary of other funds. He is Senior Vice President and Deputy General Counsel of FMR LLC (2010-present), and is an employee of Fidelity Investments. Previously, Mr. Coffey served as Vice President and Associate General Counsel of FMR LLC (2005-2009). |
Jonathan Davis (1968) |
Year of Election or Appointment: 2010 Assistant Treasurer |
| Mr. Davis also serves as Assistant Treasurer of other funds. Mr. Davis is an employee of Fidelity Investments. Previously, Mr. Davis served as Vice President and Associate General Counsel of FMR LLC (2003-2010). |
Adrien E. Deberghes (1967) |
Year of Election or Appointment: 2008 Deputy Treasurer |
| Mr. Deberghes also serves as an officer of other funds. He is an employee of Fidelity Investments (2008-present). Prior to joining Fidelity Investments, Mr. Deberghes was Senior Vice President of Mutual Fund Administration at State Street Corporation (2007-2008), Senior Director of Mutual Fund Administration at Investors Bank & Trust (2005-2007), and Director of Finance for Dunkin' Brands (2000-2005). |
Stephanie J. Dorsey (1969) |
Year of Election or Appointment: 2010 Assistant Treasurer |
| Ms. Dorsey also serves as an officer of other funds. She is an employee of Fidelity Investments (2008-present) and has served in other fund officer roles. Prior to joining Fidelity Investments, Ms. Dorsey served as Treasurer (2004-2008) of the JPMorgan Mutual Funds and Vice President (2004-2008) of JPMorgan Chase Bank. |
Scott C. Goebel (1968) |
Year of Election or Appointment: 2008 Secretary and Chief Legal Officer (CLO) |
| Mr. Goebel serves as Secretary and CLO of other funds. Mr. Goebel also serves as Secretary of Fidelity Investments Money Management, Inc. (FIMM) (2010-present) and Fidelity Research and Analysis Company (FRAC) (2010-present); General Counsel, Secretary, and Senior Vice President of FMR (2008-present) and FMR Co., Inc. (2008-present); Chief Legal Officer of Fidelity Management & Research (Hong Kong) Limited (2008-present) and Assistant Secretary of Fidelity Management & Research (Japan) Inc. (2008-present), and Fidelity Management & Research (U.K.) Inc. (2008-present). Previously, Mr. Goebel served as Secretary and CLO of other Fidelity funds (2008-2013), Assistant Secretary of FIMM (2008-2010), FRAC (2008-2010), and certain funds (2007-2008); and as Vice President and Secretary of Fidelity Distributors Corporation (FDC) (2005-2007). Mr. Goebel has been employed by FMR LLC or an affiliate since 2001. |
Joseph A. Hanlon (1968) |
Year of Election or Appointment: 2012 Chief Compliance Officer |
| Mr. Hanlon also serves as Chief Compliance Officer of other funds. Mr. Hanlon serves as Compliance Officer of FMR, FMR Co., Inc., Fidelity Investments Money Management, Inc. (FIMM), Fidelity Research and Analysis Company (FRAC), and Fidelity Management & Research (Hong Kong) (2009-present), as Senior Vice President of the Fidelity Asset Management Division (2009-present), and is an employee of Fidelity Investments. Previously, Mr. Hanlon served as Compliance Officer of Fidelity Management & Research (Japan) Inc. (2009-2013), Strategic Advisers, Inc. (2009-2013), and Fidelity Management & Research (U.K.) Inc. (2009-2013). |
Bruce T. Herring (1965) |
Year of Election or Appointment: 2006 Vice President of certain Equity Funds |
| Mr. Herring also serves as Vice President of other funds. He serves as Chief Investment Officer of Fidelity Global Asset Allocation (GAA) (2013-present), Chief Investment Officer and Director of Fidelity Management & Research (U.K.) Inc. (2010-present), Group Chief Investment Officer of FMR, and President of Fidelity Research & Analysis Company (2010-present). Previously, Mr. Herring served as Vice President (2005-2006) and Senior Vice President (2006-2007) of Fidelity Management & Research Company, Vice President of FMR Co., Inc. (2001-2007), and as a portfolio manager for Fidelity U.S. Equity Funds. |
Brian B. Hogan (1964) |
Year of Election or Appointment: 2009 Vice President |
| Mr. Hogan also serves as Vice President of other funds. Mr. Hogan serves as President of FMR's Equity Division (2009-present). Previously, Mr. Hogan served as Senior Vice President, Equity Research of FMR (2006-2009) and as a portfolio manager. |
Chris Maher (1972) |
Year of Election or Appointment: 2013 Assistant Treasurer |
| Mr. Maher serves as Assistant Treasurer of other funds. Mr. Maher is Vice President of Valuation Oversight and is an employee of Fidelity Investments. Previously, Mr. Maher served as Vice President of Asset Management Compliance (2013), Vice President of FMR's Program Management Group (2010-2013), and Vice President of Valuation Oversight (2008-2010). |
Christine Reynolds (1958) |
Year of Election or Appointment: 2008 Chief Financial Officer |
| Ms. Reynolds also serves as Chief Financial Officer of other funds. Ms. Reynolds became President of Fidelity Pricing and Cash Management Services (FPCMS) in August 2008. Ms. Reynolds served as Chief Operating Officer of FPCMS (2007-2008). Previously, Ms. Reynolds served as President, Treasurer, and Anti-Money Laundering officer of the Fidelity funds (2004-2007). |
Kenneth B. Robins (1969) |
Year of Election or Appointment: 2008 President and Treasurer |
| Mr. Robins also serves as an officer of other funds. Mr. Robins serves as Executive Vice President of Fidelity Investments Money Management, Inc. (FIMM) (2013-present) and is an employee of Fidelity Investments (2004-present). Previously, Mr. Robins served in other fund officer roles. |
Gary W. Ryan (1958) |
Year of Election or Appointment: 2005 Assistant Treasurer |
| Mr. Ryan also serves as Assistant Treasurer of other funds. Mr. Ryan is an employee of Fidelity Investments and has served in other fund officer roles. Previously, Mr. Ryan served as Vice President of Fund Reporting in Fidelity Pricing and Cash Management Services (FPCMS) (1999-2005). |
Stephen Sadoski (1971) |
Year of Election or Appointment: 2012 Deputy Treasurer |
| Mr. Sadoski also serves as Deputy Treasurer of other funds. He is an employee of Fidelity Investments (2012-present) and has served in another fund officer role. Prior to joining Fidelity Investments, Mr. Sadoski served as an assistant chief accountant in the Division of Investment Management of the Securities and Exchange Commission (SEC) (2009-2012) and as a senior manager at Deloitte & Touche LLP (1997-2009). |
Stacie M. Smith (1974) |
Year of Election or Appointment: 2013 Deputy Treasurer |
| Ms. Smith also serves as an officer of other funds. She is an employee of Fidelity Investments (2009-present) and has served in other fund officer roles. Prior to joining Fidelity Investments, Ms. Smith served as Senior Audit Manager of Ernst & Young LLP (1996-2009). |
Renee Stagnone (1975) |
Year of Election or Appointment: 2013 Deputy Treasurer |
| Ms. Stagnone also serves as Deputy Treasurer of other funds. Ms. Stagnone is an employee of Fidelity Investments. |
Joseph F. Zambello (1957) |
Year of Election or Appointment: 2011 Deputy Treasurer |
| Mr. Zambello also serves as Deputy Treasurer of other funds. Mr. Zambello is an employee of Fidelity Investments. Previously, Mr. Zambello served as Vice President of FMR's Program Management Group (2009-2011) and Vice President of the Transfer Agent Oversight Group (2005-2009). |
Annual Report
The Board of Trustees of Fidelity International Growth Fund voted to pay to shareholders of record at the opening of business on record date, the following distributions per share derived from capital gains realized from sales of portfolio securities, and dividends derived from net investment income:
| Pay Date | Record Date | Dividends | Capital Gains |
Institutional Class | 12/09/13 | 12/06/13 | $0.057 | $0.009 |
The fund hereby designates as a capital gain dividend with respect to the taxable year ended October 31, 2013, $585,832, or, if subsequently determined to be different, the net capital gain of such year.
Institutional Class designates 12% of the dividends distributed in December 2012 as indicated in the Corporate Qualifying memo distributed by the Tax department, during the fiscal year as qualifying for the dividends-received deduction for corporate shareholders.
Institutional Class designates 100% of the dividends distributed in December during the fiscal year as amounts which may be taken into account as a dividend for purposes of the maximum rate under section 1(h)(11) of the Internal Revenue Code.
The amounts per share which represent income derived from sources within, and taxes paid to, foreign countries or possessions of the United States are as follows:
| Pay Date | Income | Taxes |
Institutional Class | 12/10/2012 | $0.052 | $0.0053 |
The fund will notify shareholders in January 2014 of amounts for use in preparing 2013 income tax returns.
Annual Report
Board Approval of Investment Advisory Contracts and Management Fees
Fidelity International Growth Fund
Each year, the Board of Trustees, including the Independent Trustees (together, the Board), votes on the renewal of the management contract and sub-advisory agreements (together, the Advisory Contracts) for the fund. The Board, assisted by the advice of fund counsel and Independent Trustees' counsel, requests and considers a broad range of information relevant to the renewal of the Advisory Contracts throughout the year.
The Board meets regularly and, at each of its meetings, covers an extensive agenda of topics and materials and considers factors that are relevant to its annual consideration of the renewal of the fund's Advisory Contracts, including the services and support provided to the fund and its shareholders. The Board has established various standing committees, each composed of and chaired by Independent Trustees with varying backgrounds, to which the Board has assigned specific subject matter responsibilities in order to enhance effective decision-making by the Board. The Board, acting directly and through its Committees, requests and receives information concerning the annual consideration of the renewal of the fund's Advisory Contracts. The Board also meets as needed to consider matters specifically related to the Board's annual consideration of the renewal of Advisory Contracts. Members of the Board may also meet with trustees of other Fidelity funds through ad hoc joint committees to discuss certain matters relevant to the Fidelity funds.
At its July 2013 meeting, the Board, including the Independent Trustees, unanimously determined to renew the fund's Advisory Contracts. In reaching its determination, the Board considered all factors it believed relevant, including (i) the nature, extent, and quality of the services to be provided to the fund and its shareholders (including the investment performance of the fund); (ii) the competitiveness of the fund's management fee and total expense ratio relative to peer funds; (iii) the total costs of the services to be provided by and the profits to be realized by Fidelity from its relationship with the fund; (iv) the extent to which economies of scale exist and would be realized as the fund grows; and (v) whether fee levels reflect these economies of scale, if any, for the benefit of fund shareholders.
In considering whether to renew the Advisory Contracts for the fund, the Board reached a determination, with the assistance of fund counsel and Independent Trustees' counsel and through the exercise of its business judgment, that the renewal of the Advisory Contracts was in the best interests of the fund and its shareholders and that the compensation payable under the Advisory Contracts was fair and reasonable. The Board's decision to renew the Advisory Contracts was not based on any single factor, but rather was based on a comprehensive consideration of all the information provided to the Board at its meetings throughout the year. The Board, in reaching its determination to renew the Advisory Contracts, was aware that shareholders in the fund have a broad range of investment choices available to them, including a wide choice among mutual funds offered by Fidelity's competitors, and that the fund's shareholders, who have the opportunity to review and weigh the disclosure provided by the fund in its prospectus and other public disclosures, have chosen to invest in this fund, which is a part of the Fidelity family of funds.
Annual Report
Nature, Extent, and Quality of Services Provided. The Board considered the staffing within the investment adviser, Fidelity Management & Research Company (FMR), and the sub-advisers (together, the Investment Advisers) as it relates to the fund, including the backgrounds of the fund's investment personnel, and also considered the fund's investment objective, strategies, and related investment philosophy. The Independent Trustees also had discussions with senior management of Fidelity's investment operations and investment groups. The Board considered the structure of the portfolio manager compensation program and whether this structure provides appropriate incentives to act in the best interests of the fund.
Resources Dedicated to Investment Management and Support Services. The Board and the Fund Oversight and Research Committees reviewed the general qualifications and capabilities of the Investment Advisers' investment staff, including its size, education, experience, and resources, as well as the Investment Advisers' approach to recruiting, training, managing, and compensating investment personnel. The Board noted that FMR has continued to increase the resources devoted to non-U.S. offices, including expansion of Fidelity's global investment organization. The Board also noted that Fidelity's analysts have extensive resources, tools and capabilities that allow them to conduct sophisticated quantitative and fundamental analysis, as well as credit analysis of issuers, counterparties and guarantors. Further, the Board believes that Fidelity's investment professionals have sufficient access to global information and data so as to provide competitive investment results over time, and that those professionals also have access to sophisticated tools that permit them to assess portfolio construction and risk and performance attribution characteristics continuously, as well as to transmit new information and research conclusions rapidly around the world. Additionally, in its deliberations, the Board considered the Investment Advisers' trading and risk management capabilities and resources, which are an integral part of the investment management process.
Shareholder and Administrative Services. The Board considered (i) the nature, extent, quality, and cost of advisory, administrative, and shareholder services performed by the Investment Advisers and their affiliates under the Advisory Contracts and under separate agreements covering transfer agency, pricing and bookkeeping, and securities lending services for the fund; (ii) the nature and extent of the supervision of third party service providers, principally custodians and subcustodians; and (iii) the resources devoted to, and the record of compliance with, the fund's compliance policies and procedures. The Board also reviewed the allocation of fund brokerage, including allocations to brokers affiliated with the Investment Advisers, the use of brokerage commissions to pay fund expenses, and the use of "soft" commission dollars to pay for research services.
Annual Report
Board Approval of Investment Advisory Contracts and
Management Fees - continued
The Board noted that the growth of fund assets over time across the complex allows Fidelity to reinvest in the development of services designed to enhance the value or convenience of the Fidelity funds as investment vehicles. These services include 24-hour access to account information and market information through telephone representatives and over the Internet, investor education materials and asset allocation tools, and the expanded availability of Fidelity Investor Centers.
Investment in a Large Fund Family. The Board considered the benefits to shareholders of investing in a Fidelity fund, including the benefits of investing in a fund that is part of a large family of funds offering a variety of investment disciplines and providing a large variety of mutual fund investor services. The Board noted that Fidelity had taken, or had made recommendations that resulted in the Fidelity funds taking, a number of actions over the previous year that benefited particular funds, including (i) continuing to dedicate additional resources to investment research and to the support of the senior management team that oversees asset management; (ii) persisting in efforts to enhance Fidelity's global research capabilities; (iii) launching new funds and making other enhancements to meet client needs for global and income-oriented solutions; (iv) continuing to launch dedicated lower cost underlying funds to meet portfolio construction needs related to expanding underlying fund options for Fidelity funds of funds, specifically for the Freedom Fund product lines; (v) rationalizing product lines and gaining increased efficiencies through the mergers of several funds into other funds; (vi) strengthening Fidelity's index fund offerings by reducing investment minimums and adopting or lowering existing expense caps for certain funds and classes; (vii) enhancing Global Asset Allocation product offerings by launching new funds and strategies, including "open architecture" target date funds that utilize affiliated and unaffiliated sub-advisers; (viii) modifying the eligibility criteria for Institutional Class shares of Advisor funds to increase their marketability to a portion of the defined contribution plan market; (ix) creating a new low-cost retirement share class for certain Advisor funds to appeal to large retirement plans; (x) transitioning the management of certain Fidelity commodity funds to Geode Capital Management LLC, a registered commodity pool operator, while retaining administrative responsibilities for the funds; (xi) reorganizing a number of funds; and (xii) taking steps toward establishing a new Fidelity adviser to manage sector-based funds and products.
Investment Performance. The Board considered whether the fund has operated in accordance with its investment objective, as well as its record of compliance with its investment restrictions and its performance history.
The Board took into account discussions with the Investment Advisers about fund investment performance that occur at Board meetings throughout the year. In this regard the Board noted that as part of regularly scheduled fund reviews and other reports to the Board on fund performance, the Board periodically considers annualized return information for the fund, for different time periods, measured against a securities market index ("benchmark index") and a peer group of mutual funds with similar objectives ("peer group"). In its evaluation of fund investment performance, the Board gave particular attention to information indicating changes in performance of certain Fidelity funds for specific time periods and the Investment Advisers' explanations for any overperformance or underperformance.
Annual Report
In addition to reviewing absolute and relative fund performance, the Independent Trustees periodically consider the appropriateness of fund performance metrics in evaluating the results achieved. In general, the Independent Trustees believe that fund performance should be evaluated based on net performance (after fees and expenses) of both the highest performing and lowest performing classes, where applicable, compared to appropriate benchmark indices, over appropriate time periods which may include full market cycles, and compared to peer groups, as applicable, over the same periods, taking into account relevant factors including the following: general market conditions; issuer-specific information; tactical opportunities for investment; and fund cash flows and other factors.
The Independent Trustees recognize that shareholders evaluate performance on a net basis over their own holding periods, for which one-, three-, and five-year periods are used as a proxy. For this reason, the performance information reviewed by the Board also included net cumulative calendar year total return information for the fund and an appropriate benchmark index and peer group for the most recent one-, three-, and five-year periods, as shown below. Returns are shown compared to the 25th percentile (top of box) and 75th percentile (bottom of box) of the peer universe. Returns of the benchmark index are "net MA," i.e., adjusted for tax withholding rates applicable to U.S.-based mutual funds organized as Massachusetts business trusts.
Annual Report
Board Approval of Investment Advisory Contracts and
Management Fees - continued
Fidelity International Growth Fund

The Board also considered that the fund's management fee is subject to upward or downward adjustment depending upon whether, and to what extent, the fund's investment performance for the performance period exceeds, or is exceeded by, a securities index, thus leading to a performance adjustment for the same period. The Board noted that the performance adjustment provides FMR with a strong economic incentive to seek to achieve superior performance for the fund's shareholders and helps to more closely align the interests of FMR and the fund's shareholders.
Based on its review, the Board concluded that the nature, extent, and quality of services provided to the fund under the Advisory Contracts should benefit the fund's shareholders.
Competitiveness of Management Fee and Total Expense Ratio. The Board considered the fund's management fee and total expense ratio compared to "mapped groups" of competitive funds and classes. Fidelity creates "mapped groups" by combining similar Lipper investment objective categories that have comparable management fee characteristics. Combining Lipper investment objective categories aids the Board's management fee and total expense ratio comparisons by broadening the competitive group used for comparison and by reducing the number of universes to which various Fidelity funds are compared.
Management Fee. The Board considered two proprietary management fee comparisons for the 12-month periods shown in the chart below. The group of Lipper funds used by the Board for management fee comparisons is referred to below as the "Total Mapped Group." The Total Mapped Group comparison focuses on a fund's standing in terms of gross management fees before expense reimbursements or caps, and without giving effect to the fund's performance adjustment, relative to the total universe of funds with comparable investment mandates, regardless of whether their management fee structures also are comparable. Funds with comparable investment mandates offer exposure to similar types of securities. Funds with comparable management fee structures have similar management fee contractual arrangements (e.g., flat rate charged for advisory services, all-inclusive fee rate, etc.). "TMG %" represents the percentage of funds in the Total Mapped Group that had management fees that were lower than the fund's. For example, a TMG % of 16% means that 84% of the funds in the Total Mapped Group had higher management fees than the fund. The "Asset-Size Peer Group" (ASPG) comparison focuses on a fund's standing relative to a subset of non-Fidelity funds within the Total Mapped Group that are similar in size and management fee structure. The ASPG represents at least 15% of the funds in the Total Mapped Group with comparable asset size and management fee structures, subject to a minimum of 50 funds (or all funds in the Total Mapped Group if fewer than 50). Additional information, such as the ASPG quartile in which the fund's management fee ranked and the impact of the fund's performance adjustment, is also included in the chart and considered by the Board.
Annual Report
Fidelity International Growth Fund

The Board noted that the fund's management fee ranked below the median of its Total Mapped Group and below the median of its ASPG for 2012. The Board also noted the effect of the fund's positive performance adjustment on the fund's management fee ranking.
Annual Report
Board Approval of Investment Advisory Contracts and
Management Fees - continued
Based on its review, the Board concluded that the fund's management fee is fair and reasonable in light of the services that the fund receives and the other factors considered.
Total Expense Ratio. In its review of each class's total expense ratio, the Board considered the fund's management fee as well as other fund or class expenses, as applicable, such as transfer agent fees, pricing and bookkeeping fees, fund-paid 12b-1 fees, and custodial, legal, and audit fees. The Board also noted the effects of any waivers and reimbursements on fees and expenses, as well as the impact of the fund's performance adjustment. As part of its review, the Board also considered the current and historical total expense ratios of each class of the fund compared to competitive fund median expenses. Each class of the fund is compared to those funds and classes in the Total Mapped Group (used by the Board for management fee comparisons) that have a similar sales load structure.
The Board noted that the total expense ratio of each of Class A and the retail class ranked below its competitive median for 2012 and the total expense ratio of each of Class T, Class B, Class C, and Institutional Class ranked above its competitive median for 2012. The Board considered that, in general, various factors can affect total expense ratios. The Board noted that the total expense ratio of Class T was above the competitive median primarily because of higher 12b-1 fees on Class T. Class T has a higher 12b-1 fee, but a lower front-end sales charge, than traditionally priced front-end sales charge classes. The Board considered that Class T is primarily sold load-waived in the retirement plan market where its 0.50% 12b-1 fee is comparable to competing no-load, higher 12b-1 fee classes designed specifically for retirement plans. The Board noted that the fund offers multiple classes, each of which has a different sales load and 12b-1 fee structure, and that the multiple structures are intended to offer a range of pricing options for the intermediary market. The Board also noted that the total expense ratios of the classes vary primarily by the level of their 12b-1 fees, although differences in transfer agent fees may also cause expenses to vary from class to class.
The Board further considered that FMR contractually agreed to reimburse Class A, Class T, Class B, Class C, Institutional Class, and the retail class of the fund to the extent that total operating expenses (excluding interest, taxes, certain securities lending costs, brokerage commissions, extraordinary expenses, and acquired fund fees and expenses, if any), as a percentage of their respective average net assets, exceed 1.45%, 1.70%, 2.20%, 2.20%, 1.20%, and 1.20% through December 31, 2013.
Fees Charged to Other Fidelity Clients. The Board also considered Fidelity fee structures and other information with respect to clients of FMR and its affiliates, such as other mutual funds advised or subadvised by FMR or its affiliates, pension plan clients, and other institutional clients. The Board noted the findings of the 2013 ad hoc joint committee (created with the board of other Fidelity funds), which reviewed and compared Fidelity's institutional investment advisory business with its business of providing services to the Fidelity funds, including the differences in services provided, fees charged, and costs incurred, as well as competition in their respective marketplaces.
Annual Report
Based on its review of total expense ratios and fees charged to other Fidelity clients, the Board concluded that the total expense ratio of each class of the fund was reasonable, although in some cases above the median of the universe presented for comparison, in light of the services that the fund and its shareholders receive and the other factors considered.
Costs of the Services and Profitability. The Board considered the revenues earned and the expenses incurred by Fidelity in conducting the business of developing, marketing, distributing, managing, administering and servicing the fund and servicing the fund's shareholders. The Board also considered the level of Fidelity's profits in respect of all the Fidelity funds.
On an annual basis, FMR presents to the Board Fidelity's profitability for the fund. Fidelity calculates the profitability for each fund, as well as aggregate profitability for groups of Fidelity funds and all Fidelity funds, using a series of detailed revenue and cost allocation methodologies which originate with the books and records of Fidelity on which Fidelity's audited financial statements are based. The Audit Committee of the Board reviews any significant changes from the prior year's methodologies.
PricewaterhouseCoopers LLP (PwC), independent registered public accounting firm and auditor to Fidelity and certain Fidelity funds, has been engaged annually by the Board as part of the Board's assessment of Fidelity's profitability analysis. PwC's engagement includes the review and assessment of the methodologies used by Fidelity in determining the revenues and expenses attributable to Fidelity's mutual fund business, and completion of agreed-upon procedures surrounding the mathematical accuracy of fund profitability and its conformity to allocation methodologies. After considering PwC's reports issued under the engagement and information provided by Fidelity, the Board concluded that while other allocation methods may also be reasonable, Fidelity's profitability methodologies are reasonable in all material respects.
The Board also reviewed Fidelity's non-fund businesses and fall-out benefits related to the mutual fund business as well as cases where Fidelity's affiliates may benefit from or be related to the fund's business.
The Board considered the costs of the services provided by and the profits realized by Fidelity in connection with the operation of the fund and was satisfied that the profitability was not excessive in the circumstances.
Economies of Scale. The Board considered whether there have been economies of scale in respect of the management of the Fidelity funds, whether the Fidelity funds (including the fund) have appropriately benefited from any such economies of scale, and whether there is potential for realization of any further economies of scale. The Board considered the extent to which the fund will benefit from economies of scale through increased services to the fund, through waivers or reimbursements, or through fee or expense reductions. The Board also noted that in 2009, it and the board of other Fidelity funds created an ad hoc committee (the Economies of Scale Committee) to analyze whether FMR attains economies of scale in respect of the management and servicing of the Fidelity funds, whether the Fidelity funds have appropriately benefited from such economies of scale, and whether there is potential for realization of any further economies of scale.
Annual Report
Board Approval of Investment Advisory Contracts and
Management Fees - continued
The Board recognized that the fund's management contract incorporates a "group fee" structure, which provides for lower group fee rates as total fund assets under FMR's management increase, and for higher group fee rates as total fund assets under FMR's management decrease. FMR calculates the group fee rates based on a tiered asset "breakpoint" schedule that varies based on asset class. The Board considered that the group fee is designed to deliver the benefits of economies of scale to fund shareholders when total Fidelity fund assets increase, even if assets of any particular fund are unchanged or have declined, because some portion of Fidelity's costs are attributable to services provided to all Fidelity funds, and all funds benefit if those costs can be allocated among more assets. The Board concluded that, given the group fee structure, fund shareholders will benefit from lower management fees as assets under FMR's management increase at the fund complex level, regardless of whether Fidelity achieves any such economies of scale.
The Board concluded, taking into account the analysis of the Economies of Scale Committee, that economies of scale, if any, are being appropriately shared between fund shareholders and Fidelity.
Amendment to Description of Group Fee Rate. At its July 2013 meeting, the Board voted to approve an amendment to the fund's management contract to modify the description of the "group fee rate" effective August 1, 2013. The Board noted that under the prior description in the contract, the group fee rate was based on the average net assets of all registered investment companies with which FMR has management contracts. Under the contract's tiered asset breakpoint schedule, the group fee rate is lower as total fund assets under FMR's management increase, and higher as total fund assets under FMR's management decrease. The Board considered that the prior description would have excluded the assets of 64 Fidelity sector funds from the group fee rate calculation once Fidelity SelectCo, LLC, an affiliate of FMR, assumed management responsibilities for those funds. The Board noted that modifying the description of the group fee rate to continue to include the assets of those 64 funds for purposes of determining group fee rate breakpoints would avoid an immediate adverse impact on the group fee rate for any fund.
Annual Report
Additional Information Requested by the Board. In order to develop fully the factual basis for consideration of the Fidelity funds' Advisory Contracts, the Board requested and received additional information on certain topics, including: (i) fund performance trends and Fidelity's long-term strategies for certain funds; (ii) the potential to further rationalize the Fidelity fund lineup with the possibility of achieving savings for the funds and Fidelity; (iii) the methodology with respect to competitive fund data and peer group classifications; (iv) the arrangements with, and performance of, certain sub-advisers on behalf of the Fidelity funds, as well as certain proposed participating affiliate arrangements; (v) the realization of fall-out benefits in certain Fidelity business units; (vi) Fidelity's group fee structures, including the rationale for the individual fee rates of certain categories of funds and the definition of group assets; (vii) trends regarding industry use of performance fee structures and the performance adjustment methodologies applicable to the Fidelity funds; (viii) additional competitive analysis regarding the total expenses for certain classes; and (ix) fund profitability methodology, including Fidelity's cost allocation methodology, and the impact of certain factors on fund profitability results.
Based on its evaluation of all of the conclusions noted above, and after considering all factors it believed relevant, the Board ultimately concluded that the advisory fee structures are fair and reasonable, and that the fund's Advisory Contracts should be renewed.
Annual Report
Investment Adviser
Fidelity Management & Research Company
Boston, MA
Investment Sub-Advisers
FMR Co., Inc.
Fidelity Management & Research
(U.K.) Inc.
Fidelity Management & Research
(Hong Kong) Limited
Fidelity Management & Research
(Japan) Inc.
FIL Investment Advisors
FIL Investments (Japan) Limited
FIL Investment Advisors (UK) Limited
General Distributor
Fidelity Distributors Corporation
Smithfield, RI
Transfer and Service Agents
Fidelity Investments Institutional Operations Company, Inc.
Boston, MA
Fidelity Service Company, Inc.
Boston, MA
Custodian
State Street Bank and Trust Company
Quincy, MA
(Fidelity Investment logo)(registered trademark)
AIGFI-UANN-1213
1.853341.105
Fidelity®
Emerging Europe,
Middle East, Africa (EMEA)
Fund
Annual Report
October 31, 2013
(Fidelity Cover Art)
Contents
Performance | (Click Here) | How the fund has done over time. |
Management's Discussion of Fund Performance | (Click Here) | The Portfolio Manager's review of fund performance and strategy. |
Shareholder Expense Example | (Click Here) | An example of shareholder expenses. |
Investment Changes | (Click Here) | A summary of major shifts in the fund's investments over the past six months. |
Investments | (Click Here) | A complete list of the fund's investments with their market values. |
Financial Statements | (Click Here) | Statements of assets and liabilities, operations, and changes in net assets, as well as financial highlights. |
Notes | (Click Here) | Notes to the financial statements. |
Report of Independent Registered Public Accounting Firm | (Click Here) | |
Trustees and Officers | (Click Here) | |
Distributions | (Click Here) | |
Board Approval of Investment Advisory Contracts and Management Fees | (Click Here) | |
To view a fund's proxy voting guidelines and proxy voting record for the 12-month period ended June 30, visit http://www.fidelity.com/proxyvotingresults or visit the Securities and Exchange Commission's (SEC) web site at http://www.sec.gov. You may also call 1-800-544-8544 to request a free copy of the proxy voting guidelines.
Standard & Poor's, S&P and S&P 500 are registered service marks of The McGraw-Hill Companies, Inc. and have been licensed for use by Fidelity Distributors Corporation.
Other third-party marks appearing herein are the property of their respective owners.
All other marks appearing herein are registered or unregistered trademarks or service marks of FMR LLC or an affiliated company. © 2013 FMR LLC. All rights reserved.
Annual Report
This report and the financial statements contained herein are submitted for the general information of the shareholders of the fund. This report is not authorized for distribution to prospective investors in the fund unless preceded or accompanied by an effective prospectus.
A fund files its complete schedule of portfolio holdings with the SEC for the first and third quarters of each fiscal year on Form N-Q. Forms N-Q are available on the SEC's web site at http://www.sec.gov. A fund's Forms N-Q may be reviewed and copied at the SEC's Public Reference Room in Washington, DC. Information regarding the operation of the SEC's Public Reference Room may be obtained by calling 1-800-SEC-0330. For a complete list of a fund's portfolio holdings, view the most recent holdings listing, semiannual report, or annual report on Fidelity's web site at http://www.fidelity.com, http://www.advisor.fidelity.com, or http://www.401k.com, as applicable.
NOT FDIC INSURED • MAY LOSE VALUE • NO BANK GUARANTEE
Neither the fund nor Fidelity Distributors Corporation is a bank.
Annual Report
Average annual total return reflects the change in the value of an investment, assuming reinvestment of the class' distributions from dividend income and capital gains (the profits earned upon the sale of securities that have grown in value, if any) and assuming a constant rate of performance each year. The $10,000 table and the fund's returns do not reflect the deduction of taxes that a shareholder would pay on fund distributions or the redemption of fund shares. During periods of reimbursement by Fidelity, a fund's total return will be greater than it would be had the reimbursement not occurred. How a fund did yesterday is no guarantee of how it will do tomorrow.
Average Annual Total Returns
Periods ended October 31, 2013 | Past 1
year | Past 5
years | Life of
fund A |
Fidelity® Emerging Europe, Middle East, Africa (EMEA) Fund | 11.90% | 16.71% | 0.55% |
A From May 8, 2008.
$10,000 Over Life of Fund
Let's say hypothetically that $10,000 was invested in Fidelity® Emerging Europe, Middle East, Africa (EMEA) Fund, a class of the fund, on May 8, 2008, when the fund started. The chart shows how the value of your investment would have changed, and also shows how the MSCI® EM (Emerging Markets) Europe, Middle East and Africa Index performed over the same period.
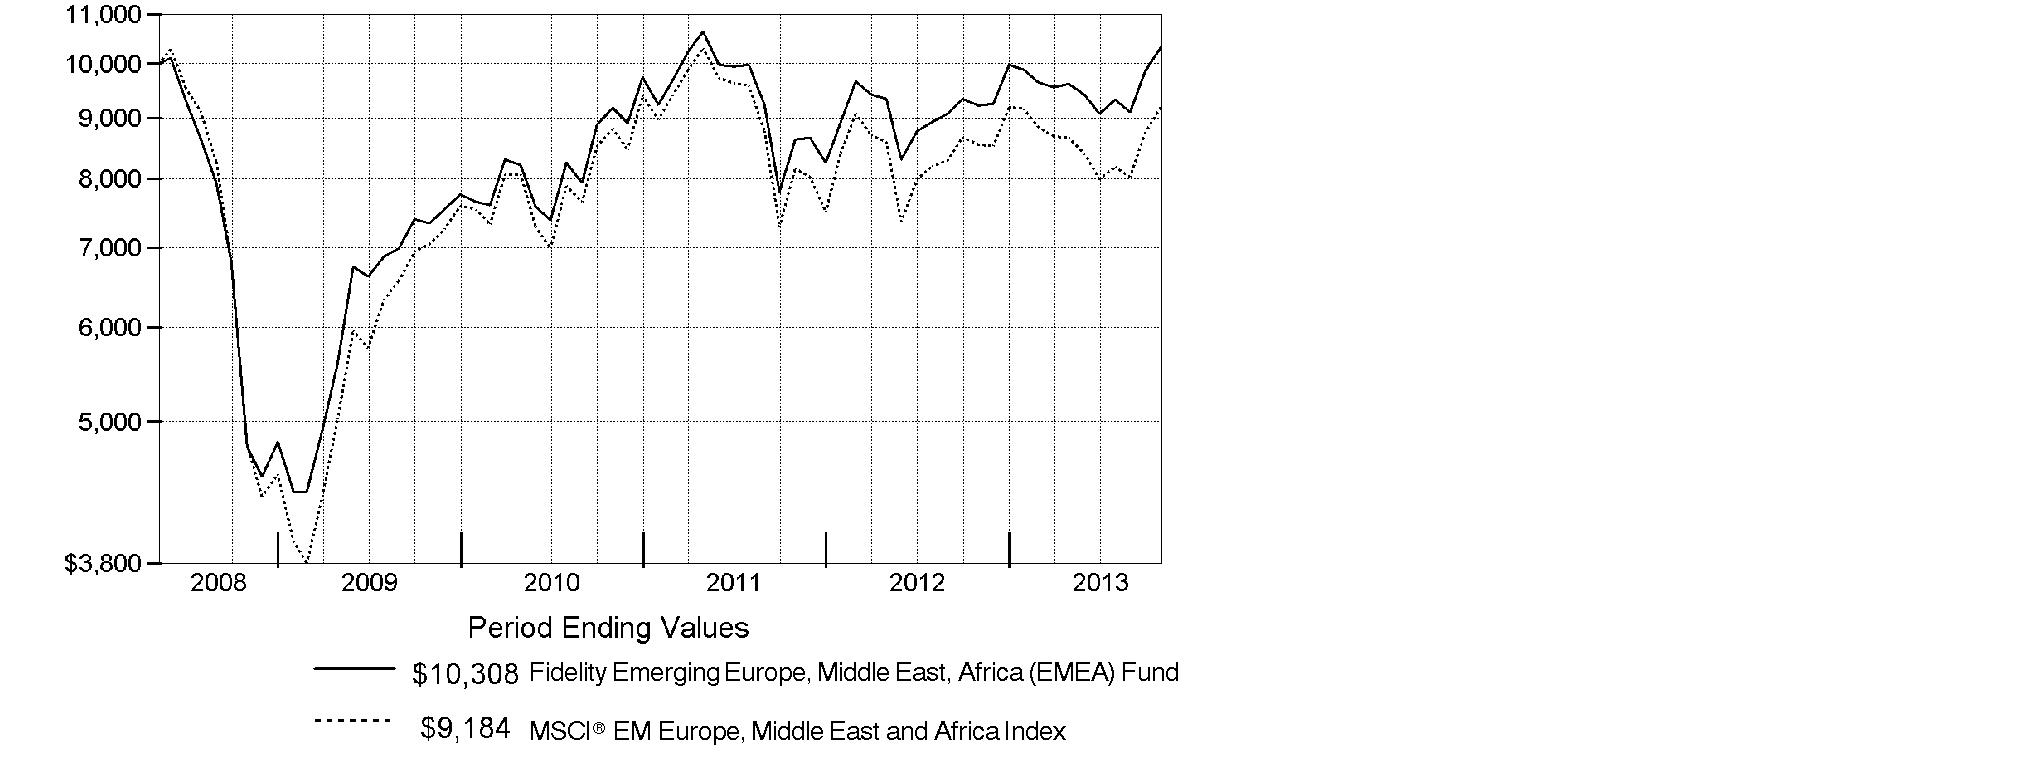
Annual Report
Market Recap: On balance, global equity markets remained upbeat for the 12-month period ending October 31, 2013. The MSCI® ACWI® (All Country World Index) Index gained 23.75% for the period, amid investor preference for higher-risk assets. The period was not without turbulence, however. In the spring and summer, central banks worldwide, especially in the U.S. and China, made clear their intentions to maintain accommodative monetary policies. That stance, combined with modest cyclical improvements around the globe and generally low valuations, underpinned the broad rally in equities. Europe (+32%) shone brightly, with most markets in the region - large and small - registering solid, index-beating gains. Another bright spot was Japan, which, despite a struggling yen and taking a second-half breather, posted a 34% result for the full year. The U.S. - by far the index's biggest constituent - also outperformed the global market with a roughly 28% advance. Meanwhile, Asia-Pacific ex Japan (+14%) lagged, hurt in part by a slowdown in Australia's mining industry as well as currency headwinds. Foreign-exchange and commodity weakness also curbed results in resource-heavy Canada and emerging markets (EM), both of which were up 7%. Country-level EM performance diverged meaningfully for the period, as evidenced by performance in Brazil (-1%), Russia (+12%), India (+1%) and China (+8%).
Comments from Adam Kutas, Portfolio Manager of Fidelity® Emerging Europe, Middle East, Africa (EMEA) Fund: For the year, the fund's Retail Class shares returned 11.90%, significantly outperforming the 7.52% gain of the MSCI® EM (Emerging Markets) Europe, Middle East and Africa Index. Versus the index, the fund benefited from out-of-benchmark positions in the United Arab Emirates (UAE) and Kenya, including First Gulf Bank - the fund's top relative contributor during the period - Dubai Financial Market and Aldar Properties, and Kenyan wireless telecommunication services provider Safaricom. Conversely, performance was hurt by the fund's positioning in South Africa - including main detractors Harmony Gold Mining and DRDGOLD, the latter of which was not in the index - unfavorable security selection in Turkey, and underweightings in Poland and Russia.
Note to shareholders: The fund may invest up to 35% of its total assets in any industry that represents more than 20% of the emerging Europe, Middle East and Africa markets. As of October 31, 2013, the fund did not have more than 25% of its total assets in any one industry.
The views expressed above reflect those of the portfolio manager(s) only through the end of the period as stated on the cover of this report and do not necessarily represent the views of Fidelity or any other person in the Fidelity organization. Any such views are subject to change at any time based upon market or other conditions and Fidelity disclaims any responsibility to update such views. These views may not be relied on as investment advice and, because investment decisions for a Fidelity fund are based on numerous factors, may not be relied on as an indication of trading intent on behalf of any Fidelity fund.
Annual Report
Shareholder Expense Example
As a shareholder of the Fund, you incur two types of costs: (1) transaction costs, including sales charges (loads) on purchase payments or redemption proceeds, redemption fees and (2) ongoing costs, including management fees, distribution and/or service (12b-1) fees and other Fund expenses. This Example is intended to help you understand your ongoing costs (in dollars) of investing in the Fund and to compare these costs with the ongoing costs of investing in other mutual funds.
The Example is based on an investment of $1,000 invested at the beginning of the period and held for the entire period (May 1, 2013 to October 31, 2013).
Actual Expenses
The first line of the accompanying table for each class of the Fund provides information about actual account values and actual expenses. You may use the information in this line, together with the amount you invested, to estimate the expenses that you paid over the period. Simply divide your account value by $1,000.00 (for example, an $8,600 account value divided by $1,000.00 = 8.6), then multiply the result by the number in the first line for a class of the Fund under the heading entitled "Expenses Paid During Period" to estimate the expenses you paid on your account during this period. A small balance maintenance fee of $12.00 that is charged once a year may apply for certain accounts with a value of less than $2,000. This fee is not included in the table below. If it was, the estimate of expenses you paid during the period would be higher, and your ending account value lower, by this amount. In addition, the Fund, as a shareholder in the underlying Fidelity Central Funds, will indirectly bear its pro-rata share of the fees and expenses incurred by the underlying Fidelity Central Funds. These fees and expenses are not included in the Fund's annualized expense ratio used to calculate the expense estimate in the table below.
Hypothetical Example for Comparison Purposes
The second line of the accompanying table for each class of the Fund provides information about hypothetical account values and hypothetical expenses based on a Class' actual expense ratio and an assumed rate of return of 5% per year before expenses, which is not the Class' actual return. The hypothetical account values and expenses may not be used to estimate the actual ending account balance or expenses you paid for the period. You may use this information to compare the ongoing costs of investing in the Fund and other funds. To do so, compare this 5% hypothetical example with the 5% hypothetical examples that appear in the shareholder reports of the other funds. A small balance maintenance fee of $12.00 that is charged once a year may apply for certain accounts with a value of less than $2,000. This fee is not included in the table below. If it was, the estimate of expenses you paid during the period would be higher, and your ending account value lower, by this amount. In addition, the Fund, as a shareholder in the underlying Fidelity Central Funds, will indirectly bear its pro-rata share of the fees and expenses incurred by the underlying Fidelity Central Funds. These fees and expenses are not included in the Fund's annualized expense ratio used to calculate the expense estimate in the table below.
Please note that the expenses shown in the table are meant to highlight your ongoing costs only and do not reflect any transaction costs. Therefore, the second line of the table is useful in comparing ongoing costs only, and will not help you determine the relative total costs of owning different funds. In addition, if these transactional costs were included, your costs would have been higher.
Annual Report
Shareholder Expense Example - continued
| Annualized Expense RatioB | Beginning
Account Value
May 1, 2013 | Ending
Account Value
October 31, 2013 | Expenses Paid
During Period*
May 1, 2013 to October 31, 2013 |
Class A | 1.62% | | | |
Actual | | $ 1,000.00 | $ 1,072.30 | $ 8.46 |
HypotheticalA | | $ 1,000.00 | $ 1,017.04 | $ 8.24 |
Class T | 1.90% | | | |
Actual | | $ 1,000.00 | $ 1,070.10 | $ 9.91 |
HypotheticalA | | $ 1,000.00 | $ 1,015.63 | $ 9.65 |
Class B | 2.40% | | | |
Actual | | $ 1,000.00 | $ 1,068.60 | $ 12.51 |
HypotheticalA | | $ 1,000.00 | $ 1,013.11 | $ 12.18 |
Class C | 2.40% | | | |
Actual | | $ 1,000.00 | $ 1,068.30 | $ 12.51 |
HypotheticalA | | $ 1,000.00 | $ 1,013.11 | $ 12.18 |
Emerging Europe, Middle East, Africa (EMEA) | 1.40% | | | |
Actual | | $ 1,000.00 | $ 1,073.30 | $ 7.32 |
HypotheticalA | | $ 1,000.00 | $ 1,018.15 | $ 7.12 |
Institutional Class | 1.23% | | | |
Actual | | $ 1,000.00 | $ 1,074.50 | $ 6.43 |
HypotheticalA | | $ 1,000.00 | $ 1,019.00 | $ 6.26 |
A 5% return per year before expenses
B Annualized expense ratio reflects expenses net of applicable fee waivers.
* Expenses are equal to each Class' annualized expense ratio, multiplied by the average account value over the period, multiplied by 184/365 (to reflect the one-half year period).
Annual Report
Investment Changes (Unaudited)
Geographic Diversification (% of fund's net assets) |
As of October 31, 2013 |
 | South Africa 36.6% | |
 | Russia 31.9% | |
 | Poland 5.6% | |
 | United Arab Emirates 4.5% | |
 | Turkey 3.7% | |
 | Czech Republic 2.8% | |
 | United Kingdom 2.6% | |
 | Kenya 2.1% | |
 | Qatar 1.8% | |
 | Other * 8.4% | |

* Includes Short-Term Investments and Net Other Assets (Liabilities). |
Percentages are based on country or territory of incorporation and are adjusted for the effect of futures contracts, if applicable. |
As of April 30, 2013 |
| South Africa 38.4% | |
| Russia 32.3% | |
| Turkey 9.3% | |
| United Arab Emirates 4.9% | |
| Poland 2.8% | |
| Kenya 2.7% | |
| Qatar 1.6% | |
| Nigeria 1.2% | |
| Czech Republic 1.0% | |
| Other * 5.8% | |

* Includes Short-Term Investments and Net Other Assets (Liabilities). |
Percentages are based on country or territory of incorporation and are adjusted for the effect of futures contracts, if applicable. |
Asset Allocation as of October 31, 2013 |
| % of fund's
net assets | % of fund's net assets
6 months ago |
Stocks | 99.1 | 99.3 |
Short-Term Investments and Net Other Assets (Liabilities) | 0.9 | 0.7 |
Top Ten Stocks as of October 31, 2013 |
| % of fund's
net assets | % of fund's net assets
6 months ago |
Sberbank (Savings Bank of the Russian Federation) (Russia, Commercial Banks) | 7.1 | 8.7 |
LUKOIL Oil Co. (United Kingdom) (Russia, Oil, Gas & Consumable Fuels) | 6.7 | 7.8 |
MTN Group Ltd. (South Africa, Wireless Telecommunication Services) | 5.7 | 7.2 |
Gazprom OAO (Russia, Oil, Gas & Consumable Fuels) | 5.4 | 4.3 |
Naspers Ltd. Class N (South Africa, Media) | 4.3 | 2.1 |
Sasol Ltd. (South Africa, Oil, Gas & Consumable Fuels) | 2.7 | 1.5 |
Bank Polska Kasa Opieki SA (Poland, Commercial Banks) | 2.7 | 1.8 |
Magnit OJSC (Russia, Food & Staples Retailing) | 2.5 | 1.8 |
Standard Bank Group Ltd. (South Africa, Commercial Banks) | 2.3 | 3.1 |
Surgutneftegas (Russia, Oil, Gas & Consumable Fuels) | 2.3 | 3.5 |
| 41.7 | |
Market Sectors as of October 31, 2013 |
| % of fund's
net assets | % of fund's net assets
6 months ago |
Financials | 34.2 | 34.1 |
Energy | 23.2 | 23.6 |
Telecommunication Services | 11.7 | 11.1 |
Consumer Staples | 10.0 | 10.8 |
Consumer Discretionary | 7.1 | 3.9 |
Materials | 6.8 | 9.2 |
Industrials | 2.7 | 4.4 |
Health Care | 2.2 | 1.3 |
Utilities | 0.8 | 0.6 |
Information Technology | 0.4 | 0.3 |
Annual Report
Investments October 31, 2013
Showing Percentage of Net Assets
Common Stocks - 95.3% |
| Shares | | Value |
Bangladesh - 0.4% |
Grameenphone Ltd. | 120,000 | | $ 296,506 |
Square Pharmaceuticals Ltd. | 125,000 | | 289,396 |
TOTAL BANGLADESH | | 585,902 |
Botswana - 0.2% |
First National Bank of Botswana Ltd. | 650,000 | | 291,113 |
Canada - 0.5% |
Africa Oil Corp. (a) | 75,400 | | 669,644 |
Cayman Islands - 1.0% |
Eurasia Drilling Co. Ltd. GDR (Reg. S) | 33,600 | | 1,422,960 |
Czech Republic - 2.8% |
Komercni Banka A/S | 7,800 | | 1,936,506 |
Philip Morris CR A/S | 2,800 | | 1,589,076 |
Telefonica Czech Rep A/S | 23,900 | | 389,876 |
TOTAL CZECH REPUBLIC | | 3,915,458 |
Estonia - 0.4% |
Tallinna Kaubamaja AS | 70,900 | | 526,567 |
Greece - 0.9% |
Jumbo SA (a) | 45,700 | | 614,287 |
Karelia Tobacco Co., Inc. | 1,970 | | 614,795 |
Kri Kri Milk Industry SA (a) | 25,000 | | 71,282 |
Sarantis SA (a) | 4,628 | | 36,822 |
TOTAL GREECE | | 1,337,186 |
Israel - 0.2% |
Bezeq The Israeli Telecommunication Corp. Ltd. | 200,000 | | 348,302 |
Kazakhstan - 0.1% |
Kcell JSC GDR | 10,000 | | 173,000 |
Kenya - 2.1% |
British American Tobacco Kenya Ltd. | 51,700 | | 347,695 |
Kenya Commercial Bank Ltd. | 250,000 | | 142,062 |
Safaricom Ltd. | 17,420,944 | | 1,928,857 |
Uchumi Supermarket Ltd. | 2,397,200 | | 596,842 |
TOTAL KENYA | | 3,015,456 |
Kuwait - 0.3% |
Kuwait Food Co. (Americana) | 50,000 | | 435,861 |
Lithuania - 0.4% |
Apranga AB | 163,766 | | 564,777 |
Common Stocks - continued |
| Shares | | Value |
Nigeria - 0.6% |
Skye Bank PLC | 5,785,889 | | $ 149,384 |
Zenith Bank PLC | 5,269,355 | | 714,747 |
TOTAL NIGERIA | | 864,131 |
Oman - 0.8% |
National Bank of Oman (a) | 828,494 | | 634,820 |
Oman Telecommunications Co. (a) | 136,761 | | 552,372 |
TOTAL OMAN | | 1,187,192 |
Poland - 5.6% |
Amica Wronki SA | 10,200 | | 354,310 |
Bank Handlowy w Warszawie SA | 51,300 | | 1,978,489 |
Bank Polska Kasa Opieki SA | 60,200 | | 3,771,844 |
Powszechny Zaklad Ubezpieczen SA | 12,000 | | 1,826,286 |
TOTAL POLAND | | 7,930,929 |
Qatar - 1.8% |
Gulf International Services QSC (a) | 34,000 | | 547,363 |
Industries Qatar QSC | 16,528 | | 724,235 |
Qatar National Bank SAQ | 28,281 | | 1,289,738 |
TOTAL QATAR | | 2,561,336 |
Romania - 1.2% |
Banca Transilvania SA (a) | 1,125,000 | | 485,545 |
Bursa de Valori Bucuresti | 61,814 | | 475,296 |
Nuclearelectrica SA rights (a) | 82,000 | | 275,346 |
SNP Petrom SA | 4,005,225 | | 545,562 |
TOTAL ROMANIA | | 1,781,749 |
Russia - 28.1% |
Gazprom OAO | 1,616,200 | | 7,583,414 |
LUKOIL Oil Co. | 13,100 | | 859,425 |
LUKOIL Oil Co. sponsored ADR (United Kingdom) | 131,995 | | 8,658,872 |
Magnit OJSC | 13,200 | | 3,552,063 |
Megafon OJSC GDR | 79,000 | | 2,867,700 |
Mobile TeleSystems OJSC | 98,200 | | 1,033,725 |
Moscow Exchange MICEX-RTS OAO | 450,500 | | 860,383 |
NOVATEK OAO | 42,000 | | 539,675 |
NOVATEK OAO GDR (Reg. S) | 19,450 | | 2,732,725 |
Sberbank (Savings Bank of the Russian Federation) | 3,135,200 | | 10,049,609 |
Vozrozhdenie Bank | 85,700 | | 1,106,298 |
TOTAL RUSSIA | | 39,843,889 |
Common Stocks - continued |
| Shares | | Value |
South Africa - 36.6% |
AngloGold Ashanti Ltd. | 130,300 | | $ 1,969,407 |
Aspen Pharmacare Holdings Ltd. | 60,400 | | 1,681,483 |
Cashbuild Ltd. | 85,400 | | 1,331,521 |
Clicks Group Ltd. | 343,217 | | 2,138,536 |
DRDGOLD Ltd. | 3,287,814 | | 1,623,965 |
DRDGOLD Ltd. sponsored ADR | 28,300 | | 139,519 |
FirstRand Ltd. | 819,800 | | 2,939,888 |
Harmony Gold Mining Co. Ltd. | 461,100 | | 1,591,068 |
Holdsport Ltd. | 130,400 | | 636,494 |
Hulamin Ltd. (a) | 876,800 | | 495,227 |
Metrofile Holdings Ltd. | 1,089,700 | | 536,234 |
MTN Group Ltd. | 407,650 | | 8,102,850 |
Nampak Ltd. | 907,400 | | 3,000,939 |
Naspers Ltd. Class N | 65,600 | | 6,136,063 |
Omnia Holdings Ltd. | 40,600 | | 838,147 |
Pioneer Foods Ltd. | 150,300 | | 1,272,619 |
Raubex Group Ltd. | 802,400 | | 1,902,340 |
Remgro Ltd. | 124,200 | | 2,528,849 |
RMB Holdings Ltd. | 221,500 | | 1,110,506 |
Sasol Ltd. | 76,000 | | 3,883,435 |
Shoprite Holdings Ltd. | 163,900 | | 3,000,854 |
Standard Bank Group Ltd. | 257,363 | | 3,269,225 |
Steinhoff International Holdings Ltd. | 40,000 | | 154,641 |
Vodacom Group Ltd. | 87,400 | | 1,001,220 |
Zeder Investments Ltd. | 1,556,380 | | 671,972 |
TOTAL SOUTH AFRICA | | 51,957,002 |
Sri Lanka - 0.3% |
Hatton National Bank PLC | 365,000 | | 409,893 |
Turkey - 3.7% |
Aygaz A/S | 184,000 | | 842,460 |
Koc Holding A/S | 265,850 | | 1,305,112 |
Turkiye Garanti Bankasi A/S | 488,000 | | 1,965,445 |
Turkiye Halk Bankasi A/S | 135,000 | | 1,092,173 |
TOTAL TURKEY | | 5,205,190 |
United Arab Emirates - 4.5% |
Agthia Group PJSC | 224,869 | | 249,786 |
Aldar Properties PJSC | 1,437,210 | | 1,056,484 |
Dubai Financial Market PJSC (a) | 3,234,033 | | 2,051,537 |
Emaar Properties PJSC | 330,000 | | 546,256 |
First Gulf Bank PJSC | 325,940 | | 1,437,579 |
Common Stocks - continued |
| Shares | | Value |
United Arab Emirates - continued |
National Bank of Abu Dhabi PJSC | 131,600 | | $ 447,863 |
SHUAA Capital PSC (a) | 2,220,000 | | 604,411 |
TOTAL UNITED ARAB EMIRATES | | 6,393,916 |
United Kingdom - 2.6% |
Alabama Noor Hospitals Group PLC (a) | 39,100 | | 532,890 |
Fawaz Abdulaziz Alhokair & Co. (HSBC Warrant Program) warrants 2/23/15 (a) | 10,000 | | 329,298 |
Herfy Food Services Co. Ltd. (HSBC Warrant Program) warrants 10/8/15 (a) | 21,500 | | 640,632 |
NMC Health PLC | 105,200 | | 611,119 |
Old Mutual PLC | 245,200 | | 795,289 |
Saudia Dairy & Foodstuff Co. (HSBC Warrant Program) warrants 6/26/15 (a) | 19,000 | | 466,084 |
The Savola Group (HSBC Warrant Program) warrants 2/2/15 (a) | 19,000 | | 279,903 |
TOTAL UNITED KINGDOM | | 3,655,215 |
Zambia - 0.2% |
Zambeef Products PLC (a) | 351,874 | | 225,148 |
TOTAL COMMON STOCKS (Cost $122,897,776) |
135,301,816
|
Nonconvertible Preferred Stocks - 3.8% |
| | | |
Russia - 3.8% |
Surgutneftegas | 4,375,800 | | 3,254,144 |
Tatneft OAO | 598,700 | | 2,206,570 |
TOTAL NONCONVERTIBLE PREFERRED STOCKS (Cost $4,425,369) |
5,460,714
|
Money Market Funds - 0.7% |
| Shares | | Value |
Fidelity Cash Central Fund, 0.09% (b)
(Cost $927,624) | 927,624 | | $ 927,624 |
TOTAL INVESTMENT PORTFOLIO - 99.8% (Cost $128,250,769) | 141,690,154 |
NET OTHER ASSETS (LIABILITIES) - 0.2% | | 324,707 |
NET ASSETS - 100% | $ 142,014,861 |
Legend |
(a) Non-income producing |
(b) Affiliated fund that is generally available only to investment companies and other accounts managed by Fidelity Investments. The rate quoted is the annualized seven-day yield of the fund at period end. A complete unaudited listing of the fund's holdings as of its most recent quarter end is available upon request. In addition, each Fidelity Central Fund's financial statements, which are not covered by the Fund's Report of Independent Registered Public Accounting Firm, are available on the SEC's website or upon request. |
Affiliated Central Funds |
Information regarding fiscal year to date income earned by the Fund from investments in Fidelity Central Funds is as follows: |
Fund | Income earned |
Fidelity Cash Central Fund | $ 3,124 |
Fidelity Securities Lending Cash Central Fund | 4,818 |
Total | $ 7,942 |
Other Information |
Categorizations in the Schedule of Investments are based on country or territory of incorporation. |
The following is a summary of the inputs used, as of October 31, 2013, involving the Fund's assets and liabilities carried at fair value. The inputs or methodology used for valuing securities may not be an indication of the risk associated with investing in those securities. For more information on valuation inputs, and their aggregation into the levels used in the table below, please refer to the Investment Valuation section in the accompanying Notes to Financial Statements. |
Valuation Inputs at Reporting Date: |
Description | Total | Level 1 | Level 2 | Level 3 |
Investments in Securities: | | | | |
Equities: | | | | |
Consumer Discretionary | $ 10,227,954 | $ 10,227,954 | $ - | $ - |
Consumer Staples | 14,222,085 | 14,222,085 | - | - |
Energy | 32,903,789 | 29,020,354 | 3,883,435 | - |
Financials | 48,355,407 | 46,639,490 | 1,715,917 | - |
Health Care | 3,114,888 | 3,114,888 | - | - |
Industrials | 3,931,687 | 3,931,687 | - | - |
Information Technology | 536,234 | 536,234 | - | - |
Materials | 9,658,272 | 4,473,832 | 5,184,440 | - |
Telecommunication Services | 16,694,408 | 16,694,408 | - | - |
Utilities | 1,117,806 | 1,117,806 | - | - |
Money Market Funds | 927,624 | 927,624 | - | - |
Total Investments in Securities: | $ 141,690,154 | $ 130,906,362 | $ 10,783,792 | $ - |
See accompanying notes which are an integral part of the financial statements.
Annual Report
Statement of Assets and Liabilities
| October 31, 2013 |
| | |
Assets | | |
Investment in securities, at value - See accompanying schedule: Unaffiliated issuers (cost $127,323,145) | $ 140,762,530 | |
Fidelity Central Funds (cost $927,624) | 927,624 | |
Total Investments (cost $128,250,769) | | $ 141,690,154 |
Foreign currency held at value (cost $6,860) | | 6,860 |
Receivable for investments sold | | 543,045 |
Receivable for fund shares sold | | 456,976 |
Dividends receivable | | 297,198 |
Distributions receivable from Fidelity Central Funds | | 82 |
Prepaid expenses | | 396 |
Other receivables | | 3,403 |
Total assets | | 142,998,114 |
| | |
Liabilities | | |
Payable to custodian bank | $ 100,546 | |
Payable for investments purchased | 543,105 | |
Payable for fund shares redeemed | 113,301 | |
Accrued management fee | 102,489 | |
Distribution and service plan fees payable | 9,522 | |
Other affiliated payables | 35,514 | |
Audit fees payable | 44,096 | |
Other payables and accrued expenses | 34,680 | |
Total liabilities | | 983,253 |
| | |
Net Assets | | $ 142,014,861 |
Net Assets consist of: | | |
Paid in capital | | $ 129,031,339 |
Undistributed net investment income | | 1,897,738 |
Accumulated undistributed net realized gain (loss) on investments and foreign currency transactions | | (2,364,438) |
Net unrealized appreciation (depreciation) on investments and assets and liabilities in foreign currencies | | 13,450,222 |
Net Assets | | $ 142,014,861 |
See accompanying notes which are an integral part of the financial statements.
Annual Report
Financial Statements - continued
Statement of Assets and Liabilities - continued
| October 31, 2013 |
| | |
Calculation of Maximum Offering Price Class A:
Net Asset Value and redemption price per share ($10,883,131 ÷ 1,146,802 shares) | | $ 9.49 |
| | |
Maximum offering price per share (100/94.25 of $9.49) | | $ 10.07 |
Class T:
Net Asset Value and redemption price per share ($3,465,265 ÷ 366,170 shares) | | $ 9.46 |
| | |
Maximum offering price per share (100/96.50 of $9.46) | | $ 9.80 |
Class B:
Net Asset Value and offering price per share ($388,173 ÷ 40,870 shares)A | | $ 9.50 |
| | |
Class C:
Net Asset Value and offering price per share ($6,781,855 ÷ 722,186 shares)A | | $ 9.39 |
| | |
Emerging Europe, Middle East, Africa (EMEA):
Net Asset Value, offering price and redemption price per share ($110,265,497 ÷ 11,580,491 shares) | | $ 9.52 |
| | |
Institutional Class:
Net Asset Value, offering price and redemption price per share ($10,230,940 ÷ 1,074,619 shares) | | $ 9.52 |
A Redemption price per share is equal to net asset value less any applicable contingent deferred sales charge.
See accompanying notes which are an integral part of the financial statements.
Annual Report
Statement of Operations
| Year ended October 31, 2013 |
| | |
Investment Income | | |
Dividends | | $ 5,669,711 |
Interest | | 11,822 |
Income from Fidelity Central Funds | | 7,942 |
Income before foreign taxes withheld | | 5,689,475 |
Less foreign taxes withheld | | (752,601) |
Total income | | 4,936,874 |
| | |
Expenses | | |
Management fee | $ 1,158,980 | |
Transfer agent fees | 398,454 | |
Distribution and service plan fees | 114,080 | |
Accounting and security lending fees | 74,660 | |
Custodian fees and expenses | 230,069 | |
Independent trustees' compensation | 838 | |
Registration fees | 82,070 | |
Audit | 61,954 | |
Legal | 383 | |
Miscellaneous | 1,128 | |
Total expenses before reductions | 2,122,616 | |
Expense reductions | (35,590) | 2,087,026 |
Net investment income (loss) | | 2,849,848 |
Realized and Unrealized Gain (Loss) Net realized gain (loss) on: | | |
Investment securities: | | |
Unaffiliated issuers | 522,076 | |
Foreign currency transactions | (96,200) | |
Total net realized gain (loss) | | 425,876 |
Change in net unrealized appreciation (depreciation) on: Investment securities | 11,140,957 | |
Assets and liabilities in foreign currencies | 10,565 | |
Total change in net unrealized appreciation (depreciation) | | 11,151,522 |
Net gain (loss) | | 11,577,398 |
Net increase (decrease) in net assets resulting from operations | | $ 14,427,246 |
See accompanying notes which are an integral part of the financial statements.
Annual Report
Financial Statements - continued
Statement of Changes in Net Assets
| Year ended
October 31,
2013 | Year ended
October 31,
2012 |
Increase (Decrease) in Net Assets | | |
Operations | | |
Net investment income (loss) | $ 2,849,848 | $ 3,198,505 |
Net realized gain (loss) | 425,876 | 10,513,420 |
Change in net unrealized appreciation (depreciation) | 11,151,522 | (5,470,956) |
Net increase (decrease) in net assets resulting
from operations | 14,427,246 | 8,240,969 |
Distributions to shareholders from net investment income | (2,689,985) | (2,782,952) |
Distributions to shareholders from net realized gain | (1,184,624) | - |
Total distributions | (3,874,609) | (2,782,952) |
Share transactions - net increase (decrease) | (9,097,663) | (7,689,254) |
Redemption fees | 52,524 | 36,290 |
Total increase (decrease) in net assets | 1,507,498 | (2,194,947) |
| | |
Net Assets | | |
Beginning of period | 140,507,363 | 142,702,310 |
End of period (including undistributed net investment income of $1,897,738 and undistributed net investment income of $2,631,143, respectively) | $ 142,014,861 | $ 140,507,363 |
See accompanying notes which are an integral part of the financial statements.
Annual Report
Financial Highlights - Class A
Years ended October 31, | 2013 | 2012 | 2011 | 2010 | 2009 |
Selected Per-Share Data | | | | | |
Net asset value, beginning of period | $ 8.71 | $ 8.34 | $ 8.97 | $ 7.26 | $ 4.75 |
Income from Investment Operations | | | | | |
Net investment income (loss) C | .16 | .18 | .16 F | .07 | .05 |
Net realized and unrealized gain (loss) | .85 | .34 | (.70) | 1.70 | 2.48 |
Total from investment operations | 1.01 | .52 | (.54) | 1.77 | 2.53 |
Distributions from net investment income | (.15) | (.15) | (.08) | (.04) | (.03) |
Distributions from net realized gain | (.07) | - | (.02) | (.02) | - |
Total distributions | (.23) J | (.15) | (.10) | (.07) I | (.03) |
Redemption fees added to paid in capital C | - H | - H | .01 | .01 | .01 |
Net asset value, end of period | $ 9.49 | $ 8.71 | $ 8.34 | $ 8.97 | $ 7.26 |
Total Return A,B | 11.75% | 6.38% | (6.05)% | 24.66% | 53.78% |
Ratios to Average Net Assets D,G | | | | | |
Expenses before reductions | 1.64% | 1.62% | 1.60% | 1.69% | 1.87% |
Expenses net of fee waivers, if any | 1.63% | 1.62% | 1.56% | 1.50% | 1.50% |
Expenses net of all reductions | 1.62% | 1.60% | 1.51% | 1.38% | 1.39% |
Net investment income (loss) | 1.82% | 2.09% | 1.70% F | .95% | .84% |
Supplemental Data | | | | | |
Net assets, end of period (000 omitted) | $ 10,883 | $ 8,934 | $ 10,260 | $ 10,045 | $ 4,817 |
Portfolio turnover rate E | 64% | 30% | 53% | 96% | 58% |
A Total returns would have been lower if certain expenses had not been reduced during the applicable periods shown.
B Total returns do not include the effect of the sales charges.
C Calculated based on average shares outstanding during the period.
D Fees and expenses of any underlying Fidelity Central Funds are not included in the Fund's expense ratio. The Fund indirectly bears its proportionate share of the expenses of any underlying Fidelity Central Funds.
E Amount does not include the portfolio activity of any underlying Fidelity Central Funds.
F Investment income per share reflects a large, non-recurring dividend which amounted to $.04 per share. Excluding this non-recurring dividend, the ratio of net investment income (loss) to average net assets would have been 1.25%.
G Expense ratios reflect operating expenses of the class. Expenses before reductions do not reflect amounts reimbursed by the investment adviser or reductions from brokerage service arrangements or reductions from other expense offset arrangements and do not represent the amount paid by the class during periods when reimbursements or reductions occur. Expenses net of fee waivers reflect expenses after reimbursement by the investment adviser but prior to reductions from brokerage service arrangements or other expense offset arrangements. Expenses net of all reductions represent the net expenses paid by the class.
H Amount represents less than $.01 per share.
I Total distributions of $.07 per share is comprised of distributions from net investment income of $.041 and distributions from net realized gain of $.024 per share.
J Total distributions of $.23 per share is comprised of distributions from net investment income of $.151 and distributions from net realized gain of $.074 per share.
See accompanying notes which are an integral part of the financial statements.
Annual Report
Financial Highlights - Class T
Years ended October 31, | 2013 | 2012 | 2011 | 2010 | 2009 |
Selected Per-Share Data | | | | | |
Net asset value, beginning of period | $ 8.68 | $ 8.31 | $ 8.96 | $ 7.25 | $ 4.75 |
Income from Investment Operations | | | | | |
Net investment income (loss) C | .14 | .15 | .13 F | .06 | .04 |
Net realized and unrealized gain (loss) | .84 | .35 | (.71) | 1.69 | 2.47 |
Total from investment operations | .98 | .50 | (.58) | 1.75 | 2.51 |
Distributions from net investment income | (.12) | (.13) | (.07) | (.03) | (.02) |
Distributions from net realized gain | (.07) | - | (.02) | (.02) | - |
Total distributions | (.20) J | (.13) | (.08) I | (.05) | (.02) |
Redemption fees added to paid in capital C | - H | - H | .01 | .01 | .01 |
Net asset value, end of period | $ 9.46 | $ 8.68 | $ 8.31 | $ 8.96 | $ 7.25 |
Total Return A,B | 11.42% | 6.14% | (6.42)% | 24.44% | 53.20% |
Ratios to Average Net Assets D,G | | | | | |
Expenses before reductions | 1.93% | 1.89% | 1.87% | 1.95% | 2.15% |
Expenses net of fee waivers, if any | 1.90% | 1.89% | 1.84% | 1.75% | 1.75% |
Expenses net of all reductions | 1.88% | 1.86% | 1.78% | 1.62% | 1.64% |
Net investment income (loss) | 1.55% | 1.82% | 1.42% F | .70% | .59% |
Supplemental Data | | | | | |
Net assets, end of period (000 omitted) | $ 3,465 | $ 3,336 | $ 3,502 | $ 3,114 | $ 1,560 |
Portfolio turnover rate E | 64% | 30% | 53% | 96% | 58% |
A Total returns would have been lower if certain expenses had not been reduced during the applicable periods shown.
B Total returns do not include the effect of the sales charges.
C Calculated based on average shares outstanding during the period.
D Fees and expenses of any underlying Fidelity Central Funds are not included in the Fund's expense ratio. The Fund indirectly bears its proportionate share of the expenses of any underlying Fidelity Central Funds.
E Amount does not include the portfolio activity of any underlying Fidelity Central Funds.
F Investment income per share reflects a large, non-recurring dividend which amounted to $.04 per share. Excluding this non-recurring dividend, the ratio of net investment income (loss) to average net assets would have been .98%.
G Expense ratios reflect operating expenses of the class. Expenses before reductions do not reflect amounts reimbursed by the investment adviser or reductions from brokerage service arrangements or reductions from other expense offset arrangements and do not represent the amount paid by the class during periods when reimbursements or reductions occur. Expenses net of fee waivers reflect expenses after reimbursement by the investment adviser but prior to reductions from brokerage service arrangements or other expense offset arrangements. Expenses net of all reductions represent the net expenses paid by the class.
H Amount represents less than $.01 per share.
I Total distributions of $.08 per share is comprised of distributions from net investment income of $.068 and distributions from net realized gain of $.015 per share.
J Total distributions of $.20 per share is comprised of distributions from net investment income of $.122 and distributions from net realized gain of $.074 per share.
See accompanying notes which are an integral part of the financial statements.
Annual Report
Financial Highlights - Class B
Years ended October 31, | 2013 | 2012 | 2011 | 2010 | 2009 |
Selected Per-Share Data | | | | | |
Net asset value, beginning of period | $ 8.69 | $ 8.29 | $ 8.93 | $ 7.23 | $ 4.73 |
Income from Investment Operations | | | | | |
Net investment income (loss) C | .09 | .11 | .09 F | .02 | .01 |
Net realized and unrealized gain (loss) | .85 | .35 | (.71) | 1.68 | 2.48 |
Total from investment operations | .94 | .46 | (.62) | 1.70 | 2.49 |
Distributions from net investment income | (.06) | (.06) | (.02) | - | - |
Distributions from net realized gain | (.07) | - | (.01) | (.01) | - |
Total distributions | (.13) | (.06) | (.03) | (.01) | - |
Redemption fees added to paid in capital C | - H | - H | .01 | .01 | .01 |
Net asset value, end of period | $ 9.50 | $ 8.69 | $ 8.29 | $ 8.93 | $ 7.23 |
Total Return A,B | 10.94% | 5.56% | (6.85)% | 23.72% | 52.85% |
Ratios to Average Net Assets D,G | | | | | |
Expenses before reductions | 2.42% | 2.38% | 2.37% | 2.47% | 2.68% |
Expenses net of fee waivers, if any | 2.40% | 2.38% | 2.33% | 2.25% | 2.25% |
Expenses net of all reductions | 2.38% | 2.35% | 2.27% | 2.12% | 2.14% |
Net investment income (loss) | 1.05% | 1.33% | .93% F | .20% | .09% |
Supplemental Data | | | | | |
Net assets, end of period (000 omitted) | $ 388 | $ 441 | $ 539 | $ 822 | $ 782 |
Portfolio turnover rate E | 64% | 30% | 53% | 96% | 58% |
A Total returns would have been lower if certain expenses had not been reduced during the applicable periods shown.
B Total returns do not include the effect of the contingent deferred sales charge.
C Calculated based on average shares outstanding during the period.
D Fees and expenses of any underlying Fidelity Central Funds are not included in the Fund's expense ratio. The Fund indirectly bears its proportionate share of the expenses of any underlying Fidelity Central Funds.
E Amount does not include the portfolio activity of any underlying Fidelity Central Funds.
F Investment income per share reflects a large, non-recurring dividend which amounted to $.04 per share. Excluding this non-recurring dividend, the ratio of net investment income (loss) to average net assets would have been .49%.
G Expense ratios reflect operating expenses of the class. Expenses before reductions do not reflect amounts reimbursed by the investment adviser or reductions from brokerage service arrangements or reductions from other expense offset arrangements and do not represent the amount paid by the class during periods when reimbursements or reductions occur. Expenses net of fee waivers reflect expenses after reimbursement by the investment adviser but prior to reductions from brokerage service arrangements or other expense offset arrangements. Expenses net of all reductions represent the net expenses paid by the class.
H Amount represents less than $.01 per share.
See accompanying notes which are an integral part of the financial statements.
Annual Report
Financial Highlights - Class C
Years ended October 31, | 2013 | 2012 | 2011 | 2010 | 2009 |
Selected Per-Share Data | | | | | |
Net asset value, beginning of period | $ 8.62 | $ 8.24 | $ 8.90 | $ 7.23 | $ 4.73 |
Income from Investment Operations | | | | | |
Net investment income (loss) C | .09 | .11 | .08 F | .02 | .01 |
Net realized and unrealized gain (loss) | .83 | .35 | (.69) | 1.67 | 2.48 |
Total from investment operations | .92 | .46 | (.61) | 1.69 | 2.49 |
Distributions from net investment income | (.08) | (.08) | (.05) | (.01) | - |
Distributions from net realized gain | (.07) | - | (.02) | (.02) | - |
Total distributions | (.15) | (.08) | (.06) I | (.03) | - |
Redemption fees added to paid in capital C | - H | - H | .01 | .01 | .01 |
Net asset value, end of period | $ 9.39 | $ 8.62 | $ 8.24 | $ 8.90 | $ 7.23 |
Total Return A,B | 10.83% | 5.68% | (6.79)% | 23.61% | 52.85% |
Ratios to Average Net Assets D,G | | | | | |
Expenses before reductions | 2.42% | 2.37% | 2.36% | 2.45% | 2.61% |
Expenses net of fee waivers, if any | 2.40% | 2.37% | 2.33% | 2.25% | 2.25% |
Expenses net of all reductions | 2.38% | 2.35% | 2.27% | 2.13% | 2.14% |
Net investment income (loss) | 1.05% | 1.34% | .93% F | .20% | .09% |
Supplemental Data | | | | | |
Net assets, end of period (000 omitted) | $ 6,782 | $ 7,770 | $ 6,650 | $ 5,151 | $ 2,677 |
Portfolio turnover rate E | 64% | 30% | 53% | 96% | 58% |
A Total returns would have been lower if certain expenses had not been reduced during the applicable periods shown.
B Total returns do not include the effect of the contingent deferred sales charge.
C Calculated based on average shares outstanding during the period.
D Fees and expenses of any underlying Fidelity Central Funds are not included in the Fund's expense ratio. The Fund indirectly bears its proportionate share of the expenses of any underlying Fidelity Central Funds.
E Amount does not include the portfolio activity of any underlying Fidelity Central Funds.
F Investment income per share reflects a large, non-recurring dividend which amounted to $.04 per share. Excluding this non-recurring dividend, the ratio of net investment income (loss) to average net assets would have been .49%.
G Expense ratios reflect operating expenses of the class. Expenses before reductions do not reflect amounts reimbursed by the investment adviser or reductions from brokerage service arrangements or reductions from other expense offset arrangements and do not represent the amount paid by the class during periods when reimbursements or reductions occur. Expenses net of fee waivers reflect expenses after reimbursement by the investment adviser but prior to reductions from brokerage service arrangements or other expense offset arrangements. Expenses net of all reductions represent the net expenses paid by the class.
H Amount represents less than $.01 per share.
I Total distributions of $.06 per share is comprised of distributions from net investment income of $.047 and distributions from net realized gain of $.015 per share.
See accompanying notes which are an integral part of the financial statements.
Annual Report
Financial Highlights - Emerging Europe, Middle East, Africa (EMEA)
Years ended October 31, | 2013 | 2012 | 2011 | 2010 | 2009 |
Selected Per-Share Data | | | | | |
Net asset value, beginning of period | $ 8.75 | $ 8.37 | $ 9.00 | $ 7.28 | $ 4.76 |
Income from Investment Operations | | | | | |
Net investment income (loss) B | .18 | .20 | .18 E | .09 | .07 |
Net realized and unrealized gain (loss) | .84 | .35 | (.71) | 1.70 | 2.48 |
Total from investment operations | 1.02 | .55 | (.53) | 1.79 | 2.55 |
Distributions from net investment income | (.18) | (.17) | (.09) | (.05) | (.04) |
Distributions from net realized gain | (.07) | - | (.02) | (.02) | - |
Total distributions | (.25) | (.17) | (.11) | (.08) H | (.04) |
Redemption fees added to paid in capital B | - G | - G | .01 | .01 | .01 |
Net asset value, end of period | $ 9.52 | $ 8.75 | $ 8.37 | $ 9.00 | $ 7.28 |
Total Return A | 11.90% | 6.81% | (5.91)% | 24.92% | 54.15% |
Ratios to Average Net Assets C,F | | | | | |
Expenses before reductions | 1.40% | 1.37% | 1.35% | 1.45% | 1.61% |
Expenses net of fee waivers, if any | 1.40% | 1.37% | 1.31% | 1.25% | 1.25% |
Expenses net of all reductions | 1.38% | 1.34% | 1.25% | 1.12% | 1.14% |
Net investment income (loss) | 2.05% | 2.34% | 1.95% E | 1.21% | 1.09% |
Supplemental Data | | | | | |
Net assets, end of period (000 omitted) | $ 110,265 | $ 111,441 | $ 114,117 | $ 140,270 | $ 104,141 |
Portfolio turnover rate D | 64% | 30% | 53% | 96% | 58% |
A Total returns would have been lower if certain expenses had not been reduced during the applicable periods shown.
B Calculated based on average shares outstanding during the period.
C Fees and expenses of any underlying Fidelity Central Funds are not included in the Fund's expense ratio. The Fund indirectly bears its proportionate share of the expenses of any underlying Fidelity Central Funds.
D Amount does not include the portfolio activity of any underlying Fidelity Central Funds.
E Investment income per share reflects a large, non-recurring dividend which amounted to $.04 per share. Excluding this non-recurring dividend, the ratio of net investment income (loss) to average net assets would have been 1.51%.
F Expense ratios reflect operating expenses of the class. Expenses before reductions do not reflect amounts reimbursed by the investment adviser or reductions from brokerage service arrangements or reductions from other expense offset arrangements and do not represent the amount paid by the class during periods when reimbursements or reductions occur. Expenses net of fee waivers reflect expenses after reimbursement by the investment adviser but prior to reductions from brokerage service arrangements or other expense offset arrangements. Expenses net of all reductions represent the net expenses paid by the class.
G Amount represents less than $.01 per share.
H Total distributions of $.08 per share is comprised of distributions from net investment income of $.052 and distributions from net realized gain of $.024 per share.
See accompanying notes which are an integral part of the financial statements.
Annual Report
Financial Highlights - Institutional Class
Years ended October 31, | 2013 | 2012 | 2011 | 2010 | 2009 |
Selected Per-Share Data | | | | | |
Net asset value, beginning of period | $ 8.75 | $ 8.37 | $ 9.00 | $ 7.28 | $ 4.76 |
Income from Investment Operations | | | | | |
Net investment income (loss) B | .19 | .21 | .19 E | .09 | .06 |
Net realized and unrealized gain (loss) | .84 | .35 | (.72) | 1.70 | 2.49 |
Total from investment operations | 1.03 | .56 | (.53) | 1.79 | 2.55 |
Distributions from net investment income | (.19) | (.18) | (.09) | (.05) | (.04) |
Distributions from net realized gain | (.07) | - | (.02) | (.02) | - |
Total distributions | (.26) | (.18) | (.11) | (.08) H | (.04) |
Redemption fees added to paid in capital B | - G | - G | .01 | .01 | .01 |
Net asset value, end of period | $ 9.52 | $ 8.75 | $ 8.37 | $ 9.00 | $ 7.28 |
Total Return A | 12.05% | 6.93% | (5.91)% | 24.95% | 54.15% |
Ratios to Average Net Assets C,F | | | | | |
Expenses before reductions | 1.30% | 1.28% | 1.26% | 1.34% | 1.60% |
Expenses net of fee waivers, if any | 1.30% | 1.28% | 1.24% | 1.25% | 1.25% |
Expenses net of all reductions | 1.28% | 1.25% | 1.19% | 1.13% | 1.14% |
Net investment income (loss) | 2.15% | 2.43% | 2.02% E | 1.20% | 1.09% |
Supplemental Data | | | | | |
Net assets, end of period (000 omitted) | $ 10,231 | $ 8,586 | $ 7,633 | $ 7,171 | $ 4,235 |
Portfolio turnover rate D | 64% | 30% | 53% | 96% | 58% |
A Total returns would have been lower if certain expenses had not been reduced during the applicable periods shown.
B Calculated based on average shares outstanding during the period.
C Fees and expenses of any underlying Fidelity Central Funds are not included in the Fund's expense ratio. The Fund indirectly bears its proportionate share of the expenses of any underlying Fidelity Central Funds.
D Amount does not include the portfolio activity of any underlying Fidelity Central Funds.
E Investment income per share reflects a large, non-recurring dividend which amounted to $.04 per share. Excluding this non-recurring dividend, the ratio of net investment income (loss) to average net assets would have been 1.58%.
F Expense ratios reflect operating expenses of the class. Expenses before reductions do not reflect amounts reimbursed by the investment adviser or reductions from brokerage service arrangements or reductions from other expense offset arrangements and do not represent the amount paid by the class during periods when reimbursements or reductions occur. Expenses net of fee waivers reflect expenses after reimbursement by the investment adviser but prior to reductions from brokerage service arrangements or other expense offset arrangements. Expenses net of all reductions represent the net expenses paid by the class.
G Amount represents less than $.01 per share.
H Total distributions of $.08 per share is comprised of distributions from net investment income of $.054 and distributions from net realized gain of $.024 per share.
See accompanying notes which are an integral part of the financial statements.
Annual Report
Notes to Financial Statements
For the period ended October 31, 2013
1. Organization.
Fidelity Emerging Europe, Middle East, Africa (EMEA) Fund (the Fund) is a fund of Fidelity Investment Trust (the Trust) and is authorized to issue an unlimited number of shares. The Trust is registered under the Investment Company Act of 1940, as amended (the 1940 Act), as an open-end management investment company organized as a Massachusetts business trust. The Fund offers Class A, Class T, Class C, Emerging Europe, Middle East, Africa (EMEA) and Institutional Class shares, each of which, along with Class B shares, has equal rights as to assets and voting privileges. Class B shares are closed to new accounts and additional purchases, except for exchanges and reinvestments. Each class has exclusive voting rights with respect to matters that affect that class. Class B shares will automatically convert to Class A shares after a holding period of seven years from the initial date of purchase. The Fund's investments in emerging markets can be subject to social, economic, regulatory, and political uncertainties and can be extremely volatile.
2. Investments in Fidelity Central Funds.
The Fund invests in Fidelity Central Funds, which are open-end investment companies generally available only to other investment companies and accounts managed by Fidelity Management & Research Company (FMR) and its affiliates. The Fund's Schedule of Investments lists each of the Fidelity Central Funds held as of period end, if any, as an investment of the Fund, but does not include the underlying holdings of each Fidelity Central Fund. As an Investing Fund, the Fund indirectly bears its proportionate share of the expenses of the underlying Fidelity Central Funds.
The Money Market Central Funds seek preservation of capital and current income and are managed by Fidelity Investments Money Management, Inc. (FIMM), an affiliate of FMR.
A complete unaudited list of holdings for each Fidelity Central Fund is available upon request or at the Securities and Exchange Commission (the SEC) website at www.sec.gov. In addition, the financial statements of the Fidelity Central Funds, which are not covered by the Fund's Report of Independent Registered Public Accounting Firm, are available on the SEC website or upon request.
Annual Report
3. Significant Accounting Policies.
The financial statements have been prepared in conformity with accounting principles generally accepted in the United States of America (GAAP), which require management to make certain estimates and assumptions at the date of the financial statements. Actual results could differ from those estimates. Subsequent events, if any, through the date that the financial statements were issued have been evaluated in the preparation of the financial statements. The following summarizes the significant accounting policies of the Fund:
Investment Valuation. Investments are valued as of 4:00 p.m. Eastern time on the last calendar day of the period. In accordance with valuation policies and procedures approved by the Board of Trustees (the Board), the Fund attempts to obtain prices from one or more third party pricing vendors or brokers to value its investments. When current market prices, quotations or currency exchange rates are not readily available or reliable, investments will be fair valued in good faith by the FMR Fair Value Committee (the Committee), in accordance with procedures adopted by the Board. Factors used in determining fair value vary by investment type and may include market or investment specific events. The frequency with which these procedures are used cannot be predicted and they may be utilized to a significant extent. The Committee oversees the Fund's valuation policies and procedures and is responsible for approving and reporting to the Board all fair value determinations.
The Fund categorizes the inputs to valuation techniques used to value its investments into a disclosure hierarchy consisting of three levels as shown below:
Level 1 - quoted prices in active markets for identical investments
Level 2 - other significant observable inputs (including quoted prices for similar investments, interest rates, prepayment speeds, etc.)
Level 3 - unobservable inputs (including the Fund's own assumptions based on the best information available)
Valuation techniques used to value the Fund's investments by major category are as follows:
Equity securities, including restricted securities, for which market quotations are readily available, are valued at the last reported sale price or official closing price as reported by a third party pricing vendor on the primary market or exchange on which they are traded and are categorized as Level 1 in the hierarchy. In the event there were no sales during the day or closing prices are not available, securities are valued at the last quoted bid price or may be valued using the last available price and are generally categorized as Level 2 in the hierarchy. For foreign equity securities, when market or security specific
Annual Report
Notes to Financial Statements - continued
3. Significant Accounting Policies - continued
Investment Valuation - continued
events arise, comparisons to the valuation of American Depositary Receipts (ADRs), futures contracts, Exchange-Traded Funds (ETFs) and certain indexes as well as quoted prices for similar securities may be used and would be categorized as Level 2 in the hierarchy. Utilizing these techniques may result in transfers between Level 1 and Level 2. For equity securities, including restricted securities, where observable inputs are limited, assumptions about market activity and risk are used and these securities may be categorized as Level 3 in the hierarchy.
Investments in open-end mutual funds , including the Fidelity Central Funds, are valued at their closing net asset value (NAV) each business day and are categorized as Level 1 in the hierarchy.
Changes in valuation techniques may result in transfers in or out of an assigned level within the disclosure hierarchy. The aggregate value of investments by input level, as of October 31, 2013, is included at the end of the Fund's Schedule of Investments.
Foreign Currency. The Fund may use foreign currency contracts to facilitate transactions in foreign-denominated securities. Gains and losses from these transactions may arise from changes in the value of the foreign currency or if the counterparties do not perform under the contracts' terms.
Foreign-denominated assets, including investment securities, and liabilities are translated into U.S. dollars at the exchange rates at period end. Purchases and sales of investment securities, income and dividends received and expenses denominated in foreign currencies are translated into U.S. dollars at the exchange rate in effect on the transaction date.
The effects of exchange rate fluctuations on investments are included with the net realized and unrealized gain (loss) on investment securities. Other foreign currency transactions resulting in realized and unrealized gain (loss) are disclosed separately.
Investment Transactions and Income. For financial reporting purposes, the Fund's investment holdings and NAV include trades executed through the end of the last business day of the period. The NAV per share for processing shareholder transactions is calculated as of the close of business of the New York Stock Exchange (NYSE), normally 4:00 p.m. Eastern time and includes trades executed through the end of the prior business day. Gains and losses on securities sold are determined on the basis of identified cost. Dividend income is recorded on the ex-dividend date, except for certain dividends from foreign securities where the ex-dividend date may have passed, which are recorded as soon as the Fund is informed of the ex-dividend date. Non-cash dividends included in dividend income, if any, are recorded at the fair market value of the securities received.
Annual Report
3. Significant Accounting Policies - continued
Investment Transactions and Income - continued
Interest income and distributions from the Fidelity Central Funds are accrued as earned. Interest income includes coupon interest and amortization of premium and accretion of discount on debt securities. Investment income is recorded net of foreign taxes withheld where recovery of such taxes is uncertain.
Class Allocations and Expenses. Investment income, realized and unrealized capital gains and losses, common expenses of the Fund, and certain fund-level expense reductions, if any, are allocated daily on a pro-rata basis to each class based on the relative net assets of each class to the total net assets of the Fund. Each class differs with respect to transfer agent and distribution and service plan fees incurred. Certain expense reductions may also differ by class. For the reporting period, the allocated portion of income and expenses to each class as a percent of its average net assets may vary due to the timing of recording these transactions in relation to fluctuating net assets of the classes. Expenses directly attributable to a fund are charged to that fund. Expenses attributable to more than one fund are allocated among the respective funds on the basis of relative net assets or other appropriate methods. Expense estimates are accrued in the period to which they relate and adjustments are made when actual amounts are known.
Income Tax Information and Distributions to Shareholders. Each year, the Fund intends to qualify as a regulated investment company under Subchapter M of the Internal Revenue Code, including distributing substantially all of its taxable income and realized gains. As a result, no provision for U.S. Federal income taxes is required. As of October 31, 2013, the Fund did not have any unrecognized tax benefits in the financial statements; nor is the Fund aware of any tax positions for which it is reasonably possible that the total amounts of unrecognized tax benefits will significantly change in the next twelve months. The Fund files a U.S. federal tax return, in addition to state and local tax returns as required. The Fund's federal income tax returns are subject to examination by the Internal Revenue Service (IRS) for a period of three fiscal years after they are filed. State and local tax returns may be subject to examination for an additional fiscal year depending on the jurisdiction. Foreign taxes are provided for based on the Fund's understanding of the tax rules and rates that exist in the foreign markets in which it invests.
Distributions are declared and recorded on the ex-dividend date. Income dividends and capital gain distributions are declared separately for each class. Income and capital gain distributions are determined in accordance with income tax regulations, which may differ from GAAP. In addition, the Fund claimed a portion of the payment made to redeeming shareholders as a distribution for income tax purposes.
Annual Report
Notes to Financial Statements - continued
3. Significant Accounting Policies - continued
Income Tax Information and Distributions to Shareholders - continued
Capital accounts within the financial statements are adjusted for permanent book-tax differences. These adjustments have no impact on net assets or the results of operations. Temporary book-tax differences will reverse in a subsequent period.
Book-tax differences are primarily due to foreign currency transactions, passive foreign investment companies (PFIC), capital loss carryforwards and losses deferred due to wash sales.
The federal tax cost of investment securities and unrealized appreciation (depreciation) as of period end were as follows:
Gross unrealized appreciation | $ 25,331,074 |
Gross unrealized depreciation | (12,631,422) |
Net unrealized appreciation (depreciation) on securities and other investments | $ 12,699,652 |
| |
Tax Cost | $ 128,990,502 |
The tax-based components of distributable earnings as of period end were as follows:
Undistributed ordinary income | $ 1,897,738 |
Capital loss carryforward | $ (1,624,705) |
Net unrealized appreciation (depreciation) | $ 12,710,489 |
Capital loss carryforwards are only available to offset future capital gains of the Fund to the extent provided by regulations and may be limited. Under the Regulated Investment Company Modernization Act of 2010 (the Act), the Fund is permitted to carry forward capital losses incurred in taxable years beginning after December 22, 2010 for an unlimited period and such capital losses are required to be used prior to any losses that expire. The capital loss carryforward information presented below, including any applicable limitation, is estimated as of fiscal period end and is subject to adjustment.
Fiscal year of expiration | |
2018 | $ (1,624,705) |
The tax character of distributions paid was as follows:
| October 31, 2013 | October 31, 2012 |
Ordinary Income | $ 3,874,609 | $ 2,782,952 |
Annual Report
3. Significant Accounting Policies - continued
Short-Term Trading (Redemption) Fees. Shares held by investors in the Fund less than 90 days may have been subject to a redemption fee equal to 1.50% of the net asset value of shares redeemed. All redemption fees, which reduce the proceeds of the shareholder redemption, are retained by the Fund and accounted for as an addition to paid in capital.
4. Purchases and Sales of Investments.
Purchases and sales of securities, other than short-term securities, aggregated $89,166,804 and $94,656,093, respectively.
5. Fees and Other Transactions with Affiliates.
Management Fee. FMR and its affiliates provide the Fund with investment management related services for which the Fund pays a monthly management fee. The management fee is the sum of an individual fund fee rate that is based on an annual rate of .55% of the Fund's average net assets and an annualized group fee rate that averaged .25% during the period. The group fee rate is based upon the average net assets of all the mutual funds advised by FMR, including any mutual funds previously advised by FMR that are currently advised by Fidelity SelectCo, LLC, an affiliate of FMR. The group fee rate decreases as assets under management increase and increases as assets under management decrease. For the reporting period, the total annual management fee rate was .81% of the Fund's average net assets.
Distribution and Service Plan Fees. In accordance with Rule 12b-1 of the 1940 Act, the Fund has adopted separate Distribution and Service Plans for each class of shares. Certain classes pay Fidelity Distributors Corporation (FDC), an affiliate of FMR, separate Distribution and Service Fees, each of which is based on an annual percentage of each class' average net assets. In addition, FDC may pay financial intermediaries for selling shares of the Fund and providing shareholder support services. For the period, the Distribution and Service Fee rates, total fees and amounts retained by FDC were as follows:
| Distribution
Fee | Service
Fee | Total Fees | Retained
by FDC |
Class A | -% | .25% | $ 24,760 | $ 2,563 |
Class T | .25% | .25% | 16,204 | 44 |
Class B | .75% | .25% | 4,216 | 3,167 |
Class C | .75% | .25% | 68,900 | 7,692 |
| | | $ 114,080 | $ 13,466 |
Annual Report
Notes to Financial Statements - continued
5. Fees and Other Transactions with Affiliates - continued
Sales Load. FDC may receive a front-end sales charge of up to 5.75% for selling Class A shares and 3.50% for selling Class T shares, some of which is paid to financial intermediaries for selling shares of the Fund. Depending on the holding period, FDC may receive contingent deferred sales charges levied on Class A, Class T, Class B, and Class C redemptions. The deferred sales charges range from 5.00% to 1.00% for Class B shares, 1.00% for Class C shares, 1.00% for certain purchases of Class A shares and .25% for certain purchases of Class T shares.
For the period, sales charge amounts retained by FDC were as follows:
| Retained
by FDC |
Class A | $ 5,196 |
Class T | 1,770 |
Class B* | 1,462 |
Class C* | 1,024 |
| $ 9,452 |
* When Class B and Class C shares are initially sold, FDC pays commissions from its own resources to financial intermediaries through which the sales
are made.
Transfer Agent Fees. Fidelity Investments Institutional Operations Company, Inc., (FIIOC), an affiliate of FMR, is the transfer, dividend disbursing and shareholder servicing agent for each class of the Fund. FIIOC receives account fees and asset-based fees that vary according to the account size and type of account of the shareholders of the respective classes of the Fund. FIIOC pays for typesetting, printing and mailing of shareholder reports, except proxy statements.
For the period, transfer agent fees for each class were as follows:
| Amount | % of
Average
Net Assets |
Class A | $ 26,574 | .27 |
Class T | 10,190 | .31 |
Class B | 1,263 | .30 |
Class C | 20,625 | .30 |
Emerging Europe, Middle East, Africa (EMEA) | 323,311 | .28 |
Institutional Class | 16,491 | .18 |
| $ 398,454 | |
Annual Report
5. Fees and Other Transactions with Affiliates - continued
Accounting and Security Lending Fees. Fidelity Service Company, Inc. (FSC), an affiliate of FMR, maintains the Fund's accounting records. The accounting fee is based on the level of average net assets for each month. Under a separate contract, FSC administers the security lending program. The security lending fee is based on the number and duration of lending transactions.
Brokerage Commissions. The Fund placed a portion of its portfolio transactions with brokerage firms which are affiliates of the investment adviser. Brokerage commissions are included in net realized gain (loss) and change in net unrealized appreciation (depreciation) in the Statement of Operations. The commissions paid to these affiliated firms were $17 for the period.
6. Committed Line of Credit.
The Fund participates with other funds managed by FMR or an affiliate in a $4.25 billion credit facility (the "line of credit") to be utilized for temporary or emergency purposes to fund shareholder redemptions or for other short-term liquidity purposes. The Fund has agreed to pay commitment fees on its pro-rata portion of the line of credit, which amounted to $318 and is reflected in Miscellaneous expenses on the Statement of Operations. During the period, there were no borrowings on this line of credit.
7. Security Lending.
The Fund lends portfolio securities through a lending agent from time to time in order to earn additional income. For equity securities, a lending agent is used and may loan securities to certain qualified borrowers, including Fidelity Capital Markets (FCM), a broker-dealer affiliated with the Fund. On the settlement date of the loan, the Fund receives collateral (in the form of U.S. Treasury obligations, letters of credit and/or cash) against the loaned securities and maintains collateral in an amount not less than 100% of the market value of the loaned securities during the period of the loan. The market value of the loaned securities is determined at the close of business of the Fund and any additional required collateral is delivered to the Fund on the next business day. If the borrower defaults on its obligation to return the securities loaned because of insolvency or other reasons, the Fund may apply collateral received from the borrower against the obligation. The Fund may experience delays and costs in recovering the securities loaned. Any cash collateral received is invested in the Fidelity Securities Lending Cash Central Fund. At period end, there were no security loans outstanding. Security lending income represents the income earned on investing cash collateral, less rebates paid to borrowers and any lending agent fees associated with the loan, plus any premium payments received for lending certain types of securities. Security lending income is
Annual Report
Notes to Financial Statements - continued
7. Security Lending - continued
presented in the Statement of Operations as a component of income from Fidelity Central Funds. Total security lending income during the period amounted to $4,818. During the period, there were no securities loaned to FCM.
8. Expense Reductions.
FMR voluntarily agreed to reimburse each class to the extent annual operating expenses exceeded certain levels of average net assets as noted in the table below. Some expenses, for example interest expense, including commitment fees, are excluded from this reimbursement.
The following classes were in reimbursement during the period:
| Expense
Limitations | Reimbursement |
Class T | 1.90% | $ 1,038 |
Class B | 2.40% | 83 |
Class C | 2.40% | 1,453 |
Emerging Europe, Middle East, Africa (EMEA) | 1.40% | 2,450 |
| | $ 5,024 |
Commissions paid to certain brokers with whom FMR, or its affiliates, places trades on behalf of the Fund include an amount in addition to trade execution, which may be rebated back to the Fund to offset certain expenses. This amount totaled $26,766 for the period.
In addition, FMR reimbursed a portion of the Fund's operating expenses during the period in the amount of $3,800.
9. Distributions to Shareholders.
Distributions to shareholders of each class were as follows:
Years ended October 31, | 2013 | 2012 |
From net investment income | | |
Class A | $ 155,525 | $ 173,376 |
Class T | 46,756 | 52,030 |
Class B | 2,757 | 3,592 |
Class C | 69,716 | 61,819 |
Emerging Europe, Middle East, Africa (EMEA) | 2,222,632 | 2,310,485 |
Institutional Class | 192,599 | 181,650 |
Total | $ 2,689,985 | $ 2,782,952 |
Annual Report
9. Distributions to Shareholders - continued
Years ended October 31, | 2013 | 2012 |
From net realized gain | | |
Class A | $ 76,218 | $ - |
Class T | 28,360 | - |
Class B | 3,579 | - |
Class C | 66,141 | - |
Emerging Europe, Middle East, Africa (EMEA) | 934,516 | - |
Institutional Class | 75,810 | - |
Total | $ 1,184,624 | $ - |
10. Share Transactions.
Transactions for each class of shares were as follows:
| Shares | Dollars |
Years ended October 31, | 2013 | 2012 | 2013 | 2012 |
Class A | | | | |
Shares sold | 422,392 | 188,687 | $ 3,786,551 | $ 1,610,923 |
Reinvestment of distributions | 20,821 | 16,919 | 182,599 | 134,509 |
Shares redeemed | (321,728) | (411,198) | (2,828,311) | (3,440,999) |
Net increase (decrease) | 121,485 | (205,592) | $ 1,140,839 | $ (1,695,567) |
Class T | | | | |
Shares sold | 88,958 | 75,037 | $ 793,473 | $ 636,446 |
Reinvestment of distributions | 8,485 | 6,513 | 74,325 | 51,713 |
Shares redeemed | (115,399) | (118,919) | (1,019,893) | (995,876) |
Net increase (decrease) | (17,956) | (37,369) | $ (152,095) | $ (307,717) |
Class B | | | | |
Shares sold | 10,659 | 2,520 | $ 95,440 | $ 21,721 |
Reinvestment of distributions | 679 | 430 | 5,999 | 3,432 |
Shares redeemed | (21,228) | (17,241) | (189,688) | (147,235) |
Net increase (decrease) | (9,890) | (14,291) | $ (88,249) | $ (122,082) |
Class C | | | | |
Shares sold | 249,509 | 337,293 | $ 2,176,685 | $ 2,767,333 |
Reinvestment of distributions | 12,615 | 7,082 | 110,128 | 56,016 |
Shares redeemed | (441,523) | (250,062) | (3,878,247) | (2,064,165) |
Net increase (decrease) | (179,399) | 94,313 | $ (1,591,434) | $ 759,184 |
Emerging Europe, Middle East, Africa (EMEA) | | | | |
Shares sold | 4,724,612 | 3,688,393 | $ 42,683,733 | $ 31,635,971 |
Reinvestment of distributions | 341,639 | 276,215 | 2,999,595 | 2,198,675 |
Shares redeemed | (6,228,497) | (4,854,267) | (55,025,066) | (40,803,317) |
Net increase (decrease) | (1,162,246) | (889,659) | $ (9,341,738) | $ (6,968,671) |
Annual Report
Notes to Financial Statements - continued
10. Share Transactions - continued
| Shares | Dollars |
Years ended October 31, | 2013 | 2012 | 2013 | 2012 |
Institutional Class | | | | |
Shares sold | 478,817 | 336,442 | $ 4,308,546 | $ 2,842,158 |
Reinvestment of distributions | 10,415 | 5,723 | 91,338 | 45,553 |
Shares redeemed | (396,145) | (272,120) | (3,464,870) | (2,242,112) |
Net increase (decrease) | 93,087 | 70,045 | $ 935,014 | $ 645,599 |
11. Other.
The Fund's organizational documents provide former and current trustees and officers with a limited indemnification against liabilities arising in connection with the performance of their duties to the Fund. In the normal course of business, the Fund may also enter into contracts that provide general indemnifications. The Fund's maximum exposure under these arrangements is unknown as this would be dependent on future claims that may be made against the Fund. The risk of material loss from such claims is considered remote.
Annual Report
To the Trustees of Fidelity Investment Trust and Shareholders of Fidelity Emerging Europe, Middle East, Africa (EMEA) Fund:
We have audited the accompanying statement of assets and liabilities of Fidelity Emerging Europe, Middle East, Africa (EMEA) Fund (the Fund), a fund of Fidelity Investment Trust, including the schedule of investments, as of October 31, 2013, and the related statement of operations for the year then ended, the statement of changes in net assets for each of the two years in the period then ended, and the financial highlights for each of the five years in the period then ended. These financial statements and financial highlights are the responsibility of the Fund's management. Our responsibility is to express an opinion on these financial statements and financial highlights based on our audits.
We conducted our audits in accordance with the standards of the Public Company Accounting Oversight Board (United States). Those standards require that we plan and perform the audit to obtain reasonable assurance about whether the financial statements and financial highlights are free of material misstatement. The Fund is not required to have, nor were we engaged to perform, an audit of its internal control over financial reporting. Our audits included consideration of internal control over financial reporting as a basis for designing audit procedures that are appropriate in the circumstances, but not for the purpose of expressing an opinion on the effectiveness of the Fund's internal control over financial reporting. Accordingly, we express no such opinion. An audit also includes examining, on a test basis, evidence supporting the amounts and disclosures in the financial statements, assessing the accounting principles used and significant estimates made by management, as well as evaluating the overall financial statement presentation. Our procedures included confirmation of securities owned as of October 31, 2013, by correspondence with the custodians and brokers; where replies were not received from brokers, we performed other auditing procedures. We believe that our audits provide a reasonable basis for our opinion.
In our opinion, the financial statements and financial highlights referred to above present fairly, in all material respects, the financial position of Fidelity Emerging Europe, Middle East, Africa (EMEA) Fund as of October 31, 2013, the results of its operations for the year then ended, the changes in its net assets for each of the two years in the period then ended, and the financial highlights for each of the five years in the period then ended, in conformity with accounting principles generally accepted in the United States of America.
DELOITTE & TOUCHE LLP
Boston, Massachusetts
December 13, 2013
Annual Report
The Trustees, Member of the Advisory Board, and executive officers of the trust and fund, as applicable, are listed below. The Board of Trustees governs the fund and is responsible for protecting the interests of shareholders. The Trustees are experienced executives who meet periodically throughout the year to oversee the fund's activities, review contractual arrangements with companies that provide services to the fund, oversee management of the risks associated with such activities and contractual arrangements, and review the fund's performance. Except for James C. Curvey, Ned C. Lautenbach, Ronald P. O'Hanley, and William S. Stavropoulos, each of the Trustees oversees 171 funds. Mr. Curvey oversees 394 funds. Mr. Lautenbach, Mr. O'Hanley, and Mr. Stavropoulos each oversees 245 funds.
The Trustees hold office without limit in time except that (a) any Trustee may resign; (b) any Trustee may be removed by written instrument, signed by at least two-thirds of the number of Trustees prior to such removal; (c) any Trustee who requests to be retired or who has become incapacitated by illness or injury may be retired by written instrument signed by a majority of the other Trustees; and (d) any Trustee may be removed at any special meeting of shareholders by a two-thirds vote of the outstanding voting securities of the trust. Each Trustee who is not an interested person of the trust and the fund (as defined in the 1940 Act) (Independent Trustee), shall retire not later than the last day of the calendar year in which his or her 75th birthday occurs. The Independent Trustees may waive this mandatory retirement age policy with respect to individual Trustees. The executive officers and Advisory Board Member hold office without limit in time, except that any officer and Advisory Board Member may resign or may be removed by a vote of a majority of the Trustees at any regular meeting or any special meeting of the Trustees. Except as indicated, each individual has held the office shown or other offices in the same company for the past five years.
Experience, Skills, Attributes, and Qualifications of the Fund's Trustees. The Governance and Nominating Committee has adopted a statement of policy that describes the experience, qualifications, attributes, and skills that are necessary and desirable for potential Independent Trustee candidates (Statement of Policy). The Board believes that each Trustee satisfied at the time he or she was initially elected or appointed a Trustee, and continues to satisfy, the standards contemplated by the Statement of Policy. The Governance and Nominating Committee also engages professional search firms to help identify potential Independent Trustee candidates who have the experience, qualifications, attributes, and skills consistent with the Statement of Policy. From time to time, additional criteria based on the composition and skills of the current Independent Trustees, as well as experience or skills that may be appropriate in light of future changes to board composition, business conditions, and regulatory or other developments, have also been considered by the professional search firms and the Governance and Nominating Committee. In addition, the Board takes into account the Trustees' commitment and participation in Board and committee meetings, as well as their leadership of standing and ad hoc committees throughout their tenure.
Annual Report
Trustees and Officers - continued
In determining that a particular Trustee was and continues to be qualified to serve as a Trustee, the Board has considered a variety of criteria, none of which, in isolation, was controlling. The Board believes that, collectively, the Trustees have balanced and diverse experience, qualifications, attributes, and skills, which allow the Board to operate effectively in governing the fund and protecting the interests of shareholders. Information about the specific experience, skills, attributes, and qualifications of each Trustee, which in each case led to the Board's conclusion that the Trustee should serve (or continue to serve) as a trustee of the fund, is provided below.
Board Structure and Oversight Function. James C. Curvey is an interested person (as defined in the 1940 Act) and currently serves as Chairman. The Trustees have determined that an interested Chairman is appropriate and benefits shareholders because an interested Chairman has a personal and professional stake in the quality and continuity of services provided to the fund. Independent Trustees exercise their informed business judgment to appoint an individual of their choosing to serve as Chairman, regardless of whether the Trustee happens to be independent or a member of management. The Independent Trustees have determined that they can act independently and effectively without having an Independent Trustee serve as Chairman and that a key structural component for assuring that they are in a position to do so is for the Independent Trustees to constitute a substantial majority for the Board. The Independent Trustees also regularly meet in executive session. Ned C. Lautenbach serves as Chairman of the Independent Trustees and as such (i) acts as a liaison between the Independent Trustees and management with respect to matters important to the Independent Trustees and (ii) with management prepares agendas for Board meetings.
Fidelity funds are overseen by different Boards of Trustees. The fund's Board oversees Fidelity's equity and high income funds and another Board oversees Fidelity's investment-grade bond, money market, and asset allocation funds. The asset allocation funds may invest in Fidelity funds overseen by the fund's Board. The use of separate Boards, each with its own committee structure, allows the Trustees of each group of Fidelity funds to focus on the unique issues of the funds they oversee, including common research, investment, and operational issues. On occasion, the separate Boards establish joint committees to address issues of overlapping consequences for the Fidelity funds overseen by each Board.
The Trustees operate using a system of committees to facilitate the timely and efficient consideration of all matters of importance to the Trustees, the fund, and fund shareholders and to facilitate compliance with legal and regulatory requirements and oversight of the fund's activities and associated risks. The Board, acting through its committees, has charged FMR and its affiliates with (i) identifying events or circumstances the occurrence of which could have demonstrably adverse effects on the fund's business and/or reputation; (ii) implementing processes and controls to lessen the possibility that such events or circumstances occur or to mitigate the effects of such events or circumstances if they do occur; and (iii) creating and maintaining a system designed to evaluate continuously business and market conditions in order to facilitate the identification and implementation processes described in (i) and (ii) above. Because the day-to-day operations and activities of the fund are carried out by or through FMR, its affiliates and other service providers, the fund's exposure to risks is mitigated but not eliminated by the processes overseen by the Trustees. While each of the Board's committees has responsibility for overseeing different aspects of the fund's activities, oversight is exercised primarily through the Operations, Audit, and Compliance Committees. In addition, the Independent Trustees have worked with FMR to enhance the Board's oversight of investment and financial risks, legal and regulatory risks, technology risks, and operational risks, including the development of additional risk reporting to the Board. For example, a working group comprised of Independent Trustees and FMR has worked and continues to work to review the Fidelity funds' valuation-related activities, reporting and risk management. Appropriate personnel, including but not limited to the fund's Chief Compliance Officer (CCO), FMR's internal auditor, the independent accountants, the fund's Treasurer and portfolio management personnel, make periodic reports to the Board's committees, as appropriate, including an annual review of FMR's risk management program for the Fidelity funds. The responsibilities of each standing committee, including their oversight responsibilities, are described further under "Standing Committees of the Fund's Trustees."
Annual Report
The fund's Statement of Additional Information (SAI) includes more information about the Trustees. To request a free copy, call Fidelity at 1-800-544-8544.
Interested Trustees*:
Correspondence intended for each Trustee who is an interested person may be sent to Fidelity Investments, 245 Summer Street, Boston, Massachusetts 02210.
Name, Year of Birth; Principal Occupations and Other Relevant Experience+ |
James C. Curvey (1935) |
Year of Election or Appointment: 2007 Trustee Chairman of the Board of Trustees |
| Mr. Curvey also serves as Trustee of other Fidelity funds. Mr. Curvey is a Director of Fidelity Investments Money Management, Inc. (2009-present), Director of Fidelity Research & Analysis Co. (2009-present) and Director of FMR and FMR Co., Inc. (2007-present). Mr. Curvey is also Vice Chairman (2007-present) and Director of FMR LLC. In addition, Mr. Curvey serves as an Overseer for the Boston Symphony Orchestra and a member of the Trustees of Villanova University. Previously, Mr. Curvey was the Vice Chairman (2006-2007) and Director (2000-2007) of FMR Corp. |
Ronald P. O'Hanley (1957) |
Year of Election or Appointment: 2011 Trustee |
| Mr. O'Hanley also serves as Trustee of other Fidelity funds. He is Director of Fidelity SelectCo, LLC (2013-present), FMR Co., Inc. (2010-present), Director of Fidelity Investments Money Management, Inc. (2010-present), Director of Fidelity Research & Analysis Company (2010-present), President of Fidelity Asset Management and Corporate Services and a Member of Fidelity's Executive Committee (2010-present). Previously, Mr. O'Hanley served as President and Chief Executive Officer of BNY Mellon Asset Management (2007-2010). Mr. O'Hanley also served as Vice Chairman of Bank New York Mellon Corp. and a member of that firm's Executive Committee. Prior to the 2007 merger of The Bank of New York and Mellon Financial Corporation, he was Vice Chairman of Mellon Financial Corporation and President and Chief Executive Officer of Mellon Asset Management. He joined Mellon in February 1997. Mr. O'Hanley currently serves as Chairman of the Boston Public Library Foundation Board of Directors and sits on the Board of Directors of Beth Israel Deaconess Medical Center, the Board of Trustees of the Marine Biological Laboratory and the Advisory Board of the Maxwell School of Citizenship and Public Administration at Syracuse University. Mr. O'Hanley also chairs the Council on Asset Management for the Financial Services Roundtable and is a member of the Board of Directors of Institutional Investor's U.S. Institute. |
* Trustees have been determined to be "Interested Trustees" by virtue of, among other things, their affiliation with the trust or various entities under common control with FMR.
+ The information above includes each Trustee's principal occupation during the last five years and other information relating to the experience, attributes, and skills relevant to each Trustee's qualifications to serve as a Trustee, which led to the conclusion that each Trustee should serve as a Trustee for the fund.
Annual Report
Independent Trustees:
Correspondence intended for each Independent Trustee (that is, the Trustees other than the Interested Trustees) may be sent to Fidelity Investments, P.O. Box 55235, Boston, Massachusetts 02205-5235.
Name, Year of Birth; Principal Occupations and Other Relevant Experience+ |
Dennis J. Dirks (1948) |
Year of Election or Appointment: 2005 Trustee |
| Mr. Dirks also serves as Trustee of other Fidelity funds. Prior to his retirement in May 2003, Mr. Dirks was Chief Operating Officer and a member of the Board of The Depository Trust & Clearing Corporation (DTCC). He also served as President, Chief Operating Officer, and Board member of The Depository Trust Company (DTC) and President and Board member of the National Securities Clearing Corporation (NSCC). In addition, Mr. Dirks served as Chief Executive Officer and Board member of the Government Securities Clearing Corporation, Chief Executive Officer and Board member of the Mortgage-Backed Securities Clearing Corporation, as a Trustee and a member of the Finance Committee of Manhattan College (2005-2008), and as a Trustee and a member of the Finance Committee of AHRC of Nassau County (2006-2008). Mr. Dirks is a member of the Independent Directors Council (IDC) Governing Council (2010-present) and Board of Directors for The Brookville Center for Children's Services, Inc. (2009-present). |
Alan J. Lacy (1953) |
Year of Election or Appointment: 2008 Trustee |
| Mr. Lacy also serves as Trustee of other Fidelity funds. Mr. Lacy serves as Senior Adviser (2007-present) of Oak Hill Capital Partners, L.P. (private equity). Mr. Lacy also served as Chief Executive Officer (2000-2005) and Vice Chairman (2005-2006) of Sears Holdings Corporation and Sears, Roebuck and Co. (retail). In addition, Mr. Lacy serves as a member of the Board of Directors of Dave & Buster's Entertainment, Inc. (restaurant and entertainment complexes, 2010-present), Earth Fare, Inc. (retail grocery, 2012-present), The Hillman Companies, Inc. (hardware wholesalers, 2010-present), and Bristol-Myers Squibb Company (global pharmaceuticals, 2008-present). Mr. Lacy is a member of the Board of Trustees of The National Parks Conservation Association (2006-present). Previously, Mr. Lacy served as Chairman of the Board of Trustees of the National Parks Conservation Association (2008-2011) and as a member of the Board of Directors for the Western Union Company (global money transfer, 2006-2011). |
Ned C. Lautenbach (1944) |
Year of Election or Appointment: 2000 Trustee Chairman of the Independent Trustees |
| Mr. Lautenbach also serves as Trustee of other Fidelity funds. Mr. Lautenbach currently serves as the Lead Director of the Eaton Corporation Board of Directors (diversified industrial, 1997-present). Mr. Lautenbach is Chairman of the Board of Directors of the Philharmonic Center for the Arts in Naples, Florida (2012-present) and a member of the Council on Foreign Relations (1994-present). Previously, Mr. Lautenbach was a Partner/Advisory Partner at Clayton, Dubilier & Rice, LLC (private equity investment, 1998-2010), as well as a Director of Sony Corporation (2006-2007). |
Joseph Mauriello (1944) |
Year of Election or Appointment: 2008 Trustee |
| Mr. Mauriello also serves as Trustee of other Fidelity funds. Prior to his retirement in January 2006, Mr. Mauriello served in numerous senior management positions including Deputy Chairman and Chief Operating Officer (2004-2005), and Vice Chairman of Financial Services (2002-2004) of KPMG LLP US (professional services, 1965-2005). Mr. Mauriello currently serves as a member of the Board of Directors of XL Group plc. (global insurance and re-insurance, 2006-present). Previously, Mr. Mauriello served as a Director of the Hamilton Funds of the Bank of New York (2006-2007) and of Arcadia Resources Inc. (health care services and products, 2007-2012). |
Robert W. Selander (1950) |
Year of Election or Appointment: 2011 Trustee |
| Mr. Selander also serves as Trustee of other Fidelity funds. Previously, Mr. Selander served as a Member of the Advisory Board of other Fidelity funds (2011), and Executive Vice Chairman (2010), Chief Executive Officer (2009-2010), and President and Chief Executive Officer (1997-2009) of Mastercard, Inc. |
Cornelia M. Small (1944) |
Year of Election or Appointment: 2005 Trustee |
| Ms. Small also serves as Trustee of other Fidelity funds. Ms. Small is a member of the Board of Directors (2009-present) and Chair of the Investment Committee (2010-present) of the Teagle Foundation. Ms. Small also serves on the Investment Committee of the Berkshire Taconic Community Foundation (2008-present). Previously, Ms. Small served as Chairperson (2002-2008) and a member of the Investment Committee and Chairperson (2008-2012) and a member of the Board of Trustees of Smith College. In addition, Ms. Small served as Chief Investment Officer, Director of Global Equity Investments, and a member of the Board of Directors of Scudder, Stevens & Clark and Scudder Kemper Investments. |
William S. Stavropoulos (1939) |
Year of Election or Appointment: 2001 Trustee Vice Chairman of the Independent Trustees |
| Mr. Stavropoulos also serves as Trustee of other Fidelity funds. Mr. Stavropoulos serves as President and Founder of the Michigan Baseball Foundation, the Great Lakes Loons (2007-present). Mr. Stavropoulos is Chairman Emeritus of the Board of Directors of The Dow Chemical Company, where he previously served in numerous senior management positions, including President, CEO (1995-2000; 2002-2004), Chairman of the Executive Committee (2000-2006), and as a member of the Board of Directors (1990-2006). Currently, Mr. Stavropoulos is Chairman of the Board of Directors of Univar Inc. (global distributor of commodity and specialty chemicals), a Director of Teradata Corporation (data warehousing and technology solutions), and Maersk Inc. (industrial conglomerate), and a member of the Advisory Board for Metalmark Capital LLC (private equity investment, 2005-present). Mr. Stavropoulos is an operating advisor to Clayton, Dubilier & Rice, LLC (private equity investment). In addition, Mr. Stavropoulos is a member of the University of Notre Dame Advisory Council for the College of Science, a Trustee of the Rollin L. Gerstacker Foundation, and a Director of the Naples Philharmonic Center for the Arts. Previously, Mr. Stavropoulos served as a Director of Chemical Financial Corporation (bank holding company, 1993-2012) and Tyco International, Ltd. (multinational manufacturing and services, 2007-2012). |
David M. Thomas (1949) |
Year of Election or Appointment: 2008 Trustee |
| Mr. Thomas also serves as Trustee of other Fidelity funds. Mr. Thomas serves as Non-Executive Chairman of the Board of Directors of Fortune Brands Home and Security (home and security products, 2011-present), and as a member of the Board of Directors of Interpublic Group of Companies, Inc. (marketing communication, 2004-present). Previously, Mr. Thomas served as Executive Chairman (2005-2006) and Chairman and Chief Executive Officer (2000-2005) of IMS Health, Inc. (pharmaceutical and healthcare information solutions), and a Director of Fortune Brands, Inc. (consumer products, 2000-2011). |
+ The information above includes each Trustee's principal occupation during the last five years and other information relating to the experience, attributes, and skills relevant to each Trustee's qualifications to serve as a Trustee, which led to the conclusion that each Trustee should serve as a Trustee for the fund.
Advisory Board Member and Executive Officers:
Correspondence intended for each executive officer and Peter S. Lynch may be sent to Fidelity Investments, 245 Summer Street, Boston, Massachusetts 02210. Executive officers appear below in alphabetical order.
Name, Year of Birth; Principal Occupation |
Peter S. Lynch (1944) |
Year of Election or Appointment: 2003 Member of the Advisory Board |
| Mr. Lynch also serves as Member of the Advisory Board of other Fidelity funds. Mr. Lynch is Vice Chairman and a Director of FMR and FMR Co., Inc. In addition, Mr. Lynch serves as a Trustee of Boston College and as the Chairman of the Inner-City Scholarship Fund. Previously, Mr. Lynch served on the Special Olympics International Board of Directors (1997-2006). |
Elizabeth Paige Baumann (1968) |
Year of Election or Appointment: 2012 Anti-Money Laundering (AML) Officer |
| Ms. Baumann also serves as AML Officer of other funds. She is Chief AML Officer of FMR LLC (2012-present) and is an employee of Fidelity Investments. Previously, Ms. Baumann served as Vice President and Deputy Anti-Money Laundering Officer (2007-2012). |
William C. Coffey (1969) |
Year of Election or Appointment: 2009 Assistant Secretary |
| Mr. Coffey also serves as Assistant Secretary of other funds. He is Senior Vice President and Deputy General Counsel of FMR LLC (2010-present), and is an employee of Fidelity Investments. Previously, Mr. Coffey served as Vice President and Associate General Counsel of FMR LLC (2005-2009). |
Jonathan Davis (1968) |
Year of Election or Appointment: 2010 Assistant Treasurer |
| Mr. Davis also serves as Assistant Treasurer of other funds. Mr. Davis is an employee of Fidelity Investments. Previously, Mr. Davis served as Vice President and Associate General Counsel of FMR LLC (2003-2010). |
Adrien E. Deberghes (1967) |
Year of Election or Appointment: 2008 Deputy Treasurer |
| Mr. Deberghes also serves as an officer of other funds. He is an employee of Fidelity Investments (2008-present). Prior to joining Fidelity Investments, Mr. Deberghes was Senior Vice President of Mutual Fund Administration at State Street Corporation (2007-2008), Senior Director of Mutual Fund Administration at Investors Bank & Trust (2005-2007), and Director of Finance for Dunkin' Brands (2000-2005). |
Stephanie J. Dorsey (1969) |
Year of Election or Appointment: 2010 Assistant Treasurer |
| Ms. Dorsey also serves as an officer of other funds. She is an employee of Fidelity Investments (2008-present) and has served in other fund officer roles. Prior to joining Fidelity Investments, Ms. Dorsey served as Treasurer (2004-2008) of the JPMorgan Mutual Funds and Vice President (2004-2008) of JPMorgan Chase Bank. |
Scott C. Goebel (1968) |
Year of Election or Appointment: 2008 Secretary and Chief Legal Officer (CLO) |
| Mr. Goebel serves as Secretary and CLO of other funds. Mr. Goebel also serves as Secretary of Fidelity Investments Money Management, Inc. (FIMM) (2010-present) and Fidelity Research and Analysis Company (FRAC) (2010-present); General Counsel, Secretary, and Senior Vice President of FMR (2008-present) and FMR Co., Inc. (2008-present); Chief Legal Officer of Fidelity Management & Research (Hong Kong) Limited (2008-present) and Assistant Secretary of Fidelity Management & Research (Japan) Inc. (2008-present), and Fidelity Management & Research (U.K.) Inc. (2008-present). Previously, Mr. Goebel served as Secretary and CLO of other Fidelity funds (2008-2013), Assistant Secretary of FIMM (2008-2010), FRAC (2008-2010), and certain funds (2007-2008); and as Vice President and Secretary of Fidelity Distributors Corporation (FDC) (2005-2007). Mr. Goebel has been employed by FMR LLC or an affiliate since 2001. |
Joseph A. Hanlon (1968) |
Year of Election or Appointment: 2012 Chief Compliance Officer |
| Mr. Hanlon also serves as Chief Compliance Officer of other funds. Mr. Hanlon serves as Compliance Officer of FMR, FMR Co., Inc., Fidelity Investments Money Management, Inc. (FIMM), Fidelity Research and Analysis Company (FRAC), and Fidelity Management & Research (Hong Kong) (2009-present), as Senior Vice President of the Fidelity Asset Management Division (2009-present), and is an employee of Fidelity Investments. Previously, Mr. Hanlon served as Compliance Officer of Fidelity Management & Research (Japan) Inc. (2009-2013), Strategic Advisers, Inc. (2009-2013), and Fidelity Management & Research (U.K.) Inc. (2009-2013). |
Bruce T. Herring (1965) |
Year of Election or Appointment: 2006 Vice President of certain Equity Funds |
| Mr. Herring also serves as Vice President of other funds. He serves as Chief Investment Officer of Fidelity Global Asset Allocation (GAA) (2013-present), Chief Investment Officer and Director of Fidelity Management & Research (U.K.) Inc. (2010-present), Group Chief Investment Officer of FMR, and President of Fidelity Research & Analysis Company (2010-present). Previously, Mr. Herring served as Vice President (2005-2006) and Senior Vice President (2006-2007) of Fidelity Management & Research Company, Vice President of FMR Co., Inc. (2001-2007), and as a portfolio manager for Fidelity U.S. Equity Funds. |
Brian B. Hogan (1964) |
Year of Election or Appointment: 2009 Vice President |
| Mr. Hogan also serves as Vice President of other funds. Mr. Hogan serves as President of FMR's Equity Division (2009-present). Previously, Mr. Hogan served as Senior Vice President, Equity Research of FMR (2006-2009) and as a portfolio manager. |
Chris Maher (1972) |
Year of Election or Appointment: 2013 Assistant Treasurer |
| Mr. Maher serves as Assistant Treasurer of other funds. Mr. Maher is Vice President of Valuation Oversight and is an employee of Fidelity Investments. Previously, Mr. Maher served as Vice President of Asset Management Compliance (2013), Vice President of FMR's Program Management Group (2010-2013), and Vice President of Valuation Oversight (2008-2010). |
Christine Reynolds (1958) |
Year of Election or Appointment: 2008 Chief Financial Officer |
| Ms. Reynolds also serves as Chief Financial Officer of other funds. Ms. Reynolds became President of Fidelity Pricing and Cash Management Services (FPCMS) in August 2008. Ms. Reynolds served as Chief Operating Officer of FPCMS (2007-2008). Previously, Ms. Reynolds served as President, Treasurer, and Anti-Money Laundering officer of the Fidelity funds (2004-2007). |
Kenneth B. Robins (1969) |
Year of Election or Appointment: 2008 President and Treasurer |
| Mr. Robins also serves as an officer of other funds. Mr. Robins serves as Executive Vice President of Fidelity Investments Money Management, Inc. (FIMM) (2013-present) and is an employee of Fidelity Investments (2004-present). Previously, Mr. Robins served in other fund officer roles. |
Gary W. Ryan (1958) |
Year of Election or Appointment: 2005 Assistant Treasurer |
| Mr. Ryan also serves as Assistant Treasurer of other funds. Mr. Ryan is an employee of Fidelity Investments and has served in other fund officer roles. Previously, Mr. Ryan served as Vice President of Fund Reporting in Fidelity Pricing and Cash Management Services (FPCMS) (1999-2005). |
Stephen Sadoski (1971) |
Year of Election or Appointment: 2012 Deputy Treasurer |
| Mr. Sadoski also serves as Deputy Treasurer of other funds. He is an employee of Fidelity Investments (2012-present) and has served in another fund officer role. Prior to joining Fidelity Investments, Mr. Sadoski served as an assistant chief accountant in the Division of Investment Management of the Securities and Exchange Commission (SEC) (2009-2012) and as a senior manager at Deloitte & Touche LLP (1997-2009). |
Stacie M. Smith (1974) |
Year of Election or Appointment: 2013 Deputy Treasurer |
| Ms. Smith also serves as an officer of other funds. She is an employee of Fidelity Investments (2009-present) and has served in other fund officer roles. Prior to joining Fidelity Investments, Ms. Smith served as Senior Audit Manager of Ernst & Young LLP (1996-2009). |
Renee Stagnone (1975) |
Year of Election or Appointment: 2013 Deputy Treasurer |
| Ms. Stagnone also serves as Deputy Treasurer of other funds. Ms. Stagnone is an employee of Fidelity Investments. |
Joseph F. Zambello (1957) |
Year of Election or Appointment: 2011 Deputy Treasurer |
| Mr. Zambello also serves as Deputy Treasurer of other funds. Mr. Zambello is an employee of Fidelity Investments. Previously, Mr. Zambello served as Vice President of FMR's Program Management Group (2009-2011) and Vice President of the Transfer Agent Oversight Group (2005-2009). |
Annual Report
Fidelity Emerging Europe, Middle East, Africa (EMEA) Fund designates 100% of the dividends distributed during the fiscal year, as amounts which may be taken into account as a dividend for purposes of the maximum rate under section 1 (h) (11) of the Internal Revenue Code.
The amounts per share which represent income derived from sources within, and taxes paid to, foreign countries or possessions of the United States are as follows:
| Pay Date | Income | Taxes |
Fidelity Emerging Europe,
Middle East, Africa (EMEA) Fund | 12/10/12 | $0.147 | $0.0352 |
The fund will notify shareholders in January 2014 of amounts for use in preparing 2013 income tax returns.
Annual Report
Board Approval of Investment Advisory Contracts and Management Fees
Fidelity Emerging Europe, Middle East, Africa (EMEA) Fund
Each year, the Board of Trustees, including the Independent Trustees (together, the Board), votes on the renewal of the management contract and sub-advisory agreements (together, the Advisory Contracts) for the fund. The Board, assisted by the advice of fund counsel and Independent Trustees' counsel, requests and considers a broad range of information relevant to the renewal of the Advisory Contracts throughout the year.
The Board meets regularly and, at each of its meetings, covers an extensive agenda of topics and materials and considers factors that are relevant to its annual consideration of the renewal of the fund's Advisory Contracts, including the services and support provided to the fund and its shareholders. The Board has established various standing committees, each composed of and chaired by Independent Trustees with varying backgrounds, to which the Board has assigned specific subject matter responsibilities in order to enhance effective decision-making by the Board. The Board, acting directly and through its Committees, requests and receives information concerning the annual consideration of the renewal of the fund's Advisory Contracts. The Board also meets as needed to consider matters specifically related to the Board's annual consideration of the renewal of Advisory Contracts. Members of the Board may also meet with trustees of other Fidelity funds through ad hoc joint committees to discuss certain matters relevant to the Fidelity funds.
At its July 2013 meeting, the Board, including the Independent Trustees, unanimously determined to renew the fund's Advisory Contracts. In reaching its determination, the Board considered all factors it believed relevant, including (i) the nature, extent, and quality of the services to be provided to the fund and its shareholders (including the investment performance of the fund); (ii) the competitiveness of the fund's management fee and total expense ratio relative to peer funds; (iii) the total costs of the services to be provided by and the profits to be realized by Fidelity from its relationship with the fund; (iv) the extent to which economies of scale exist and would be realized as the fund grows; and (v) whether fee levels reflect these economies of scale, if any, for the benefit of fund shareholders.
In considering whether to renew the Advisory Contracts for the fund, the Board reached a determination, with the assistance of fund counsel and Independent Trustees' counsel and through the exercise of its business judgment, that the renewal of the Advisory Contracts was in the best interests of the fund and its shareholders and that the compensation payable under the Advisory Contracts was fair and reasonable. The Board's decision to renew the Advisory Contracts was not based on any single factor, but rather was based on a comprehensive consideration of all the information provided to the Board at its meetings throughout the year. The Board, in reaching its determination to renew the Advisory Contracts, was aware that shareholders in the fund have a broad range of investment choices available to them, including a wide choice among mutual funds offered by Fidelity's competitors, and that the fund's shareholders, who have the opportunity to review and weigh the disclosure provided by the fund in its prospectus and other public disclosures, have chosen to invest in this fund, which is a part of the Fidelity family of funds.
Annual Report
Nature, Extent, and Quality of Services Provided. The Board considered the staffing within the investment adviser, Fidelity Management & Research Company (FMR), and the sub-advisers (together, the Investment Advisers) as it relates to the fund, including the backgrounds of the fund's investment personnel, and also considered the fund's investment objective, strategies, and related investment philosophy. The Independent Trustees also had discussions with senior management of Fidelity's investment operations and investment groups. The Board considered the structure of the portfolio manager compensation program and whether this structure provides appropriate incentives to act in the best interests of the fund.
Resources Dedicated to Investment Management and Support Services. The Board and the Fund Oversight and Research Committees reviewed the general qualifications and capabilities of the Investment Advisers' investment staff, including its size, education, experience, and resources, as well as the Investment Advisers' approach to recruiting, training, managing, and compensating investment personnel. The Board noted that FMR has continued to increase the resources devoted to non-U.S. offices, including expansion of Fidelity's global investment organization. The Board also noted that Fidelity's analysts have extensive resources, tools and capabilities that allow them to conduct sophisticated quantitative and fundamental analysis, as well as credit analysis of issuers, counterparties and guarantors. Further, the Board believes that Fidelity's investment professionals have sufficient access to global information and data so as to provide competitive investment results over time, and that those professionals also have access to sophisticated tools that permit them to assess portfolio construction and risk and performance attribution characteristics continuously, as well as to transmit new information and research conclusions rapidly around the world. Additionally, in its deliberations, the Board considered the Investment Advisers' trading and risk management capabilities and resources, which are an integral part of the investment management process.
Shareholder and Administrative Services. The Board considered (i) the nature, extent, quality, and cost of advisory, administrative, and shareholder services performed by the Investment Advisers and their affiliates under the Advisory Contracts and under separate agreements covering transfer agency, pricing and bookkeeping, and securities lending services for the fund; (ii) the nature and extent of the supervision of third party service providers, principally custodians and subcustodians; and (iii) the resources devoted to, and the record of compliance with, the fund's compliance policies and procedures. The Board also reviewed the allocation of fund brokerage, including allocations to brokers affiliated with the Investment Advisers, the use of brokerage commissions to pay fund expenses, and the use of "soft" commission dollars to pay for research services.
Annual Report
Board Approval of Investment Advisory Contracts and
Management Fees - continued
The Board noted that the growth of fund assets over time across the complex allows Fidelity to reinvest in the development of services designed to enhance the value or convenience of the Fidelity funds as investment vehicles. These services include 24-hour access to account information and market information through telephone representatives and over the Internet, investor education materials and asset allocation tools, and the expanded availability of Fidelity Investor Centers.
Investment in a Large Fund Family. The Board considered the benefits to shareholders of investing in a Fidelity fund, including the benefits of investing in a fund that is part of a large family of funds offering a variety of investment disciplines and providing a large variety of mutual fund investor services. The Board noted that Fidelity had taken, or had made recommendations that resulted in the Fidelity funds taking, a number of actions over the previous year that benefited particular funds, including (i) continuing to dedicate additional resources to investment research and to the support of the senior management team that oversees asset management; (ii) persisting in efforts to enhance Fidelity's global research capabilities; (iii) launching new funds and making other enhancements to meet client needs for global and income-oriented solutions; (iv) continuing to launch dedicated lower cost underlying funds to meet portfolio construction needs related to expanding underlying fund options for Fidelity funds of funds, specifically for the Freedom Fund product lines; (v) rationalizing product lines and gaining increased efficiencies through the mergers of several funds into other funds; (vi) strengthening Fidelity's index fund offerings by reducing investment minimums and adopting or lowering existing expense caps for certain funds and classes; (vii) enhancing Global Asset Allocation product offerings by launching new funds and strategies, including "open architecture" target date funds that utilize affiliated and unaffiliated sub-advisers; (viii) modifying the eligibility criteria for Institutional Class shares of Advisor funds to increase their marketability to a portion of the defined contribution plan market; (ix) creating a new low-cost retirement share class for certain Advisor funds to appeal to large retirement plans; (x) transitioning the management of certain Fidelity commodity funds to Geode Capital Management LLC, a registered commodity pool operator, while retaining administrative responsibilities for the funds; (xi) reorganizing a number of funds; and (xii) taking steps toward establishing a new Fidelity adviser to manage sector-based funds and products.
Investment Performance. The Board considered whether the fund has operated in accordance with its investment objective, as well as its record of compliance with its investment restrictions and its performance history.
The Board took into account discussions with the Investment Advisers about fund investment performance that occur at Board meetings throughout the year. In this regard the Board noted that as part of regularly scheduled fund reviews and other reports to the Board on fund performance, the Board periodically considers annualized return information for the fund, for different time periods, measured against a securities market index ("benchmark index") and a peer group of mutual funds with similar objectives ("peer group"). In its evaluation of fund investment performance, the Board gave particular attention to information indicating changes in performance of certain Fidelity funds for specific time periods and the Investment Advisers' explanations for any overperformance or underperformance.
Annual Report
In addition to reviewing absolute and relative fund performance, the Independent Trustees periodically consider the appropriateness of fund performance metrics in evaluating the results achieved. In general, the Independent Trustees believe that fund performance should be evaluated based on net performance (after fees and expenses) of both the highest performing and lowest performing classes, where applicable, compared to appropriate benchmark indices, over appropriate time periods which may include full market cycles, and compared to peer groups, as applicable, over the same periods, taking into account relevant factors including the following: general market conditions; issuer-specific information; tactical opportunities for investment; and fund cash flows and other factors.
The Independent Trustees recognize that shareholders evaluate performance on a net basis over their own holding periods, for which one-, three-, and five-year periods are used as a proxy. For this reason, the performance information reviewed by the Board also included net cumulative calendar year total return information for the fund and an appropriate benchmark index for the most recent one- and three-year periods, as shown below. A peer group comparison is not shown below.
Annual Report
Board Approval of Investment Advisory Contracts and
Management Fees - continued
Fidelity Emerging Europe, Middle East, Africa (EMEA) Fund

Based on its review, the Board concluded that the nature, extent, and quality of services provided to the fund under the Advisory Contracts should benefit the fund's shareholders.
Competitiveness of Management Fee and Total Expense Ratio. The Board considered the fund's management fee and total expense ratio compared to "mapped groups" of competitive funds and classes. Fidelity creates "mapped groups" by combining similar Lipper investment objective categories that have comparable management fee characteristics. Combining Lipper investment objective categories aids the Board's management fee and total expense ratio comparisons by broadening the competitive group used for comparison and by reducing the number of universes to which various Fidelity funds are compared.
Management Fee. The Board considered two proprietary management fee comparisons for the 12-month (or shorter) periods shown in the chart below. The group of Lipper funds used by the Board for management fee comparisons is referred to below as the "Total Mapped Group." The Total Mapped Group comparison focuses on a fund's standing in terms of gross management fees before expense reimbursements or caps relative to the total universe of funds with comparable investment mandates, regardless of whether their management fee structures also are comparable. Funds with comparable investment mandates offer exposure to similar types of securities. Funds with comparable management fee structures have similar management fee contractual arrangements (e.g., flat rate charged for advisory services, all-inclusive fee rate, etc.). "TMG %" represents the percentage of funds in the Total Mapped Group that had management fees that were lower than the fund's. For example, a TMG % of 13% means that 87% of the funds in the Total Mapped Group had higher management fees than the fund. The "Asset-Size Peer Group" (ASPG) comparison focuses on a fund's standing relative to a subset of non-Fidelity funds within the Total Mapped Group that are similar in size and management fee structure. The ASPG represents at least 15% of the funds in the Total Mapped Group with comparable asset size and management fee structures, subject to a minimum of 50 funds (or all funds in the Total Mapped Group if fewer than 50). Additional information, such as the ASPG quartile in which the fund's management fee ranked, is also included in the chart and considered by the Board.
Annual Report
Fidelity Emerging Europe, Middle East, Africa (EMEA) Fund

The Board noted that the fund's management fee ranked below the median of its Total Mapped Group and below the median of its ASPG for 2012.
Based on its review, the Board concluded that the fund's management fee is fair and reasonable in light of the services that the fund receives and the other factors considered.
Total Expense Ratio. In its review of each class's total expense ratio, the Board considered the fund's management fee as well as other fund or class expenses, as applicable, such as transfer agent fees, pricing and bookkeeping fees, fund-paid 12b-1 fees, and custodial, legal, and audit fees. The Board also noted the effects of any waivers and reimbursements on fees and expenses. As part of its review, the Board also considered the current and historical total expense ratios of each class of the fund compared to competitive fund median expenses. Each class of the fund is compared to those funds and classes in the Total Mapped Group (used by the Board for management fee comparisons) that have a similar sales load structure.
Annual Report
Board Approval of Investment Advisory Contracts and
Management Fees - continued
The Board noted that the total expense ratio of each of Class A, Class C, Institutional Class, and the retail class ranked below its competitive median for 2012 and the total expense ratio of each of Class T and Class B ranked above its competitive median for 2012. The Board considered that, in general, various factors can affect total expense ratios. The Board noted that the total expense ratio of Class T was above the competitive median primarily because of higher 12b-1 fees on Class T. Class T has a higher 12b-1 fee, but a lower front-end sales charge, than traditionally priced front-end sales charge classes. The Board considered that Class T is primarily sold load-waived in the retirement plan market where its 0.50% 12b-1 fee is comparable to competing no-load, higher 12b-1 fee classes designed specifically for retirement plans. The Board noted that the fund offers multiple classes, each of which has a different sales load and 12b-1 fee structure, and that the multiple structures are intended to offer a range of pricing options for the intermediary market. The Board also noted that the total expense ratios of the classes vary primarily by the level of their 12b-1 fees, although differences in transfer agent fees may also cause expenses to vary from class to class.
Fees Charged to Other Fidelity Clients. The Board also considered Fidelity fee structures and other information with respect to clients of FMR and its affiliates, such as other mutual funds advised or subadvised by FMR or its affiliates, pension plan clients, and other institutional clients. The Board noted the findings of the 2013 ad hoc joint committee (created with the board of other Fidelity funds), which reviewed and compared Fidelity's institutional investment advisory business with its business of providing services to the Fidelity funds, including the differences in services provided, fees charged, and costs incurred, as well as competition in their respective marketplaces.
Based on its review of total expense ratios and fees charged to other Fidelity clients, the Board concluded that the total expense ratio of each class of the fund was reasonable, although in some cases above the median of the universe presented for comparison, in light of the services that the fund and its shareholders receive and the other factors considered.
Costs of the Services and Profitability. The Board considered the revenues earned and the expenses incurred by Fidelity in conducting the business of developing, marketing, distributing, managing, administering and servicing the fund and servicing the fund's shareholders. The Board also considered the level of Fidelity's profits in respect of all the Fidelity funds.
On an annual basis, FMR presents to the Board Fidelity's profitability for the fund. Fidelity calculates the profitability for each fund, as well as aggregate profitability for groups of Fidelity funds and all Fidelity funds, using a series of detailed revenue and cost allocation methodologies which originate with the books and records of Fidelity on which Fidelity's audited financial statements are based. The Audit Committee of the Board reviews any significant changes from the prior year's methodologies.
Annual Report
PricewaterhouseCoopers LLP (PwC), independent registered public accounting firm and auditor to Fidelity and certain Fidelity funds, has been engaged annually by the Board as part of the Board's assessment of Fidelity's profitability analysis. PwC's engagement includes the review and assessment of the methodologies used by Fidelity in determining the revenues and expenses attributable to Fidelity's mutual fund business, and completion of agreed-upon procedures surrounding the mathematical accuracy of fund profitability and its conformity to allocation methodologies. After considering PwC's reports issued under the engagement and information provided by Fidelity, the Board concluded that while other allocation methods may also be reasonable, Fidelity's profitability methodologies are reasonable in all material respects.
The Board also reviewed Fidelity's non-fund businesses and fall-out benefits related to the mutual fund business as well as cases where Fidelity's affiliates may benefit from or be related to the fund's business.
The Board considered the costs of the services provided by and the profits realized by Fidelity in connection with the operation of the fund and was satisfied that the profitability was not excessive in the circumstances.
Economies of Scale. The Board considered whether there have been economies of scale in respect of the management of the Fidelity funds, whether the Fidelity funds (including the fund) have appropriately benefited from any such economies of scale, and whether there is potential for realization of any further economies of scale. The Board considered the extent to which the fund will benefit from economies of scale through increased services to the fund, through waivers or reimbursements, or through fee or expense reductions. The Board also noted that in 2009, it and the board of other Fidelity funds created an ad hoc committee (the Economies of Scale Committee) to analyze whether FMR attains economies of scale in respect of the management and servicing of the Fidelity funds, whether the Fidelity funds have appropriately benefited from such economies of scale, and whether there is potential for realization of any further economies of scale.
The Board recognized that the fund's management contract incorporates a "group fee" structure, which provides for lower group fee rates as total fund assets under FMR's management increase, and for higher group fee rates as total fund assets under FMR's management decrease. FMR calculates the group fee rates based on a tiered asset "breakpoint" schedule that varies based on asset class. The Board considered that the group fee is designed to deliver the benefits of economies of scale to fund shareholders when total Fidelity fund assets increase, even if assets of any particular fund are unchanged or have declined, because some portion of Fidelity's costs are attributable to services provided to all Fidelity funds, and all funds benefit if those costs can be allocated among more assets. The Board concluded that, given the group fee structure, fund shareholders will benefit from lower management fees as assets under FMR's management increase at the fund complex level, regardless of whether Fidelity achieves any such economies of scale.
Annual Report
Board Approval of Investment Advisory Contracts and
Management Fees - continued
The Board concluded, taking into account the analysis of the Economies of Scale Committee, that economies of scale, if any, are being appropriately shared between fund shareholders and Fidelity.
Amendment to Description of Group Fee Rate. At its July 2013 meeting, the Board voted to approve an amendment to the fund's management contract to modify the description of the "group fee rate" effective August 1, 2013. The Board noted that under the prior description in the contract, the group fee rate was based on the average net assets of all registered investment companies with which FMR has management contracts. Under the contract's tiered asset breakpoint schedule, the group fee rate is lower as total fund assets under FMR's management increase, and higher as total fund assets under FMR's management decrease. The Board considered that the prior description would have excluded the assets of 64 Fidelity sector funds from the group fee rate calculation once Fidelity SelectCo, LLC, an affiliate of FMR, assumed management responsibilities for those funds. The Board noted that modifying the description of the group fee rate to continue to include the assets of those 64 funds for purposes of determining group fee rate breakpoints would avoid an immediate adverse impact on the group fee rate for any fund.
Additional Information Requested by the Board. In order to develop fully the factual basis for consideration of the Fidelity funds' Advisory Contracts, the Board requested and received additional information on certain topics, including: (i) fund performance trends and Fidelity's long-term strategies for certain funds; (ii) the potential to further rationalize the Fidelity fund lineup with the possibility of achieving savings for the funds and Fidelity; (iii) the methodology with respect to competitive fund data and peer group classifications; (iv) the arrangements with, and performance of, certain sub-advisers on behalf of the Fidelity funds, as well as certain proposed participating affiliate arrangements; (v) the realization of fall-out benefits in certain Fidelity business units; (vi) Fidelity's group fee structures, including the rationale for the individual fee rates of certain categories of funds and the definition of group assets; (vii) trends regarding industry use of performance fee structures and the performance adjustment methodologies applicable to the Fidelity funds; (viii) additional competitive analysis regarding the total expenses for certain classes; and (ix) fund profitability methodology, including Fidelity's cost allocation methodology, and the impact of certain factors on fund profitability results.
Based on its evaluation of all of the conclusions noted above, and after considering all factors it believed relevant, the Board ultimately concluded that the advisory fee structures are fair and reasonable, and that the fund's Advisory Contracts should be renewed.
Annual Report
Investment Adviser
Fidelity Management &
Research Company
Boston, MA
Investment Sub-Advisers
FMR Co., Inc.
Fidelity Management & Research
(U.K.) Inc.
FIL Investments (Japan) Limited
FIL Investment Advisors
FIL Investment Advisors
(U.K.) Limited
Fidelity Management & Research
(Hong Kong) Limited
Fidelity Management & Research
(Japan) Inc.
General Distributor
Fidelity Distributors Corporation
Smithfield, RI
Transfer and Service Agents
Fidelity Investments Institutional
Operations Company, Inc.
Boston, MA
Fidelity Service Company, Inc.
Boston, MA
Custodian
State Street Bank & Trust Company
Quincy, MA
The Fidelity Telephone Connection
Mutual Fund 24-Hour Service
Exchanges/Redemptions
and Account Assistance 1-800-544-6666
Product Information 1-800-544-6666
Retirement Accounts 1-800-544-4774
(8 a.m. - 9 p.m.)
TDD Service 1-800-544-0118
for the deaf and hearing impaired
(9 a.m. - 9 p.m. Eastern time)
Fidelity Automated Service
Telephone (FAST®)
1-800-544-5555
Automated line for quickest service
(Fidelity Investment logo)(registered trademark)
Corporate Headquarters
245 Summer St., Boston, MA 02210
www.fidelity.com
EME-UANN-1213
1.861971.105
(Fidelity Investment logo)(registered trademark)
Fidelity Advisor®
Emerging Europe,
Middle East, Africa (EMEA)
Fund - Class A, Class T, Class B
and Class C
Annual Report
October 31, 2013
(Fidelity Cover Art)
Class A, Class T, Class B, and Class C are classes of Fidelity® Emerging Europe,
Middle East, Africa (EMEA) Fund
Contents
Performance | (Click Here) | How the fund has done over time. |
Management's Discussion of Fund Performance | (Click Here) | The Portfolio Manager's review of fund performance and strategy. |
Shareholder Expense Example | (Click Here) | An example of shareholder expenses. |
Investment Changes | (Click Here) | A summary of major shifts in the fund's investments over the past six months. |
Investments | (Click Here) | A complete list of the fund's investments with their market values. |
Financial Statements | (Click Here) | Statements of assets and liabilities, operations, and changes in net assets, as well as financial highlights. |
Notes | (Click Here) | Notes to the financial statements. |
Report of Independent Registered Public Accounting Firm | (Click Here) | |
Trustees and Officers | (Click Here) | |
Distributions | (Click Here) | |
Board Approval of Investment Advisory Contracts and Management Fees | (Click Here) | |
To view a fund's proxy voting guidelines and proxy voting record for the 12-month period ended June 30, visit http://www.fidelity.com/proxyvotingresults or visit the Securities and Exchange Commission's (SEC) web site at http://www.sec.gov. You may also call 1-877-208-0098 to request a free copy of the proxy voting guidelines.
Standard & Poor's, S&P and S&P 500 are registered service marks of The McGraw-Hill Companies, Inc. and have been licensed for use by Fidelity Distributors Corporation.
Other third-party marks appearing herein are the property of their respective owners.
All other marks appearing herein are registered or unregistered trademarks or service marks of FMR LLC or an affiliated company. © 2013 FMR LLC. All rights reserved.
Annual Report
This report and the financial statements contained herein are submitted for the general information of the shareholders of the fund. This report is not authorized for distribution to prospective investors in the fund unless preceded or accompanied by an effective prospectus.
A fund files its complete schedule of portfolio holdings with the SEC for the first and third quarters of each fiscal year on Form N-Q. Forms N-Q are available on the SEC's web site at http://www.sec.gov. A fund's Forms N-Q may be reviewed and copied at the SEC's Public Reference Room in Washington, DC. Information regarding the operation of the SEC's Public Reference Room may be obtained by calling 1-800-SEC-0330. For a complete list of a fund's portfolio holdings, view the most recent holdings listing, semiannual report, or annual report on Fidelity's web site at http://www.fidelity.com, http://www.advisor.fidelity.com, or http://www.401k.com, as applicable.
NOT FDIC INSURED • MAY LOSE VALUE • NO BANK GUARANTEE
Neither the fund nor Fidelity Distributors Corporation is a bank.
Annual Report
Average annual total return reflects the change in the value of an investment, assuming reinvestment of the class' distributions from dividend income and capital gains (the profits earned upon the sale of securities that have grown in value, if any) and assuming a constant rate of performance each year. The $10,000 table and the fund's returns do not reflect the deduction of taxes that a shareholder would pay on fund distributions or the redemption of fund shares. During periods of reimbursement by Fidelity, a fund's total return will be greater than it would be had the reimbursement not occurred. How a fund did yesterday is no guarantee of how it will do tomorrow.
Average Annual Total Returns
Periods ended October 31, 2013 | Past 1
year | Past 5
years | Life of
fundA |
Class A (incl. 5.75% sales charge) | 5.32% | 15.08% | -0.77% |
Class T (incl. 3.50% sales charge) | 7.52% | 15.28% | -0.61% |
Class B (incl. contingent deferred sales charge) B | 5.94% | 15.36% | -0.62% |
Class C (incl. contingent deferred sales charge) C | 9.83% | 15.58% | -0.45% |
A From May 8, 2008.
B Class B shares' contingent deferred sales charges included in the past one year, past five years, and life of fund total return figures are 5%, 2% and 1%, respectively.
C Class C shares' contingent deferred sales charges included the past one year, past five years, and life of fund total return figures are 1%, 0%, and 0%, respectively.
Annual Report
$10,000 Over Life of Fund
Let's say hypothetically that $10,000 was invested in Fidelity Advisor® Emerging Europe, Middle East, Africa (EMEA) Fund - Class A on May 8, 2008, when the fund started, and the current 5.75% sales charge was paid. The chart shows how the value of your investment would have changed, and also shows how the MSCI® EM (Emerging Markets) Europe, Middle East and Africa Index performed over the same period.
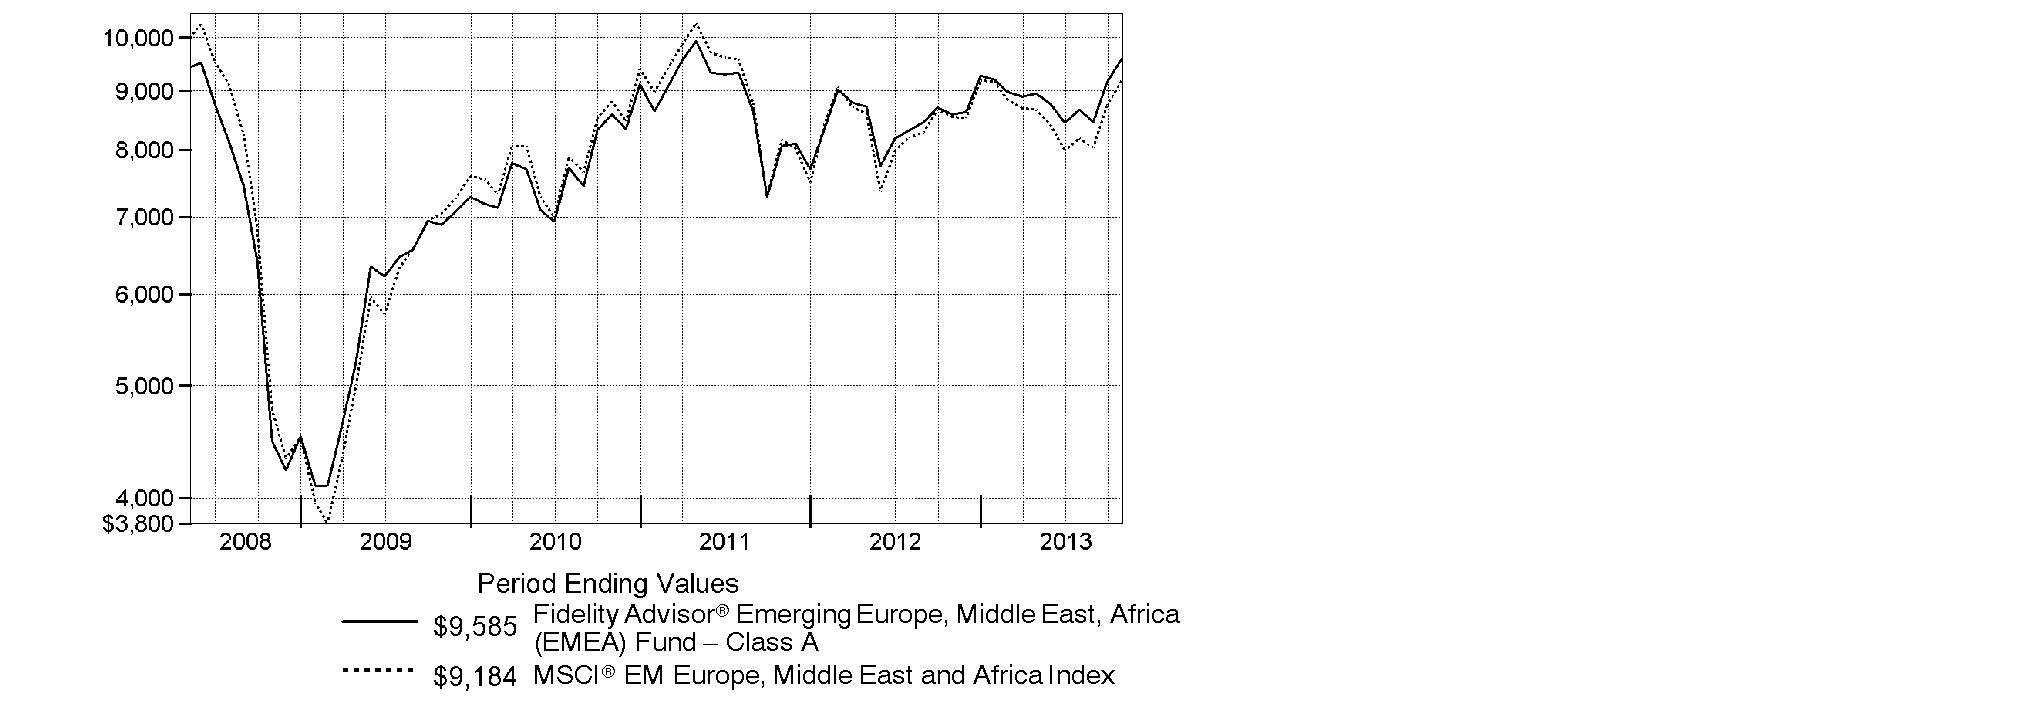
Annual Report
Market Recap: On balance, global equity markets remained upbeat for the 12-month period ending October 31, 2013. The MSCI® ACWI® (All Country World Index) Index gained 23.75% for the period, amid investor preference for higher-risk assets. The period was not without turbulence, however. In the spring and summer, central banks worldwide, especially in the U.S. and China, made clear their intentions to maintain accommodative monetary policies. That stance, combined with modest cyclical improvements around the globe and generally low valuations, underpinned the broad rally in equities. Europe (+32%) shone brightly, with most markets in the region - large and small - registering solid, index-beating gains. Another bright spot was Japan, which, despite a struggling yen and taking a second-half breather, posted a 34% result for the full year. The U.S. - by far the index's biggest constituent - also outperformed the global market with a roughly 28% advance. Meanwhile, Asia-Pacific ex Japan (+14%) lagged, hurt in part by a slowdown in Australia's mining industry as well as currency headwinds. Foreign-exchange and commodity weakness also curbed results in resource-heavy Canada and emerging markets (EM), both of which were up 7%. Country-level EM performance diverged meaningfully for the period, as evidenced by performance in Brazil (-1%), Russia (+12%), India (+1%) and China (+8%).
Comments from Adam Kutas, Portfolio Manager of Fidelity Advisor® Emerging Europe, Middle East, Africa (EMEA) Fund: For the year, the fund's Class A, Class T, Class B and Class C shares returned 11.75%, 11.42%, 10.94% and 10.83%, respectively (excluding sales charges), significantly outperforming the 7.52% gain of the MSCI® EM (Emerging Markets) Europe, Middle East and Africa Index. Versus the index, the fund benefited from out-of-benchmark positions in the United Arab Emirates (UAE) and Kenya, including First Gulf Bank - the fund's top relative contributor during the period - Dubai Financial Market and Aldar Properties, and Kenyan wireless telecommunication services provider Safaricom. Conversely, performance was hurt by the fund's positioning in South Africa - including main detractors Harmony Gold Mining and DRDGOLD, the latter of which was not in the index - unfavorable security selection in Turkey, and underweightings in Poland and Russia.
Note to shareholders: The fund may invest up to 35% of its total assets in any industry that represents more than 20% of the emerging Europe, Middle East and Africa markets. As of October 31, 2013, the fund did not have more than 25% of its total assets in any one industry.
The views expressed above reflect those of the portfolio manager(s) only through the end of the period as stated on the cover of this report and do not necessarily represent the views of Fidelity or any other person in the Fidelity organization. Any such views are subject to change at any time based upon market or other conditions and Fidelity disclaims any responsibility to update such views. These views may not be relied on as investment advice and, because investment decisions for a Fidelity fund are based on numerous factors, may not be relied on as an indication of trading intent on behalf of any Fidelity fund.
Annual Report
Shareholder Expense Example
As a shareholder of the Fund, you incur two types of costs: (1) transaction costs, including sales charges (loads) on purchase payments or redemption proceeds, redemption fees and (2) ongoing costs, including management fees, distribution and/or service (12b-1) fees and other Fund expenses. This Example is intended to help you understand your ongoing costs (in dollars) of investing in the Fund and to compare these costs with the ongoing costs of investing in other mutual funds.
The Example is based on an investment of $1,000 invested at the beginning of the period and held for the entire period (May 1, 2013 to October 31, 2013).
Actual Expenses
The first line of the accompanying table for each class of the Fund provides information about actual account values and actual expenses. You may use the information in this line, together with the amount you invested, to estimate the expenses that you paid over the period. Simply divide your account value by $1,000.00 (for example, an $8,600 account value divided by $1,000.00 = 8.6), then multiply the result by the number in the first line for a class of the Fund under the heading entitled "Expenses Paid During Period" to estimate the expenses you paid on your account during this period. A small balance maintenance fee of $12.00 that is charged once a year may apply for certain accounts with a value of less than $2,000. This fee is not included in the table below. If it was, the estimate of expenses you paid during the period would be higher, and your ending account value lower, by this amount. In addition, the Fund, as a shareholder in the underlying Fidelity Central Funds, will indirectly bear its pro-rata share of the fees and expenses incurred by the underlying Fidelity Central Funds. These fees and expenses are not included in the Fund's annualized expense ratio used to calculate the expense estimate in the table below.
Hypothetical Example for Comparison Purposes
The second line of the accompanying table for each class of the Fund provides information about hypothetical account values and hypothetical expenses based on a Class' actual expense ratio and an assumed rate of return of 5% per year before expenses, which is not the Class' actual return. The hypothetical account values and expenses may not be used to estimate the actual ending account balance or expenses you paid for the period. You may use this information to compare the ongoing costs of investing in the Fund and other funds. To do so, compare this 5% hypothetical example with the 5% hypothetical examples that appear in the shareholder reports of the other funds. A small balance maintenance fee of $12.00 that is charged once a year may apply for certain accounts with a value of less than $2,000. This fee is not included in the table below. If it was, the estimate of expenses you paid during the period would be higher, and your ending account value lower, by this amount. In addition, the Fund, as a shareholder in the underlying Fidelity Central Funds, will indirectly bear its pro-rata share of the fees and expenses incurred by the underlying Fidelity Central Funds. These fees and expenses are not included in the Fund's annualized expense ratio used to calculate the expense estimate in the table below.
Please note that the expenses shown in the table are meant to highlight your ongoing costs only and do not reflect any transaction costs. Therefore, the second line of the table is useful in comparing ongoing costs only, and will not help you determine the relative total costs of owning different funds. In addition, if these transactional costs were included, your costs would have been higher.
Annual Report
| Annualized Expense RatioB | Beginning
Account Value
May 1, 2013 | Ending
Account Value
October 31, 2013 | Expenses Paid
During Period*
May 1, 2013 to October 31, 2013 |
Class A | 1.62% | | | |
Actual | | $ 1,000.00 | $ 1,072.30 | $ 8.46 |
HypotheticalA | | $ 1,000.00 | $ 1,017.04 | $ 8.24 |
Class T | 1.90% | | | |
Actual | | $ 1,000.00 | $ 1,070.10 | $ 9.91 |
HypotheticalA | | $ 1,000.00 | $ 1,015.63 | $ 9.65 |
Class B | 2.40% | | | |
Actual | | $ 1,000.00 | $ 1,068.60 | $ 12.51 |
HypotheticalA | | $ 1,000.00 | $ 1,013.11 | $ 12.18 |
Class C | 2.40% | | | |
Actual | | $ 1,000.00 | $ 1,068.30 | $ 12.51 |
HypotheticalA | | $ 1,000.00 | $ 1,013.11 | $ 12.18 |
Emerging Europe, Middle East, Africa (EMEA) | 1.40% | | | |
Actual | | $ 1,000.00 | $ 1,073.30 | $ 7.32 |
HypotheticalA | | $ 1,000.00 | $ 1,018.15 | $ 7.12 |
Institutional Class | 1.23% | | | |
Actual | | $ 1,000.00 | $ 1,074.50 | $ 6.43 |
HypotheticalA | | $ 1,000.00 | $ 1,019.00 | $ 6.26 |
A 5% return per year before expenses
B Annualized expense ratio reflects expenses net of applicable fee waivers.
* Expenses are equal to each Class' annualized expense ratio, multiplied by the average account value over the period, multiplied by 184/365 (to reflect the one-half year period).
Annual Report
Investment Changes (Unaudited)
Geographic Diversification (% of fund's net assets) |
As of October 31, 2013 |
 | South Africa 36.6% | |
 | Russia 31.9% | |
 | Poland 5.6% | |
 | United Arab Emirates 4.5% | |
 | Turkey 3.7% | |
 | Czech Republic 2.8% | |
 | United Kingdom 2.6% | |
 | Kenya 2.1% | |
 | Qatar 1.8% | |
 | Other * 8.4% | |

* Includes Short-Term Investments and Net Other Assets (Liabilities). |
Percentages are based on country or territory of incorporation and are adjusted for the effect of futures contracts, if applicable. |
As of April 30, 2013 |
| South Africa 38.4% | |
| Russia 32.3% | |
| Turkey 9.3% | |
| United Arab Emirates 4.9% | |
| Poland 2.8% | |
| Kenya 2.7% | |
| Qatar 1.6% | |
| Nigeria 1.2% | |
| Czech Republic 1.0% | |
| Other * 5.8% | |

* Includes Short-Term Investments and Net Other Assets (Liabilities). |
Percentages are based on country or territory of incorporation and are adjusted for the effect of futures contracts, if applicable. |
Asset Allocation as of October 31, 2013 |
| % of fund's
net assets | % of fund's net assets
6 months ago |
Stocks | 99.1 | 99.3 |
Short-Term Investments and Net Other Assets (Liabilities) | 0.9 | 0.7 |
Top Ten Stocks as of October 31, 2013 |
| % of fund's
net assets | % of fund's net assets
6 months ago |
Sberbank (Savings Bank of the Russian Federation) (Russia, Commercial Banks) | 7.1 | 8.7 |
LUKOIL Oil Co. (United Kingdom) (Russia, Oil, Gas & Consumable Fuels) | 6.7 | 7.8 |
MTN Group Ltd. (South Africa, Wireless Telecommunication Services) | 5.7 | 7.2 |
Gazprom OAO (Russia, Oil, Gas & Consumable Fuels) | 5.4 | 4.3 |
Naspers Ltd. Class N (South Africa, Media) | 4.3 | 2.1 |
Sasol Ltd. (South Africa, Oil, Gas & Consumable Fuels) | 2.7 | 1.5 |
Bank Polska Kasa Opieki SA (Poland, Commercial Banks) | 2.7 | 1.8 |
Magnit OJSC (Russia, Food & Staples Retailing) | 2.5 | 1.8 |
Standard Bank Group Ltd. (South Africa, Commercial Banks) | 2.3 | 3.1 |
Surgutneftegas (Russia, Oil, Gas & Consumable Fuels) | 2.3 | 3.5 |
| 41.7 | |
Market Sectors as of October 31, 2013 |
| % of fund's
net assets | % of fund's net assets
6 months ago |
Financials | 34.2 | 34.1 |
Energy | 23.2 | 23.6 |
Telecommunication Services | 11.7 | 11.1 |
Consumer Staples | 10.0 | 10.8 |
Consumer Discretionary | 7.1 | 3.9 |
Materials | 6.8 | 9.2 |
Industrials | 2.7 | 4.4 |
Health Care | 2.2 | 1.3 |
Utilities | 0.8 | 0.6 |
Information Technology | 0.4 | 0.3 |
Annual Report
Investments October 31, 2013
Showing Percentage of Net Assets
Common Stocks - 95.3% |
| Shares | | Value |
Bangladesh - 0.4% |
Grameenphone Ltd. | 120,000 | | $ 296,506 |
Square Pharmaceuticals Ltd. | 125,000 | | 289,396 |
TOTAL BANGLADESH | | 585,902 |
Botswana - 0.2% |
First National Bank of Botswana Ltd. | 650,000 | | 291,113 |
Canada - 0.5% |
Africa Oil Corp. (a) | 75,400 | | 669,644 |
Cayman Islands - 1.0% |
Eurasia Drilling Co. Ltd. GDR (Reg. S) | 33,600 | | 1,422,960 |
Czech Republic - 2.8% |
Komercni Banka A/S | 7,800 | | 1,936,506 |
Philip Morris CR A/S | 2,800 | | 1,589,076 |
Telefonica Czech Rep A/S | 23,900 | | 389,876 |
TOTAL CZECH REPUBLIC | | 3,915,458 |
Estonia - 0.4% |
Tallinna Kaubamaja AS | 70,900 | | 526,567 |
Greece - 0.9% |
Jumbo SA (a) | 45,700 | | 614,287 |
Karelia Tobacco Co., Inc. | 1,970 | | 614,795 |
Kri Kri Milk Industry SA (a) | 25,000 | | 71,282 |
Sarantis SA (a) | 4,628 | | 36,822 |
TOTAL GREECE | | 1,337,186 |
Israel - 0.2% |
Bezeq The Israeli Telecommunication Corp. Ltd. | 200,000 | | 348,302 |
Kazakhstan - 0.1% |
Kcell JSC GDR | 10,000 | | 173,000 |
Kenya - 2.1% |
British American Tobacco Kenya Ltd. | 51,700 | | 347,695 |
Kenya Commercial Bank Ltd. | 250,000 | | 142,062 |
Safaricom Ltd. | 17,420,944 | | 1,928,857 |
Uchumi Supermarket Ltd. | 2,397,200 | | 596,842 |
TOTAL KENYA | | 3,015,456 |
Kuwait - 0.3% |
Kuwait Food Co. (Americana) | 50,000 | | 435,861 |
Lithuania - 0.4% |
Apranga AB | 163,766 | | 564,777 |
Common Stocks - continued |
| Shares | | Value |
Nigeria - 0.6% |
Skye Bank PLC | 5,785,889 | | $ 149,384 |
Zenith Bank PLC | 5,269,355 | | 714,747 |
TOTAL NIGERIA | | 864,131 |
Oman - 0.8% |
National Bank of Oman (a) | 828,494 | | 634,820 |
Oman Telecommunications Co. (a) | 136,761 | | 552,372 |
TOTAL OMAN | | 1,187,192 |
Poland - 5.6% |
Amica Wronki SA | 10,200 | | 354,310 |
Bank Handlowy w Warszawie SA | 51,300 | | 1,978,489 |
Bank Polska Kasa Opieki SA | 60,200 | | 3,771,844 |
Powszechny Zaklad Ubezpieczen SA | 12,000 | | 1,826,286 |
TOTAL POLAND | | 7,930,929 |
Qatar - 1.8% |
Gulf International Services QSC (a) | 34,000 | | 547,363 |
Industries Qatar QSC | 16,528 | | 724,235 |
Qatar National Bank SAQ | 28,281 | | 1,289,738 |
TOTAL QATAR | | 2,561,336 |
Romania - 1.2% |
Banca Transilvania SA (a) | 1,125,000 | | 485,545 |
Bursa de Valori Bucuresti | 61,814 | | 475,296 |
Nuclearelectrica SA rights (a) | 82,000 | | 275,346 |
SNP Petrom SA | 4,005,225 | | 545,562 |
TOTAL ROMANIA | | 1,781,749 |
Russia - 28.1% |
Gazprom OAO | 1,616,200 | | 7,583,414 |
LUKOIL Oil Co. | 13,100 | | 859,425 |
LUKOIL Oil Co. sponsored ADR (United Kingdom) | 131,995 | | 8,658,872 |
Magnit OJSC | 13,200 | | 3,552,063 |
Megafon OJSC GDR | 79,000 | | 2,867,700 |
Mobile TeleSystems OJSC | 98,200 | | 1,033,725 |
Moscow Exchange MICEX-RTS OAO | 450,500 | | 860,383 |
NOVATEK OAO | 42,000 | | 539,675 |
NOVATEK OAO GDR (Reg. S) | 19,450 | | 2,732,725 |
Sberbank (Savings Bank of the Russian Federation) | 3,135,200 | | 10,049,609 |
Vozrozhdenie Bank | 85,700 | | 1,106,298 |
TOTAL RUSSIA | | 39,843,889 |
Common Stocks - continued |
| Shares | | Value |
South Africa - 36.6% |
AngloGold Ashanti Ltd. | 130,300 | | $ 1,969,407 |
Aspen Pharmacare Holdings Ltd. | 60,400 | | 1,681,483 |
Cashbuild Ltd. | 85,400 | | 1,331,521 |
Clicks Group Ltd. | 343,217 | | 2,138,536 |
DRDGOLD Ltd. | 3,287,814 | | 1,623,965 |
DRDGOLD Ltd. sponsored ADR | 28,300 | | 139,519 |
FirstRand Ltd. | 819,800 | | 2,939,888 |
Harmony Gold Mining Co. Ltd. | 461,100 | | 1,591,068 |
Holdsport Ltd. | 130,400 | | 636,494 |
Hulamin Ltd. (a) | 876,800 | | 495,227 |
Metrofile Holdings Ltd. | 1,089,700 | | 536,234 |
MTN Group Ltd. | 407,650 | | 8,102,850 |
Nampak Ltd. | 907,400 | | 3,000,939 |
Naspers Ltd. Class N | 65,600 | | 6,136,063 |
Omnia Holdings Ltd. | 40,600 | | 838,147 |
Pioneer Foods Ltd. | 150,300 | | 1,272,619 |
Raubex Group Ltd. | 802,400 | | 1,902,340 |
Remgro Ltd. | 124,200 | | 2,528,849 |
RMB Holdings Ltd. | 221,500 | | 1,110,506 |
Sasol Ltd. | 76,000 | | 3,883,435 |
Shoprite Holdings Ltd. | 163,900 | | 3,000,854 |
Standard Bank Group Ltd. | 257,363 | | 3,269,225 |
Steinhoff International Holdings Ltd. | 40,000 | | 154,641 |
Vodacom Group Ltd. | 87,400 | | 1,001,220 |
Zeder Investments Ltd. | 1,556,380 | | 671,972 |
TOTAL SOUTH AFRICA | | 51,957,002 |
Sri Lanka - 0.3% |
Hatton National Bank PLC | 365,000 | | 409,893 |
Turkey - 3.7% |
Aygaz A/S | 184,000 | | 842,460 |
Koc Holding A/S | 265,850 | | 1,305,112 |
Turkiye Garanti Bankasi A/S | 488,000 | | 1,965,445 |
Turkiye Halk Bankasi A/S | 135,000 | | 1,092,173 |
TOTAL TURKEY | | 5,205,190 |
United Arab Emirates - 4.5% |
Agthia Group PJSC | 224,869 | | 249,786 |
Aldar Properties PJSC | 1,437,210 | | 1,056,484 |
Dubai Financial Market PJSC (a) | 3,234,033 | | 2,051,537 |
Emaar Properties PJSC | 330,000 | | 546,256 |
First Gulf Bank PJSC | 325,940 | | 1,437,579 |
Common Stocks - continued |
| Shares | | Value |
United Arab Emirates - continued |
National Bank of Abu Dhabi PJSC | 131,600 | | $ 447,863 |
SHUAA Capital PSC (a) | 2,220,000 | | 604,411 |
TOTAL UNITED ARAB EMIRATES | | 6,393,916 |
United Kingdom - 2.6% |
Alabama Noor Hospitals Group PLC (a) | 39,100 | | 532,890 |
Fawaz Abdulaziz Alhokair & Co. (HSBC Warrant Program) warrants 2/23/15 (a) | 10,000 | | 329,298 |
Herfy Food Services Co. Ltd. (HSBC Warrant Program) warrants 10/8/15 (a) | 21,500 | | 640,632 |
NMC Health PLC | 105,200 | | 611,119 |
Old Mutual PLC | 245,200 | | 795,289 |
Saudia Dairy & Foodstuff Co. (HSBC Warrant Program) warrants 6/26/15 (a) | 19,000 | | 466,084 |
The Savola Group (HSBC Warrant Program) warrants 2/2/15 (a) | 19,000 | | 279,903 |
TOTAL UNITED KINGDOM | | 3,655,215 |
Zambia - 0.2% |
Zambeef Products PLC (a) | 351,874 | | 225,148 |
TOTAL COMMON STOCKS (Cost $122,897,776) |
135,301,816
|
Nonconvertible Preferred Stocks - 3.8% |
| | | |
Russia - 3.8% |
Surgutneftegas | 4,375,800 | | 3,254,144 |
Tatneft OAO | 598,700 | | 2,206,570 |
TOTAL NONCONVERTIBLE PREFERRED STOCKS (Cost $4,425,369) |
5,460,714
|
Money Market Funds - 0.7% |
| Shares | | Value |
Fidelity Cash Central Fund, 0.09% (b)
(Cost $927,624) | 927,624 | | $ 927,624 |
TOTAL INVESTMENT PORTFOLIO - 99.8% (Cost $128,250,769) | 141,690,154 |
NET OTHER ASSETS (LIABILITIES) - 0.2% | | 324,707 |
NET ASSETS - 100% | $ 142,014,861 |
Legend |
(a) Non-income producing |
(b) Affiliated fund that is generally available only to investment companies and other accounts managed by Fidelity Investments. The rate quoted is the annualized seven-day yield of the fund at period end. A complete unaudited listing of the fund's holdings as of its most recent quarter end is available upon request. In addition, each Fidelity Central Fund's financial statements, which are not covered by the Fund's Report of Independent Registered Public Accounting Firm, are available on the SEC's website or upon request. |
Affiliated Central Funds |
Information regarding fiscal year to date income earned by the Fund from investments in Fidelity Central Funds is as follows: |
Fund | Income earned |
Fidelity Cash Central Fund | $ 3,124 |
Fidelity Securities Lending Cash Central Fund | 4,818 |
Total | $ 7,942 |
Other Information |
Categorizations in the Schedule of Investments are based on country or territory of incorporation. |
The following is a summary of the inputs used, as of October 31, 2013, involving the Fund's assets and liabilities carried at fair value. The inputs or methodology used for valuing securities may not be an indication of the risk associated with investing in those securities. For more information on valuation inputs, and their aggregation into the levels used in the table below, please refer to the Investment Valuation section in the accompanying Notes to Financial Statements. |
Valuation Inputs at Reporting Date: |
Description | Total | Level 1 | Level 2 | Level 3 |
Investments in Securities: | | | | |
Equities: | | | | |
Consumer Discretionary | $ 10,227,954 | $ 10,227,954 | $ - | $ - |
Consumer Staples | 14,222,085 | 14,222,085 | - | - |
Energy | 32,903,789 | 29,020,354 | 3,883,435 | - |
Financials | 48,355,407 | 46,639,490 | 1,715,917 | - |
Health Care | 3,114,888 | 3,114,888 | - | - |
Industrials | 3,931,687 | 3,931,687 | - | - |
Information Technology | 536,234 | 536,234 | - | - |
Materials | 9,658,272 | 4,473,832 | 5,184,440 | - |
Telecommunication Services | 16,694,408 | 16,694,408 | - | - |
Utilities | 1,117,806 | 1,117,806 | - | - |
Money Market Funds | 927,624 | 927,624 | - | - |
Total Investments in Securities: | $ 141,690,154 | $ 130,906,362 | $ 10,783,792 | $ - |
See accompanying notes which are an integral part of the financial statements.
Annual Report
Statement of Assets and Liabilities
| October 31, 2013 |
| | |
Assets | | |
Investment in securities, at value - See accompanying schedule: Unaffiliated issuers (cost $127,323,145) | $ 140,762,530 | |
Fidelity Central Funds (cost $927,624) | 927,624 | |
Total Investments (cost $128,250,769) | | $ 141,690,154 |
Foreign currency held at value (cost $6,860) | | 6,860 |
Receivable for investments sold | | 543,045 |
Receivable for fund shares sold | | 456,976 |
Dividends receivable | | 297,198 |
Distributions receivable from Fidelity Central Funds | | 82 |
Prepaid expenses | | 396 |
Other receivables | | 3,403 |
Total assets | | 142,998,114 |
| | |
Liabilities | | |
Payable to custodian bank | $ 100,546 | |
Payable for investments purchased | 543,105 | |
Payable for fund shares redeemed | 113,301 | |
Accrued management fee | 102,489 | |
Distribution and service plan fees payable | 9,522 | |
Other affiliated payables | 35,514 | |
Audit fees payable | 44,096 | |
Other payables and accrued expenses | 34,680 | |
Total liabilities | | 983,253 |
| | |
Net Assets | | $ 142,014,861 |
Net Assets consist of: | | |
Paid in capital | | $ 129,031,339 |
Undistributed net investment income | | 1,897,738 |
Accumulated undistributed net realized gain (loss) on investments and foreign currency transactions | | (2,364,438) |
Net unrealized appreciation (depreciation) on investments and assets and liabilities in foreign currencies | | 13,450,222 |
Net Assets | | $ 142,014,861 |
See accompanying notes which are an integral part of the financial statements.
Annual Report
Statement of Assets and Liabilities - continued
| October 31, 2013 |
| | |
Calculation of Maximum Offering Price Class A:
Net Asset Value and redemption price per share ($10,883,131 ÷ 1,146,802 shares) | | $ 9.49 |
| | |
Maximum offering price per share (100/94.25 of $9.49) | | $ 10.07 |
Class T:
Net Asset Value and redemption price per share ($3,465,265 ÷ 366,170 shares) | | $ 9.46 |
| | |
Maximum offering price per share (100/96.50 of $9.46) | | $ 9.80 |
Class B:
Net Asset Value and offering price per share ($388,173 ÷ 40,870 shares)A | | $ 9.50 |
| | |
Class C:
Net Asset Value and offering price per share ($6,781,855 ÷ 722,186 shares)A | | $ 9.39 |
| | |
Emerging Europe, Middle East, Africa (EMEA):
Net Asset Value, offering price and redemption price per share ($110,265,497 ÷ 11,580,491 shares) | | $ 9.52 |
| | |
Institutional Class:
Net Asset Value, offering price and redemption price per share ($10,230,940 ÷ 1,074,619 shares) | | $ 9.52 |
A Redemption price per share is equal to net asset value less any applicable contingent deferred sales charge.
See accompanying notes which are an integral part of the financial statements.
Annual Report
Financial Statements - continued
Statement of Operations
| Year ended October 31, 2013 |
| | |
Investment Income | | |
Dividends | | $ 5,669,711 |
Interest | | 11,822 |
Income from Fidelity Central Funds | | 7,942 |
Income before foreign taxes withheld | | 5,689,475 |
Less foreign taxes withheld | | (752,601) |
Total income | | 4,936,874 |
| | |
Expenses | | |
Management fee | $ 1,158,980 | |
Transfer agent fees | 398,454 | |
Distribution and service plan fees | 114,080 | |
Accounting and security lending fees | 74,660 | |
Custodian fees and expenses | 230,069 | |
Independent trustees' compensation | 838 | |
Registration fees | 82,070 | |
Audit | 61,954 | |
Legal | 383 | |
Miscellaneous | 1,128 | |
Total expenses before reductions | 2,122,616 | |
Expense reductions | (35,590) | 2,087,026 |
Net investment income (loss) | | 2,849,848 |
Realized and Unrealized Gain (Loss) Net realized gain (loss) on: | | |
Investment securities: | | |
Unaffiliated issuers | 522,076 | |
Foreign currency transactions | (96,200) | |
Total net realized gain (loss) | | 425,876 |
Change in net unrealized appreciation (depreciation) on: Investment securities | 11,140,957 | |
Assets and liabilities in foreign currencies | 10,565 | |
Total change in net unrealized appreciation (depreciation) | | 11,151,522 |
Net gain (loss) | | 11,577,398 |
Net increase (decrease) in net assets resulting from operations | | $ 14,427,246 |
See accompanying notes which are an integral part of the financial statements.
Annual Report
Statement of Changes in Net Assets
| Year ended
October 31,
2013 | Year ended
October 31,
2012 |
Increase (Decrease) in Net Assets | | |
Operations | | |
Net investment income (loss) | $ 2,849,848 | $ 3,198,505 |
Net realized gain (loss) | 425,876 | 10,513,420 |
Change in net unrealized appreciation (depreciation) | 11,151,522 | (5,470,956) |
Net increase (decrease) in net assets resulting
from operations | 14,427,246 | 8,240,969 |
Distributions to shareholders from net investment income | (2,689,985) | (2,782,952) |
Distributions to shareholders from net realized gain | (1,184,624) | - |
Total distributions | (3,874,609) | (2,782,952) |
Share transactions - net increase (decrease) | (9,097,663) | (7,689,254) |
Redemption fees | 52,524 | 36,290 |
Total increase (decrease) in net assets | 1,507,498 | (2,194,947) |
| | |
Net Assets | | |
Beginning of period | 140,507,363 | 142,702,310 |
End of period (including undistributed net investment income of $1,897,738 and undistributed net investment income of $2,631,143, respectively) | $ 142,014,861 | $ 140,507,363 |
See accompanying notes which are an integral part of the financial statements.
Annual Report
Financial Highlights - Class A
Years ended October 31, | 2013 | 2012 | 2011 | 2010 | 2009 |
Selected Per-Share Data | | | | | |
Net asset value, beginning of period | $ 8.71 | $ 8.34 | $ 8.97 | $ 7.26 | $ 4.75 |
Income from Investment Operations | | | | | |
Net investment income (loss) C | .16 | .18 | .16 F | .07 | .05 |
Net realized and unrealized gain (loss) | .85 | .34 | (.70) | 1.70 | 2.48 |
Total from investment operations | 1.01 | .52 | (.54) | 1.77 | 2.53 |
Distributions from net investment income | (.15) | (.15) | (.08) | (.04) | (.03) |
Distributions from net realized gain | (.07) | - | (.02) | (.02) | - |
Total distributions | (.23) J | (.15) | (.10) | (.07) I | (.03) |
Redemption fees added to paid in capital C | - H | - H | .01 | .01 | .01 |
Net asset value, end of period | $ 9.49 | $ 8.71 | $ 8.34 | $ 8.97 | $ 7.26 |
Total Return A,B | 11.75% | 6.38% | (6.05)% | 24.66% | 53.78% |
Ratios to Average Net Assets D,G | | | | | |
Expenses before reductions | 1.64% | 1.62% | 1.60% | 1.69% | 1.87% |
Expenses net of fee waivers, if any | 1.63% | 1.62% | 1.56% | 1.50% | 1.50% |
Expenses net of all reductions | 1.62% | 1.60% | 1.51% | 1.38% | 1.39% |
Net investment income (loss) | 1.82% | 2.09% | 1.70% F | .95% | .84% |
Supplemental Data | | | | | |
Net assets, end of period (000 omitted) | $ 10,883 | $ 8,934 | $ 10,260 | $ 10,045 | $ 4,817 |
Portfolio turnover rate E | 64% | 30% | 53% | 96% | 58% |
A Total returns would have been lower if certain expenses had not been reduced during the applicable periods shown.
B Total returns do not include the effect of the sales charges.
C Calculated based on average shares outstanding during the period.
D Fees and expenses of any underlying Fidelity Central Funds are not included in the Fund's expense ratio. The Fund indirectly bears its proportionate share of the expenses of any underlying Fidelity Central Funds.
E Amount does not include the portfolio activity of any underlying Fidelity Central Funds.
F Investment income per share reflects a large, non-recurring dividend which amounted to $.04 per share. Excluding this non-recurring dividend, the ratio of net investment income (loss) to average net assets would have been 1.25%.
G Expense ratios reflect operating expenses of the class. Expenses before reductions do not reflect amounts reimbursed by the investment adviser or reductions from brokerage service arrangements or reductions from other expense offset arrangements and do not represent the amount paid by the class during periods when reimbursements or reductions occur. Expenses net of fee waivers reflect expenses after reimbursement by the investment adviser but prior to reductions from brokerage service arrangements or other expense offset arrangements. Expenses net of all reductions represent the net expenses paid by the class.
H Amount represents less than $.01 per share.
I Total distributions of $.07 per share is comprised of distributions from net investment income of $.041 and distributions from net realized gain of $.024 per share.
J Total distributions of $.23 per share is comprised of distributions from net investment income of $.151 and distributions from net realized gain of $.074 per share.
See accompanying notes which are an integral part of the financial statements.
Annual Report
Financial Highlights - Class T
Years ended October 31, | 2013 | 2012 | 2011 | 2010 | 2009 |
Selected Per-Share Data | | | | | |
Net asset value, beginning of period | $ 8.68 | $ 8.31 | $ 8.96 | $ 7.25 | $ 4.75 |
Income from Investment Operations | | | | | |
Net investment income (loss) C | .14 | .15 | .13 F | .06 | .04 |
Net realized and unrealized gain (loss) | .84 | .35 | (.71) | 1.69 | 2.47 |
Total from investment operations | .98 | .50 | (.58) | 1.75 | 2.51 |
Distributions from net investment income | (.12) | (.13) | (.07) | (.03) | (.02) |
Distributions from net realized gain | (.07) | - | (.02) | (.02) | - |
Total distributions | (.20) J | (.13) | (.08) I | (.05) | (.02) |
Redemption fees added to paid in capital C | - H | - H | .01 | .01 | .01 |
Net asset value, end of period | $ 9.46 | $ 8.68 | $ 8.31 | $ 8.96 | $ 7.25 |
Total Return A,B | 11.42% | 6.14% | (6.42)% | 24.44% | 53.20% |
Ratios to Average Net Assets D,G | | | | | |
Expenses before reductions | 1.93% | 1.89% | 1.87% | 1.95% | 2.15% |
Expenses net of fee waivers, if any | 1.90% | 1.89% | 1.84% | 1.75% | 1.75% |
Expenses net of all reductions | 1.88% | 1.86% | 1.78% | 1.62% | 1.64% |
Net investment income (loss) | 1.55% | 1.82% | 1.42% F | .70% | .59% |
Supplemental Data | | | | | |
Net assets, end of period (000 omitted) | $ 3,465 | $ 3,336 | $ 3,502 | $ 3,114 | $ 1,560 |
Portfolio turnover rate E | 64% | 30% | 53% | 96% | 58% |
A Total returns would have been lower if certain expenses had not been reduced during the applicable periods shown.
B Total returns do not include the effect of the sales charges.
C Calculated based on average shares outstanding during the period.
D Fees and expenses of any underlying Fidelity Central Funds are not included in the Fund's expense ratio. The Fund indirectly bears its proportionate share of the expenses of any underlying Fidelity Central Funds.
E Amount does not include the portfolio activity of any underlying Fidelity Central Funds.
F Investment income per share reflects a large, non-recurring dividend which amounted to $.04 per share. Excluding this non-recurring dividend, the ratio of net investment income (loss) to average net assets would have been .98%.
G Expense ratios reflect operating expenses of the class. Expenses before reductions do not reflect amounts reimbursed by the investment adviser or reductions from brokerage service arrangements or reductions from other expense offset arrangements and do not represent the amount paid by the class during periods when reimbursements or reductions occur. Expenses net of fee waivers reflect expenses after reimbursement by the investment adviser but prior to reductions from brokerage service arrangements or other expense offset arrangements. Expenses net of all reductions represent the net expenses paid by the class.
H Amount represents less than $.01 per share.
I Total distributions of $.08 per share is comprised of distributions from net investment income of $.068 and distributions from net realized gain of $.015 per share.
J Total distributions of $.20 per share is comprised of distributions from net investment income of $.122 and distributions from net realized gain of $.074 per share.
See accompanying notes which are an integral part of the financial statements.
Annual Report
Financial Highlights - Class B
Years ended October 31, | 2013 | 2012 | 2011 | 2010 | 2009 |
Selected Per-Share Data | | | | | |
Net asset value, beginning of period | $ 8.69 | $ 8.29 | $ 8.93 | $ 7.23 | $ 4.73 |
Income from Investment Operations | | | | | |
Net investment income (loss) C | .09 | .11 | .09 F | .02 | .01 |
Net realized and unrealized gain (loss) | .85 | .35 | (.71) | 1.68 | 2.48 |
Total from investment operations | .94 | .46 | (.62) | 1.70 | 2.49 |
Distributions from net investment income | (.06) | (.06) | (.02) | - | - |
Distributions from net realized gain | (.07) | - | (.01) | (.01) | - |
Total distributions | (.13) | (.06) | (.03) | (.01) | - |
Redemption fees added to paid in capital C | - H | - H | .01 | .01 | .01 |
Net asset value, end of period | $ 9.50 | $ 8.69 | $ 8.29 | $ 8.93 | $ 7.23 |
Total Return A,B | 10.94% | 5.56% | (6.85)% | 23.72% | 52.85% |
Ratios to Average Net Assets D,G | | | | | |
Expenses before reductions | 2.42% | 2.38% | 2.37% | 2.47% | 2.68% |
Expenses net of fee waivers, if any | 2.40% | 2.38% | 2.33% | 2.25% | 2.25% |
Expenses net of all reductions | 2.38% | 2.35% | 2.27% | 2.12% | 2.14% |
Net investment income (loss) | 1.05% | 1.33% | .93% F | .20% | .09% |
Supplemental Data | | | | | |
Net assets, end of period (000 omitted) | $ 388 | $ 441 | $ 539 | $ 822 | $ 782 |
Portfolio turnover rate E | 64% | 30% | 53% | 96% | 58% |
A Total returns would have been lower if certain expenses had not been reduced during the applicable periods shown.
B Total returns do not include the effect of the contingent deferred sales charge.
C Calculated based on average shares outstanding during the period.
D Fees and expenses of any underlying Fidelity Central Funds are not included in the Fund's expense ratio. The Fund indirectly bears its proportionate share of the expenses of any underlying Fidelity Central Funds.
E Amount does not include the portfolio activity of any underlying Fidelity Central Funds.
F Investment income per share reflects a large, non-recurring dividend which amounted to $.04 per share. Excluding this non-recurring dividend, the ratio of net investment income (loss) to average net assets would have been .49%.
G Expense ratios reflect operating expenses of the class. Expenses before reductions do not reflect amounts reimbursed by the investment adviser or reductions from brokerage service arrangements or reductions from other expense offset arrangements and do not represent the amount paid by the class during periods when reimbursements or reductions occur. Expenses net of fee waivers reflect expenses after reimbursement by the investment adviser but prior to reductions from brokerage service arrangements or other expense offset arrangements. Expenses net of all reductions represent the net expenses paid by the class.
H Amount represents less than $.01 per share.
See accompanying notes which are an integral part of the financial statements.
Annual Report
Financial Highlights - Class C
Years ended October 31, | 2013 | 2012 | 2011 | 2010 | 2009 |
Selected Per-Share Data | | | | | |
Net asset value, beginning of period | $ 8.62 | $ 8.24 | $ 8.90 | $ 7.23 | $ 4.73 |
Income from Investment Operations | | | | | |
Net investment income (loss) C | .09 | .11 | .08 F | .02 | .01 |
Net realized and unrealized gain (loss) | .83 | .35 | (.69) | 1.67 | 2.48 |
Total from investment operations | .92 | .46 | (.61) | 1.69 | 2.49 |
Distributions from net investment income | (.08) | (.08) | (.05) | (.01) | - |
Distributions from net realized gain | (.07) | - | (.02) | (.02) | - |
Total distributions | (.15) | (.08) | (.06) I | (.03) | - |
Redemption fees added to paid in capital C | - H | - H | .01 | .01 | .01 |
Net asset value, end of period | $ 9.39 | $ 8.62 | $ 8.24 | $ 8.90 | $ 7.23 |
Total Return A,B | 10.83% | 5.68% | (6.79)% | 23.61% | 52.85% |
Ratios to Average Net Assets D,G | | | | | |
Expenses before reductions | 2.42% | 2.37% | 2.36% | 2.45% | 2.61% |
Expenses net of fee waivers, if any | 2.40% | 2.37% | 2.33% | 2.25% | 2.25% |
Expenses net of all reductions | 2.38% | 2.35% | 2.27% | 2.13% | 2.14% |
Net investment income (loss) | 1.05% | 1.34% | .93% F | .20% | .09% |
Supplemental Data | | | | | |
Net assets, end of period (000 omitted) | $ 6,782 | $ 7,770 | $ 6,650 | $ 5,151 | $ 2,677 |
Portfolio turnover rate E | 64% | 30% | 53% | 96% | 58% |
A Total returns would have been lower if certain expenses had not been reduced during the applicable periods shown.
B Total returns do not include the effect of the contingent deferred sales charge.
C Calculated based on average shares outstanding during the period.
D Fees and expenses of any underlying Fidelity Central Funds are not included in the Fund's expense ratio. The Fund indirectly bears its proportionate share of the expenses of any underlying Fidelity Central Funds.
E Amount does not include the portfolio activity of any underlying Fidelity Central Funds.
F Investment income per share reflects a large, non-recurring dividend which amounted to $.04 per share. Excluding this non-recurring dividend, the ratio of net investment income (loss) to average net assets would have been .49%.
G Expense ratios reflect operating expenses of the class. Expenses before reductions do not reflect amounts reimbursed by the investment adviser or reductions from brokerage service arrangements or reductions from other expense offset arrangements and do not represent the amount paid by the class during periods when reimbursements or reductions occur. Expenses net of fee waivers reflect expenses after reimbursement by the investment adviser but prior to reductions from brokerage service arrangements or other expense offset arrangements. Expenses net of all reductions represent the net expenses paid by the class.
H Amount represents less than $.01 per share.
I Total distributions of $.06 per share is comprised of distributions from net investment income of $.047 and distributions from net realized gain of $.015 per share.
See accompanying notes which are an integral part of the financial statements.
Annual Report
Financial Highlights - Emerging Europe, Middle East, Africa (EMEA)
Years ended October 31, | 2013 | 2012 | 2011 | 2010 | 2009 |
Selected Per-Share Data | | | | | |
Net asset value, beginning of period | $ 8.75 | $ 8.37 | $ 9.00 | $ 7.28 | $ 4.76 |
Income from Investment Operations | | | | | |
Net investment income (loss) B | .18 | .20 | .18 E | .09 | .07 |
Net realized and unrealized gain (loss) | .84 | .35 | (.71) | 1.70 | 2.48 |
Total from investment operations | 1.02 | .55 | (.53) | 1.79 | 2.55 |
Distributions from net investment income | (.18) | (.17) | (.09) | (.05) | (.04) |
Distributions from net realized gain | (.07) | - | (.02) | (.02) | - |
Total distributions | (.25) | (.17) | (.11) | (.08) H | (.04) |
Redemption fees added to paid in capital B | - G | - G | .01 | .01 | .01 |
Net asset value, end of period | $ 9.52 | $ 8.75 | $ 8.37 | $ 9.00 | $ 7.28 |
Total Return A | 11.90% | 6.81% | (5.91)% | 24.92% | 54.15% |
Ratios to Average Net Assets C,F | | | | | |
Expenses before reductions | 1.40% | 1.37% | 1.35% | 1.45% | 1.61% |
Expenses net of fee waivers, if any | 1.40% | 1.37% | 1.31% | 1.25% | 1.25% |
Expenses net of all reductions | 1.38% | 1.34% | 1.25% | 1.12% | 1.14% |
Net investment income (loss) | 2.05% | 2.34% | 1.95% E | 1.21% | 1.09% |
Supplemental Data | | | | | |
Net assets, end of period (000 omitted) | $ 110,265 | $ 111,441 | $ 114,117 | $ 140,270 | $ 104,141 |
Portfolio turnover rate D | 64% | 30% | 53% | 96% | 58% |
A Total returns would have been lower if certain expenses had not been reduced during the applicable periods shown.
B Calculated based on average shares outstanding during the period.
C Fees and expenses of any underlying Fidelity Central Funds are not included in the Fund's expense ratio. The Fund indirectly bears its proportionate share of the expenses of any underlying Fidelity Central Funds.
D Amount does not include the portfolio activity of any underlying Fidelity Central Funds.
E Investment income per share reflects a large, non-recurring dividend which amounted to $.04 per share. Excluding this non-recurring dividend, the ratio of net investment income (loss) to average net assets would have been 1.51%.
F Expense ratios reflect operating expenses of the class. Expenses before reductions do not reflect amounts reimbursed by the investment adviser or reductions from brokerage service arrangements or reductions from other expense offset arrangements and do not represent the amount paid by the class during periods when reimbursements or reductions occur. Expenses net of fee waivers reflect expenses after reimbursement by the investment adviser but prior to reductions from brokerage service arrangements or other expense offset arrangements. Expenses net of all reductions represent the net expenses paid by the class.
G Amount represents less than $.01 per share.
H Total distributions of $.08 per share is comprised of distributions from net investment income of $.052 and distributions from net realized gain of $.024 per share.
See accompanying notes which are an integral part of the financial statements.
Annual Report
Financial Highlights - Institutional Class
Years ended October 31, | 2013 | 2012 | 2011 | 2010 | 2009 |
Selected Per-Share Data | | | | | |
Net asset value, beginning of period | $ 8.75 | $ 8.37 | $ 9.00 | $ 7.28 | $ 4.76 |
Income from Investment Operations | | | | | |
Net investment income (loss) B | .19 | .21 | .19 E | .09 | .06 |
Net realized and unrealized gain (loss) | .84 | .35 | (.72) | 1.70 | 2.49 |
Total from investment operations | 1.03 | .56 | (.53) | 1.79 | 2.55 |
Distributions from net investment income | (.19) | (.18) | (.09) | (.05) | (.04) |
Distributions from net realized gain | (.07) | - | (.02) | (.02) | - |
Total distributions | (.26) | (.18) | (.11) | (.08) H | (.04) |
Redemption fees added to paid in capital B | - G | - G | .01 | .01 | .01 |
Net asset value, end of period | $ 9.52 | $ 8.75 | $ 8.37 | $ 9.00 | $ 7.28 |
Total Return A | 12.05% | 6.93% | (5.91)% | 24.95% | 54.15% |
Ratios to Average Net Assets C,F | | | | | |
Expenses before reductions | 1.30% | 1.28% | 1.26% | 1.34% | 1.60% |
Expenses net of fee waivers, if any | 1.30% | 1.28% | 1.24% | 1.25% | 1.25% |
Expenses net of all reductions | 1.28% | 1.25% | 1.19% | 1.13% | 1.14% |
Net investment income (loss) | 2.15% | 2.43% | 2.02% E | 1.20% | 1.09% |
Supplemental Data | | | | | |
Net assets, end of period (000 omitted) | $ 10,231 | $ 8,586 | $ 7,633 | $ 7,171 | $ 4,235 |
Portfolio turnover rate D | 64% | 30% | 53% | 96% | 58% |
A Total returns would have been lower if certain expenses had not been reduced during the applicable periods shown.
B Calculated based on average shares outstanding during the period.
C Fees and expenses of any underlying Fidelity Central Funds are not included in the Fund's expense ratio. The Fund indirectly bears its proportionate share of the expenses of any underlying Fidelity Central Funds.
D Amount does not include the portfolio activity of any underlying Fidelity Central Funds.
E Investment income per share reflects a large, non-recurring dividend which amounted to $.04 per share. Excluding this non-recurring dividend, the ratio of net investment income (loss) to average net assets would have been 1.58%.
F Expense ratios reflect operating expenses of the class. Expenses before reductions do not reflect amounts reimbursed by the investment adviser or reductions from brokerage service arrangements or reductions from other expense offset arrangements and do not represent the amount paid by the class during periods when reimbursements or reductions occur. Expenses net of fee waivers reflect expenses after reimbursement by the investment adviser but prior to reductions from brokerage service arrangements or other expense offset arrangements. Expenses net of all reductions represent the net expenses paid by the class.
G Amount represents less than $.01 per share.
H Total distributions of $.08 per share is comprised of distributions from net investment income of $.054 and distributions from net realized gain of $.024 per share.
See accompanying notes which are an integral part of the financial statements.
Annual Report
Notes to Financial Statements
For the period ended October 31, 2013
1. Organization.
Fidelity Emerging Europe, Middle East, Africa (EMEA) Fund (the Fund) is a fund of Fidelity Investment Trust (the Trust) and is authorized to issue an unlimited number of shares. The Trust is registered under the Investment Company Act of 1940, as amended (the 1940 Act), as an open-end management investment company organized as a Massachusetts business trust. The Fund offers Class A, Class T, Class C, Emerging Europe, Middle East, Africa (EMEA) and Institutional Class shares, each of which, along with Class B shares, has equal rights as to assets and voting privileges. Class B shares are closed to new accounts and additional purchases, except for exchanges and reinvestments. Each class has exclusive voting rights with respect to matters that affect that class. Class B shares will automatically convert to Class A shares after a holding period of seven years from the initial date of purchase. The Fund's investments in emerging markets can be subject to social, economic, regulatory, and political uncertainties and can be extremely volatile.
2. Investments in Fidelity Central Funds.
The Fund invests in Fidelity Central Funds, which are open-end investment companies generally available only to other investment companies and accounts managed by Fidelity Management & Research Company (FMR) and its affiliates. The Fund's Schedule of Investments lists each of the Fidelity Central Funds held as of period end, if any, as an investment of the Fund, but does not include the underlying holdings of each Fidelity Central Fund. As an Investing Fund, the Fund indirectly bears its proportionate share of the expenses of the underlying Fidelity Central Funds.
The Money Market Central Funds seek preservation of capital and current income and are managed by Fidelity Investments Money Management, Inc. (FIMM), an affiliate of FMR.
A complete unaudited list of holdings for each Fidelity Central Fund is available upon request or at the Securities and Exchange Commission (the SEC) website at www.sec.gov. In addition, the financial statements of the Fidelity Central Funds, which are not covered by the Fund's Report of Independent Registered Public Accounting Firm, are available on the SEC website or upon request.
Annual Report
Notes to Financial Statements - continued
3. Significant Accounting Policies.
The financial statements have been prepared in conformity with accounting principles generally accepted in the United States of America (GAAP), which require management to make certain estimates and assumptions at the date of the financial statements. Actual results could differ from those estimates. Subsequent events, if any, through the date that the financial statements were issued have been evaluated in the preparation of the financial statements. The following summarizes the significant accounting policies of the Fund:
Investment Valuation. Investments are valued as of 4:00 p.m. Eastern time on the last calendar day of the period. In accordance with valuation policies and procedures approved by the Board of Trustees (the Board), the Fund attempts to obtain prices from one or more third party pricing vendors or brokers to value its investments. When current market prices, quotations or currency exchange rates are not readily available or reliable, investments will be fair valued in good faith by the FMR Fair Value Committee (the Committee), in accordance with procedures adopted by the Board. Factors used in determining fair value vary by investment type and may include market or investment specific events. The frequency with which these procedures are used cannot be predicted and they may be utilized to a significant extent. The Committee oversees the Fund's valuation policies and procedures and is responsible for approving and reporting to the Board all fair value determinations.
The Fund categorizes the inputs to valuation techniques used to value its investments into a disclosure hierarchy consisting of three levels as shown below:
Level 1 - quoted prices in active markets for identical investments
Level 2 - other significant observable inputs (including quoted prices for similar investments, interest rates, prepayment speeds, etc.)
Level 3 - unobservable inputs (including the Fund's own assumptions based on the best information available)
Valuation techniques used to value the Fund's investments by major category are as follows:
Equity securities, including restricted securities, for which market quotations are readily available, are valued at the last reported sale price or official closing price as reported by a third party pricing vendor on the primary market or exchange on which they are traded and are categorized as Level 1 in the hierarchy. In the event there were no sales during the day or closing prices are not available, securities are valued at the last quoted bid price or may be valued using the last available price and are generally categorized as Level 2 in the hierarchy. For foreign equity securities, when market or security specific
Annual Report
3. Significant Accounting Policies - continued
Investment Valuation - continued
events arise, comparisons to the valuation of American Depositary Receipts (ADRs), futures contracts, Exchange-Traded Funds (ETFs) and certain indexes as well as quoted prices for similar securities may be used and would be categorized as Level 2 in the hierarchy. Utilizing these techniques may result in transfers between Level 1 and Level 2. For equity securities, including restricted securities, where observable inputs are limited, assumptions about market activity and risk are used and these securities may be categorized as Level 3 in the hierarchy.
Investments in open-end mutual funds , including the Fidelity Central Funds, are valued at their closing net asset value (NAV) each business day and are categorized as Level 1 in the hierarchy.
Changes in valuation techniques may result in transfers in or out of an assigned level within the disclosure hierarchy. The aggregate value of investments by input level, as of October 31, 2013, is included at the end of the Fund's Schedule of Investments.
Foreign Currency. The Fund may use foreign currency contracts to facilitate transactions in foreign-denominated securities. Gains and losses from these transactions may arise from changes in the value of the foreign currency or if the counterparties do not perform under the contracts' terms.
Foreign-denominated assets, including investment securities, and liabilities are translated into U.S. dollars at the exchange rates at period end. Purchases and sales of investment securities, income and dividends received and expenses denominated in foreign currencies are translated into U.S. dollars at the exchange rate in effect on the transaction date.
The effects of exchange rate fluctuations on investments are included with the net realized and unrealized gain (loss) on investment securities. Other foreign currency transactions resulting in realized and unrealized gain (loss) are disclosed separately.
Investment Transactions and Income. For financial reporting purposes, the Fund's investment holdings and NAV include trades executed through the end of the last business day of the period. The NAV per share for processing shareholder transactions is calculated as of the close of business of the New York Stock Exchange (NYSE), normally 4:00 p.m. Eastern time and includes trades executed through the end of the prior business day. Gains and losses on securities sold are determined on the basis of identified cost. Dividend income is recorded on the ex-dividend date, except for certain dividends from foreign securities where the ex-dividend date may have passed, which are recorded as soon as the Fund is informed of the ex-dividend date. Non-cash dividends included in dividend income, if any, are recorded at the fair market value of the securities received.
Annual Report
Notes to Financial Statements - continued
3. Significant Accounting Policies - continued
Investment Transactions and Income - continued
Interest income and distributions from the Fidelity Central Funds are accrued as earned. Interest income includes coupon interest and amortization of premium and accretion of discount on debt securities. Investment income is recorded net of foreign taxes withheld where recovery of such taxes is uncertain.
Class Allocations and Expenses. Investment income, realized and unrealized capital gains and losses, common expenses of the Fund, and certain fund-level expense reductions, if any, are allocated daily on a pro-rata basis to each class based on the relative net assets of each class to the total net assets of the Fund. Each class differs with respect to transfer agent and distribution and service plan fees incurred. Certain expense reductions may also differ by class. For the reporting period, the allocated portion of income and expenses to each class as a percent of its average net assets may vary due to the timing of recording these transactions in relation to fluctuating net assets of the classes. Expenses directly attributable to a fund are charged to that fund. Expenses attributable to more than one fund are allocated among the respective funds on the basis of relative net assets or other appropriate methods. Expense estimates are accrued in the period to which they relate and adjustments are made when actual amounts are known.
Income Tax Information and Distributions to Shareholders. Each year, the Fund intends to qualify as a regulated investment company under Subchapter M of the Internal Revenue Code, including distributing substantially all of its taxable income and realized gains. As a result, no provision for U.S. Federal income taxes is required. As of October 31, 2013, the Fund did not have any unrecognized tax benefits in the financial statements; nor is the Fund aware of any tax positions for which it is reasonably possible that the total amounts of unrecognized tax benefits will significantly change in the next twelve months. The Fund files a U.S. federal tax return, in addition to state and local tax returns as required. The Fund's federal income tax returns are subject to examination by the Internal Revenue Service (IRS) for a period of three fiscal years after they are filed. State and local tax returns may be subject to examination for an additional fiscal year depending on the jurisdiction. Foreign taxes are provided for based on the Fund's understanding of the tax rules and rates that exist in the foreign markets in which it invests.
Distributions are declared and recorded on the ex-dividend date. Income dividends and capital gain distributions are declared separately for each class. Income and capital gain distributions are determined in accordance with income tax regulations, which may differ from GAAP. In addition, the Fund claimed a portion of the payment made to redeeming shareholders as a distribution for income tax purposes.
Annual Report
3. Significant Accounting Policies - continued
Income Tax Information and Distributions to Shareholders - continued
Capital accounts within the financial statements are adjusted for permanent book-tax differences. These adjustments have no impact on net assets or the results of operations. Temporary book-tax differences will reverse in a subsequent period.
Book-tax differences are primarily due to foreign currency transactions, passive foreign investment companies (PFIC), capital loss carryforwards and losses deferred due to wash sales.
The federal tax cost of investment securities and unrealized appreciation (depreciation) as of period end were as follows:
Gross unrealized appreciation | $ 25,331,074 |
Gross unrealized depreciation | (12,631,422) |
Net unrealized appreciation (depreciation) on securities and other investments | $ 12,699,652 |
| |
Tax Cost | $ 128,990,502 |
The tax-based components of distributable earnings as of period end were as follows:
Undistributed ordinary income | $ 1,897,738 |
Capital loss carryforward | $ (1,624,705) |
Net unrealized appreciation (depreciation) | $ 12,710,489 |
Capital loss carryforwards are only available to offset future capital gains of the Fund to the extent provided by regulations and may be limited. Under the Regulated Investment Company Modernization Act of 2010 (the Act), the Fund is permitted to carry forward capital losses incurred in taxable years beginning after December 22, 2010 for an unlimited period and such capital losses are required to be used prior to any losses that expire. The capital loss carryforward information presented below, including any applicable limitation, is estimated as of fiscal period end and is subject to adjustment.
Fiscal year of expiration | |
2018 | $ (1,624,705) |
The tax character of distributions paid was as follows:
| October 31, 2013 | October 31, 2012 |
Ordinary Income | $ 3,874,609 | $ 2,782,952 |
Annual Report
Notes to Financial Statements - continued
3. Significant Accounting Policies - continued
Short-Term Trading (Redemption) Fees. Shares held by investors in the Fund less than 90 days may have been subject to a redemption fee equal to 1.50% of the net asset value of shares redeemed. All redemption fees, which reduce the proceeds of the shareholder redemption, are retained by the Fund and accounted for as an addition to paid in capital.
4. Purchases and Sales of Investments.
Purchases and sales of securities, other than short-term securities, aggregated $89,166,804 and $94,656,093, respectively.
5. Fees and Other Transactions with Affiliates.
Management Fee. FMR and its affiliates provide the Fund with investment management related services for which the Fund pays a monthly management fee. The management fee is the sum of an individual fund fee rate that is based on an annual rate of .55% of the Fund's average net assets and an annualized group fee rate that averaged .25% during the period. The group fee rate is based upon the average net assets of all the mutual funds advised by FMR, including any mutual funds previously advised by FMR that are currently advised by Fidelity SelectCo, LLC, an affiliate of FMR. The group fee rate decreases as assets under management increase and increases as assets under management decrease. For the reporting period, the total annual management fee rate was .81% of the Fund's average net assets.
Distribution and Service Plan Fees. In accordance with Rule 12b-1 of the 1940 Act, the Fund has adopted separate Distribution and Service Plans for each class of shares. Certain classes pay Fidelity Distributors Corporation (FDC), an affiliate of FMR, separate Distribution and Service Fees, each of which is based on an annual percentage of each class' average net assets. In addition, FDC may pay financial intermediaries for selling shares of the Fund and providing shareholder support services. For the period, the Distribution and Service Fee rates, total fees and amounts retained by FDC were as follows:
| Distribution
Fee | Service
Fee | Total Fees | Retained
by FDC |
Class A | -% | .25% | $ 24,760 | $ 2,563 |
Class T | .25% | .25% | 16,204 | 44 |
Class B | .75% | .25% | 4,216 | 3,167 |
Class C | .75% | .25% | 68,900 | 7,692 |
| | | $ 114,080 | $ 13,466 |
Annual Report
5. Fees and Other Transactions with Affiliates - continued
Sales Load. FDC may receive a front-end sales charge of up to 5.75% for selling Class A shares and 3.50% for selling Class T shares, some of which is paid to financial intermediaries for selling shares of the Fund. Depending on the holding period, FDC may receive contingent deferred sales charges levied on Class A, Class T, Class B, and Class C redemptions. The deferred sales charges range from 5.00% to 1.00% for Class B shares, 1.00% for Class C shares, 1.00% for certain purchases of Class A shares and .25% for certain purchases of Class T shares.
For the period, sales charge amounts retained by FDC were as follows:
| Retained
by FDC |
Class A | $ 5,196 |
Class T | 1,770 |
Class B* | 1,462 |
Class C* | 1,024 |
| $ 9,452 |
* When Class B and Class C shares are initially sold, FDC pays commissions from its own resources to financial intermediaries through which the sales
are made.
Transfer Agent Fees. Fidelity Investments Institutional Operations Company, Inc., (FIIOC), an affiliate of FMR, is the transfer, dividend disbursing and shareholder servicing agent for each class of the Fund. FIIOC receives account fees and asset-based fees that vary according to the account size and type of account of the shareholders of the respective classes of the Fund. FIIOC pays for typesetting, printing and mailing of shareholder reports, except proxy statements.
For the period, transfer agent fees for each class were as follows:
| Amount | % of
Average
Net Assets |
Class A | $ 26,574 | .27 |
Class T | 10,190 | .31 |
Class B | 1,263 | .30 |
Class C | 20,625 | .30 |
Emerging Europe, Middle East, Africa (EMEA) | 323,311 | .28 |
Institutional Class | 16,491 | .18 |
| $ 398,454 | |
Annual Report
Notes to Financial Statements - continued
5. Fees and Other Transactions with Affiliates - continued
Accounting and Security Lending Fees. Fidelity Service Company, Inc. (FSC), an affiliate of FMR, maintains the Fund's accounting records. The accounting fee is based on the level of average net assets for each month. Under a separate contract, FSC administers the security lending program. The security lending fee is based on the number and duration of lending transactions.
Brokerage Commissions. The Fund placed a portion of its portfolio transactions with brokerage firms which are affiliates of the investment adviser. Brokerage commissions are included in net realized gain (loss) and change in net unrealized appreciation (depreciation) in the Statement of Operations. The commissions paid to these affiliated firms were $17 for the period.
6. Committed Line of Credit.
The Fund participates with other funds managed by FMR or an affiliate in a $4.25 billion credit facility (the "line of credit") to be utilized for temporary or emergency purposes to fund shareholder redemptions or for other short-term liquidity purposes. The Fund has agreed to pay commitment fees on its pro-rata portion of the line of credit, which amounted to $318 and is reflected in Miscellaneous expenses on the Statement of Operations. During the period, there were no borrowings on this line of credit.
7. Security Lending.
The Fund lends portfolio securities through a lending agent from time to time in order to earn additional income. For equity securities, a lending agent is used and may loan securities to certain qualified borrowers, including Fidelity Capital Markets (FCM), a broker-dealer affiliated with the Fund. On the settlement date of the loan, the Fund receives collateral (in the form of U.S. Treasury obligations, letters of credit and/or cash) against the loaned securities and maintains collateral in an amount not less than 100% of the market value of the loaned securities during the period of the loan. The market value of the loaned securities is determined at the close of business of the Fund and any additional required collateral is delivered to the Fund on the next business day. If the borrower defaults on its obligation to return the securities loaned because of insolvency or other reasons, the Fund may apply collateral received from the borrower against the obligation. The Fund may experience delays and costs in recovering the securities loaned. Any cash collateral received is invested in the Fidelity Securities Lending Cash Central Fund. At period end, there were no security loans outstanding. Security lending income represents the income earned on investing cash collateral, less rebates paid to borrowers and any lending agent fees associated with the loan, plus any premium payments received for lending certain types of securities. Security lending income is
Annual Report
7. Security Lending - continued
presented in the Statement of Operations as a component of income from Fidelity Central Funds. Total security lending income during the period amounted to $4,818. During the period, there were no securities loaned to FCM.
8. Expense Reductions.
FMR voluntarily agreed to reimburse each class to the extent annual operating expenses exceeded certain levels of average net assets as noted in the table below. Some expenses, for example interest expense, including commitment fees, are excluded from this reimbursement.
The following classes were in reimbursement during the period:
| Expense
Limitations | Reimbursement |
Class T | 1.90% | $ 1,038 |
Class B | 2.40% | 83 |
Class C | 2.40% | 1,453 |
Emerging Europe, Middle East, Africa (EMEA) | 1.40% | 2,450 |
| | $ 5,024 |
Commissions paid to certain brokers with whom FMR, or its affiliates, places trades on behalf of the Fund include an amount in addition to trade execution, which may be rebated back to the Fund to offset certain expenses. This amount totaled $26,766 for the period.
In addition, FMR reimbursed a portion of the Fund's operating expenses during the period in the amount of $3,800.
9. Distributions to Shareholders.
Distributions to shareholders of each class were as follows:
Years ended October 31, | 2013 | 2012 |
From net investment income | | |
Class A | $ 155,525 | $ 173,376 |
Class T | 46,756 | 52,030 |
Class B | 2,757 | 3,592 |
Class C | 69,716 | 61,819 |
Emerging Europe, Middle East, Africa (EMEA) | 2,222,632 | 2,310,485 |
Institutional Class | 192,599 | 181,650 |
Total | $ 2,689,985 | $ 2,782,952 |
Annual Report
Notes to Financial Statements - continued
9. Distributions to Shareholders - continued
Years ended October 31, | 2013 | 2012 |
From net realized gain | | |
Class A | $ 76,218 | $ - |
Class T | 28,360 | - |
Class B | 3,579 | - |
Class C | 66,141 | - |
Emerging Europe, Middle East, Africa (EMEA) | 934,516 | - |
Institutional Class | 75,810 | - |
Total | $ 1,184,624 | $ - |
10. Share Transactions.
Transactions for each class of shares were as follows:
| Shares | Dollars |
Years ended October 31, | 2013 | 2012 | 2013 | 2012 |
Class A | | | | |
Shares sold | 422,392 | 188,687 | $ 3,786,551 | $ 1,610,923 |
Reinvestment of distributions | 20,821 | 16,919 | 182,599 | 134,509 |
Shares redeemed | (321,728) | (411,198) | (2,828,311) | (3,440,999) |
Net increase (decrease) | 121,485 | (205,592) | $ 1,140,839 | $ (1,695,567) |
Class T | | | | |
Shares sold | 88,958 | 75,037 | $ 793,473 | $ 636,446 |
Reinvestment of distributions | 8,485 | 6,513 | 74,325 | 51,713 |
Shares redeemed | (115,399) | (118,919) | (1,019,893) | (995,876) |
Net increase (decrease) | (17,956) | (37,369) | $ (152,095) | $ (307,717) |
Class B | | | | |
Shares sold | 10,659 | 2,520 | $ 95,440 | $ 21,721 |
Reinvestment of distributions | 679 | 430 | 5,999 | 3,432 |
Shares redeemed | (21,228) | (17,241) | (189,688) | (147,235) |
Net increase (decrease) | (9,890) | (14,291) | $ (88,249) | $ (122,082) |
Class C | | | | |
Shares sold | 249,509 | 337,293 | $ 2,176,685 | $ 2,767,333 |
Reinvestment of distributions | 12,615 | 7,082 | 110,128 | 56,016 |
Shares redeemed | (441,523) | (250,062) | (3,878,247) | (2,064,165) |
Net increase (decrease) | (179,399) | 94,313 | $ (1,591,434) | $ 759,184 |
Emerging Europe, Middle East, Africa (EMEA) | | | | |
Shares sold | 4,724,612 | 3,688,393 | $ 42,683,733 | $ 31,635,971 |
Reinvestment of distributions | 341,639 | 276,215 | 2,999,595 | 2,198,675 |
Shares redeemed | (6,228,497) | (4,854,267) | (55,025,066) | (40,803,317) |
Net increase (decrease) | (1,162,246) | (889,659) | $ (9,341,738) | $ (6,968,671) |
Annual Report
10. Share Transactions - continued
| Shares | Dollars |
Years ended October 31, | 2013 | 2012 | 2013 | 2012 |
Institutional Class | | | | |
Shares sold | 478,817 | 336,442 | $ 4,308,546 | $ 2,842,158 |
Reinvestment of distributions | 10,415 | 5,723 | 91,338 | 45,553 |
Shares redeemed | (396,145) | (272,120) | (3,464,870) | (2,242,112) |
Net increase (decrease) | 93,087 | 70,045 | $ 935,014 | $ 645,599 |
11. Other.
The Fund's organizational documents provide former and current trustees and officers with a limited indemnification against liabilities arising in connection with the performance of their duties to the Fund. In the normal course of business, the Fund may also enter into contracts that provide general indemnifications. The Fund's maximum exposure under these arrangements is unknown as this would be dependent on future claims that may be made against the Fund. The risk of material loss from such claims is considered remote.
Annual Report
To the Trustees of Fidelity Investment Trust and Shareholders of Fidelity Emerging Europe, Middle East, Africa (EMEA) Fund:
We have audited the accompanying statement of assets and liabilities of Fidelity Emerging Europe, Middle East, Africa (EMEA) Fund (the Fund), a fund of Fidelity Investment Trust, including the schedule of investments, as of October 31, 2013, and the related statement of operations for the year then ended, the statement of changes in net assets for each of the two years in the period then ended, and the financial highlights for each of the five years in the period then ended. These financial statements and financial highlights are the responsibility of the Fund's management. Our responsibility is to express an opinion on these financial statements and financial highlights based on our audits.
We conducted our audits in accordance with the standards of the Public Company Accounting Oversight Board (United States). Those standards require that we plan and perform the audit to obtain reasonable assurance about whether the financial statements and financial highlights are free of material misstatement. The Fund is not required to have, nor were we engaged to perform, an audit of its internal control over financial reporting. Our audits included consideration of internal control over financial reporting as a basis for designing audit procedures that are appropriate in the circumstances, but not for the purpose of expressing an opinion on the effectiveness of the Fund's internal control over financial reporting. Accordingly, we express no such opinion. An audit also includes examining, on a test basis, evidence supporting the amounts and disclosures in the financial statements, assessing the accounting principles used and significant estimates made by management, as well as evaluating the overall financial statement presentation. Our procedures included confirmation of securities owned as of October 31, 2013, by correspondence with the custodians and brokers; where replies were not received from brokers, we performed other auditing procedures. We believe that our audits provide a reasonable basis for our opinion.
In our opinion, the financial statements and financial highlights referred to above present fairly, in all material respects, the financial position of Fidelity Emerging Europe, Middle East, Africa (EMEA) Fund as of October 31, 2013, the results of its operations for the year then ended, the changes in its net assets for each of the two years in the period then ended, and the financial highlights for each of the five years in the period then ended, in conformity with accounting principles generally accepted in the United States of America.
DELOITTE & TOUCHE LLP
Boston, Massachusetts
December 13, 2013
Annual Report
The Trustees, Member of the Advisory Board, and executive officers of the trust and fund, as applicable, are listed below. The Board of Trustees governs the fund and is responsible for protecting the interests of shareholders. The Trustees are experienced executives who meet periodically throughout the year to oversee the fund's activities, review contractual arrangements with companies that provide services to the fund, oversee management of the risks associated with such activities and contractual arrangements, and review the fund's performance. Except for James C. Curvey, Ned C. Lautenbach, Ronald P. O'Hanley, and William S. Stavropoulos, each of the Trustees oversees 171 funds. Mr. Curvey oversees 394 funds. Mr. Lautenbach, Mr. O'Hanley, and Mr. Stavropoulos each oversees 245 funds.
The Trustees hold office without limit in time except that (a) any Trustee may resign; (b) any Trustee may be removed by written instrument, signed by at least two-thirds of the number of Trustees prior to such removal; (c) any Trustee who requests to be retired or who has become incapacitated by illness or injury may be retired by written instrument signed by a majority of the other Trustees; and (d) any Trustee may be removed at any special meeting of shareholders by a two-thirds vote of the outstanding voting securities of the trust. Each Trustee who is not an interested person of the trust and the fund (as defined in the 1940 Act) (Independent Trustee), shall retire not later than the last day of the calendar year in which his or her 75th birthday occurs. The Independent Trustees may waive this mandatory retirement age policy with respect to individual Trustees. The executive officers and Advisory Board Member hold office without limit in time, except that any officer and Advisory Board Member may resign or may be removed by a vote of a majority of the Trustees at any regular meeting or any special meeting of the Trustees. Except as indicated, each individual has held the office shown or other offices in the same company for the past five years.
Experience, Skills, Attributes, and Qualifications of the Fund's Trustees. The Governance and Nominating Committee has adopted a statement of policy that describes the experience, qualifications, attributes, and skills that are necessary and desirable for potential Independent Trustee candidates (Statement of Policy). The Board believes that each Trustee satisfied at the time he or she was initially elected or appointed a Trustee, and continues to satisfy, the standards contemplated by the Statement of Policy. The Governance and Nominating Committee also engages professional search firms to help identify potential Independent Trustee candidates who have the experience, qualifications, attributes, and skills consistent with the Statement of Policy. From time to time, additional criteria based on the composition and skills of the current Independent Trustees, as well as experience or skills that may be appropriate in light of future changes to board composition, business conditions, and regulatory or other developments, have also been considered by the professional search firms and the Governance and Nominating Committee. In addition, the Board takes into account the Trustees' commitment and participation in Board and committee meetings, as well as their leadership of standing and ad hoc committees throughout their tenure.
Annual Report
Trustees and Officers - continued
In determining that a particular Trustee was and continues to be qualified to serve as a Trustee, the Board has considered a variety of criteria, none of which, in isolation, was controlling. The Board believes that, collectively, the Trustees have balanced and diverse experience, qualifications, attributes, and skills, which allow the Board to operate effectively in governing the fund and protecting the interests of shareholders. Information about the specific experience, skills, attributes, and qualifications of each Trustee, which in each case led to the Board's conclusion that the Trustee should serve (or continue to serve) as a trustee of the fund, is provided below.
Board Structure and Oversight Function. James C. Curvey is an interested person (as defined in the 1940 Act) and currently serves as Chairman. The Trustees have determined that an interested Chairman is appropriate and benefits shareholders because an interested Chairman has a personal and professional stake in the quality and continuity of services provided to the fund. Independent Trustees exercise their informed business judgment to appoint an individual of their choosing to serve as Chairman, regardless of whether the Trustee happens to be independent or a member of management. The Independent Trustees have determined that they can act independently and effectively without having an Independent Trustee serve as Chairman and that a key structural component for assuring that they are in a position to do so is for the Independent Trustees to constitute a substantial majority for the Board. The Independent Trustees also regularly meet in executive session. Ned C. Lautenbach serves as Chairman of the Independent Trustees and as such (i) acts as a liaison between the Independent Trustees and management with respect to matters important to the Independent Trustees and (ii) with management prepares agendas for Board meetings.
Fidelity funds are overseen by different Boards of Trustees. The fund's Board oversees Fidelity's equity and high income funds and another Board oversees Fidelity's investment-grade bond, money market, and asset allocation funds. The asset allocation funds may invest in Fidelity funds overseen by the fund's Board. The use of separate Boards, each with its own committee structure, allows the Trustees of each group of Fidelity funds to focus on the unique issues of the funds they oversee, including common research, investment, and operational issues. On occasion, the separate Boards establish joint committees to address issues of overlapping consequences for the Fidelity funds overseen by each Board.
The Trustees operate using a system of committees to facilitate the timely and efficient consideration of all matters of importance to the Trustees, the fund, and fund shareholders and to facilitate compliance with legal and regulatory requirements and oversight of the fund's activities and associated risks. The Board, acting through its committees, has charged FMR and its affiliates with (i) identifying events or circumstances the occurrence of which could have demonstrably adverse effects on the fund's business and/or reputation; (ii) implementing processes and controls to lessen the possibility that such events or circumstances occur or to mitigate the effects of such events or circumstances if they do occur; and (iii) creating and maintaining a system designed to evaluate continuously business and market conditions in order to facilitate the identification and implementation processes described in (i) and (ii) above. Because the day-to-day operations and activities of the fund are carried out by or through FMR, its affiliates and other service providers, the fund's exposure to risks is mitigated but not eliminated by the processes overseen by the Trustees. While each of the Board's committees has responsibility for overseeing different aspects of the fund's activities, oversight is exercised primarily through the Operations, Audit, and Compliance Committees. In addition, the Independent Trustees have worked with FMR to enhance the Board's oversight of investment and financial risks, legal and regulatory risks, technology risks, and operational risks, including the development of additional risk reporting to the Board. For example, a working group comprised of Independent Trustees and FMR has worked and continues to work to review the Fidelity funds' valuation-related activities, reporting and risk management. Appropriate personnel, including but not limited to the fund's Chief Compliance Officer (CCO), FMR's internal auditor, the independent accountants, the fund's Treasurer and portfolio management personnel, make periodic reports to the Board's committees, as appropriate, including an annual review of FMR's risk management program for the Fidelity funds. The responsibilities of each standing committee, including their oversight responsibilities, are described further under "Standing Committees of the Fund's Trustees."
Annual Report
The fund's Statement of Additional Information (SAI) includes more information about the Trustees. To request a free copy, call Fidelity at 1-877-208-0098.
Interested Trustees*:
Correspondence intended for each Trustee who is an interested person may be sent to Fidelity Investments, 245 Summer Street, Boston, Massachusetts 02210.
Name, Year of Birth; Principal Occupations and Other Relevant Experience+ |
James C. Curvey (1935) |
Year of Election or Appointment: 2007 Trustee Chairman of the Board of Trustees |
| Mr. Curvey also serves as Trustee of other Fidelity funds. Mr. Curvey is a Director of Fidelity Investments Money Management, Inc. (2009-present), Director of Fidelity Research & Analysis Co. (2009-present) and Director of FMR and FMR Co., Inc. (2007-present). Mr. Curvey is also Vice Chairman (2007-present) and Director of FMR LLC. In addition, Mr. Curvey serves as an Overseer for the Boston Symphony Orchestra and a member of the Trustees of Villanova University. Previously, Mr. Curvey was the Vice Chairman (2006-2007) and Director (2000-2007) of FMR Corp. |
Ronald P. O'Hanley (1957) |
Year of Election or Appointment: 2011 Trustee |
| Mr. O'Hanley also serves as Trustee of other Fidelity funds. He is Director of Fidelity SelectCo, LLC (2013-present), FMR Co., Inc. (2010-present), Director of Fidelity Investments Money Management, Inc. (2010-present), Director of Fidelity Research & Analysis Company (2010-present), President of Fidelity Asset Management and Corporate Services and a Member of Fidelity's Executive Committee (2010-present). Previously, Mr. O'Hanley served as President and Chief Executive Officer of BNY Mellon Asset Management (2007-2010). Mr. O'Hanley also served as Vice Chairman of Bank New York Mellon Corp. and a member of that firm's Executive Committee. Prior to the 2007 merger of The Bank of New York and Mellon Financial Corporation, he was Vice Chairman of Mellon Financial Corporation and President and Chief Executive Officer of Mellon Asset Management. He joined Mellon in February 1997. Mr. O'Hanley currently serves as Chairman of the Boston Public Library Foundation Board of Directors and sits on the Board of Directors of Beth Israel Deaconess Medical Center, the Board of Trustees of the Marine Biological Laboratory and the Advisory Board of the Maxwell School of Citizenship and Public Administration at Syracuse University. Mr. O'Hanley also chairs the Council on Asset Management for the Financial Services Roundtable and is a member of the Board of Directors of Institutional Investor's U.S. Institute. |
* Trustees have been determined to be "Interested Trustees" by virtue of, among other things, their affiliation with the trust or various entities under common control with FMR.
+ The information above includes each Trustee's principal occupation during the last five years and other information relating to the experience, attributes, and skills relevant to each Trustee's qualifications to serve as a Trustee, which led to the conclusion that each Trustee should serve as a Trustee for the fund.
Annual Report
Independent Trustees:
Correspondence intended for each Independent Trustee (that is, the Trustees other than the Interested Trustees) may be sent to Fidelity Investments, P.O. Box 55235, Boston, Massachusetts 02205-5235.
Name, Year of Birth; Principal Occupations and Other Relevant Experience+ |
Dennis J. Dirks (1948) |
Year of Election or Appointment: 2005 Trustee |
| Mr. Dirks also serves as Trustee of other Fidelity funds. Prior to his retirement in May 2003, Mr. Dirks was Chief Operating Officer and a member of the Board of The Depository Trust & Clearing Corporation (DTCC). He also served as President, Chief Operating Officer, and Board member of The Depository Trust Company (DTC) and President and Board member of the National Securities Clearing Corporation (NSCC). In addition, Mr. Dirks served as Chief Executive Officer and Board member of the Government Securities Clearing Corporation, Chief Executive Officer and Board member of the Mortgage-Backed Securities Clearing Corporation, as a Trustee and a member of the Finance Committee of Manhattan College (2005-2008), and as a Trustee and a member of the Finance Committee of AHRC of Nassau County (2006-2008). Mr. Dirks is a member of the Independent Directors Council (IDC) Governing Council (2010-present) and Board of Directors for The Brookville Center for Children's Services, Inc. (2009-present). |
Alan J. Lacy (1953) |
Year of Election or Appointment: 2008 Trustee |
| Mr. Lacy also serves as Trustee of other Fidelity funds. Mr. Lacy serves as Senior Adviser (2007-present) of Oak Hill Capital Partners, L.P. (private equity). Mr. Lacy also served as Chief Executive Officer (2000-2005) and Vice Chairman (2005-2006) of Sears Holdings Corporation and Sears, Roebuck and Co. (retail). In addition, Mr. Lacy serves as a member of the Board of Directors of Dave & Buster's Entertainment, Inc. (restaurant and entertainment complexes, 2010-present), Earth Fare, Inc. (retail grocery, 2012-present), The Hillman Companies, Inc. (hardware wholesalers, 2010-present), and Bristol-Myers Squibb Company (global pharmaceuticals, 2008-present). Mr. Lacy is a member of the Board of Trustees of The National Parks Conservation Association (2006-present). Previously, Mr. Lacy served as Chairman of the Board of Trustees of the National Parks Conservation Association (2008-2011) and as a member of the Board of Directors for the Western Union Company (global money transfer, 2006-2011). |
Ned C. Lautenbach (1944) |
Year of Election or Appointment: 2000 Trustee Chairman of the Independent Trustees |
| Mr. Lautenbach also serves as Trustee of other Fidelity funds. Mr. Lautenbach currently serves as the Lead Director of the Eaton Corporation Board of Directors (diversified industrial, 1997-present). Mr. Lautenbach is Chairman of the Board of Directors of the Philharmonic Center for the Arts in Naples, Florida (2012-present) and a member of the Council on Foreign Relations (1994-present). Previously, Mr. Lautenbach was a Partner/Advisory Partner at Clayton, Dubilier & Rice, LLC (private equity investment, 1998-2010), as well as a Director of Sony Corporation (2006-2007). |
Joseph Mauriello (1944) |
Year of Election or Appointment: 2008 Trustee |
| Mr. Mauriello also serves as Trustee of other Fidelity funds. Prior to his retirement in January 2006, Mr. Mauriello served in numerous senior management positions including Deputy Chairman and Chief Operating Officer (2004-2005), and Vice Chairman of Financial Services (2002-2004) of KPMG LLP US (professional services, 1965-2005). Mr. Mauriello currently serves as a member of the Board of Directors of XL Group plc. (global insurance and re-insurance, 2006-present). Previously, Mr. Mauriello served as a Director of the Hamilton Funds of the Bank of New York (2006-2007) and of Arcadia Resources Inc. (health care services and products, 2007-2012). |
Robert W. Selander (1950) |
Year of Election or Appointment: 2011 Trustee |
| Mr. Selander also serves as Trustee of other Fidelity funds. Previously, Mr. Selander served as a Member of the Advisory Board of other Fidelity funds (2011), and Executive Vice Chairman (2010), Chief Executive Officer (2009-2010), and President and Chief Executive Officer (1997-2009) of Mastercard, Inc. |
Cornelia M. Small (1944) |
Year of Election or Appointment: 2005 Trustee |
| Ms. Small also serves as Trustee of other Fidelity funds. Ms. Small is a member of the Board of Directors (2009-present) and Chair of the Investment Committee (2010-present) of the Teagle Foundation. Ms. Small also serves on the Investment Committee of the Berkshire Taconic Community Foundation (2008-present). Previously, Ms. Small served as Chairperson (2002-2008) and a member of the Investment Committee and Chairperson (2008-2012) and a member of the Board of Trustees of Smith College. In addition, Ms. Small served as Chief Investment Officer, Director of Global Equity Investments, and a member of the Board of Directors of Scudder, Stevens & Clark and Scudder Kemper Investments. |
William S. Stavropoulos (1939) |
Year of Election or Appointment: 2001 Trustee Vice Chairman of the Independent Trustees |
| Mr. Stavropoulos also serves as Trustee of other Fidelity funds. Mr. Stavropoulos serves as President and Founder of the Michigan Baseball Foundation, the Great Lakes Loons (2007-present). Mr. Stavropoulos is Chairman Emeritus of the Board of Directors of The Dow Chemical Company, where he previously served in numerous senior management positions, including President, CEO (1995-2000; 2002-2004), Chairman of the Executive Committee (2000-2006), and as a member of the Board of Directors (1990-2006). Currently, Mr. Stavropoulos is Chairman of the Board of Directors of Univar Inc. (global distributor of commodity and specialty chemicals), a Director of Teradata Corporation (data warehousing and technology solutions), and Maersk Inc. (industrial conglomerate), and a member of the Advisory Board for Metalmark Capital LLC (private equity investment, 2005-present). Mr. Stavropoulos is an operating advisor to Clayton, Dubilier & Rice, LLC (private equity investment). In addition, Mr. Stavropoulos is a member of the University of Notre Dame Advisory Council for the College of Science, a Trustee of the Rollin L. Gerstacker Foundation, and a Director of the Naples Philharmonic Center for the Arts. Previously, Mr. Stavropoulos served as a Director of Chemical Financial Corporation (bank holding company, 1993-2012) and Tyco International, Ltd. (multinational manufacturing and services, 2007-2012). |
David M. Thomas (1949) |
Year of Election or Appointment: 2008 Trustee |
| Mr. Thomas also serves as Trustee of other Fidelity funds. Mr. Thomas serves as Non-Executive Chairman of the Board of Directors of Fortune Brands Home and Security (home and security products, 2011-present), and as a member of the Board of Directors of Interpublic Group of Companies, Inc. (marketing communication, 2004-present). Previously, Mr. Thomas served as Executive Chairman (2005-2006) and Chairman and Chief Executive Officer (2000-2005) of IMS Health, Inc. (pharmaceutical and healthcare information solutions), and a Director of Fortune Brands, Inc. (consumer products, 2000-2011). |
+ The information above includes each Trustee's principal occupation during the last five years and other information relating to the experience, attributes, and skills relevant to each Trustee's qualifications to serve as a Trustee, which led to the conclusion that each Trustee should serve as a Trustee for the fund.
Advisory Board Member and Executive Officers:
Correspondence intended for each executive officer and Peter S. Lynch may be sent to Fidelity Investments, 245 Summer Street, Boston, Massachusetts 02210. Executive officers appear below in alphabetical order.
Name, Year of Birth; Principal Occupation |
Peter S. Lynch (1944) |
Year of Election or Appointment: 2003 Member of the Advisory Board |
| Mr. Lynch also serves as Member of the Advisory Board of other Fidelity funds. Mr. Lynch is Vice Chairman and a Director of FMR and FMR Co., Inc. In addition, Mr. Lynch serves as a Trustee of Boston College and as the Chairman of the Inner-City Scholarship Fund. Previously, Mr. Lynch served on the Special Olympics International Board of Directors (1997-2006). |
Elizabeth Paige Baumann (1968) |
Year of Election or Appointment: 2012 Anti-Money Laundering (AML) Officer |
| Ms. Baumann also serves as AML Officer of other funds. She is Chief AML Officer of FMR LLC (2012-present) and is an employee of Fidelity Investments. Previously, Ms. Baumann served as Vice President and Deputy Anti-Money Laundering Officer (2007-2012). |
William C. Coffey (1969) |
Year of Election or Appointment: 2009 Assistant Secretary |
| Mr. Coffey also serves as Assistant Secretary of other funds. He is Senior Vice President and Deputy General Counsel of FMR LLC (2010-present), and is an employee of Fidelity Investments. Previously, Mr. Coffey served as Vice President and Associate General Counsel of FMR LLC (2005-2009). |
Jonathan Davis (1968) |
Year of Election or Appointment: 2010 Assistant Treasurer |
| Mr. Davis also serves as Assistant Treasurer of other funds. Mr. Davis is an employee of Fidelity Investments. Previously, Mr. Davis served as Vice President and Associate General Counsel of FMR LLC (2003-2010). |
Adrien E. Deberghes (1967) |
Year of Election or Appointment: 2008 Deputy Treasurer |
| Mr. Deberghes also serves as an officer of other funds. He is an employee of Fidelity Investments (2008-present). Prior to joining Fidelity Investments, Mr. Deberghes was Senior Vice President of Mutual Fund Administration at State Street Corporation (2007-2008), Senior Director of Mutual Fund Administration at Investors Bank & Trust (2005-2007), and Director of Finance for Dunkin' Brands (2000-2005). |
Stephanie J. Dorsey (1969) |
Year of Election or Appointment: 2010 Assistant Treasurer |
| Ms. Dorsey also serves as an officer of other funds. She is an employee of Fidelity Investments (2008-present) and has served in other fund officer roles. Prior to joining Fidelity Investments, Ms. Dorsey served as Treasurer (2004-2008) of the JPMorgan Mutual Funds and Vice President (2004-2008) of JPMorgan Chase Bank. |
Scott C. Goebel (1968) |
Year of Election or Appointment: 2008 Secretary and Chief Legal Officer (CLO) |
| Mr. Goebel serves as Secretary and CLO of other funds. Mr. Goebel also serves as Secretary of Fidelity Investments Money Management, Inc. (FIMM) (2010-present) and Fidelity Research and Analysis Company (FRAC) (2010-present); General Counsel, Secretary, and Senior Vice President of FMR (2008-present) and FMR Co., Inc. (2008-present); Chief Legal Officer of Fidelity Management & Research (Hong Kong) Limited (2008-present) and Assistant Secretary of Fidelity Management & Research (Japan) Inc. (2008-present), and Fidelity Management & Research (U.K.) Inc. (2008-present). Previously, Mr. Goebel served as Secretary and CLO of other Fidelity funds (2008-2013), Assistant Secretary of FIMM (2008-2010), FRAC (2008-2010), and certain funds (2007-2008); and as Vice President and Secretary of Fidelity Distributors Corporation (FDC) (2005-2007). Mr. Goebel has been employed by FMR LLC or an affiliate since 2001. |
Joseph A. Hanlon (1968) |
Year of Election or Appointment: 2012 Chief Compliance Officer |
| Mr. Hanlon also serves as Chief Compliance Officer of other funds. Mr. Hanlon serves as Compliance Officer of FMR, FMR Co., Inc., Fidelity Investments Money Management, Inc. (FIMM), Fidelity Research and Analysis Company (FRAC), and Fidelity Management & Research (Hong Kong) (2009-present), as Senior Vice President of the Fidelity Asset Management Division (2009-present), and is an employee of Fidelity Investments. Previously, Mr. Hanlon served as Compliance Officer of Fidelity Management & Research (Japan) Inc. (2009-2013), Strategic Advisers, Inc. (2009-2013), and Fidelity Management & Research (U.K.) Inc. (2009-2013). |
Bruce T. Herring (1965) |
Year of Election or Appointment: 2006 Vice President of certain Equity Funds |
| Mr. Herring also serves as Vice President of other funds. He serves as Chief Investment Officer of Fidelity Global Asset Allocation (GAA) (2013-present), Chief Investment Officer and Director of Fidelity Management & Research (U.K.) Inc. (2010-present), Group Chief Investment Officer of FMR, and President of Fidelity Research & Analysis Company (2010-present). Previously, Mr. Herring served as Vice President (2005-2006) and Senior Vice President (2006-2007) of Fidelity Management & Research Company, Vice President of FMR Co., Inc. (2001-2007), and as a portfolio manager for Fidelity U.S. Equity Funds. |
Brian B. Hogan (1964) |
Year of Election or Appointment: 2009 Vice President |
| Mr. Hogan also serves as Vice President of other funds. Mr. Hogan serves as President of FMR's Equity Division (2009-present). Previously, Mr. Hogan served as Senior Vice President, Equity Research of FMR (2006-2009) and as a portfolio manager. |
Chris Maher (1972) |
Year of Election or Appointment: 2013 Assistant Treasurer |
| Mr. Maher serves as Assistant Treasurer of other funds. Mr. Maher is Vice President of Valuation Oversight and is an employee of Fidelity Investments. Previously, Mr. Maher served as Vice President of Asset Management Compliance (2013), Vice President of FMR's Program Management Group (2010-2013), and Vice President of Valuation Oversight (2008-2010). |
Christine Reynolds (1958) |
Year of Election or Appointment: 2008 Chief Financial Officer |
| Ms. Reynolds also serves as Chief Financial Officer of other funds. Ms. Reynolds became President of Fidelity Pricing and Cash Management Services (FPCMS) in August 2008. Ms. Reynolds served as Chief Operating Officer of FPCMS (2007-2008). Previously, Ms. Reynolds served as President, Treasurer, and Anti-Money Laundering officer of the Fidelity funds (2004-2007). |
Kenneth B. Robins (1969) |
Year of Election or Appointment: 2008 President and Treasurer |
| Mr. Robins also serves as an officer of other funds. Mr. Robins serves as Executive Vice President of Fidelity Investments Money Management, Inc. (FIMM) (2013-present) and is an employee of Fidelity Investments (2004-present). Previously, Mr. Robins served in other fund officer roles. |
Gary W. Ryan (1958) |
Year of Election or Appointment: 2005 Assistant Treasurer |
| Mr. Ryan also serves as Assistant Treasurer of other funds. Mr. Ryan is an employee of Fidelity Investments and has served in other fund officer roles. Previously, Mr. Ryan served as Vice President of Fund Reporting in Fidelity Pricing and Cash Management Services (FPCMS) (1999-2005). |
Stephen Sadoski (1971) |
Year of Election or Appointment: 2012 Deputy Treasurer |
| Mr. Sadoski also serves as Deputy Treasurer of other funds. He is an employee of Fidelity Investments (2012-present) and has served in another fund officer role. Prior to joining Fidelity Investments, Mr. Sadoski served as an assistant chief accountant in the Division of Investment Management of the Securities and Exchange Commission (SEC) (2009-2012) and as a senior manager at Deloitte & Touche LLP (1997-2009). |
Stacie M. Smith (1974) |
Year of Election or Appointment: 2013 Deputy Treasurer |
| Ms. Smith also serves as an officer of other funds. She is an employee of Fidelity Investments (2009-present) and has served in other fund officer roles. Prior to joining Fidelity Investments, Ms. Smith served as Senior Audit Manager of Ernst & Young LLP (1996-2009). |
Renee Stagnone (1975) |
Year of Election or Appointment: 2013 Deputy Treasurer |
| Ms. Stagnone also serves as Deputy Treasurer of other funds. Ms. Stagnone is an employee of Fidelity Investments. |
Joseph F. Zambello (1957) |
Year of Election or Appointment: 2011 Deputy Treasurer |
| Mr. Zambello also serves as Deputy Treasurer of other funds. Mr. Zambello is an employee of Fidelity Investments. Previously, Mr. Zambello served as Vice President of FMR's Program Management Group (2009-2011) and Vice President of the Transfer Agent Oversight Group (2005-2009). |
Annual Report
Class A, T, B and C designate 100% of the dividend distributed during the fiscal year, as amounts which may be taken into account as a dividend for purposes of the maximum rate under section 1(h)(11) of the Internal Revenue Code.
The amounts per share which represent income derived from sources within, and taxes paid to, foreign countries or possessions of the United States are as follows:
| Pay Date | Income | Taxes |
Class A | 12/10/12 | $0.134 | $0.0352 |
Class T | 12/10/12 | $0.119 | $0.0352 |
Class B | 12/10/12 | $0.086 | $0.0352 |
Class C | 12/10/12 | $0.097 | $0.0352 |
The fund will notify shareholders in January 2014 of amounts for use in preparing 2013 income tax returns.
Annual Report
Board Approval of Investment Advisory Contracts and Management Fees
Fidelity Emerging Europe, Middle East, Africa (EMEA) Fund
Each year, the Board of Trustees, including the Independent Trustees (together, the Board), votes on the renewal of the management contract and sub-advisory agreements (together, the Advisory Contracts) for the fund. The Board, assisted by the advice of fund counsel and Independent Trustees' counsel, requests and considers a broad range of information relevant to the renewal of the Advisory Contracts throughout the year.
The Board meets regularly and, at each of its meetings, covers an extensive agenda of topics and materials and considers factors that are relevant to its annual consideration of the renewal of the fund's Advisory Contracts, including the services and support provided to the fund and its shareholders. The Board has established various standing committees, each composed of and chaired by Independent Trustees with varying backgrounds, to which the Board has assigned specific subject matter responsibilities in order to enhance effective decision-making by the Board. The Board, acting directly and through its Committees, requests and receives information concerning the annual consideration of the renewal of the fund's Advisory Contracts. The Board also meets as needed to consider matters specifically related to the Board's annual consideration of the renewal of Advisory Contracts. Members of the Board may also meet with trustees of other Fidelity funds through ad hoc joint committees to discuss certain matters relevant to the Fidelity funds.
At its July 2013 meeting, the Board, including the Independent Trustees, unanimously determined to renew the fund's Advisory Contracts. In reaching its determination, the Board considered all factors it believed relevant, including (i) the nature, extent, and quality of the services to be provided to the fund and its shareholders (including the investment performance of the fund); (ii) the competitiveness of the fund's management fee and total expense ratio relative to peer funds; (iii) the total costs of the services to be provided by and the profits to be realized by Fidelity from its relationship with the fund; (iv) the extent to which economies of scale exist and would be realized as the fund grows; and (v) whether fee levels reflect these economies of scale, if any, for the benefit of fund shareholders.
In considering whether to renew the Advisory Contracts for the fund, the Board reached a determination, with the assistance of fund counsel and Independent Trustees' counsel and through the exercise of its business judgment, that the renewal of the Advisory Contracts was in the best interests of the fund and its shareholders and that the compensation payable under the Advisory Contracts was fair and reasonable. The Board's decision to renew the Advisory Contracts was not based on any single factor, but rather was based on a comprehensive consideration of all the information provided to the Board at its meetings throughout the year. The Board, in reaching its determination to renew the Advisory Contracts, was aware that shareholders in the fund have a broad range of investment choices available to them, including a wide choice among mutual funds offered by Fidelity's competitors, and that the fund's shareholders, who have the opportunity to review and weigh the disclosure provided by the fund in its prospectus and other public disclosures, have chosen to invest in this fund, which is a part of the Fidelity family of funds.
Annual Report
Nature, Extent, and Quality of Services Provided. The Board considered the staffing within the investment adviser, Fidelity Management & Research Company (FMR), and the sub-advisers (together, the Investment Advisers) as it relates to the fund, including the backgrounds of the fund's investment personnel, and also considered the fund's investment objective, strategies, and related investment philosophy. The Independent Trustees also had discussions with senior management of Fidelity's investment operations and investment groups. The Board considered the structure of the portfolio manager compensation program and whether this structure provides appropriate incentives to act in the best interests of the fund.
Resources Dedicated to Investment Management and Support Services. The Board and the Fund Oversight and Research Committees reviewed the general qualifications and capabilities of the Investment Advisers' investment staff, including its size, education, experience, and resources, as well as the Investment Advisers' approach to recruiting, training, managing, and compensating investment personnel. The Board noted that FMR has continued to increase the resources devoted to non-U.S. offices, including expansion of Fidelity's global investment organization. The Board also noted that Fidelity's analysts have extensive resources, tools and capabilities that allow them to conduct sophisticated quantitative and fundamental analysis, as well as credit analysis of issuers, counterparties and guarantors. Further, the Board believes that Fidelity's investment professionals have sufficient access to global information and data so as to provide competitive investment results over time, and that those professionals also have access to sophisticated tools that permit them to assess portfolio construction and risk and performance attribution characteristics continuously, as well as to transmit new information and research conclusions rapidly around the world. Additionally, in its deliberations, the Board considered the Investment Advisers' trading and risk management capabilities and resources, which are an integral part of the investment management process.
Shareholder and Administrative Services. The Board considered (i) the nature, extent, quality, and cost of advisory, administrative, and shareholder services performed by the Investment Advisers and their affiliates under the Advisory Contracts and under separate agreements covering transfer agency, pricing and bookkeeping, and securities lending services for the fund; (ii) the nature and extent of the supervision of third party service providers, principally custodians and subcustodians; and (iii) the resources devoted to, and the record of compliance with, the fund's compliance policies and procedures. The Board also reviewed the allocation of fund brokerage, including allocations to brokers affiliated with the Investment Advisers, the use of brokerage commissions to pay fund expenses, and the use of "soft" commission dollars to pay for research services.
Annual Report
Board Approval of Investment Advisory Contracts and
Management Fees - continued
The Board noted that the growth of fund assets over time across the complex allows Fidelity to reinvest in the development of services designed to enhance the value or convenience of the Fidelity funds as investment vehicles. These services include 24-hour access to account information and market information through telephone representatives and over the Internet, investor education materials and asset allocation tools, and the expanded availability of Fidelity Investor Centers.
Investment in a Large Fund Family. The Board considered the benefits to shareholders of investing in a Fidelity fund, including the benefits of investing in a fund that is part of a large family of funds offering a variety of investment disciplines and providing a large variety of mutual fund investor services. The Board noted that Fidelity had taken, or had made recommendations that resulted in the Fidelity funds taking, a number of actions over the previous year that benefited particular funds, including (i) continuing to dedicate additional resources to investment research and to the support of the senior management team that oversees asset management; (ii) persisting in efforts to enhance Fidelity's global research capabilities; (iii) launching new funds and making other enhancements to meet client needs for global and income-oriented solutions; (iv) continuing to launch dedicated lower cost underlying funds to meet portfolio construction needs related to expanding underlying fund options for Fidelity funds of funds, specifically for the Freedom Fund product lines; (v) rationalizing product lines and gaining increased efficiencies through the mergers of several funds into other funds; (vi) strengthening Fidelity's index fund offerings by reducing investment minimums and adopting or lowering existing expense caps for certain funds and classes; (vii) enhancing Global Asset Allocation product offerings by launching new funds and strategies, including "open architecture" target date funds that utilize affiliated and unaffiliated sub-advisers; (viii) modifying the eligibility criteria for Institutional Class shares of Advisor funds to increase their marketability to a portion of the defined contribution plan market; (ix) creating a new low-cost retirement share class for certain Advisor funds to appeal to large retirement plans; (x) transitioning the management of certain Fidelity commodity funds to Geode Capital Management LLC, a registered commodity pool operator, while retaining administrative responsibilities for the funds; (xi) reorganizing a number of funds; and (xii) taking steps toward establishing a new Fidelity adviser to manage sector-based funds and products.
Investment Performance. The Board considered whether the fund has operated in accordance with its investment objective, as well as its record of compliance with its investment restrictions and its performance history.
The Board took into account discussions with the Investment Advisers about fund investment performance that occur at Board meetings throughout the year. In this regard the Board noted that as part of regularly scheduled fund reviews and other reports to the Board on fund performance, the Board periodically considers annualized return information for the fund, for different time periods, measured against a securities market index ("benchmark index") and a peer group of mutual funds with similar objectives ("peer group"). In its evaluation of fund investment performance, the Board gave particular attention to information indicating changes in performance of certain Fidelity funds for specific time periods and the Investment Advisers' explanations for any overperformance or underperformance.
Annual Report
In addition to reviewing absolute and relative fund performance, the Independent Trustees periodically consider the appropriateness of fund performance metrics in evaluating the results achieved. In general, the Independent Trustees believe that fund performance should be evaluated based on net performance (after fees and expenses) of both the highest performing and lowest performing classes, where applicable, compared to appropriate benchmark indices, over appropriate time periods which may include full market cycles, and compared to peer groups, as applicable, over the same periods, taking into account relevant factors including the following: general market conditions; issuer-specific information; tactical opportunities for investment; and fund cash flows and other factors.
The Independent Trustees recognize that shareholders evaluate performance on a net basis over their own holding periods, for which one-, three-, and five-year periods are used as a proxy. For this reason, the performance information reviewed by the Board also included net cumulative calendar year total return information for the fund and an appropriate benchmark index for the most recent one- and three-year periods, as shown below. A peer group comparison is not shown below.
Annual Report
Board Approval of Investment Advisory Contracts and
Management Fees - continued
Fidelity Emerging Europe, Middle East, Africa (EMEA) Fund

Based on its review, the Board concluded that the nature, extent, and quality of services provided to the fund under the Advisory Contracts should benefit the fund's shareholders.
Competitiveness of Management Fee and Total Expense Ratio. The Board considered the fund's management fee and total expense ratio compared to "mapped groups" of competitive funds and classes. Fidelity creates "mapped groups" by combining similar Lipper investment objective categories that have comparable management fee characteristics. Combining Lipper investment objective categories aids the Board's management fee and total expense ratio comparisons by broadening the competitive group used for comparison and by reducing the number of universes to which various Fidelity funds are compared.
Management Fee. The Board considered two proprietary management fee comparisons for the 12-month (or shorter) periods shown in the chart below. The group of Lipper funds used by the Board for management fee comparisons is referred to below as the "Total Mapped Group." The Total Mapped Group comparison focuses on a fund's standing in terms of gross management fees before expense reimbursements or caps relative to the total universe of funds with comparable investment mandates, regardless of whether their management fee structures also are comparable. Funds with comparable investment mandates offer exposure to similar types of securities. Funds with comparable management fee structures have similar management fee contractual arrangements (e.g., flat rate charged for advisory services, all-inclusive fee rate, etc.). "TMG %" represents the percentage of funds in the Total Mapped Group that had management fees that were lower than the fund's. For example, a TMG % of 13% means that 87% of the funds in the Total Mapped Group had higher management fees than the fund. The "Asset-Size Peer Group" (ASPG) comparison focuses on a fund's standing relative to a subset of non-Fidelity funds within the Total Mapped Group that are similar in size and management fee structure. The ASPG represents at least 15% of the funds in the Total Mapped Group with comparable asset size and management fee structures, subject to a minimum of 50 funds (or all funds in the Total Mapped Group if fewer than 50). Additional information, such as the ASPG quartile in which the fund's management fee ranked, is also included in the chart and considered by the Board.
Annual Report
Fidelity Emerging Europe, Middle East, Africa (EMEA) Fund
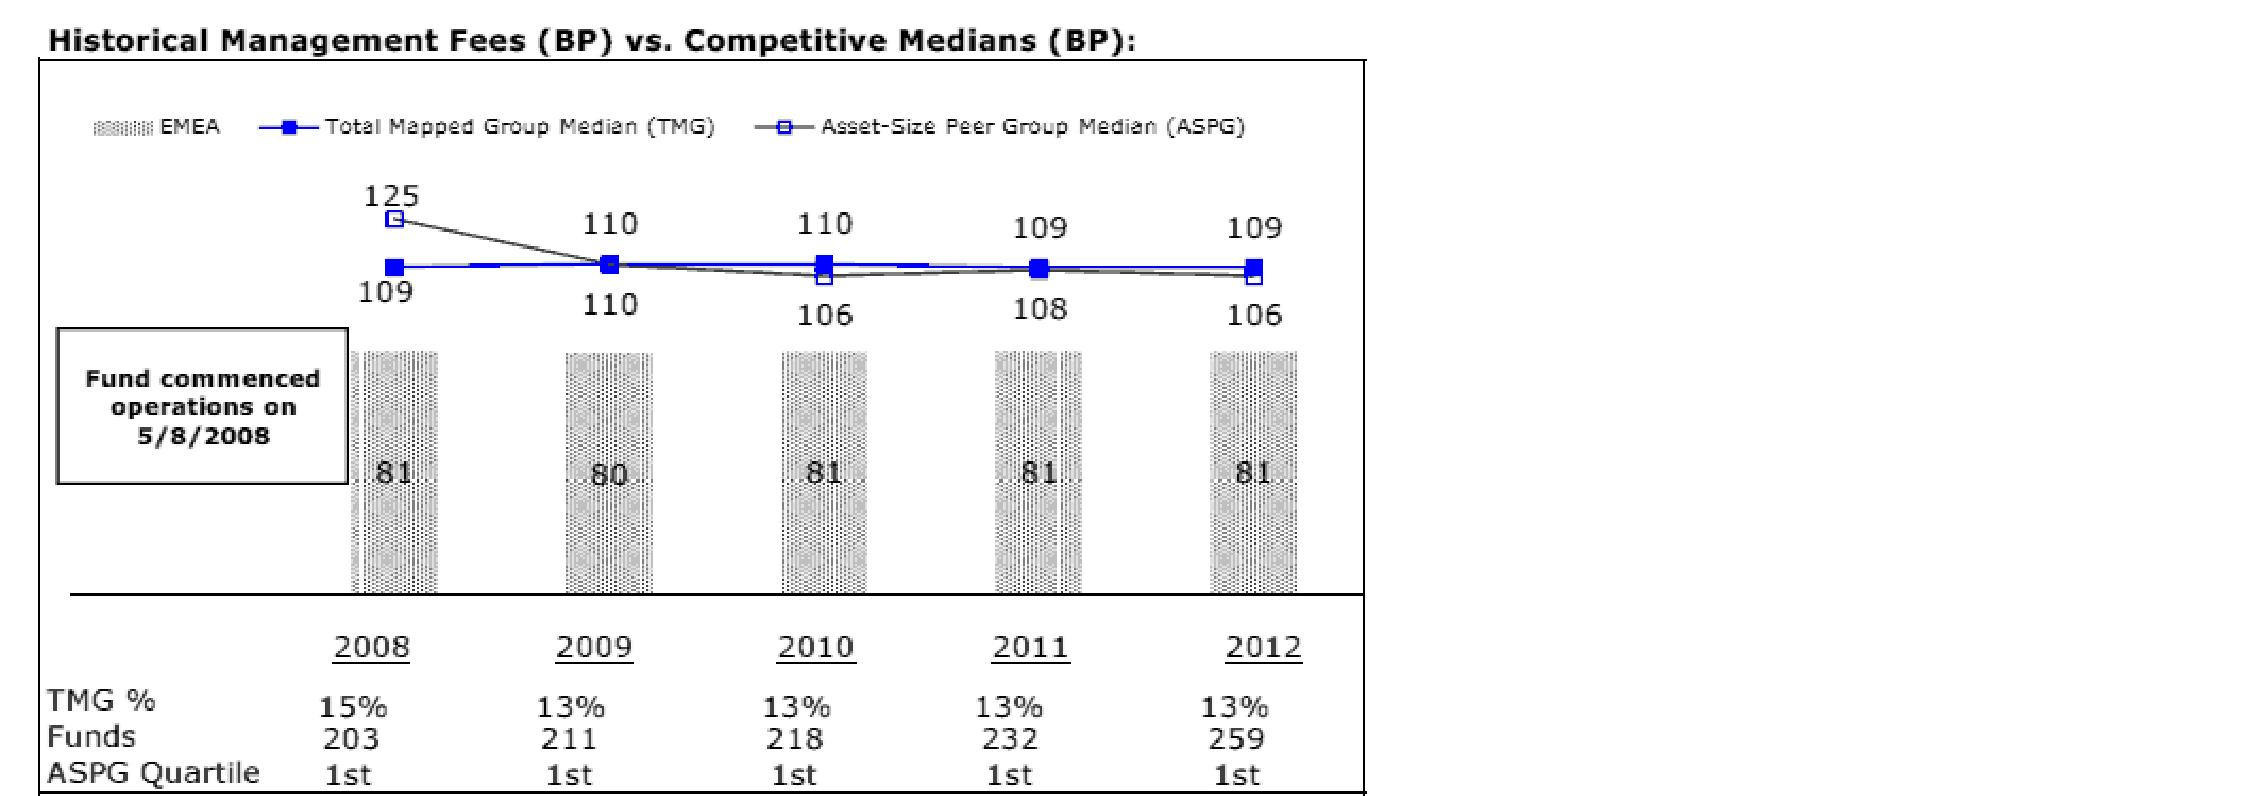
The Board noted that the fund's management fee ranked below the median of its Total Mapped Group and below the median of its ASPG for 2012.
Based on its review, the Board concluded that the fund's management fee is fair and reasonable in light of the services that the fund receives and the other factors considered.
Total Expense Ratio. In its review of each class's total expense ratio, the Board considered the fund's management fee as well as other fund or class expenses, as applicable, such as transfer agent fees, pricing and bookkeeping fees, fund-paid 12b-1 fees, and custodial, legal, and audit fees. The Board also noted the effects of any waivers and reimbursements on fees and expenses. As part of its review, the Board also considered the current and historical total expense ratios of each class of the fund compared to competitive fund median expenses. Each class of the fund is compared to those funds and classes in the Total Mapped Group (used by the Board for management fee comparisons) that have a similar sales load structure.
Annual Report
Board Approval of Investment Advisory Contracts and
Management Fees - continued
The Board noted that the total expense ratio of each of Class A, Class C, Institutional Class, and the retail class ranked below its competitive median for 2012 and the total expense ratio of each of Class T and Class B ranked above its competitive median for 2012. The Board considered that, in general, various factors can affect total expense ratios. The Board noted that the total expense ratio of Class T was above the competitive median primarily because of higher 12b-1 fees on Class T. Class T has a higher 12b-1 fee, but a lower front-end sales charge, than traditionally priced front-end sales charge classes. The Board considered that Class T is primarily sold load-waived in the retirement plan market where its 0.50% 12b-1 fee is comparable to competing no-load, higher 12b-1 fee classes designed specifically for retirement plans. The Board noted that the fund offers multiple classes, each of which has a different sales load and 12b-1 fee structure, and that the multiple structures are intended to offer a range of pricing options for the intermediary market. The Board also noted that the total expense ratios of the classes vary primarily by the level of their 12b-1 fees, although differences in transfer agent fees may also cause expenses to vary from class to class.
Fees Charged to Other Fidelity Clients. The Board also considered Fidelity fee structures and other information with respect to clients of FMR and its affiliates, such as other mutual funds advised or subadvised by FMR or its affiliates, pension plan clients, and other institutional clients. The Board noted the findings of the 2013 ad hoc joint committee (created with the board of other Fidelity funds), which reviewed and compared Fidelity's institutional investment advisory business with its business of providing services to the Fidelity funds, including the differences in services provided, fees charged, and costs incurred, as well as competition in their respective marketplaces.
Based on its review of total expense ratios and fees charged to other Fidelity clients, the Board concluded that the total expense ratio of each class of the fund was reasonable, although in some cases above the median of the universe presented for comparison, in light of the services that the fund and its shareholders receive and the other factors considered.
Costs of the Services and Profitability. The Board considered the revenues earned and the expenses incurred by Fidelity in conducting the business of developing, marketing, distributing, managing, administering and servicing the fund and servicing the fund's shareholders. The Board also considered the level of Fidelity's profits in respect of all the Fidelity funds.
On an annual basis, FMR presents to the Board Fidelity's profitability for the fund. Fidelity calculates the profitability for each fund, as well as aggregate profitability for groups of Fidelity funds and all Fidelity funds, using a series of detailed revenue and cost allocation methodologies which originate with the books and records of Fidelity on which Fidelity's audited financial statements are based. The Audit Committee of the Board reviews any significant changes from the prior year's methodologies.
Annual Report
PricewaterhouseCoopers LLP (PwC), independent registered public accounting firm and auditor to Fidelity and certain Fidelity funds, has been engaged annually by the Board as part of the Board's assessment of Fidelity's profitability analysis. PwC's engagement includes the review and assessment of the methodologies used by Fidelity in determining the revenues and expenses attributable to Fidelity's mutual fund business, and completion of agreed-upon procedures surrounding the mathematical accuracy of fund profitability and its conformity to allocation methodologies. After considering PwC's reports issued under the engagement and information provided by Fidelity, the Board concluded that while other allocation methods may also be reasonable, Fidelity's profitability methodologies are reasonable in all material respects.
The Board also reviewed Fidelity's non-fund businesses and fall-out benefits related to the mutual fund business as well as cases where Fidelity's affiliates may benefit from or be related to the fund's business.
The Board considered the costs of the services provided by and the profits realized by Fidelity in connection with the operation of the fund and was satisfied that the profitability was not excessive in the circumstances.
Economies of Scale. The Board considered whether there have been economies of scale in respect of the management of the Fidelity funds, whether the Fidelity funds (including the fund) have appropriately benefited from any such economies of scale, and whether there is potential for realization of any further economies of scale. The Board considered the extent to which the fund will benefit from economies of scale through increased services to the fund, through waivers or reimbursements, or through fee or expense reductions. The Board also noted that in 2009, it and the board of other Fidelity funds created an ad hoc committee (the Economies of Scale Committee) to analyze whether FMR attains economies of scale in respect of the management and servicing of the Fidelity funds, whether the Fidelity funds have appropriately benefited from such economies of scale, and whether there is potential for realization of any further economies of scale.
The Board recognized that the fund's management contract incorporates a "group fee" structure, which provides for lower group fee rates as total fund assets under FMR's management increase, and for higher group fee rates as total fund assets under FMR's management decrease. FMR calculates the group fee rates based on a tiered asset "breakpoint" schedule that varies based on asset class. The Board considered that the group fee is designed to deliver the benefits of economies of scale to fund shareholders when total Fidelity fund assets increase, even if assets of any particular fund are unchanged or have declined, because some portion of Fidelity's costs are attributable to services provided to all Fidelity funds, and all funds benefit if those costs can be allocated among more assets. The Board concluded that, given the group fee structure, fund shareholders will benefit from lower management fees as assets under FMR's management increase at the fund complex level, regardless of whether Fidelity achieves any such economies of scale.
Annual Report
Board Approval of Investment Advisory Contracts and
Management Fees - continued
The Board concluded, taking into account the analysis of the Economies of Scale Committee, that economies of scale, if any, are being appropriately shared between fund shareholders and Fidelity.
Amendment to Description of Group Fee Rate. At its July 2013 meeting, the Board voted to approve an amendment to the fund's management contract to modify the description of the "group fee rate" effective August 1, 2013. The Board noted that under the prior description in the contract, the group fee rate was based on the average net assets of all registered investment companies with which FMR has management contracts. Under the contract's tiered asset breakpoint schedule, the group fee rate is lower as total fund assets under FMR's management increase, and higher as total fund assets under FMR's management decrease. The Board considered that the prior description would have excluded the assets of 64 Fidelity sector funds from the group fee rate calculation once Fidelity SelectCo, LLC, an affiliate of FMR, assumed management responsibilities for those funds. The Board noted that modifying the description of the group fee rate to continue to include the assets of those 64 funds for purposes of determining group fee rate breakpoints would avoid an immediate adverse impact on the group fee rate for any fund.
Additional Information Requested by the Board. In order to develop fully the factual basis for consideration of the Fidelity funds' Advisory Contracts, the Board requested and received additional information on certain topics, including: (i) fund performance trends and Fidelity's long-term strategies for certain funds; (ii) the potential to further rationalize the Fidelity fund lineup with the possibility of achieving savings for the funds and Fidelity; (iii) the methodology with respect to competitive fund data and peer group classifications; (iv) the arrangements with, and performance of, certain sub-advisers on behalf of the Fidelity funds, as well as certain proposed participating affiliate arrangements; (v) the realization of fall-out benefits in certain Fidelity business units; (vi) Fidelity's group fee structures, including the rationale for the individual fee rates of certain categories of funds and the definition of group assets; (vii) trends regarding industry use of performance fee structures and the performance adjustment methodologies applicable to the Fidelity funds; (viii) additional competitive analysis regarding the total expenses for certain classes; and (ix) fund profitability methodology, including Fidelity's cost allocation methodology, and the impact of certain factors on fund profitability results.
Based on its evaluation of all of the conclusions noted above, and after considering all factors it believed relevant, the Board ultimately concluded that the advisory fee structures are fair and reasonable, and that the fund's Advisory Contracts should be renewed.
Annual Report
Investment Adviser
Fidelity Management & Research Company
Boston, MA
Investment Sub-Advisers
FMR Co., Inc.
Fidelity Management & Research
(U.K.) Inc.
FIL Investments (Japan) Limited
FIL Investment Advisors
FIL Investment Advisors
(U.K.) Limited
Fidelity Management & Research
(Hong Kong) Limited
Fidelity Management & Research
(Japan) Inc.
General Distributor
Fidelity Distributors Corporation
Smithfield, RI
Transfer and Service Agents
Fidelity Investments Institutional
Operations Company, Inc.
Boston, MA
Fidelity Service Company, Inc.
Boston, MA
Custodian
State Street Bank & Trust Company
Quincy, MA
(Fidelity Investment logo)(registered trademark)
AEME-UANN-1213
1.861988.105
(Fidelity Investment logo)(registered trademark)
Fidelity Advisor®
Emerging Europe,
Middle East, Africa (EMEA)
Fund - Institutional Class
Annual Report
October 31, 2013
(Fidelity Cover Art)
Institutional Class is a
class of Fidelity® Emerging Europe, Middle East, Africa (EMEA) Fund
Contents
Performance | (Click Here) | How the fund has done over time. |
Management's Discussion of Fund Performance | (Click Here) | The Portfolio Manager's review of fund performance and strategy. |
Shareholder Expense Example | (Click Here) | An example of shareholder expenses. |
Investment Changes | (Click Here) | A summary of major shifts in the fund's investments over the past six months. |
Investments | (Click Here) | A complete list of the fund's investments with their market values. |
Financial Statements | (Click Here) | Statements of assets and liabilities, operations, and changes in net assets, as well as financial highlights. |
Notes | (Click Here) | Notes to the financial statements. |
Report of Independent Registered Public Accounting Firm | (Click Here) | |
Trustees and Officers | (Click Here) | |
Distributions | (Click Here) | |
Board Approval of Investment Advisory Contracts and Management Fees | (Click Here) | |
To view a fund's proxy voting guidelines and proxy voting record for the 12-month period ended June 30, visit http://www.fidelity.com/proxyvotingresults or visit the Securities and Exchange Commission's (SEC) web site at http://www.sec.gov. You may also call 1-877-208-0098 to request a free copy of the proxy voting guidelines.
Standard & Poor's, S&P and S&P 500 are registered service marks of The McGraw-Hill Companies, Inc. and have been licensed for use by Fidelity Distributors Corporation.
Other third-party marks appearing herein are the property of their respective owners.
All other marks appearing herein are registered or unregistered trademarks or service marks of FMR LLC or an affiliated company. © 2013 FMR LLC. All rights reserved.
Annual Report
This report and the financial statements contained herein are submitted for the general information of the shareholders of the fund. This report is not authorized for distribution to prospective investors in the fund unless preceded or accompanied by an effective prospectus.
A fund files its complete schedule of portfolio holdings with the SEC for the first and third quarters of each fiscal year on Form N-Q. Forms N-Q are available on the SEC's web site at http://www.sec.gov. A fund's Forms N-Q may be reviewed and copied at the SEC's Public Reference Room in Washington, DC. Information regarding the operation of the SEC's Public Reference Room may be obtained by calling 1-800-SEC-0330. For a complete list of a fund's portfolio holdings, view the most recent holdings listing, semiannual report, or annual report on Fidelity's web site at http://www.fidelity.com, http://www.advisor.fidelity.com, or http://www.401k.com, as applicable.
NOT FDIC INSURED • MAY LOSE VALUE • NO BANK GUARANTEE
Neither the fund nor Fidelity Distributors Corporation is a bank.
Annual Report
Average annual total return reflects the change in the value of an investment, assuming reinvestment of the class' distributions from dividend income and capital gains (the profits earned upon the sale of securities that have grown in value, if any) and assuming a constant rate of performance each year. The $10,000 table and the fund's returns do not reflect the deduction of taxes that a shareholder would pay on fund distributions or the redemption of fund shares. During periods of reimbursement by Fidelity, a fund's total return will be greater than it would be had the reimbursement not occurred. How a fund did yesterday is no guarantee of how it will do tomorrow.
Average Annual Total Returns
Periods ended October 31, 2013 | Past 1
year | Past 5
years | Life of
fund A |
Institutional Class | 12.05% | 16.78% | 0.60% |
A From May 8, 2008.
$10,000 Over Life of Fund
Let's say hypothetically that $10,000 was invested in Fidelity Advisor® Emerging Europe, Middle East, Africa (EMEA) Fund - Institutional Class on May 8, 2008, when the fund started. The chart shows how the value of your investment would have changed, and also shows how the MSCI® EM (Emerging Markets) Europe, Middle East and Africa Index performed over the same period.
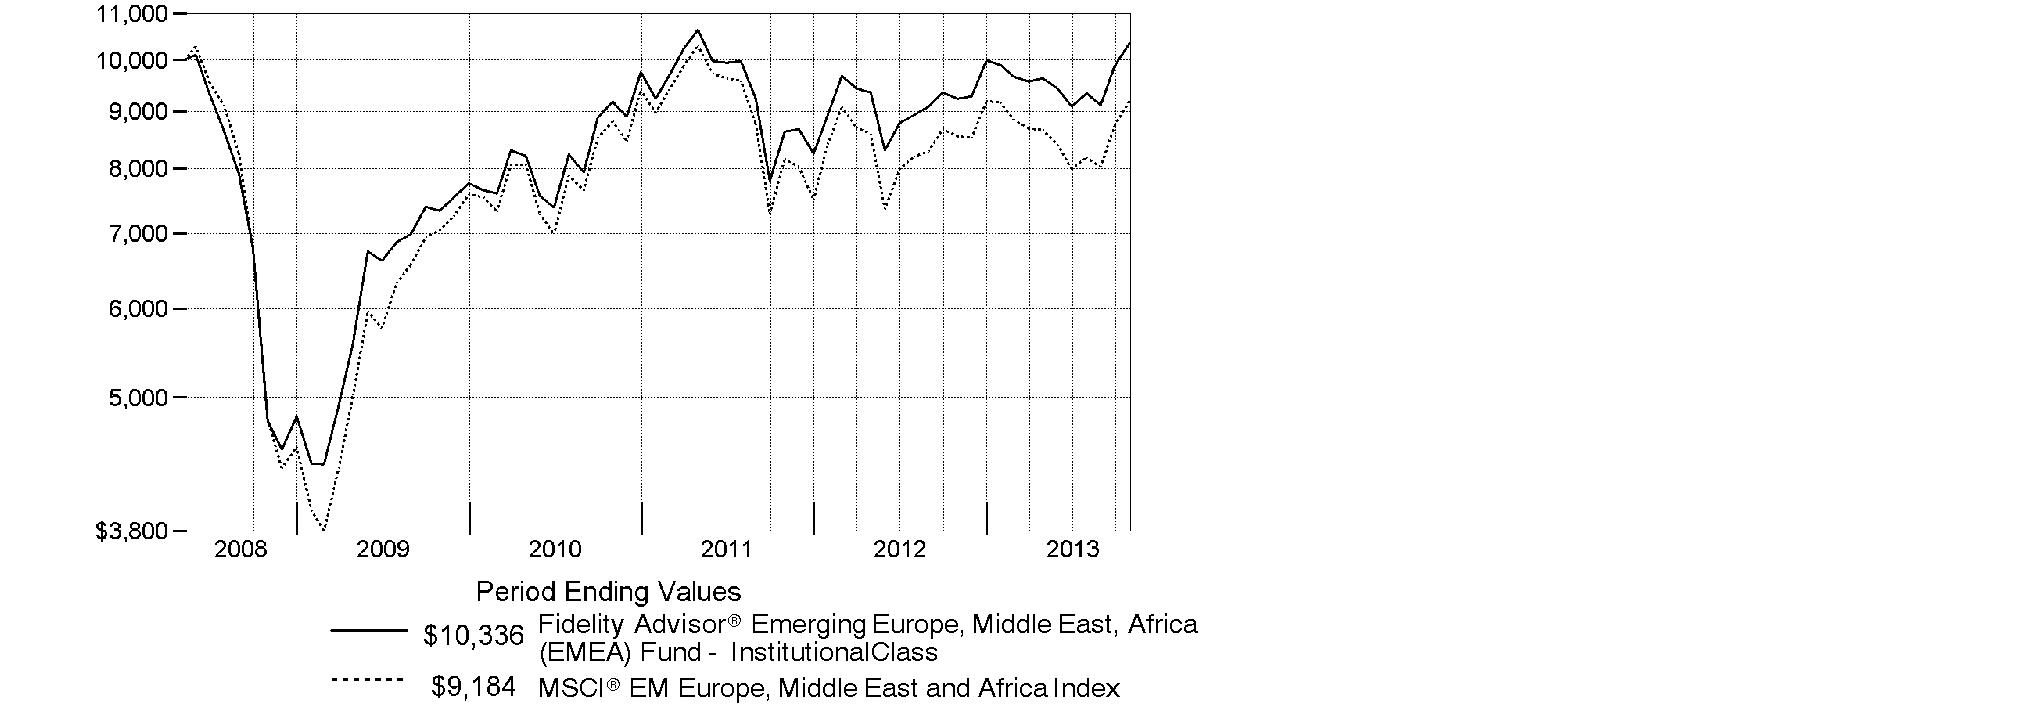
Annual Report
Market Recap: On balance, global equity markets remained upbeat for the 12-month period ending October 31, 2013. The MSCI® ACWI® (All Country World Index) Index gained 23.75% for the period, amid investor preference for higher-risk assets. The period was not without turbulence, however. In the spring and summer, central banks worldwide, especially in the U.S. and China, made clear their intentions to maintain accommodative monetary policies. That stance, combined with modest cyclical improvements around the globe and generally low valuations, underpinned the broad rally in equities. Europe (+32%) shone brightly, with most markets in the region - large and small - registering solid, index-beating gains. Another bright spot was Japan, which, despite a struggling yen and taking a second-half breather, posted a 34% result for the full year. The U.S. - by far the index's biggest constituent - also outperformed the global market with a roughly 28% advance. Meanwhile, Asia-Pacific ex Japan (+14%) lagged, hurt in part by a slowdown in Australia's mining industry as well as currency headwinds. Foreign-exchange and commodity weakness also curbed results in resource-heavy Canada and emerging markets (EM), both of which were up 7%. Country-level EM performance diverged meaningfully for the period, as evidenced by performance in Brazil (-1%), Russia (+12%), India (+1%) and China (+8%).
Comments from Adam Kutas, Portfolio Manager of Fidelity Advisor® Emerging Europe, Middle East, Africa (EMEA) Fund: For the year, the fund's Institutional Class shares returned 12.05%, significantly outperforming the 7.52% gain of the MSCI® EM (Emerging Markets) Europe, Middle East and Africa Index. Versus the index, the fund benefited from out-of-benchmark positions in the United Arab Emirates (UAE) and Kenya, including First Gulf Bank - the fund's top relative contributor during the period - Dubai Financial Market and Aldar Properties, and Kenyan wireless telecommunication services provider Safaricom. Conversely, performance was hurt by the fund's positioning in South Africa - including main detractors Harmony Gold Mining and DRDGOLD - unfavorable security selection in Turkey and underweightings in Poland and Russia.
Note to shareholders: The fund may invest up to 35% of its total assets in any industry that represents more than 20% of the emerging Europe, Middle East and Africa markets. As of October 31, 2013, the fund did not have more than 25% of its total assets in any one industry.
The views expressed above reflect those of the portfolio manager(s) only through the end of the period as stated on the cover of this report and do not necessarily represent the views of Fidelity or any other person in the Fidelity organization. Any such views are subject to change at any time based upon market or other conditions and Fidelity disclaims any responsibility to update such views. These views may not be relied on as investment advice and, because investment decisions for a Fidelity fund are based on numerous factors, may not be relied on as an indication of trading intent on behalf of any Fidelity fund.
Annual Report
Shareholder Expense Example
As a shareholder of the Fund, you incur two types of costs: (1) transaction costs, including sales charges (loads) on purchase payments or redemption proceeds, redemption fees and (2) ongoing costs, including management fees, distribution and/or service (12b-1) fees and other Fund expenses. This Example is intended to help you understand your ongoing costs (in dollars) of investing in the Fund and to compare these costs with the ongoing costs of investing in other mutual funds.
The Example is based on an investment of $1,000 invested at the beginning of the period and held for the entire period (May 1, 2013 to October 31, 2013).
Actual Expenses
The first line of the accompanying table for each class of the Fund provides information about actual account values and actual expenses. You may use the information in this line, together with the amount you invested, to estimate the expenses that you paid over the period. Simply divide your account value by $1,000.00 (for example, an $8,600 account value divided by $1,000.00 = 8.6), then multiply the result by the number in the first line for a class of the Fund under the heading entitled "Expenses Paid During Period" to estimate the expenses you paid on your account during this period. A small balance maintenance fee of $12.00 that is charged once a year may apply for certain accounts with a value of less than $2,000. This fee is not included in the table below. If it was, the estimate of expenses you paid during the period would be higher, and your ending account value lower, by this amount. In addition, the Fund, as a shareholder in the underlying Fidelity Central Funds, will indirectly bear its pro-rata share of the fees and expenses incurred by the underlying Fidelity Central Funds. These fees and expenses are not included in the Fund's annualized expense ratio used to calculate the expense estimate in the table below.
Hypothetical Example for Comparison Purposes
The second line of the accompanying table for each class of the Fund provides information about hypothetical account values and hypothetical expenses based on a Class' actual expense ratio and an assumed rate of return of 5% per year before expenses, which is not the Class' actual return. The hypothetical account values and expenses may not be used to estimate the actual ending account balance or expenses you paid for the period. You may use this information to compare the ongoing costs of investing in the Fund and other funds. To do so, compare this 5% hypothetical example with the 5% hypothetical examples that appear in the shareholder reports of the other funds. A small balance maintenance fee of $12.00 that is charged once a year may apply for certain accounts with a value of less than $2,000. This fee is not included in the table below. If it was, the estimate of expenses you paid during the period would be higher, and your ending account value lower, by this amount. In addition, the Fund, as a shareholder in the underlying Fidelity Central Funds, will indirectly bear its pro-rata share of the fees and expenses incurred by the underlying Fidelity Central Funds. These fees and expenses are not included in the Fund's annualized expense ratio used to calculate the expense estimate in the table below.
Please note that the expenses shown in the table are meant to highlight your ongoing costs only and do not reflect any transaction costs. Therefore, the second line of the table is useful in comparing ongoing costs only, and will not help you determine the relative total costs of owning different funds. In addition, if these transactional costs were included, your costs would have been higher.
Annual Report
Shareholder Expense Example - continued
| Annualized Expense RatioB | Beginning
Account Value
May 1, 2013 | Ending
Account Value
October 31, 2013 | Expenses Paid
During Period*
May 1, 2013 to October 31, 2013 |
Class A | 1.62% | | | |
Actual | | $ 1,000.00 | $ 1,072.30 | $ 8.46 |
HypotheticalA | | $ 1,000.00 | $ 1,017.04 | $ 8.24 |
Class T | 1.90% | | | |
Actual | | $ 1,000.00 | $ 1,070.10 | $ 9.91 |
HypotheticalA | | $ 1,000.00 | $ 1,015.63 | $ 9.65 |
Class B | 2.40% | | | |
Actual | | $ 1,000.00 | $ 1,068.60 | $ 12.51 |
HypotheticalA | | $ 1,000.00 | $ 1,013.11 | $ 12.18 |
Class C | 2.40% | | | |
Actual | | $ 1,000.00 | $ 1,068.30 | $ 12.51 |
HypotheticalA | | $ 1,000.00 | $ 1,013.11 | $ 12.18 |
Emerging Europe, Middle East, Africa (EMEA) | 1.40% | | | |
Actual | | $ 1,000.00 | $ 1,073.30 | $ 7.32 |
HypotheticalA | | $ 1,000.00 | $ 1,018.15 | $ 7.12 |
Institutional Class | 1.23% | | | |
Actual | | $ 1,000.00 | $ 1,074.50 | $ 6.43 |
HypotheticalA | | $ 1,000.00 | $ 1,019.00 | $ 6.26 |
A 5% return per year before expenses
B Annualized expense ratio reflects expenses net of applicable fee waivers.
* Expenses are equal to each Class' annualized expense ratio, multiplied by the average account value over the period, multiplied by 184/365 (to reflect the one-half year period).
Annual Report
Investment Changes (Unaudited)
Geographic Diversification (% of fund's net assets) |
As of October 31, 2013 |
 | South Africa 36.6% | |
 | Russia 31.9% | |
 | Poland 5.6% | |
 | United Arab Emirates 4.5% | |
 | Turkey 3.7% | |
 | Czech Republic 2.8% | |
 | United Kingdom 2.6% | |
 | Kenya 2.1% | |
 | Qatar 1.8% | |
 | Other * 8.4% | |

* Includes Short-Term Investments and Net Other Assets (Liabilities). |
Percentages are based on country or territory of incorporation and are adjusted for the effect of futures contracts, if applicable. |
As of April 30, 2013 |
| South Africa 38.4% | |
| Russia 32.3% | |
| Turkey 9.3% | |
| United Arab Emirates 4.9% | |
| Poland 2.8% | |
| Kenya 2.7% | |
| Qatar 1.6% | |
| Nigeria 1.2% | |
| Czech Republic 1.0% | |
| Other * 5.8% | |

* Includes Short-Term Investments and Net Other Assets (Liabilities). |
Percentages are based on country or territory of incorporation and are adjusted for the effect of futures contracts, if applicable. |
Asset Allocation as of October 31, 2013 |
| % of fund's
net assets | % of fund's net assets
6 months ago |
Stocks | 99.1 | 99.3 |
Short-Term Investments and Net Other Assets (Liabilities) | 0.9 | 0.7 |
Top Ten Stocks as of October 31, 2013 |
| % of fund's
net assets | % of fund's net assets
6 months ago |
Sberbank (Savings Bank of the Russian Federation) (Russia, Commercial Banks) | 7.1 | 8.7 |
LUKOIL Oil Co. (United Kingdom) (Russia, Oil, Gas & Consumable Fuels) | 6.7 | 7.8 |
MTN Group Ltd. (South Africa, Wireless Telecommunication Services) | 5.7 | 7.2 |
Gazprom OAO (Russia, Oil, Gas & Consumable Fuels) | 5.4 | 4.3 |
Naspers Ltd. Class N (South Africa, Media) | 4.3 | 2.1 |
Sasol Ltd. (South Africa, Oil, Gas & Consumable Fuels) | 2.7 | 1.5 |
Bank Polska Kasa Opieki SA (Poland, Commercial Banks) | 2.7 | 1.8 |
Magnit OJSC (Russia, Food & Staples Retailing) | 2.5 | 1.8 |
Standard Bank Group Ltd. (South Africa, Commercial Banks) | 2.3 | 3.1 |
Surgutneftegas (Russia, Oil, Gas & Consumable Fuels) | 2.3 | 3.5 |
| 41.7 | |
Market Sectors as of October 31, 2013 |
| % of fund's
net assets | % of fund's net assets
6 months ago |
Financials | 34.2 | 34.1 |
Energy | 23.2 | 23.6 |
Telecommunication Services | 11.7 | 11.1 |
Consumer Staples | 10.0 | 10.8 |
Consumer Discretionary | 7.1 | 3.9 |
Materials | 6.8 | 9.2 |
Industrials | 2.7 | 4.4 |
Health Care | 2.2 | 1.3 |
Utilities | 0.8 | 0.6 |
Information Technology | 0.4 | 0.3 |
Annual Report
Investments October 31, 2013
Showing Percentage of Net Assets
Common Stocks - 95.3% |
| Shares | | Value |
Bangladesh - 0.4% |
Grameenphone Ltd. | 120,000 | | $ 296,506 |
Square Pharmaceuticals Ltd. | 125,000 | | 289,396 |
TOTAL BANGLADESH | | 585,902 |
Botswana - 0.2% |
First National Bank of Botswana Ltd. | 650,000 | | 291,113 |
Canada - 0.5% |
Africa Oil Corp. (a) | 75,400 | | 669,644 |
Cayman Islands - 1.0% |
Eurasia Drilling Co. Ltd. GDR (Reg. S) | 33,600 | | 1,422,960 |
Czech Republic - 2.8% |
Komercni Banka A/S | 7,800 | | 1,936,506 |
Philip Morris CR A/S | 2,800 | | 1,589,076 |
Telefonica Czech Rep A/S | 23,900 | | 389,876 |
TOTAL CZECH REPUBLIC | | 3,915,458 |
Estonia - 0.4% |
Tallinna Kaubamaja AS | 70,900 | | 526,567 |
Greece - 0.9% |
Jumbo SA (a) | 45,700 | | 614,287 |
Karelia Tobacco Co., Inc. | 1,970 | | 614,795 |
Kri Kri Milk Industry SA (a) | 25,000 | | 71,282 |
Sarantis SA (a) | 4,628 | | 36,822 |
TOTAL GREECE | | 1,337,186 |
Israel - 0.2% |
Bezeq The Israeli Telecommunication Corp. Ltd. | 200,000 | | 348,302 |
Kazakhstan - 0.1% |
Kcell JSC GDR | 10,000 | | 173,000 |
Kenya - 2.1% |
British American Tobacco Kenya Ltd. | 51,700 | | 347,695 |
Kenya Commercial Bank Ltd. | 250,000 | | 142,062 |
Safaricom Ltd. | 17,420,944 | | 1,928,857 |
Uchumi Supermarket Ltd. | 2,397,200 | | 596,842 |
TOTAL KENYA | | 3,015,456 |
Kuwait - 0.3% |
Kuwait Food Co. (Americana) | 50,000 | | 435,861 |
Lithuania - 0.4% |
Apranga AB | 163,766 | | 564,777 |
Common Stocks - continued |
| Shares | | Value |
Nigeria - 0.6% |
Skye Bank PLC | 5,785,889 | | $ 149,384 |
Zenith Bank PLC | 5,269,355 | | 714,747 |
TOTAL NIGERIA | | 864,131 |
Oman - 0.8% |
National Bank of Oman (a) | 828,494 | | 634,820 |
Oman Telecommunications Co. (a) | 136,761 | | 552,372 |
TOTAL OMAN | | 1,187,192 |
Poland - 5.6% |
Amica Wronki SA | 10,200 | | 354,310 |
Bank Handlowy w Warszawie SA | 51,300 | | 1,978,489 |
Bank Polska Kasa Opieki SA | 60,200 | | 3,771,844 |
Powszechny Zaklad Ubezpieczen SA | 12,000 | | 1,826,286 |
TOTAL POLAND | | 7,930,929 |
Qatar - 1.8% |
Gulf International Services QSC (a) | 34,000 | | 547,363 |
Industries Qatar QSC | 16,528 | | 724,235 |
Qatar National Bank SAQ | 28,281 | | 1,289,738 |
TOTAL QATAR | | 2,561,336 |
Romania - 1.2% |
Banca Transilvania SA (a) | 1,125,000 | | 485,545 |
Bursa de Valori Bucuresti | 61,814 | | 475,296 |
Nuclearelectrica SA rights (a) | 82,000 | | 275,346 |
SNP Petrom SA | 4,005,225 | | 545,562 |
TOTAL ROMANIA | | 1,781,749 |
Russia - 28.1% |
Gazprom OAO | 1,616,200 | | 7,583,414 |
LUKOIL Oil Co. | 13,100 | | 859,425 |
LUKOIL Oil Co. sponsored ADR (United Kingdom) | 131,995 | | 8,658,872 |
Magnit OJSC | 13,200 | | 3,552,063 |
Megafon OJSC GDR | 79,000 | | 2,867,700 |
Mobile TeleSystems OJSC | 98,200 | | 1,033,725 |
Moscow Exchange MICEX-RTS OAO | 450,500 | | 860,383 |
NOVATEK OAO | 42,000 | | 539,675 |
NOVATEK OAO GDR (Reg. S) | 19,450 | | 2,732,725 |
Sberbank (Savings Bank of the Russian Federation) | 3,135,200 | | 10,049,609 |
Vozrozhdenie Bank | 85,700 | | 1,106,298 |
TOTAL RUSSIA | | 39,843,889 |
Common Stocks - continued |
| Shares | | Value |
South Africa - 36.6% |
AngloGold Ashanti Ltd. | 130,300 | | $ 1,969,407 |
Aspen Pharmacare Holdings Ltd. | 60,400 | | 1,681,483 |
Cashbuild Ltd. | 85,400 | | 1,331,521 |
Clicks Group Ltd. | 343,217 | | 2,138,536 |
DRDGOLD Ltd. | 3,287,814 | | 1,623,965 |
DRDGOLD Ltd. sponsored ADR | 28,300 | | 139,519 |
FirstRand Ltd. | 819,800 | | 2,939,888 |
Harmony Gold Mining Co. Ltd. | 461,100 | | 1,591,068 |
Holdsport Ltd. | 130,400 | | 636,494 |
Hulamin Ltd. (a) | 876,800 | | 495,227 |
Metrofile Holdings Ltd. | 1,089,700 | | 536,234 |
MTN Group Ltd. | 407,650 | | 8,102,850 |
Nampak Ltd. | 907,400 | | 3,000,939 |
Naspers Ltd. Class N | 65,600 | | 6,136,063 |
Omnia Holdings Ltd. | 40,600 | | 838,147 |
Pioneer Foods Ltd. | 150,300 | | 1,272,619 |
Raubex Group Ltd. | 802,400 | | 1,902,340 |
Remgro Ltd. | 124,200 | | 2,528,849 |
RMB Holdings Ltd. | 221,500 | | 1,110,506 |
Sasol Ltd. | 76,000 | | 3,883,435 |
Shoprite Holdings Ltd. | 163,900 | | 3,000,854 |
Standard Bank Group Ltd. | 257,363 | | 3,269,225 |
Steinhoff International Holdings Ltd. | 40,000 | | 154,641 |
Vodacom Group Ltd. | 87,400 | | 1,001,220 |
Zeder Investments Ltd. | 1,556,380 | | 671,972 |
TOTAL SOUTH AFRICA | | 51,957,002 |
Sri Lanka - 0.3% |
Hatton National Bank PLC | 365,000 | | 409,893 |
Turkey - 3.7% |
Aygaz A/S | 184,000 | | 842,460 |
Koc Holding A/S | 265,850 | | 1,305,112 |
Turkiye Garanti Bankasi A/S | 488,000 | | 1,965,445 |
Turkiye Halk Bankasi A/S | 135,000 | | 1,092,173 |
TOTAL TURKEY | | 5,205,190 |
United Arab Emirates - 4.5% |
Agthia Group PJSC | 224,869 | | 249,786 |
Aldar Properties PJSC | 1,437,210 | | 1,056,484 |
Dubai Financial Market PJSC (a) | 3,234,033 | | 2,051,537 |
Emaar Properties PJSC | 330,000 | | 546,256 |
First Gulf Bank PJSC | 325,940 | | 1,437,579 |
Common Stocks - continued |
| Shares | | Value |
United Arab Emirates - continued |
National Bank of Abu Dhabi PJSC | 131,600 | | $ 447,863 |
SHUAA Capital PSC (a) | 2,220,000 | | 604,411 |
TOTAL UNITED ARAB EMIRATES | | 6,393,916 |
United Kingdom - 2.6% |
Alabama Noor Hospitals Group PLC (a) | 39,100 | | 532,890 |
Fawaz Abdulaziz Alhokair & Co. (HSBC Warrant Program) warrants 2/23/15 (a) | 10,000 | | 329,298 |
Herfy Food Services Co. Ltd. (HSBC Warrant Program) warrants 10/8/15 (a) | 21,500 | | 640,632 |
NMC Health PLC | 105,200 | | 611,119 |
Old Mutual PLC | 245,200 | | 795,289 |
Saudia Dairy & Foodstuff Co. (HSBC Warrant Program) warrants 6/26/15 (a) | 19,000 | | 466,084 |
The Savola Group (HSBC Warrant Program) warrants 2/2/15 (a) | 19,000 | | 279,903 |
TOTAL UNITED KINGDOM | | 3,655,215 |
Zambia - 0.2% |
Zambeef Products PLC (a) | 351,874 | | 225,148 |
TOTAL COMMON STOCKS (Cost $122,897,776) |
135,301,816
|
Nonconvertible Preferred Stocks - 3.8% |
| | | |
Russia - 3.8% |
Surgutneftegas | 4,375,800 | | 3,254,144 |
Tatneft OAO | 598,700 | | 2,206,570 |
TOTAL NONCONVERTIBLE PREFERRED STOCKS (Cost $4,425,369) |
5,460,714
|
Money Market Funds - 0.7% |
| Shares | | Value |
Fidelity Cash Central Fund, 0.09% (b)
(Cost $927,624) | 927,624 | | $ 927,624 |
TOTAL INVESTMENT PORTFOLIO - 99.8% (Cost $128,250,769) | 141,690,154 |
NET OTHER ASSETS (LIABILITIES) - 0.2% | | 324,707 |
NET ASSETS - 100% | $ 142,014,861 |
Legend |
(a) Non-income producing |
(b) Affiliated fund that is generally available only to investment companies and other accounts managed by Fidelity Investments. The rate quoted is the annualized seven-day yield of the fund at period end. A complete unaudited listing of the fund's holdings as of its most recent quarter end is available upon request. In addition, each Fidelity Central Fund's financial statements, which are not covered by the Fund's Report of Independent Registered Public Accounting Firm, are available on the SEC's website or upon request. |
Affiliated Central Funds |
Information regarding fiscal year to date income earned by the Fund from investments in Fidelity Central Funds is as follows: |
Fund | Income earned |
Fidelity Cash Central Fund | $ 3,124 |
Fidelity Securities Lending Cash Central Fund | 4,818 |
Total | $ 7,942 |
Other Information |
Categorizations in the Schedule of Investments are based on country or territory of incorporation. |
The following is a summary of the inputs used, as of October 31, 2013, involving the Fund's assets and liabilities carried at fair value. The inputs or methodology used for valuing securities may not be an indication of the risk associated with investing in those securities. For more information on valuation inputs, and their aggregation into the levels used in the table below, please refer to the Investment Valuation section in the accompanying Notes to Financial Statements. |
Valuation Inputs at Reporting Date: |
Description | Total | Level 1 | Level 2 | Level 3 |
Investments in Securities: | | | | |
Equities: | | | | |
Consumer Discretionary | $ 10,227,954 | $ 10,227,954 | $ - | $ - |
Consumer Staples | 14,222,085 | 14,222,085 | - | - |
Energy | 32,903,789 | 29,020,354 | 3,883,435 | - |
Financials | 48,355,407 | 46,639,490 | 1,715,917 | - |
Health Care | 3,114,888 | 3,114,888 | - | - |
Industrials | 3,931,687 | 3,931,687 | - | - |
Information Technology | 536,234 | 536,234 | - | - |
Materials | 9,658,272 | 4,473,832 | 5,184,440 | - |
Telecommunication Services | 16,694,408 | 16,694,408 | - | - |
Utilities | 1,117,806 | 1,117,806 | - | - |
Money Market Funds | 927,624 | 927,624 | - | - |
Total Investments in Securities: | $ 141,690,154 | $ 130,906,362 | $ 10,783,792 | $ - |
See accompanying notes which are an integral part of the financial statements.
Annual Report
Statement of Assets and Liabilities
| October 31, 2013 |
| | |
Assets | | |
Investment in securities, at value - See accompanying schedule: Unaffiliated issuers (cost $127,323,145) | $ 140,762,530 | |
Fidelity Central Funds (cost $927,624) | 927,624 | |
Total Investments (cost $128,250,769) | | $ 141,690,154 |
Foreign currency held at value (cost $6,860) | | 6,860 |
Receivable for investments sold | | 543,045 |
Receivable for fund shares sold | | 456,976 |
Dividends receivable | | 297,198 |
Distributions receivable from Fidelity Central Funds | | 82 |
Prepaid expenses | | 396 |
Other receivables | | 3,403 |
Total assets | | 142,998,114 |
| | |
Liabilities | | |
Payable to custodian bank | $ 100,546 | |
Payable for investments purchased | 543,105 | |
Payable for fund shares redeemed | 113,301 | |
Accrued management fee | 102,489 | |
Distribution and service plan fees payable | 9,522 | |
Other affiliated payables | 35,514 | |
Audit fees payable | 44,096 | |
Other payables and accrued expenses | 34,680 | |
Total liabilities | | 983,253 |
| | |
Net Assets | | $ 142,014,861 |
Net Assets consist of: | | |
Paid in capital | | $ 129,031,339 |
Undistributed net investment income | | 1,897,738 |
Accumulated undistributed net realized gain (loss) on investments and foreign currency transactions | | (2,364,438) |
Net unrealized appreciation (depreciation) on investments and assets and liabilities in foreign currencies | | 13,450,222 |
Net Assets | | $ 142,014,861 |
See accompanying notes which are an integral part of the financial statements.
Annual Report
Financial Statements - continued
Statement of Assets and Liabilities - continued
| October 31, 2013 |
| | |
Calculation of Maximum Offering Price Class A:
Net Asset Value and redemption price per share ($10,883,131 ÷ 1,146,802 shares) | | $ 9.49 |
| | |
Maximum offering price per share (100/94.25 of $9.49) | | $ 10.07 |
Class T:
Net Asset Value and redemption price per share ($3,465,265 ÷ 366,170 shares) | | $ 9.46 |
| | |
Maximum offering price per share (100/96.50 of $9.46) | | $ 9.80 |
Class B:
Net Asset Value and offering price per share ($388,173 ÷ 40,870 shares)A | | $ 9.50 |
| | |
Class C:
Net Asset Value and offering price per share ($6,781,855 ÷ 722,186 shares)A | | $ 9.39 |
| | |
Emerging Europe, Middle East, Africa (EMEA):
Net Asset Value, offering price and redemption price per share ($110,265,497 ÷ 11,580,491 shares) | | $ 9.52 |
| | |
Institutional Class:
Net Asset Value, offering price and redemption price per share ($10,230,940 ÷ 1,074,619 shares) | | $ 9.52 |
A Redemption price per share is equal to net asset value less any applicable contingent deferred sales charge.
See accompanying notes which are an integral part of the financial statements.
Annual Report
Statement of Operations
| Year ended October 31, 2013 |
| | |
Investment Income | | |
Dividends | | $ 5,669,711 |
Interest | | 11,822 |
Income from Fidelity Central Funds | | 7,942 |
Income before foreign taxes withheld | | 5,689,475 |
Less foreign taxes withheld | | (752,601) |
Total income | | 4,936,874 |
| | |
Expenses | | |
Management fee | $ 1,158,980 | |
Transfer agent fees | 398,454 | |
Distribution and service plan fees | 114,080 | |
Accounting and security lending fees | 74,660 | |
Custodian fees and expenses | 230,069 | |
Independent trustees' compensation | 838 | |
Registration fees | 82,070 | |
Audit | 61,954 | |
Legal | 383 | |
Miscellaneous | 1,128 | |
Total expenses before reductions | 2,122,616 | |
Expense reductions | (35,590) | 2,087,026 |
Net investment income (loss) | | 2,849,848 |
Realized and Unrealized Gain (Loss) Net realized gain (loss) on: | | |
Investment securities: | | |
Unaffiliated issuers | 522,076 | |
Foreign currency transactions | (96,200) | |
Total net realized gain (loss) | | 425,876 |
Change in net unrealized appreciation (depreciation) on: Investment securities | 11,140,957 | |
Assets and liabilities in foreign currencies | 10,565 | |
Total change in net unrealized appreciation (depreciation) | | 11,151,522 |
Net gain (loss) | | 11,577,398 |
Net increase (decrease) in net assets resulting from operations | | $ 14,427,246 |
See accompanying notes which are an integral part of the financial statements.
Annual Report
Financial Statements - continued
Statement of Changes in Net Assets
| Year ended
October 31,
2013 | Year ended
October 31,
2012 |
Increase (Decrease) in Net Assets | | |
Operations | | |
Net investment income (loss) | $ 2,849,848 | $ 3,198,505 |
Net realized gain (loss) | 425,876 | 10,513,420 |
Change in net unrealized appreciation (depreciation) | 11,151,522 | (5,470,956) |
Net increase (decrease) in net assets resulting
from operations | 14,427,246 | 8,240,969 |
Distributions to shareholders from net investment income | (2,689,985) | (2,782,952) |
Distributions to shareholders from net realized gain | (1,184,624) | - |
Total distributions | (3,874,609) | (2,782,952) |
Share transactions - net increase (decrease) | (9,097,663) | (7,689,254) |
Redemption fees | 52,524 | 36,290 |
Total increase (decrease) in net assets | 1,507,498 | (2,194,947) |
| | |
Net Assets | | |
Beginning of period | 140,507,363 | 142,702,310 |
End of period (including undistributed net investment income of $1,897,738 and undistributed net investment income of $2,631,143, respectively) | $ 142,014,861 | $ 140,507,363 |
See accompanying notes which are an integral part of the financial statements.
Annual Report
Financial Highlights - Class A
Years ended October 31, | 2013 | 2012 | 2011 | 2010 | 2009 |
Selected Per-Share Data | | | | | |
Net asset value, beginning of period | $ 8.71 | $ 8.34 | $ 8.97 | $ 7.26 | $ 4.75 |
Income from Investment Operations | | | | | |
Net investment income (loss) C | .16 | .18 | .16 F | .07 | .05 |
Net realized and unrealized gain (loss) | .85 | .34 | (.70) | 1.70 | 2.48 |
Total from investment operations | 1.01 | .52 | (.54) | 1.77 | 2.53 |
Distributions from net investment income | (.15) | (.15) | (.08) | (.04) | (.03) |
Distributions from net realized gain | (.07) | - | (.02) | (.02) | - |
Total distributions | (.23) J | (.15) | (.10) | (.07) I | (.03) |
Redemption fees added to paid in capital C | - H | - H | .01 | .01 | .01 |
Net asset value, end of period | $ 9.49 | $ 8.71 | $ 8.34 | $ 8.97 | $ 7.26 |
Total Return A,B | 11.75% | 6.38% | (6.05)% | 24.66% | 53.78% |
Ratios to Average Net Assets D,G | | | | | |
Expenses before reductions | 1.64% | 1.62% | 1.60% | 1.69% | 1.87% |
Expenses net of fee waivers, if any | 1.63% | 1.62% | 1.56% | 1.50% | 1.50% |
Expenses net of all reductions | 1.62% | 1.60% | 1.51% | 1.38% | 1.39% |
Net investment income (loss) | 1.82% | 2.09% | 1.70% F | .95% | .84% |
Supplemental Data | | | | | |
Net assets, end of period (000 omitted) | $ 10,883 | $ 8,934 | $ 10,260 | $ 10,045 | $ 4,817 |
Portfolio turnover rate E | 64% | 30% | 53% | 96% | 58% |
A Total returns would have been lower if certain expenses had not been reduced during the applicable periods shown.
B Total returns do not include the effect of the sales charges.
C Calculated based on average shares outstanding during the period.
D Fees and expenses of any underlying Fidelity Central Funds are not included in the Fund's expense ratio. The Fund indirectly bears its proportionate share of the expenses of any underlying Fidelity Central Funds.
E Amount does not include the portfolio activity of any underlying Fidelity Central Funds.
F Investment income per share reflects a large, non-recurring dividend which amounted to $.04 per share. Excluding this non-recurring dividend, the ratio of net investment income (loss) to average net assets would have been 1.25%.
G Expense ratios reflect operating expenses of the class. Expenses before reductions do not reflect amounts reimbursed by the investment adviser or reductions from brokerage service arrangements or reductions from other expense offset arrangements and do not represent the amount paid by the class during periods when reimbursements or reductions occur. Expenses net of fee waivers reflect expenses after reimbursement by the investment adviser but prior to reductions from brokerage service arrangements or other expense offset arrangements. Expenses net of all reductions represent the net expenses paid by the class.
H Amount represents less than $.01 per share.
I Total distributions of $.07 per share is comprised of distributions from net investment income of $.041 and distributions from net realized gain of $.024 per share.
J Total distributions of $.23 per share is comprised of distributions from net investment income of $.151 and distributions from net realized gain of $.074 per share.
See accompanying notes which are an integral part of the financial statements.
Annual Report
Financial Highlights - Class T
Years ended October 31, | 2013 | 2012 | 2011 | 2010 | 2009 |
Selected Per-Share Data | | | | | |
Net asset value, beginning of period | $ 8.68 | $ 8.31 | $ 8.96 | $ 7.25 | $ 4.75 |
Income from Investment Operations | | | | | |
Net investment income (loss) C | .14 | .15 | .13 F | .06 | .04 |
Net realized and unrealized gain (loss) | .84 | .35 | (.71) | 1.69 | 2.47 |
Total from investment operations | .98 | .50 | (.58) | 1.75 | 2.51 |
Distributions from net investment income | (.12) | (.13) | (.07) | (.03) | (.02) |
Distributions from net realized gain | (.07) | - | (.02) | (.02) | - |
Total distributions | (.20) J | (.13) | (.08) I | (.05) | (.02) |
Redemption fees added to paid in capital C | - H | - H | .01 | .01 | .01 |
Net asset value, end of period | $ 9.46 | $ 8.68 | $ 8.31 | $ 8.96 | $ 7.25 |
Total Return A,B | 11.42% | 6.14% | (6.42)% | 24.44% | 53.20% |
Ratios to Average Net Assets D,G | | | | | |
Expenses before reductions | 1.93% | 1.89% | 1.87% | 1.95% | 2.15% |
Expenses net of fee waivers, if any | 1.90% | 1.89% | 1.84% | 1.75% | 1.75% |
Expenses net of all reductions | 1.88% | 1.86% | 1.78% | 1.62% | 1.64% |
Net investment income (loss) | 1.55% | 1.82% | 1.42% F | .70% | .59% |
Supplemental Data | | | | | |
Net assets, end of period (000 omitted) | $ 3,465 | $ 3,336 | $ 3,502 | $ 3,114 | $ 1,560 |
Portfolio turnover rate E | 64% | 30% | 53% | 96% | 58% |
A Total returns would have been lower if certain expenses had not been reduced during the applicable periods shown.
B Total returns do not include the effect of the sales charges.
C Calculated based on average shares outstanding during the period.
D Fees and expenses of any underlying Fidelity Central Funds are not included in the Fund's expense ratio. The Fund indirectly bears its proportionate share of the expenses of any underlying Fidelity Central Funds.
E Amount does not include the portfolio activity of any underlying Fidelity Central Funds.
F Investment income per share reflects a large, non-recurring dividend which amounted to $.04 per share. Excluding this non-recurring dividend, the ratio of net investment income (loss) to average net assets would have been .98%.
G Expense ratios reflect operating expenses of the class. Expenses before reductions do not reflect amounts reimbursed by the investment adviser or reductions from brokerage service arrangements or reductions from other expense offset arrangements and do not represent the amount paid by the class during periods when reimbursements or reductions occur. Expenses net of fee waivers reflect expenses after reimbursement by the investment adviser but prior to reductions from brokerage service arrangements or other expense offset arrangements. Expenses net of all reductions represent the net expenses paid by the class.
H Amount represents less than $.01 per share.
I Total distributions of $.08 per share is comprised of distributions from net investment income of $.068 and distributions from net realized gain of $.015 per share.
J Total distributions of $.20 per share is comprised of distributions from net investment income of $.122 and distributions from net realized gain of $.074 per share.
See accompanying notes which are an integral part of the financial statements.
Annual Report
Financial Highlights - Class B
Years ended October 31, | 2013 | 2012 | 2011 | 2010 | 2009 |
Selected Per-Share Data | | | | | |
Net asset value, beginning of period | $ 8.69 | $ 8.29 | $ 8.93 | $ 7.23 | $ 4.73 |
Income from Investment Operations | | | | | |
Net investment income (loss) C | .09 | .11 | .09 F | .02 | .01 |
Net realized and unrealized gain (loss) | .85 | .35 | (.71) | 1.68 | 2.48 |
Total from investment operations | .94 | .46 | (.62) | 1.70 | 2.49 |
Distributions from net investment income | (.06) | (.06) | (.02) | - | - |
Distributions from net realized gain | (.07) | - | (.01) | (.01) | - |
Total distributions | (.13) | (.06) | (.03) | (.01) | - |
Redemption fees added to paid in capital C | - H | - H | .01 | .01 | .01 |
Net asset value, end of period | $ 9.50 | $ 8.69 | $ 8.29 | $ 8.93 | $ 7.23 |
Total Return A,B | 10.94% | 5.56% | (6.85)% | 23.72% | 52.85% |
Ratios to Average Net Assets D,G | | | | | |
Expenses before reductions | 2.42% | 2.38% | 2.37% | 2.47% | 2.68% |
Expenses net of fee waivers, if any | 2.40% | 2.38% | 2.33% | 2.25% | 2.25% |
Expenses net of all reductions | 2.38% | 2.35% | 2.27% | 2.12% | 2.14% |
Net investment income (loss) | 1.05% | 1.33% | .93% F | .20% | .09% |
Supplemental Data | | | | | |
Net assets, end of period (000 omitted) | $ 388 | $ 441 | $ 539 | $ 822 | $ 782 |
Portfolio turnover rate E | 64% | 30% | 53% | 96% | 58% |
A Total returns would have been lower if certain expenses had not been reduced during the applicable periods shown.
B Total returns do not include the effect of the contingent deferred sales charge.
C Calculated based on average shares outstanding during the period.
D Fees and expenses of any underlying Fidelity Central Funds are not included in the Fund's expense ratio. The Fund indirectly bears its proportionate share of the expenses of any underlying Fidelity Central Funds.
E Amount does not include the portfolio activity of any underlying Fidelity Central Funds.
F Investment income per share reflects a large, non-recurring dividend which amounted to $.04 per share. Excluding this non-recurring dividend, the ratio of net investment income (loss) to average net assets would have been .49%.
G Expense ratios reflect operating expenses of the class. Expenses before reductions do not reflect amounts reimbursed by the investment adviser or reductions from brokerage service arrangements or reductions from other expense offset arrangements and do not represent the amount paid by the class during periods when reimbursements or reductions occur. Expenses net of fee waivers reflect expenses after reimbursement by the investment adviser but prior to reductions from brokerage service arrangements or other expense offset arrangements. Expenses net of all reductions represent the net expenses paid by the class.
H Amount represents less than $.01 per share.
See accompanying notes which are an integral part of the financial statements.
Annual Report
Financial Highlights - Class C
Years ended October 31, | 2013 | 2012 | 2011 | 2010 | 2009 |
Selected Per-Share Data | | | | | |
Net asset value, beginning of period | $ 8.62 | $ 8.24 | $ 8.90 | $ 7.23 | $ 4.73 |
Income from Investment Operations | | | | | |
Net investment income (loss) C | .09 | .11 | .08 F | .02 | .01 |
Net realized and unrealized gain (loss) | .83 | .35 | (.69) | 1.67 | 2.48 |
Total from investment operations | .92 | .46 | (.61) | 1.69 | 2.49 |
Distributions from net investment income | (.08) | (.08) | (.05) | (.01) | - |
Distributions from net realized gain | (.07) | - | (.02) | (.02) | - |
Total distributions | (.15) | (.08) | (.06) I | (.03) | - |
Redemption fees added to paid in capital C | - H | - H | .01 | .01 | .01 |
Net asset value, end of period | $ 9.39 | $ 8.62 | $ 8.24 | $ 8.90 | $ 7.23 |
Total Return A,B | 10.83% | 5.68% | (6.79)% | 23.61% | 52.85% |
Ratios to Average Net Assets D,G | | | | | |
Expenses before reductions | 2.42% | 2.37% | 2.36% | 2.45% | 2.61% |
Expenses net of fee waivers, if any | 2.40% | 2.37% | 2.33% | 2.25% | 2.25% |
Expenses net of all reductions | 2.38% | 2.35% | 2.27% | 2.13% | 2.14% |
Net investment income (loss) | 1.05% | 1.34% | .93% F | .20% | .09% |
Supplemental Data | | | | | |
Net assets, end of period (000 omitted) | $ 6,782 | $ 7,770 | $ 6,650 | $ 5,151 | $ 2,677 |
Portfolio turnover rate E | 64% | 30% | 53% | 96% | 58% |
A Total returns would have been lower if certain expenses had not been reduced during the applicable periods shown.
B Total returns do not include the effect of the contingent deferred sales charge.
C Calculated based on average shares outstanding during the period.
D Fees and expenses of any underlying Fidelity Central Funds are not included in the Fund's expense ratio. The Fund indirectly bears its proportionate share of the expenses of any underlying Fidelity Central Funds.
E Amount does not include the portfolio activity of any underlying Fidelity Central Funds.
F Investment income per share reflects a large, non-recurring dividend which amounted to $.04 per share. Excluding this non-recurring dividend, the ratio of net investment income (loss) to average net assets would have been .49%.
G Expense ratios reflect operating expenses of the class. Expenses before reductions do not reflect amounts reimbursed by the investment adviser or reductions from brokerage service arrangements or reductions from other expense offset arrangements and do not represent the amount paid by the class during periods when reimbursements or reductions occur. Expenses net of fee waivers reflect expenses after reimbursement by the investment adviser but prior to reductions from brokerage service arrangements or other expense offset arrangements. Expenses net of all reductions represent the net expenses paid by the class.
H Amount represents less than $.01 per share.
I Total distributions of $.06 per share is comprised of distributions from net investment income of $.047 and distributions from net realized gain of $.015 per share.
See accompanying notes which are an integral part of the financial statements.
Annual Report
Financial Highlights - Emerging Europe, Middle East, Africa (EMEA)
Years ended October 31, | 2013 | 2012 | 2011 | 2010 | 2009 |
Selected Per-Share Data | | | | | |
Net asset value, beginning of period | $ 8.75 | $ 8.37 | $ 9.00 | $ 7.28 | $ 4.76 |
Income from Investment Operations | | | | | |
Net investment income (loss) B | .18 | .20 | .18 E | .09 | .07 |
Net realized and unrealized gain (loss) | .84 | .35 | (.71) | 1.70 | 2.48 |
Total from investment operations | 1.02 | .55 | (.53) | 1.79 | 2.55 |
Distributions from net investment income | (.18) | (.17) | (.09) | (.05) | (.04) |
Distributions from net realized gain | (.07) | - | (.02) | (.02) | - |
Total distributions | (.25) | (.17) | (.11) | (.08) H | (.04) |
Redemption fees added to paid in capital B | - G | - G | .01 | .01 | .01 |
Net asset value, end of period | $ 9.52 | $ 8.75 | $ 8.37 | $ 9.00 | $ 7.28 |
Total Return A | 11.90% | 6.81% | (5.91)% | 24.92% | 54.15% |
Ratios to Average Net Assets C,F | | | | | |
Expenses before reductions | 1.40% | 1.37% | 1.35% | 1.45% | 1.61% |
Expenses net of fee waivers, if any | 1.40% | 1.37% | 1.31% | 1.25% | 1.25% |
Expenses net of all reductions | 1.38% | 1.34% | 1.25% | 1.12% | 1.14% |
Net investment income (loss) | 2.05% | 2.34% | 1.95% E | 1.21% | 1.09% |
Supplemental Data | | | | | |
Net assets, end of period (000 omitted) | $ 110,265 | $ 111,441 | $ 114,117 | $ 140,270 | $ 104,141 |
Portfolio turnover rate D | 64% | 30% | 53% | 96% | 58% |
A Total returns would have been lower if certain expenses had not been reduced during the applicable periods shown.
B Calculated based on average shares outstanding during the period.
C Fees and expenses of any underlying Fidelity Central Funds are not included in the Fund's expense ratio. The Fund indirectly bears its proportionate share of the expenses of any underlying Fidelity Central Funds.
D Amount does not include the portfolio activity of any underlying Fidelity Central Funds.
E Investment income per share reflects a large, non-recurring dividend which amounted to $.04 per share. Excluding this non-recurring dividend, the ratio of net investment income (loss) to average net assets would have been 1.51%.
F Expense ratios reflect operating expenses of the class. Expenses before reductions do not reflect amounts reimbursed by the investment adviser or reductions from brokerage service arrangements or reductions from other expense offset arrangements and do not represent the amount paid by the class during periods when reimbursements or reductions occur. Expenses net of fee waivers reflect expenses after reimbursement by the investment adviser but prior to reductions from brokerage service arrangements or other expense offset arrangements. Expenses net of all reductions represent the net expenses paid by the class.
G Amount represents less than $.01 per share.
H Total distributions of $.08 per share is comprised of distributions from net investment income of $.052 and distributions from net realized gain of $.024 per share.
See accompanying notes which are an integral part of the financial statements.
Annual Report
Financial Highlights - Institutional Class
Years ended October 31, | 2013 | 2012 | 2011 | 2010 | 2009 |
Selected Per-Share Data | | | | | |
Net asset value, beginning of period | $ 8.75 | $ 8.37 | $ 9.00 | $ 7.28 | $ 4.76 |
Income from Investment Operations | | | | | |
Net investment income (loss) B | .19 | .21 | .19 E | .09 | .06 |
Net realized and unrealized gain (loss) | .84 | .35 | (.72) | 1.70 | 2.49 |
Total from investment operations | 1.03 | .56 | (.53) | 1.79 | 2.55 |
Distributions from net investment income | (.19) | (.18) | (.09) | (.05) | (.04) |
Distributions from net realized gain | (.07) | - | (.02) | (.02) | - |
Total distributions | (.26) | (.18) | (.11) | (.08) H | (.04) |
Redemption fees added to paid in capital B | - G | - G | .01 | .01 | .01 |
Net asset value, end of period | $ 9.52 | $ 8.75 | $ 8.37 | $ 9.00 | $ 7.28 |
Total Return A | 12.05% | 6.93% | (5.91)% | 24.95% | 54.15% |
Ratios to Average Net Assets C,F | | | | | |
Expenses before reductions | 1.30% | 1.28% | 1.26% | 1.34% | 1.60% |
Expenses net of fee waivers, if any | 1.30% | 1.28% | 1.24% | 1.25% | 1.25% |
Expenses net of all reductions | 1.28% | 1.25% | 1.19% | 1.13% | 1.14% |
Net investment income (loss) | 2.15% | 2.43% | 2.02% E | 1.20% | 1.09% |
Supplemental Data | | | | | |
Net assets, end of period (000 omitted) | $ 10,231 | $ 8,586 | $ 7,633 | $ 7,171 | $ 4,235 |
Portfolio turnover rate D | 64% | 30% | 53% | 96% | 58% |
A Total returns would have been lower if certain expenses had not been reduced during the applicable periods shown.
B Calculated based on average shares outstanding during the period.
C Fees and expenses of any underlying Fidelity Central Funds are not included in the Fund's expense ratio. The Fund indirectly bears its proportionate share of the expenses of any underlying Fidelity Central Funds.
D Amount does not include the portfolio activity of any underlying Fidelity Central Funds.
E Investment income per share reflects a large, non-recurring dividend which amounted to $.04 per share. Excluding this non-recurring dividend, the ratio of net investment income (loss) to average net assets would have been 1.58%.
F Expense ratios reflect operating expenses of the class. Expenses before reductions do not reflect amounts reimbursed by the investment adviser or reductions from brokerage service arrangements or reductions from other expense offset arrangements and do not represent the amount paid by the class during periods when reimbursements or reductions occur. Expenses net of fee waivers reflect expenses after reimbursement by the investment adviser but prior to reductions from brokerage service arrangements or other expense offset arrangements. Expenses net of all reductions represent the net expenses paid by the class.
G Amount represents less than $.01 per share.
H Total distributions of $.08 per share is comprised of distributions from net investment income of $.054 and distributions from net realized gain of $.024 per share.
See accompanying notes which are an integral part of the financial statements.
Annual Report
Notes to Financial Statements
For the period ended October 31, 2013
1. Organization.
Fidelity Emerging Europe, Middle East, Africa (EMEA) Fund (the Fund) is a fund of Fidelity Investment Trust (the Trust) and is authorized to issue an unlimited number of shares. The Trust is registered under the Investment Company Act of 1940, as amended (the 1940 Act), as an open-end management investment company organized as a Massachusetts business trust. The Fund offers Class A, Class T, Class C, Emerging Europe, Middle East, Africa (EMEA) and Institutional Class shares, each of which, along with Class B shares, has equal rights as to assets and voting privileges. Class B shares are closed to new accounts and additional purchases, except for exchanges and reinvestments. Each class has exclusive voting rights with respect to matters that affect that class. Class B shares will automatically convert to Class A shares after a holding period of seven years from the initial date of purchase. The Fund's investments in emerging markets can be subject to social, economic, regulatory, and political uncertainties and can be extremely volatile.
2. Investments in Fidelity Central Funds.
The Fund invests in Fidelity Central Funds, which are open-end investment companies generally available only to other investment companies and accounts managed by Fidelity Management & Research Company (FMR) and its affiliates. The Fund's Schedule of Investments lists each of the Fidelity Central Funds held as of period end, if any, as an investment of the Fund, but does not include the underlying holdings of each Fidelity Central Fund. As an Investing Fund, the Fund indirectly bears its proportionate share of the expenses of the underlying Fidelity Central Funds.
The Money Market Central Funds seek preservation of capital and current income and are managed by Fidelity Investments Money Management, Inc. (FIMM), an affiliate of FMR.
A complete unaudited list of holdings for each Fidelity Central Fund is available upon request or at the Securities and Exchange Commission (the SEC) website at www.sec.gov. In addition, the financial statements of the Fidelity Central Funds, which are not covered by the Fund's Report of Independent Registered Public Accounting Firm, are available on the SEC website or upon request.
Annual Report
3. Significant Accounting Policies.
The financial statements have been prepared in conformity with accounting principles generally accepted in the United States of America (GAAP), which require management to make certain estimates and assumptions at the date of the financial statements. Actual results could differ from those estimates. Subsequent events, if any, through the date that the financial statements were issued have been evaluated in the preparation of the financial statements. The following summarizes the significant accounting policies of the Fund:
Investment Valuation. Investments are valued as of 4:00 p.m. Eastern time on the last calendar day of the period. In accordance with valuation policies and procedures approved by the Board of Trustees (the Board), the Fund attempts to obtain prices from one or more third party pricing vendors or brokers to value its investments. When current market prices, quotations or currency exchange rates are not readily available or reliable, investments will be fair valued in good faith by the FMR Fair Value Committee (the Committee), in accordance with procedures adopted by the Board. Factors used in determining fair value vary by investment type and may include market or investment specific events. The frequency with which these procedures are used cannot be predicted and they may be utilized to a significant extent. The Committee oversees the Fund's valuation policies and procedures and is responsible for approving and reporting to the Board all fair value determinations.
The Fund categorizes the inputs to valuation techniques used to value its investments into a disclosure hierarchy consisting of three levels as shown below:
Level 1 - quoted prices in active markets for identical investments
Level 2 - other significant observable inputs (including quoted prices for similar investments, interest rates, prepayment speeds, etc.)
Level 3 - unobservable inputs (including the Fund's own assumptions based on the best information available)
Valuation techniques used to value the Fund's investments by major category are as follows:
Equity securities, including restricted securities, for which market quotations are readily available, are valued at the last reported sale price or official closing price as reported by a third party pricing vendor on the primary market or exchange on which they are traded and are categorized as Level 1 in the hierarchy. In the event there were no sales during the day or closing prices are not available, securities are valued at the last quoted bid price or may be valued using the last available price and are generally categorized as Level 2 in the hierarchy. For foreign equity securities, when market or security specific
Annual Report
Notes to Financial Statements - continued
3. Significant Accounting Policies - continued
Investment Valuation - continued
events arise, comparisons to the valuation of American Depositary Receipts (ADRs), futures contracts, Exchange-Traded Funds (ETFs) and certain indexes as well as quoted prices for similar securities may be used and would be categorized as Level 2 in the hierarchy. Utilizing these techniques may result in transfers between Level 1 and Level 2. For equity securities, including restricted securities, where observable inputs are limited, assumptions about market activity and risk are used and these securities may be categorized as Level 3 in the hierarchy.
Investments in open-end mutual funds , including the Fidelity Central Funds, are valued at their closing net asset value (NAV) each business day and are categorized as Level 1 in the hierarchy.
Changes in valuation techniques may result in transfers in or out of an assigned level within the disclosure hierarchy. The aggregate value of investments by input level, as of October 31, 2013, is included at the end of the Fund's Schedule of Investments.
Foreign Currency. The Fund may use foreign currency contracts to facilitate transactions in foreign-denominated securities. Gains and losses from these transactions may arise from changes in the value of the foreign currency or if the counterparties do not perform under the contracts' terms.
Foreign-denominated assets, including investment securities, and liabilities are translated into U.S. dollars at the exchange rates at period end. Purchases and sales of investment securities, income and dividends received and expenses denominated in foreign currencies are translated into U.S. dollars at the exchange rate in effect on the transaction date.
The effects of exchange rate fluctuations on investments are included with the net realized and unrealized gain (loss) on investment securities. Other foreign currency transactions resulting in realized and unrealized gain (loss) are disclosed separately.
Investment Transactions and Income. For financial reporting purposes, the Fund's investment holdings and NAV include trades executed through the end of the last business day of the period. The NAV per share for processing shareholder transactions is calculated as of the close of business of the New York Stock Exchange (NYSE), normally 4:00 p.m. Eastern time and includes trades executed through the end of the prior business day. Gains and losses on securities sold are determined on the basis of identified cost. Dividend income is recorded on the ex-dividend date, except for certain dividends from foreign securities where the ex-dividend date may have passed, which are recorded as soon as the Fund is informed of the ex-dividend date. Non-cash dividends included in dividend income, if any, are recorded at the fair market value of the securities received.
Annual Report
3. Significant Accounting Policies - continued
Investment Transactions and Income - continued
Interest income and distributions from the Fidelity Central Funds are accrued as earned. Interest income includes coupon interest and amortization of premium and accretion of discount on debt securities. Investment income is recorded net of foreign taxes withheld where recovery of such taxes is uncertain.
Class Allocations and Expenses. Investment income, realized and unrealized capital gains and losses, common expenses of the Fund, and certain fund-level expense reductions, if any, are allocated daily on a pro-rata basis to each class based on the relative net assets of each class to the total net assets of the Fund. Each class differs with respect to transfer agent and distribution and service plan fees incurred. Certain expense reductions may also differ by class. For the reporting period, the allocated portion of income and expenses to each class as a percent of its average net assets may vary due to the timing of recording these transactions in relation to fluctuating net assets of the classes. Expenses directly attributable to a fund are charged to that fund. Expenses attributable to more than one fund are allocated among the respective funds on the basis of relative net assets or other appropriate methods. Expense estimates are accrued in the period to which they relate and adjustments are made when actual amounts are known.
Income Tax Information and Distributions to Shareholders. Each year, the Fund intends to qualify as a regulated investment company under Subchapter M of the Internal Revenue Code, including distributing substantially all of its taxable income and realized gains. As a result, no provision for U.S. Federal income taxes is required. As of October 31, 2013, the Fund did not have any unrecognized tax benefits in the financial statements; nor is the Fund aware of any tax positions for which it is reasonably possible that the total amounts of unrecognized tax benefits will significantly change in the next twelve months. The Fund files a U.S. federal tax return, in addition to state and local tax returns as required. The Fund's federal income tax returns are subject to examination by the Internal Revenue Service (IRS) for a period of three fiscal years after they are filed. State and local tax returns may be subject to examination for an additional fiscal year depending on the jurisdiction. Foreign taxes are provided for based on the Fund's understanding of the tax rules and rates that exist in the foreign markets in which it invests.
Distributions are declared and recorded on the ex-dividend date. Income dividends and capital gain distributions are declared separately for each class. Income and capital gain distributions are determined in accordance with income tax regulations, which may differ from GAAP. In addition, the Fund claimed a portion of the payment made to redeeming shareholders as a distribution for income tax purposes.
Annual Report
Notes to Financial Statements - continued
3. Significant Accounting Policies - continued
Income Tax Information and Distributions to Shareholders - continued
Capital accounts within the financial statements are adjusted for permanent book-tax differences. These adjustments have no impact on net assets or the results of operations. Temporary book-tax differences will reverse in a subsequent period.
Book-tax differences are primarily due to foreign currency transactions, passive foreign investment companies (PFIC), capital loss carryforwards and losses deferred due to wash sales.
The federal tax cost of investment securities and unrealized appreciation (depreciation) as of period end were as follows:
Gross unrealized appreciation | $ 25,331,074 |
Gross unrealized depreciation | (12,631,422) |
Net unrealized appreciation (depreciation) on securities and other investments | $ 12,699,652 |
| |
Tax Cost | $ 128,990,502 |
The tax-based components of distributable earnings as of period end were as follows:
Undistributed ordinary income | $ 1,897,738 |
Capital loss carryforward | $ (1,624,705) |
Net unrealized appreciation (depreciation) | $ 12,710,489 |
Capital loss carryforwards are only available to offset future capital gains of the Fund to the extent provided by regulations and may be limited. Under the Regulated Investment Company Modernization Act of 2010 (the Act), the Fund is permitted to carry forward capital losses incurred in taxable years beginning after December 22, 2010 for an unlimited period and such capital losses are required to be used prior to any losses that expire. The capital loss carryforward information presented below, including any applicable limitation, is estimated as of fiscal period end and is subject to adjustment.
Fiscal year of expiration | |
2018 | $ (1,624,705) |
The tax character of distributions paid was as follows:
| October 31, 2013 | October 31, 2012 |
Ordinary Income | $ 3,874,609 | $ 2,782,952 |
Annual Report
3. Significant Accounting Policies - continued
Short-Term Trading (Redemption) Fees. Shares held by investors in the Fund less than 90 days may have been subject to a redemption fee equal to 1.50% of the net asset value of shares redeemed. All redemption fees, which reduce the proceeds of the shareholder redemption, are retained by the Fund and accounted for as an addition to paid in capital.
4. Purchases and Sales of Investments.
Purchases and sales of securities, other than short-term securities, aggregated $89,166,804 and $94,656,093, respectively.
5. Fees and Other Transactions with Affiliates.
Management Fee. FMR and its affiliates provide the Fund with investment management related services for which the Fund pays a monthly management fee. The management fee is the sum of an individual fund fee rate that is based on an annual rate of .55% of the Fund's average net assets and an annualized group fee rate that averaged .25% during the period. The group fee rate is based upon the average net assets of all the mutual funds advised by FMR, including any mutual funds previously advised by FMR that are currently advised by Fidelity SelectCo, LLC, an affiliate of FMR. The group fee rate decreases as assets under management increase and increases as assets under management decrease. For the reporting period, the total annual management fee rate was .81% of the Fund's average net assets.
Distribution and Service Plan Fees. In accordance with Rule 12b-1 of the 1940 Act, the Fund has adopted separate Distribution and Service Plans for each class of shares. Certain classes pay Fidelity Distributors Corporation (FDC), an affiliate of FMR, separate Distribution and Service Fees, each of which is based on an annual percentage of each class' average net assets. In addition, FDC may pay financial intermediaries for selling shares of the Fund and providing shareholder support services. For the period, the Distribution and Service Fee rates, total fees and amounts retained by FDC were as follows:
| Distribution
Fee | Service
Fee | Total Fees | Retained
by FDC |
Class A | -% | .25% | $ 24,760 | $ 2,563 |
Class T | .25% | .25% | 16,204 | 44 |
Class B | .75% | .25% | 4,216 | 3,167 |
Class C | .75% | .25% | 68,900 | 7,692 |
| | | $ 114,080 | $ 13,466 |
Annual Report
Notes to Financial Statements - continued
5. Fees and Other Transactions with Affiliates - continued
Sales Load. FDC may receive a front-end sales charge of up to 5.75% for selling Class A shares and 3.50% for selling Class T shares, some of which is paid to financial intermediaries for selling shares of the Fund. Depending on the holding period, FDC may receive contingent deferred sales charges levied on Class A, Class T, Class B, and Class C redemptions. The deferred sales charges range from 5.00% to 1.00% for Class B shares, 1.00% for Class C shares, 1.00% for certain purchases of Class A shares and .25% for certain purchases of Class T shares.
For the period, sales charge amounts retained by FDC were as follows:
| Retained
by FDC |
Class A | $ 5,196 |
Class T | 1,770 |
Class B* | 1,462 |
Class C* | 1,024 |
| $ 9,452 |
* When Class B and Class C shares are initially sold, FDC pays commissions from its own resources to financial intermediaries through which the sales
are made.
Transfer Agent Fees. Fidelity Investments Institutional Operations Company, Inc., (FIIOC), an affiliate of FMR, is the transfer, dividend disbursing and shareholder servicing agent for each class of the Fund. FIIOC receives account fees and asset-based fees that vary according to the account size and type of account of the shareholders of the respective classes of the Fund. FIIOC pays for typesetting, printing and mailing of shareholder reports, except proxy statements.
For the period, transfer agent fees for each class were as follows:
| Amount | % of
Average
Net Assets |
Class A | $ 26,574 | .27 |
Class T | 10,190 | .31 |
Class B | 1,263 | .30 |
Class C | 20,625 | .30 |
Emerging Europe, Middle East, Africa (EMEA) | 323,311 | .28 |
Institutional Class | 16,491 | .18 |
| $ 398,454 | |
Annual Report
5. Fees and Other Transactions with Affiliates - continued
Accounting and Security Lending Fees. Fidelity Service Company, Inc. (FSC), an affiliate of FMR, maintains the Fund's accounting records. The accounting fee is based on the level of average net assets for each month. Under a separate contract, FSC administers the security lending program. The security lending fee is based on the number and duration of lending transactions.
Brokerage Commissions. The Fund placed a portion of its portfolio transactions with brokerage firms which are affiliates of the investment adviser. Brokerage commissions are included in net realized gain (loss) and change in net unrealized appreciation (depreciation) in the Statement of Operations. The commissions paid to these affiliated firms were $17 for the period.
6. Committed Line of Credit.
The Fund participates with other funds managed by FMR or an affiliate in a $4.25 billion credit facility (the "line of credit") to be utilized for temporary or emergency purposes to fund shareholder redemptions or for other short-term liquidity purposes. The Fund has agreed to pay commitment fees on its pro-rata portion of the line of credit, which amounted to $318 and is reflected in Miscellaneous expenses on the Statement of Operations. During the period, there were no borrowings on this line of credit.
7. Security Lending.
The Fund lends portfolio securities through a lending agent from time to time in order to earn additional income. For equity securities, a lending agent is used and may loan securities to certain qualified borrowers, including Fidelity Capital Markets (FCM), a broker-dealer affiliated with the Fund. On the settlement date of the loan, the Fund receives collateral (in the form of U.S. Treasury obligations, letters of credit and/or cash) against the loaned securities and maintains collateral in an amount not less than 100% of the market value of the loaned securities during the period of the loan. The market value of the loaned securities is determined at the close of business of the Fund and any additional required collateral is delivered to the Fund on the next business day. If the borrower defaults on its obligation to return the securities loaned because of insolvency or other reasons, the Fund may apply collateral received from the borrower against the obligation. The Fund may experience delays and costs in recovering the securities loaned. Any cash collateral received is invested in the Fidelity Securities Lending Cash Central Fund. At period end, there were no security loans outstanding. Security lending income represents the income earned on investing cash collateral, less rebates paid to borrowers and any lending agent fees associated with the loan, plus any premium payments received for lending certain types of securities. Security lending income is
Annual Report
Notes to Financial Statements - continued
7. Security Lending - continued
presented in the Statement of Operations as a component of income from Fidelity Central Funds. Total security lending income during the period amounted to $4,818. During the period, there were no securities loaned to FCM.
8. Expense Reductions.
FMR voluntarily agreed to reimburse each class to the extent annual operating expenses exceeded certain levels of average net assets as noted in the table below. Some expenses, for example interest expense, including commitment fees, are excluded from this reimbursement.
The following classes were in reimbursement during the period:
| Expense
Limitations | Reimbursement |
Class T | 1.90% | $ 1,038 |
Class B | 2.40% | 83 |
Class C | 2.40% | 1,453 |
Emerging Europe, Middle East, Africa (EMEA) | 1.40% | 2,450 |
| | $ 5,024 |
Commissions paid to certain brokers with whom FMR, or its affiliates, places trades on behalf of the Fund include an amount in addition to trade execution, which may be rebated back to the Fund to offset certain expenses. This amount totaled $26,766 for the period.
In addition, FMR reimbursed a portion of the Fund's operating expenses during the period in the amount of $3,800.
9. Distributions to Shareholders.
Distributions to shareholders of each class were as follows:
Years ended October 31, | 2013 | 2012 |
From net investment income | | |
Class A | $ 155,525 | $ 173,376 |
Class T | 46,756 | 52,030 |
Class B | 2,757 | 3,592 |
Class C | 69,716 | 61,819 |
Emerging Europe, Middle East, Africa (EMEA) | 2,222,632 | 2,310,485 |
Institutional Class | 192,599 | 181,650 |
Total | $ 2,689,985 | $ 2,782,952 |
Annual Report
9. Distributions to Shareholders - continued
Years ended October 31, | 2013 | 2012 |
From net realized gain | | |
Class A | $ 76,218 | $ - |
Class T | 28,360 | - |
Class B | 3,579 | - |
Class C | 66,141 | - |
Emerging Europe, Middle East, Africa (EMEA) | 934,516 | - |
Institutional Class | 75,810 | - |
Total | $ 1,184,624 | $ - |
10. Share Transactions.
Transactions for each class of shares were as follows:
| Shares | Dollars |
Years ended October 31, | 2013 | 2012 | 2013 | 2012 |
Class A | | | | |
Shares sold | 422,392 | 188,687 | $ 3,786,551 | $ 1,610,923 |
Reinvestment of distributions | 20,821 | 16,919 | 182,599 | 134,509 |
Shares redeemed | (321,728) | (411,198) | (2,828,311) | (3,440,999) |
Net increase (decrease) | 121,485 | (205,592) | $ 1,140,839 | $ (1,695,567) |
Class T | | | | |
Shares sold | 88,958 | 75,037 | $ 793,473 | $ 636,446 |
Reinvestment of distributions | 8,485 | 6,513 | 74,325 | 51,713 |
Shares redeemed | (115,399) | (118,919) | (1,019,893) | (995,876) |
Net increase (decrease) | (17,956) | (37,369) | $ (152,095) | $ (307,717) |
Class B | | | | |
Shares sold | 10,659 | 2,520 | $ 95,440 | $ 21,721 |
Reinvestment of distributions | 679 | 430 | 5,999 | 3,432 |
Shares redeemed | (21,228) | (17,241) | (189,688) | (147,235) |
Net increase (decrease) | (9,890) | (14,291) | $ (88,249) | $ (122,082) |
Class C | | | | |
Shares sold | 249,509 | 337,293 | $ 2,176,685 | $ 2,767,333 |
Reinvestment of distributions | 12,615 | 7,082 | 110,128 | 56,016 |
Shares redeemed | (441,523) | (250,062) | (3,878,247) | (2,064,165) |
Net increase (decrease) | (179,399) | 94,313 | $ (1,591,434) | $ 759,184 |
Emerging Europe, Middle East, Africa (EMEA) | | | | |
Shares sold | 4,724,612 | 3,688,393 | $ 42,683,733 | $ 31,635,971 |
Reinvestment of distributions | 341,639 | 276,215 | 2,999,595 | 2,198,675 |
Shares redeemed | (6,228,497) | (4,854,267) | (55,025,066) | (40,803,317) |
Net increase (decrease) | (1,162,246) | (889,659) | $ (9,341,738) | $ (6,968,671) |
Annual Report
Notes to Financial Statements - continued
10. Share Transactions - continued
| Shares | Dollars |
Years ended October 31, | 2013 | 2012 | 2013 | 2012 |
Institutional Class | | | | |
Shares sold | 478,817 | 336,442 | $ 4,308,546 | $ 2,842,158 |
Reinvestment of distributions | 10,415 | 5,723 | 91,338 | 45,553 |
Shares redeemed | (396,145) | (272,120) | (3,464,870) | (2,242,112) |
Net increase (decrease) | 93,087 | 70,045 | $ 935,014 | $ 645,599 |
11. Other.
The Fund's organizational documents provide former and current trustees and officers with a limited indemnification against liabilities arising in connection with the performance of their duties to the Fund. In the normal course of business, the Fund may also enter into contracts that provide general indemnifications. The Fund's maximum exposure under these arrangements is unknown as this would be dependent on future claims that may be made against the Fund. The risk of material loss from such claims is considered remote.
Annual Report
To the Trustees of Fidelity Investment Trust and Shareholders of Fidelity Emerging Europe, Middle East, Africa (EMEA) Fund:
We have audited the accompanying statement of assets and liabilities of Fidelity Emerging Europe, Middle East, Africa (EMEA) Fund (the Fund), a fund of Fidelity Investment Trust, including the schedule of investments, as of October 31, 2013, and the related statement of operations for the year then ended, the statement of changes in net assets for each of the two years in the period then ended, and the financial highlights for each of the five years in the period then ended. These financial statements and financial highlights are the responsibility of the Fund's management. Our responsibility is to express an opinion on these financial statements and financial highlights based on our audits.
We conducted our audits in accordance with the standards of the Public Company Accounting Oversight Board (United States). Those standards require that we plan and perform the audit to obtain reasonable assurance about whether the financial statements and financial highlights are free of material misstatement. The Fund is not required to have, nor were we engaged to perform, an audit of its internal control over financial reporting. Our audits included consideration of internal control over financial reporting as a basis for designing audit procedures that are appropriate in the circumstances, but not for the purpose of expressing an opinion on the effectiveness of the Fund's internal control over financial reporting. Accordingly, we express no such opinion. An audit also includes examining, on a test basis, evidence supporting the amounts and disclosures in the financial statements, assessing the accounting principles used and significant estimates made by management, as well as evaluating the overall financial statement presentation. Our procedures included confirmation of securities owned as of October 31, 2013, by correspondence with the custodians and brokers; where replies were not received from brokers, we performed other auditing procedures. We believe that our audits provide a reasonable basis for our opinion.
In our opinion, the financial statements and financial highlights referred to above present fairly, in all material respects, the financial position of Fidelity Emerging Europe, Middle East, Africa (EMEA) Fund as of October 31, 2013, the results of its operations for the year then ended, the changes in its net assets for each of the two years in the period then ended, and the financial highlights for each of the five years in the period then ended, in conformity with accounting principles generally accepted in the United States of America.
DELOITTE & TOUCHE LLP
Boston, Massachusetts
December 13, 2013
Annual Report
The Trustees, Member of the Advisory Board, and executive officers of the trust and fund, as applicable, are listed below. The Board of Trustees governs the fund and is responsible for protecting the interests of shareholders. The Trustees are experienced executives who meet periodically throughout the year to oversee the fund's activities, review contractual arrangements with companies that provide services to the fund, oversee management of the risks associated with such activities and contractual arrangements, and review the fund's performance. Except for James C. Curvey, Ned C. Lautenbach, Ronald P. O'Hanley, and William S. Stavropoulos, each of the Trustees oversees 171 funds. Mr. Curvey oversees 394 funds. Mr. Lautenbach, Mr. O'Hanley, and Mr. Stavropoulos each oversees 245 funds.
The Trustees hold office without limit in time except that (a) any Trustee may resign; (b) any Trustee may be removed by written instrument, signed by at least two-thirds of the number of Trustees prior to such removal; (c) any Trustee who requests to be retired or who has become incapacitated by illness or injury may be retired by written instrument signed by a majority of the other Trustees; and (d) any Trustee may be removed at any special meeting of shareholders by a two-thirds vote of the outstanding voting securities of the trust. Each Trustee who is not an interested person of the trust and the fund (as defined in the 1940 Act) (Independent Trustee), shall retire not later than the last day of the calendar year in which his or her 75th birthday occurs. The Independent Trustees may waive this mandatory retirement age policy with respect to individual Trustees. The executive officers and Advisory Board Member hold office without limit in time, except that any officer and Advisory Board Member may resign or may be removed by a vote of a majority of the Trustees at any regular meeting or any special meeting of the Trustees. Except as indicated, each individual has held the office shown or other offices in the same company for the past five years.
Experience, Skills, Attributes, and Qualifications of the Fund's Trustees. The Governance and Nominating Committee has adopted a statement of policy that describes the experience, qualifications, attributes, and skills that are necessary and desirable for potential Independent Trustee candidates (Statement of Policy). The Board believes that each Trustee satisfied at the time he or she was initially elected or appointed a Trustee, and continues to satisfy, the standards contemplated by the Statement of Policy. The Governance and Nominating Committee also engages professional search firms to help identify potential Independent Trustee candidates who have the experience, qualifications, attributes, and skills consistent with the Statement of Policy. From time to time, additional criteria based on the composition and skills of the current Independent Trustees, as well as experience or skills that may be appropriate in light of future changes to board composition, business conditions, and regulatory or other developments, have also been considered by the professional search firms and the Governance and Nominating Committee. In addition, the Board takes into account the Trustees' commitment and participation in Board and committee meetings, as well as their leadership of standing and ad hoc committees throughout their tenure.
Annual Report
Trustees and Officers - continued
In determining that a particular Trustee was and continues to be qualified to serve as a Trustee, the Board has considered a variety of criteria, none of which, in isolation, was controlling. The Board believes that, collectively, the Trustees have balanced and diverse experience, qualifications, attributes, and skills, which allow the Board to operate effectively in governing the fund and protecting the interests of shareholders. Information about the specific experience, skills, attributes, and qualifications of each Trustee, which in each case led to the Board's conclusion that the Trustee should serve (or continue to serve) as a trustee of the fund, is provided below.
Board Structure and Oversight Function. James C. Curvey is an interested person (as defined in the 1940 Act) and currently serves as Chairman. The Trustees have determined that an interested Chairman is appropriate and benefits shareholders because an interested Chairman has a personal and professional stake in the quality and continuity of services provided to the fund. Independent Trustees exercise their informed business judgment to appoint an individual of their choosing to serve as Chairman, regardless of whether the Trustee happens to be independent or a member of management. The Independent Trustees have determined that they can act independently and effectively without having an Independent Trustee serve as Chairman and that a key structural component for assuring that they are in a position to do so is for the Independent Trustees to constitute a substantial majority for the Board. The Independent Trustees also regularly meet in executive session. Ned C. Lautenbach serves as Chairman of the Independent Trustees and as such (i) acts as a liaison between the Independent Trustees and management with respect to matters important to the Independent Trustees and (ii) with management prepares agendas for Board meetings.
Fidelity funds are overseen by different Boards of Trustees. The fund's Board oversees Fidelity's equity and high income funds and another Board oversees Fidelity's investment-grade bond, money market, and asset allocation funds. The asset allocation funds may invest in Fidelity funds overseen by the fund's Board. The use of separate Boards, each with its own committee structure, allows the Trustees of each group of Fidelity funds to focus on the unique issues of the funds they oversee, including common research, investment, and operational issues. On occasion, the separate Boards establish joint committees to address issues of overlapping consequences for the Fidelity funds overseen by each Board.
The Trustees operate using a system of committees to facilitate the timely and efficient consideration of all matters of importance to the Trustees, the fund, and fund shareholders and to facilitate compliance with legal and regulatory requirements and oversight of the fund's activities and associated risks. The Board, acting through its committees, has charged FMR and its affiliates with (i) identifying events or circumstances the occurrence of which could have demonstrably adverse effects on the fund's business and/or reputation; (ii) implementing processes and controls to lessen the possibility that such events or circumstances occur or to mitigate the effects of such events or circumstances if they do occur; and (iii) creating and maintaining a system designed to evaluate continuously business and market conditions in order to facilitate the identification and implementation processes described in (i) and (ii) above. Because the day-to-day operations and activities of the fund are carried out by or through FMR, its affiliates and other service providers, the fund's exposure to risks is mitigated but not eliminated by the processes overseen by the Trustees. While each of the Board's committees has responsibility for overseeing different aspects of the fund's activities, oversight is exercised primarily through the Operations, Audit, and Compliance Committees. In addition, the Independent Trustees have worked with FMR to enhance the Board's oversight of investment and financial risks, legal and regulatory risks, technology risks, and operational risks, including the development of additional risk reporting to the Board. For example, a working group comprised of Independent Trustees and FMR has worked and continues to work to review the Fidelity funds' valuation-related activities, reporting and risk management. Appropriate personnel, including but not limited to the fund's Chief Compliance Officer (CCO), FMR's internal auditor, the independent accountants, the fund's Treasurer and portfolio management personnel, make periodic reports to the Board's committees, as appropriate, including an annual review of FMR's risk management program for the Fidelity funds. The responsibilities of each standing committee, including their oversight responsibilities, are described further under "Standing Committees of the Fund's Trustees."
Annual Report
The fund's Statement of Additional Information (SAI) includes more information about the Trustees. To request a free copy, call Fidelity at 1-877-208-0098.
Interested Trustees*:
Correspondence intended for each Trustee who is an interested person may be sent to Fidelity Investments, 245 Summer Street, Boston, Massachusetts 02210.
Name, Year of Birth; Principal Occupations and Other Relevant Experience+ |
James C. Curvey (1935) |
Year of Election or Appointment: 2007 Trustee Chairman of the Board of Trustees |
| Mr. Curvey also serves as Trustee of other Fidelity funds. Mr. Curvey is a Director of Fidelity Investments Money Management, Inc. (2009-present), Director of Fidelity Research & Analysis Co. (2009-present) and Director of FMR and FMR Co., Inc. (2007-present). Mr. Curvey is also Vice Chairman (2007-present) and Director of FMR LLC. In addition, Mr. Curvey serves as an Overseer for the Boston Symphony Orchestra and a member of the Trustees of Villanova University. Previously, Mr. Curvey was the Vice Chairman (2006-2007) and Director (2000-2007) of FMR Corp. |
Ronald P. O'Hanley (1957) |
Year of Election or Appointment: 2011 Trustee |
| Mr. O'Hanley also serves as Trustee of other Fidelity funds. He is Director of Fidelity SelectCo, LLC (2013-present), FMR Co., Inc. (2010-present), Director of Fidelity Investments Money Management, Inc. (2010-present), Director of Fidelity Research & Analysis Company (2010-present), President of Fidelity Asset Management and Corporate Services and a Member of Fidelity's Executive Committee (2010-present). Previously, Mr. O'Hanley served as President and Chief Executive Officer of BNY Mellon Asset Management (2007-2010). Mr. O'Hanley also served as Vice Chairman of Bank New York Mellon Corp. and a member of that firm's Executive Committee. Prior to the 2007 merger of The Bank of New York and Mellon Financial Corporation, he was Vice Chairman of Mellon Financial Corporation and President and Chief Executive Officer of Mellon Asset Management. He joined Mellon in February 1997. Mr. O'Hanley currently serves as Chairman of the Boston Public Library Foundation Board of Directors and sits on the Board of Directors of Beth Israel Deaconess Medical Center, the Board of Trustees of the Marine Biological Laboratory and the Advisory Board of the Maxwell School of Citizenship and Public Administration at Syracuse University. Mr. O'Hanley also chairs the Council on Asset Management for the Financial Services Roundtable and is a member of the Board of Directors of Institutional Investor's U.S. Institute. |
* Trustees have been determined to be "Interested Trustees" by virtue of, among other things, their affiliation with the trust or various entities under common control with FMR.
+ The information above includes each Trustee's principal occupation during the last five years and other information relating to the experience, attributes, and skills relevant to each Trustee's qualifications to serve as a Trustee, which led to the conclusion that each Trustee should serve as a Trustee for the fund.
Annual Report
Independent Trustees:
Correspondence intended for each Independent Trustee (that is, the Trustees other than the Interested Trustees) may be sent to Fidelity Investments, P.O. Box 55235, Boston, Massachusetts 02205-5235.
Name, Year of Birth; Principal Occupations and Other Relevant Experience+ |
Dennis J. Dirks (1948) |
Year of Election or Appointment: 2005 Trustee |
| Mr. Dirks also serves as Trustee of other Fidelity funds. Prior to his retirement in May 2003, Mr. Dirks was Chief Operating Officer and a member of the Board of The Depository Trust & Clearing Corporation (DTCC). He also served as President, Chief Operating Officer, and Board member of The Depository Trust Company (DTC) and President and Board member of the National Securities Clearing Corporation (NSCC). In addition, Mr. Dirks served as Chief Executive Officer and Board member of the Government Securities Clearing Corporation, Chief Executive Officer and Board member of the Mortgage-Backed Securities Clearing Corporation, as a Trustee and a member of the Finance Committee of Manhattan College (2005-2008), and as a Trustee and a member of the Finance Committee of AHRC of Nassau County (2006-2008). Mr. Dirks is a member of the Independent Directors Council (IDC) Governing Council (2010-present) and Board of Directors for The Brookville Center for Children's Services, Inc. (2009-present). |
Alan J. Lacy (1953) |
Year of Election or Appointment: 2008 Trustee |
| Mr. Lacy also serves as Trustee of other Fidelity funds. Mr. Lacy serves as Senior Adviser (2007-present) of Oak Hill Capital Partners, L.P. (private equity). Mr. Lacy also served as Chief Executive Officer (2000-2005) and Vice Chairman (2005-2006) of Sears Holdings Corporation and Sears, Roebuck and Co. (retail). In addition, Mr. Lacy serves as a member of the Board of Directors of Dave & Buster's Entertainment, Inc. (restaurant and entertainment complexes, 2010-present), Earth Fare, Inc. (retail grocery, 2012-present), The Hillman Companies, Inc. (hardware wholesalers, 2010-present), and Bristol-Myers Squibb Company (global pharmaceuticals, 2008-present). Mr. Lacy is a member of the Board of Trustees of The National Parks Conservation Association (2006-present). Previously, Mr. Lacy served as Chairman of the Board of Trustees of the National Parks Conservation Association (2008-2011) and as a member of the Board of Directors for the Western Union Company (global money transfer, 2006-2011). |
Ned C. Lautenbach (1944) |
Year of Election or Appointment: 2000 Trustee Chairman of the Independent Trustees |
| Mr. Lautenbach also serves as Trustee of other Fidelity funds. Mr. Lautenbach currently serves as the Lead Director of the Eaton Corporation Board of Directors (diversified industrial, 1997-present). Mr. Lautenbach is Chairman of the Board of Directors of the Philharmonic Center for the Arts in Naples, Florida (2012-present) and a member of the Council on Foreign Relations (1994-present). Previously, Mr. Lautenbach was a Partner/Advisory Partner at Clayton, Dubilier & Rice, LLC (private equity investment, 1998-2010), as well as a Director of Sony Corporation (2006-2007). |
Joseph Mauriello (1944) |
Year of Election or Appointment: 2008 Trustee |
| Mr. Mauriello also serves as Trustee of other Fidelity funds. Prior to his retirement in January 2006, Mr. Mauriello served in numerous senior management positions including Deputy Chairman and Chief Operating Officer (2004-2005), and Vice Chairman of Financial Services (2002-2004) of KPMG LLP US (professional services, 1965-2005). Mr. Mauriello currently serves as a member of the Board of Directors of XL Group plc. (global insurance and re-insurance, 2006-present). Previously, Mr. Mauriello served as a Director of the Hamilton Funds of the Bank of New York (2006-2007) and of Arcadia Resources Inc. (health care services and products, 2007-2012). |
Robert W. Selander (1950) |
Year of Election or Appointment: 2011 Trustee |
| Mr. Selander also serves as Trustee of other Fidelity funds. Previously, Mr. Selander served as a Member of the Advisory Board of other Fidelity funds (2011), and Executive Vice Chairman (2010), Chief Executive Officer (2009-2010), and President and Chief Executive Officer (1997-2009) of Mastercard, Inc. |
Cornelia M. Small (1944) |
Year of Election or Appointment: 2005 Trustee |
| Ms. Small also serves as Trustee of other Fidelity funds. Ms. Small is a member of the Board of Directors (2009-present) and Chair of the Investment Committee (2010-present) of the Teagle Foundation. Ms. Small also serves on the Investment Committee of the Berkshire Taconic Community Foundation (2008-present). Previously, Ms. Small served as Chairperson (2002-2008) and a member of the Investment Committee and Chairperson (2008-2012) and a member of the Board of Trustees of Smith College. In addition, Ms. Small served as Chief Investment Officer, Director of Global Equity Investments, and a member of the Board of Directors of Scudder, Stevens & Clark and Scudder Kemper Investments. |
William S. Stavropoulos (1939) |
Year of Election or Appointment: 2001 Trustee Vice Chairman of the Independent Trustees |
| Mr. Stavropoulos also serves as Trustee of other Fidelity funds. Mr. Stavropoulos serves as President and Founder of the Michigan Baseball Foundation, the Great Lakes Loons (2007-present). Mr. Stavropoulos is Chairman Emeritus of the Board of Directors of The Dow Chemical Company, where he previously served in numerous senior management positions, including President, CEO (1995-2000; 2002-2004), Chairman of the Executive Committee (2000-2006), and as a member of the Board of Directors (1990-2006). Currently, Mr. Stavropoulos is Chairman of the Board of Directors of Univar Inc. (global distributor of commodity and specialty chemicals), a Director of Teradata Corporation (data warehousing and technology solutions), and Maersk Inc. (industrial conglomerate), and a member of the Advisory Board for Metalmark Capital LLC (private equity investment, 2005-present). Mr. Stavropoulos is an operating advisor to Clayton, Dubilier & Rice, LLC (private equity investment). In addition, Mr. Stavropoulos is a member of the University of Notre Dame Advisory Council for the College of Science, a Trustee of the Rollin L. Gerstacker Foundation, and a Director of the Naples Philharmonic Center for the Arts. Previously, Mr. Stavropoulos served as a Director of Chemical Financial Corporation (bank holding company, 1993-2012) and Tyco International, Ltd. (multinational manufacturing and services, 2007-2012). |
David M. Thomas (1949) |
Year of Election or Appointment: 2008 Trustee |
| Mr. Thomas also serves as Trustee of other Fidelity funds. Mr. Thomas serves as Non-Executive Chairman of the Board of Directors of Fortune Brands Home and Security (home and security products, 2011-present), and as a member of the Board of Directors of Interpublic Group of Companies, Inc. (marketing communication, 2004-present). Previously, Mr. Thomas served as Executive Chairman (2005-2006) and Chairman and Chief Executive Officer (2000-2005) of IMS Health, Inc. (pharmaceutical and healthcare information solutions), and a Director of Fortune Brands, Inc. (consumer products, 2000-2011). |
+ The information above includes each Trustee's principal occupation during the last five years and other information relating to the experience, attributes, and skills relevant to each Trustee's qualifications to serve as a Trustee, which led to the conclusion that each Trustee should serve as a Trustee for the fund.
Advisory Board Member and Executive Officers:
Correspondence intended for each executive officer and Peter S. Lynch may be sent to Fidelity Investments, 245 Summer Street, Boston, Massachusetts 02210. Executive officers appear below in alphabetical order.
Name, Year of Birth; Principal Occupation |
Peter S. Lynch (1944) |
Year of Election or Appointment: 2003 Member of the Advisory Board |
| Mr. Lynch also serves as Member of the Advisory Board of other Fidelity funds. Mr. Lynch is Vice Chairman and a Director of FMR and FMR Co., Inc. In addition, Mr. Lynch serves as a Trustee of Boston College and as the Chairman of the Inner-City Scholarship Fund. Previously, Mr. Lynch served on the Special Olympics International Board of Directors (1997-2006). |
Elizabeth Paige Baumann (1968) |
Year of Election or Appointment: 2012 Anti-Money Laundering (AML) Officer |
| Ms. Baumann also serves as AML Officer of other funds. She is Chief AML Officer of FMR LLC (2012-present) and is an employee of Fidelity Investments. Previously, Ms. Baumann served as Vice President and Deputy Anti-Money Laundering Officer (2007-2012). |
William C. Coffey (1969) |
Year of Election or Appointment: 2009 Assistant Secretary |
| Mr. Coffey also serves as Assistant Secretary of other funds. He is Senior Vice President and Deputy General Counsel of FMR LLC (2010-present), and is an employee of Fidelity Investments. Previously, Mr. Coffey served as Vice President and Associate General Counsel of FMR LLC (2005-2009). |
Jonathan Davis (1968) |
Year of Election or Appointment: 2010 Assistant Treasurer |
| Mr. Davis also serves as Assistant Treasurer of other funds. Mr. Davis is an employee of Fidelity Investments. Previously, Mr. Davis served as Vice President and Associate General Counsel of FMR LLC (2003-2010). |
Adrien E. Deberghes (1967) |
Year of Election or Appointment: 2008 Deputy Treasurer |
| Mr. Deberghes also serves as an officer of other funds. He is an employee of Fidelity Investments (2008-present). Prior to joining Fidelity Investments, Mr. Deberghes was Senior Vice President of Mutual Fund Administration at State Street Corporation (2007-2008), Senior Director of Mutual Fund Administration at Investors Bank & Trust (2005-2007), and Director of Finance for Dunkin' Brands (2000-2005). |
Stephanie J. Dorsey (1969) |
Year of Election or Appointment: 2010 Assistant Treasurer |
| Ms. Dorsey also serves as an officer of other funds. She is an employee of Fidelity Investments (2008-present) and has served in other fund officer roles. Prior to joining Fidelity Investments, Ms. Dorsey served as Treasurer (2004-2008) of the JPMorgan Mutual Funds and Vice President (2004-2008) of JPMorgan Chase Bank. |
Scott C. Goebel (1968) |
Year of Election or Appointment: 2008 Secretary and Chief Legal Officer (CLO) |
| Mr. Goebel serves as Secretary and CLO of other funds. Mr. Goebel also serves as Secretary of Fidelity Investments Money Management, Inc. (FIMM) (2010-present) and Fidelity Research and Analysis Company (FRAC) (2010-present); General Counsel, Secretary, and Senior Vice President of FMR (2008-present) and FMR Co., Inc. (2008-present); Chief Legal Officer of Fidelity Management & Research (Hong Kong) Limited (2008-present) and Assistant Secretary of Fidelity Management & Research (Japan) Inc. (2008-present), and Fidelity Management & Research (U.K.) Inc. (2008-present). Previously, Mr. Goebel served as Secretary and CLO of other Fidelity funds (2008-2013), Assistant Secretary of FIMM (2008-2010), FRAC (2008-2010), and certain funds (2007-2008); and as Vice President and Secretary of Fidelity Distributors Corporation (FDC) (2005-2007). Mr. Goebel has been employed by FMR LLC or an affiliate since 2001. |
Joseph A. Hanlon (1968) |
Year of Election or Appointment: 2012 Chief Compliance Officer |
| Mr. Hanlon also serves as Chief Compliance Officer of other funds. Mr. Hanlon serves as Compliance Officer of FMR, FMR Co., Inc., Fidelity Investments Money Management, Inc. (FIMM), Fidelity Research and Analysis Company (FRAC), and Fidelity Management & Research (Hong Kong) (2009-present), as Senior Vice President of the Fidelity Asset Management Division (2009-present), and is an employee of Fidelity Investments. Previously, Mr. Hanlon served as Compliance Officer of Fidelity Management & Research (Japan) Inc. (2009-2013), Strategic Advisers, Inc. (2009-2013), and Fidelity Management & Research (U.K.) Inc. (2009-2013). |
Bruce T. Herring (1965) |
Year of Election or Appointment: 2006 Vice President of certain Equity Funds |
| Mr. Herring also serves as Vice President of other funds. He serves as Chief Investment Officer of Fidelity Global Asset Allocation (GAA) (2013-present), Chief Investment Officer and Director of Fidelity Management & Research (U.K.) Inc. (2010-present), Group Chief Investment Officer of FMR, and President of Fidelity Research & Analysis Company (2010-present). Previously, Mr. Herring served as Vice President (2005-2006) and Senior Vice President (2006-2007) of Fidelity Management & Research Company, Vice President of FMR Co., Inc. (2001-2007), and as a portfolio manager for Fidelity U.S. Equity Funds. |
Brian B. Hogan (1964) |
Year of Election or Appointment: 2009 Vice President |
| Mr. Hogan also serves as Vice President of other funds. Mr. Hogan serves as President of FMR's Equity Division (2009-present). Previously, Mr. Hogan served as Senior Vice President, Equity Research of FMR (2006-2009) and as a portfolio manager. |
Chris Maher (1972) |
Year of Election or Appointment: 2013 Assistant Treasurer |
| Mr. Maher serves as Assistant Treasurer of other funds. Mr. Maher is Vice President of Valuation Oversight and is an employee of Fidelity Investments. Previously, Mr. Maher served as Vice President of Asset Management Compliance (2013), Vice President of FMR's Program Management Group (2010-2013), and Vice President of Valuation Oversight (2008-2010). |
Christine Reynolds (1958) |
Year of Election or Appointment: 2008 Chief Financial Officer |
| Ms. Reynolds also serves as Chief Financial Officer of other funds. Ms. Reynolds became President of Fidelity Pricing and Cash Management Services (FPCMS) in August 2008. Ms. Reynolds served as Chief Operating Officer of FPCMS (2007-2008). Previously, Ms. Reynolds served as President, Treasurer, and Anti-Money Laundering officer of the Fidelity funds (2004-2007). |
Kenneth B. Robins (1969) |
Year of Election or Appointment: 2008 President and Treasurer |
| Mr. Robins also serves as an officer of other funds. Mr. Robins serves as Executive Vice President of Fidelity Investments Money Management, Inc. (FIMM) (2013-present) and is an employee of Fidelity Investments (2004-present). Previously, Mr. Robins served in other fund officer roles. |
Gary W. Ryan (1958) |
Year of Election or Appointment: 2005 Assistant Treasurer |
| Mr. Ryan also serves as Assistant Treasurer of other funds. Mr. Ryan is an employee of Fidelity Investments and has served in other fund officer roles. Previously, Mr. Ryan served as Vice President of Fund Reporting in Fidelity Pricing and Cash Management Services (FPCMS) (1999-2005). |
Stephen Sadoski (1971) |
Year of Election or Appointment: 2012 Deputy Treasurer |
| Mr. Sadoski also serves as Deputy Treasurer of other funds. He is an employee of Fidelity Investments (2012-present) and has served in another fund officer role. Prior to joining Fidelity Investments, Mr. Sadoski served as an assistant chief accountant in the Division of Investment Management of the Securities and Exchange Commission (SEC) (2009-2012) and as a senior manager at Deloitte & Touche LLP (1997-2009). |
Stacie M. Smith (1974) |
Year of Election or Appointment: 2013 Deputy Treasurer |
| Ms. Smith also serves as an officer of other funds. She is an employee of Fidelity Investments (2009-present) and has served in other fund officer roles. Prior to joining Fidelity Investments, Ms. Smith served as Senior Audit Manager of Ernst & Young LLP (1996-2009). |
Renee Stagnone (1975) |
Year of Election or Appointment: 2013 Deputy Treasurer |
| Ms. Stagnone also serves as Deputy Treasurer of other funds. Ms. Stagnone is an employee of Fidelity Investments. |
Joseph F. Zambello (1957) |
Year of Election or Appointment: 2011 Deputy Treasurer |
| Mr. Zambello also serves as Deputy Treasurer of other funds. Mr. Zambello is an employee of Fidelity Investments. Previously, Mr. Zambello served as Vice President of FMR's Program Management Group (2009-2011) and Vice President of the Transfer Agent Oversight Group (2005-2009). |
Annual Report
Institutional Class designates 100% of the dividend distributed during the fiscal year, as amounts which may be taken into account as a dividend for purposes of the maximum rate under section 1(h)(11) of the Internal Revenue Code.
The amounts per share which represent income derived from sources within, and taxes paid to, foreign countries or possessions of the United States are as follows:
| Pay Date | Income | Taxes |
Institutional Class | 12/10/12 | $0.153 | $0.0352 |
The fund will notify shareholders in January 2014 of amounts for use in preparing 2013 income tax returns.
Annual Report
Board Approval of Investment Advisory Contracts and Management Fees
Fidelity Emerging Europe, Middle East, Africa (EMEA) Fund
Each year, the Board of Trustees, including the Independent Trustees (together, the Board), votes on the renewal of the management contract and sub-advisory agreements (together, the Advisory Contracts) for the fund. The Board, assisted by the advice of fund counsel and Independent Trustees' counsel, requests and considers a broad range of information relevant to the renewal of the Advisory Contracts throughout the year.
The Board meets regularly and, at each of its meetings, covers an extensive agenda of topics and materials and considers factors that are relevant to its annual consideration of the renewal of the fund's Advisory Contracts, including the services and support provided to the fund and its shareholders. The Board has established various standing committees, each composed of and chaired by Independent Trustees with varying backgrounds, to which the Board has assigned specific subject matter responsibilities in order to enhance effective decision-making by the Board. The Board, acting directly and through its Committees, requests and receives information concerning the annual consideration of the renewal of the fund's Advisory Contracts. The Board also meets as needed to consider matters specifically related to the Board's annual consideration of the renewal of Advisory Contracts. Members of the Board may also meet with trustees of other Fidelity funds through ad hoc joint committees to discuss certain matters relevant to the Fidelity funds.
At its July 2013 meeting, the Board, including the Independent Trustees, unanimously determined to renew the fund's Advisory Contracts. In reaching its determination, the Board considered all factors it believed relevant, including (i) the nature, extent, and quality of the services to be provided to the fund and its shareholders (including the investment performance of the fund); (ii) the competitiveness of the fund's management fee and total expense ratio relative to peer funds; (iii) the total costs of the services to be provided by and the profits to be realized by Fidelity from its relationship with the fund; (iv) the extent to which economies of scale exist and would be realized as the fund grows; and (v) whether fee levels reflect these economies of scale, if any, for the benefit of fund shareholders.
In considering whether to renew the Advisory Contracts for the fund, the Board reached a determination, with the assistance of fund counsel and Independent Trustees' counsel and through the exercise of its business judgment, that the renewal of the Advisory Contracts was in the best interests of the fund and its shareholders and that the compensation payable under the Advisory Contracts was fair and reasonable. The Board's decision to renew the Advisory Contracts was not based on any single factor, but rather was based on a comprehensive consideration of all the information provided to the Board at its meetings throughout the year. The Board, in reaching its determination to renew the Advisory Contracts, was aware that shareholders in the fund have a broad range of investment choices available to them, including a wide choice among mutual funds offered by Fidelity's competitors, and that the fund's shareholders, who have the opportunity to review and weigh the disclosure provided by the fund in its prospectus and other public disclosures, have chosen to invest in this fund, which is a part of the Fidelity family of funds.
Annual Report
Nature, Extent, and Quality of Services Provided. The Board considered the staffing within the investment adviser, Fidelity Management & Research Company (FMR), and the sub-advisers (together, the Investment Advisers) as it relates to the fund, including the backgrounds of the fund's investment personnel, and also considered the fund's investment objective, strategies, and related investment philosophy. The Independent Trustees also had discussions with senior management of Fidelity's investment operations and investment groups. The Board considered the structure of the portfolio manager compensation program and whether this structure provides appropriate incentives to act in the best interests of the fund.
Resources Dedicated to Investment Management and Support Services. The Board and the Fund Oversight and Research Committees reviewed the general qualifications and capabilities of the Investment Advisers' investment staff, including its size, education, experience, and resources, as well as the Investment Advisers' approach to recruiting, training, managing, and compensating investment personnel. The Board noted that FMR has continued to increase the resources devoted to non-U.S. offices, including expansion of Fidelity's global investment organization. The Board also noted that Fidelity's analysts have extensive resources, tools and capabilities that allow them to conduct sophisticated quantitative and fundamental analysis, as well as credit analysis of issuers, counterparties and guarantors. Further, the Board believes that Fidelity's investment professionals have sufficient access to global information and data so as to provide competitive investment results over time, and that those professionals also have access to sophisticated tools that permit them to assess portfolio construction and risk and performance attribution characteristics continuously, as well as to transmit new information and research conclusions rapidly around the world. Additionally, in its deliberations, the Board considered the Investment Advisers' trading and risk management capabilities and resources, which are an integral part of the investment management process.
Shareholder and Administrative Services. The Board considered (i) the nature, extent, quality, and cost of advisory, administrative, and shareholder services performed by the Investment Advisers and their affiliates under the Advisory Contracts and under separate agreements covering transfer agency, pricing and bookkeeping, and securities lending services for the fund; (ii) the nature and extent of the supervision of third party service providers, principally custodians and subcustodians; and (iii) the resources devoted to, and the record of compliance with, the fund's compliance policies and procedures. The Board also reviewed the allocation of fund brokerage, including allocations to brokers affiliated with the Investment Advisers, the use of brokerage commissions to pay fund expenses, and the use of "soft" commission dollars to pay for research services.
Annual Report
Board Approval of Investment Advisory Contracts and
Management Fees - continued
The Board noted that the growth of fund assets over time across the complex allows Fidelity to reinvest in the development of services designed to enhance the value or convenience of the Fidelity funds as investment vehicles. These services include 24-hour access to account information and market information through telephone representatives and over the Internet, investor education materials and asset allocation tools, and the expanded availability of Fidelity Investor Centers.
Investment in a Large Fund Family. The Board considered the benefits to shareholders of investing in a Fidelity fund, including the benefits of investing in a fund that is part of a large family of funds offering a variety of investment disciplines and providing a large variety of mutual fund investor services. The Board noted that Fidelity had taken, or had made recommendations that resulted in the Fidelity funds taking, a number of actions over the previous year that benefited particular funds, including (i) continuing to dedicate additional resources to investment research and to the support of the senior management team that oversees asset management; (ii) persisting in efforts to enhance Fidelity's global research capabilities; (iii) launching new funds and making other enhancements to meet client needs for global and income-oriented solutions; (iv) continuing to launch dedicated lower cost underlying funds to meet portfolio construction needs related to expanding underlying fund options for Fidelity funds of funds, specifically for the Freedom Fund product lines; (v) rationalizing product lines and gaining increased efficiencies through the mergers of several funds into other funds; (vi) strengthening Fidelity's index fund offerings by reducing investment minimums and adopting or lowering existing expense caps for certain funds and classes; (vii) enhancing Global Asset Allocation product offerings by launching new funds and strategies, including "open architecture" target date funds that utilize affiliated and unaffiliated sub-advisers; (viii) modifying the eligibility criteria for Institutional Class shares of Advisor funds to increase their marketability to a portion of the defined contribution plan market; (ix) creating a new low-cost retirement share class for certain Advisor funds to appeal to large retirement plans; (x) transitioning the management of certain Fidelity commodity funds to Geode Capital Management LLC, a registered commodity pool operator, while retaining administrative responsibilities for the funds; (xi) reorganizing a number of funds; and (xii) taking steps toward establishing a new Fidelity adviser to manage sector-based funds and products.
Investment Performance. The Board considered whether the fund has operated in accordance with its investment objective, as well as its record of compliance with its investment restrictions and its performance history.
The Board took into account discussions with the Investment Advisers about fund investment performance that occur at Board meetings throughout the year. In this regard the Board noted that as part of regularly scheduled fund reviews and other reports to the Board on fund performance, the Board periodically considers annualized return information for the fund, for different time periods, measured against a securities market index ("benchmark index") and a peer group of mutual funds with similar objectives ("peer group"). In its evaluation of fund investment performance, the Board gave particular attention to information indicating changes in performance of certain Fidelity funds for specific time periods and the Investment Advisers' explanations for any overperformance or underperformance.
Annual Report
In addition to reviewing absolute and relative fund performance, the Independent Trustees periodically consider the appropriateness of fund performance metrics in evaluating the results achieved. In general, the Independent Trustees believe that fund performance should be evaluated based on net performance (after fees and expenses) of both the highest performing and lowest performing classes, where applicable, compared to appropriate benchmark indices, over appropriate time periods which may include full market cycles, and compared to peer groups, as applicable, over the same periods, taking into account relevant factors including the following: general market conditions; issuer-specific information; tactical opportunities for investment; and fund cash flows and other factors.
The Independent Trustees recognize that shareholders evaluate performance on a net basis over their own holding periods, for which one-, three-, and five-year periods are used as a proxy. For this reason, the performance information reviewed by the Board also included net cumulative calendar year total return information for the fund and an appropriate benchmark index for the most recent one- and three-year periods, as shown below. A peer group comparison is not shown below.
Annual Report
Board Approval of Investment Advisory Contracts and
Management Fees - continued
Fidelity Emerging Europe, Middle East, Africa (EMEA) Fund
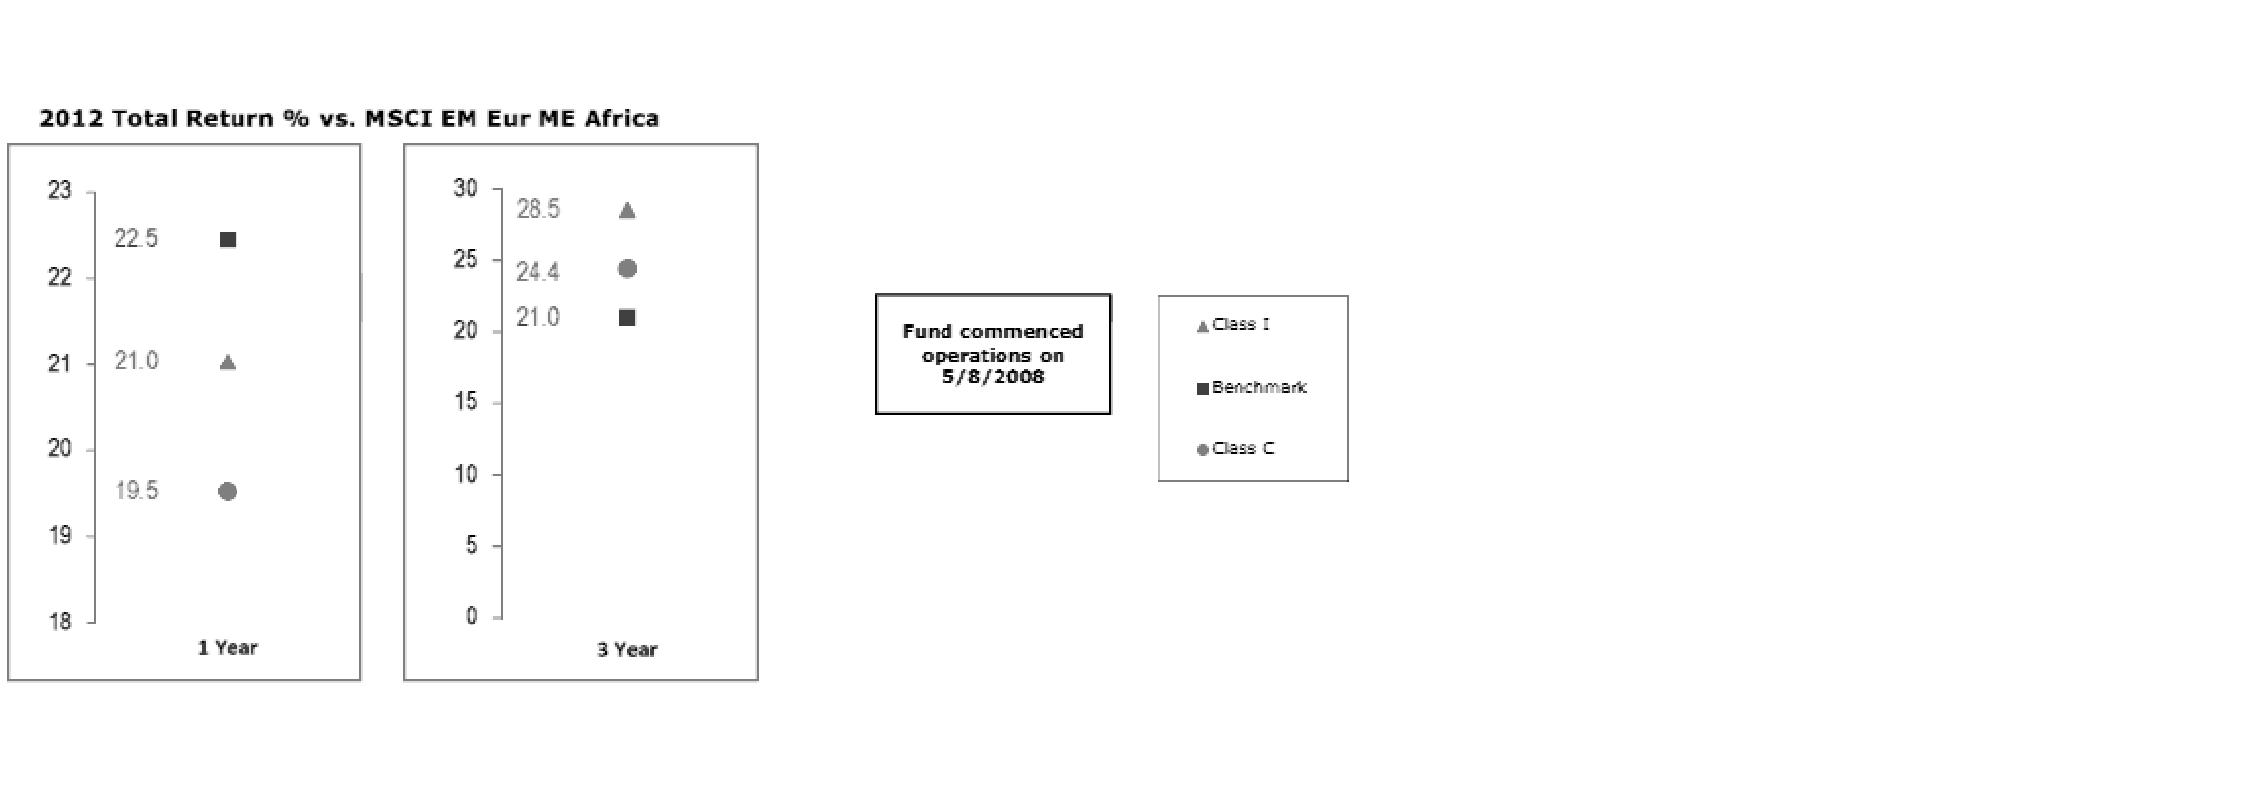
Based on its review, the Board concluded that the nature, extent, and quality of services provided to the fund under the Advisory Contracts should benefit the fund's shareholders.
Competitiveness of Management Fee and Total Expense Ratio. The Board considered the fund's management fee and total expense ratio compared to "mapped groups" of competitive funds and classes. Fidelity creates "mapped groups" by combining similar Lipper investment objective categories that have comparable management fee characteristics. Combining Lipper investment objective categories aids the Board's management fee and total expense ratio comparisons by broadening the competitive group used for comparison and by reducing the number of universes to which various Fidelity funds are compared.
Management Fee. The Board considered two proprietary management fee comparisons for the 12-month (or shorter) periods shown in the chart below. The group of Lipper funds used by the Board for management fee comparisons is referred to below as the "Total Mapped Group." The Total Mapped Group comparison focuses on a fund's standing in terms of gross management fees before expense reimbursements or caps relative to the total universe of funds with comparable investment mandates, regardless of whether their management fee structures also are comparable. Funds with comparable investment mandates offer exposure to similar types of securities. Funds with comparable management fee structures have similar management fee contractual arrangements (e.g., flat rate charged for advisory services, all-inclusive fee rate, etc.). "TMG %" represents the percentage of funds in the Total Mapped Group that had management fees that were lower than the fund's. For example, a TMG % of 13% means that 87% of the funds in the Total Mapped Group had higher management fees than the fund. The "Asset-Size Peer Group" (ASPG) comparison focuses on a fund's standing relative to a subset of non-Fidelity funds within the Total Mapped Group that are similar in size and management fee structure. The ASPG represents at least 15% of the funds in the Total Mapped Group with comparable asset size and management fee structures, subject to a minimum of 50 funds (or all funds in the Total Mapped Group if fewer than 50). Additional information, such as the ASPG quartile in which the fund's management fee ranked, is also included in the chart and considered by the Board.
Annual Report
Fidelity Emerging Europe, Middle East, Africa (EMEA) Fund

The Board noted that the fund's management fee ranked below the median of its Total Mapped Group and below the median of its ASPG for 2012.
Based on its review, the Board concluded that the fund's management fee is fair and reasonable in light of the services that the fund receives and the other factors considered.
Total Expense Ratio. In its review of each class's total expense ratio, the Board considered the fund's management fee as well as other fund or class expenses, as applicable, such as transfer agent fees, pricing and bookkeeping fees, fund-paid 12b-1 fees, and custodial, legal, and audit fees. The Board also noted the effects of any waivers and reimbursements on fees and expenses. As part of its review, the Board also considered the current and historical total expense ratios of each class of the fund compared to competitive fund median expenses. Each class of the fund is compared to those funds and classes in the Total Mapped Group (used by the Board for management fee comparisons) that have a similar sales load structure.
Annual Report
Board Approval of Investment Advisory Contracts and
Management Fees - continued
The Board noted that the total expense ratio of each of Class A, Class C, Institutional Class, and the retail class ranked below its competitive median for 2012 and the total expense ratio of each of Class T and Class B ranked above its competitive median for 2012. The Board considered that, in general, various factors can affect total expense ratios. The Board noted that the total expense ratio of Class T was above the competitive median primarily because of higher 12b-1 fees on Class T. Class T has a higher 12b-1 fee, but a lower front-end sales charge, than traditionally priced front-end sales charge classes. The Board considered that Class T is primarily sold load-waived in the retirement plan market where its 0.50% 12b-1 fee is comparable to competing no-load, higher 12b-1 fee classes designed specifically for retirement plans. The Board noted that the fund offers multiple classes, each of which has a different sales load and 12b-1 fee structure, and that the multiple structures are intended to offer a range of pricing options for the intermediary market. The Board also noted that the total expense ratios of the classes vary primarily by the level of their 12b-1 fees, although differences in transfer agent fees may also cause expenses to vary from class to class.
Fees Charged to Other Fidelity Clients. The Board also considered Fidelity fee structures and other information with respect to clients of FMR and its affiliates, such as other mutual funds advised or subadvised by FMR or its affiliates, pension plan clients, and other institutional clients. The Board noted the findings of the 2013 ad hoc joint committee (created with the board of other Fidelity funds), which reviewed and compared Fidelity's institutional investment advisory business with its business of providing services to the Fidelity funds, including the differences in services provided, fees charged, and costs incurred, as well as competition in their respective marketplaces.
Based on its review of total expense ratios and fees charged to other Fidelity clients, the Board concluded that the total expense ratio of each class of the fund was reasonable, although in some cases above the median of the universe presented for comparison, in light of the services that the fund and its shareholders receive and the other factors considered.
Costs of the Services and Profitability. The Board considered the revenues earned and the expenses incurred by Fidelity in conducting the business of developing, marketing, distributing, managing, administering and servicing the fund and servicing the fund's shareholders. The Board also considered the level of Fidelity's profits in respect of all the Fidelity funds.
On an annual basis, FMR presents to the Board Fidelity's profitability for the fund. Fidelity calculates the profitability for each fund, as well as aggregate profitability for groups of Fidelity funds and all Fidelity funds, using a series of detailed revenue and cost allocation methodologies which originate with the books and records of Fidelity on which Fidelity's audited financial statements are based. The Audit Committee of the Board reviews any significant changes from the prior year's methodologies.
Annual Report
PricewaterhouseCoopers LLP (PwC), independent registered public accounting firm and auditor to Fidelity and certain Fidelity funds, has been engaged annually by the Board as part of the Board's assessment of Fidelity's profitability analysis. PwC's engagement includes the review and assessment of the methodologies used by Fidelity in determining the revenues and expenses attributable to Fidelity's mutual fund business, and completion of agreed-upon procedures surrounding the mathematical accuracy of fund profitability and its conformity to allocation methodologies. After considering PwC's reports issued under the engagement and information provided by Fidelity, the Board concluded that while other allocation methods may also be reasonable, Fidelity's profitability methodologies are reasonable in all material respects.
The Board also reviewed Fidelity's non-fund businesses and fall-out benefits related to the mutual fund business as well as cases where Fidelity's affiliates may benefit from or be related to the fund's business.
The Board considered the costs of the services provided by and the profits realized by Fidelity in connection with the operation of the fund and was satisfied that the profitability was not excessive in the circumstances.
Economies of Scale. The Board considered whether there have been economies of scale in respect of the management of the Fidelity funds, whether the Fidelity funds (including the fund) have appropriately benefited from any such economies of scale, and whether there is potential for realization of any further economies of scale. The Board considered the extent to which the fund will benefit from economies of scale through increased services to the fund, through waivers or reimbursements, or through fee or expense reductions. The Board also noted that in 2009, it and the board of other Fidelity funds created an ad hoc committee (the Economies of Scale Committee) to analyze whether FMR attains economies of scale in respect of the management and servicing of the Fidelity funds, whether the Fidelity funds have appropriately benefited from such economies of scale, and whether there is potential for realization of any further economies of scale.
The Board recognized that the fund's management contract incorporates a "group fee" structure, which provides for lower group fee rates as total fund assets under FMR's management increase, and for higher group fee rates as total fund assets under FMR's management decrease. FMR calculates the group fee rates based on a tiered asset "breakpoint" schedule that varies based on asset class. The Board considered that the group fee is designed to deliver the benefits of economies of scale to fund shareholders when total Fidelity fund assets increase, even if assets of any particular fund are unchanged or have declined, because some portion of Fidelity's costs are attributable to services provided to all Fidelity funds, and all funds benefit if those costs can be allocated among more assets. The Board concluded that, given the group fee structure, fund shareholders will benefit from lower management fees as assets under FMR's management increase at the fund complex level, regardless of whether Fidelity achieves any such economies of scale.
Annual Report
Board Approval of Investment Advisory Contracts and
Management Fees - continued
The Board concluded, taking into account the analysis of the Economies of Scale Committee, that economies of scale, if any, are being appropriately shared between fund shareholders and Fidelity.
Amendment to Description of Group Fee Rate. At its July 2013 meeting, the Board voted to approve an amendment to the fund's management contract to modify the description of the "group fee rate" effective August 1, 2013. The Board noted that under the prior description in the contract, the group fee rate was based on the average net assets of all registered investment companies with which FMR has management contracts. Under the contract's tiered asset breakpoint schedule, the group fee rate is lower as total fund assets under FMR's management increase, and higher as total fund assets under FMR's management decrease. The Board considered that the prior description would have excluded the assets of 64 Fidelity sector funds from the group fee rate calculation once Fidelity SelectCo, LLC, an affiliate of FMR, assumed management responsibilities for those funds. The Board noted that modifying the description of the group fee rate to continue to include the assets of those 64 funds for purposes of determining group fee rate breakpoints would avoid an immediate adverse impact on the group fee rate for any fund.
Additional Information Requested by the Board. In order to develop fully the factual basis for consideration of the Fidelity funds' Advisory Contracts, the Board requested and received additional information on certain topics, including: (i) fund performance trends and Fidelity's long-term strategies for certain funds; (ii) the potential to further rationalize the Fidelity fund lineup with the possibility of achieving savings for the funds and Fidelity; (iii) the methodology with respect to competitive fund data and peer group classifications; (iv) the arrangements with, and performance of, certain sub-advisers on behalf of the Fidelity funds, as well as certain proposed participating affiliate arrangements; (v) the realization of fall-out benefits in certain Fidelity business units; (vi) Fidelity's group fee structures, including the rationale for the individual fee rates of certain categories of funds and the definition of group assets; (vii) trends regarding industry use of performance fee structures and the performance adjustment methodologies applicable to the Fidelity funds; (viii) additional competitive analysis regarding the total expenses for certain classes; and (ix) fund profitability methodology, including Fidelity's cost allocation methodology, and the impact of certain factors on fund profitability results.
Based on its evaluation of all of the conclusions noted above, and after considering all factors it believed relevant, the Board ultimately concluded that the advisory fee structures are fair and reasonable, and that the fund's Advisory Contracts should be renewed.
Annual Report
Investment Adviser
Fidelity Management & Research Company
Boston, MA
Investment Sub-Advisers
FMR Co., Inc.
Fidelity Management & Research
(U.K.) Inc.
FIL Investments (Japan) Limited
FIL Investment Advisors
FIL Investment Advisors
(U.K.) Limited
Fidelity Management & Research
(Hong Kong) Limited
Fidelity Management & Research
(Japan) Inc.
General Distributor
Fidelity Distributors Corporation
Smithfield, RI
Transfer and Service Agents
Fidelity Investments Institutional
Operations Company, Inc.
Boston, MA
Fidelity Service Company, Inc.
Boston, MA
Custodian
State Street Bank & Trust Company
Quincy, MA
(Fidelity Investment logo)(registered trademark)
AEMEI-UANN-1213
1.861980.105
Fidelity®
Series Emerging Markets
Series International Growth
Series International Small Cap
Series International Value
Funds -
Fidelity Series Emerging Markets Fund
Fidelity Series International Growth Fund
Fidelity Series International Small Cap Fund
Fidelity Series International Value Fund
Class F
Annual Report
October 31, 2013
(Fidelity Cover Art)
Contents
Shareholder Expense Example | (Click Here) | An example of shareholder expenses. |
Fidelity® Series Emerging Markets Fund |
Performance | (Click Here) | How the fund has done over time. |
Management's Discussion of Fund Performance | (Click Here) | The Portfolio Manager's review of fund performance and strategy. |
Investment Changes | (Click Here) | A summary of major shifts in the Fund's investments over the past six months. |
Investments | (Click Here) | A complete list of the fund's investments with their market values. |
Financial Statements | (Click Here) | Statements of assets and liabilities, operations, and changes in net assets, as well as financial highlights. |
Fidelity Series International Growth Fund |
Performance | (Click Here) | How the fund has done over time. |
Management's Discussion of Fund Performance | (Click Here) | The Portfolio Manager's review of fund performance and strategy. |
Investment Changes | (Click Here) | A summary of major shifts in the Fund's investments over the past six months. |
Investments | (Click Here) | A complete list of the fund's investments with their market values. |
Financial Statements | (Click Here) | Statements of assets and liabilities, operations, and changes in net assets, as well as financial highlights. |
Fidelity Series International Small Cap Fund |
Performance | (Click Here) | How the fund has done over time. |
Management's Discussion of Fund Performance | (Click Here) | The Portfolio Manager's review of fund performance and strategy. |
Investment Changes | (Click Here) | A summary of major shifts in the Fund's investments over the past six months. |
Investments | (Click Here) | A complete list of the fund's investments with their market values. |
Financial Statements | (Click Here) | Statements of assets and liabilities, operations, and changes in net assets, as well as financial highlights. |
Fidelity Series International Value Fund |
Performance | (Click Here) | How the fund has done over time. |
Management's Discussion of Fund Performance | (Click Here) | The Portfolio Manager's review of fund performance and strategy. |
Investment Changes | (Click Here) | A summary of major shifts in the Fund's investments over the past six months. |
Investments | (Click Here) | A complete list of the fund's investments with their market values. |
Financial Statements | (Click Here) | Statements of assets and liabilities, operations, and changes in net assets, as well as financial highlights. |
Notes | (Click Here) | Notes to the Financial Statements. |
Reports of Independent Registered Public Accounting Firms | (Click Here) | |
Trustees and Officers | (Click Here) | |
Distributions | (Click Here) | |
Board Approval of Investment Advisory Contracts and Management Fees | (Click Here) | |
To view a fund's proxy voting guidelines and proxy voting record for the 12-month period ended June 30, visit http://www.fidelity.com/proxyvotingresults or visit the Securities and Exchange Commission's (SEC) web site at http://www.sec.gov. You may also call 1-800-544-8544 for Fidelity Series Emerging Markets Fund, Fidelity Series International Growth Fund, Fidelity Series International Small Cap Fund, and Fidelity Series International Value Fund or 1-800-835-5092 for Class F of each fund to request a free copy of the proxy voting guidelines.
Standard & Poor's, S&P and S&P 500 are registered service marks of The McGraw-Hill Companies, Inc. and have been licensed for use by Fidelity Distributors Corporation.
Other third-party marks appearing herein are the property of their respective owners.
All other marks appearing herein are registered or unregistered trademarks or service marks of FMR LLC or an affiliated company. © 2013 FMR LLC. All rights reserved.
This report and the financial statements contained herein are submitted for the general information of the shareholders of the funds. This report is not authorized for distribution to prospective investors in the funds unless preceded or accompanied by an effective prospectus.
A fund files its complete schedule of portfolio holdings with the SEC for the first and third quarters of each fiscal year on Form N-Q. Forms N-Q are available on the SEC's web site at http://www.sec.gov. A fund's Forms N-Q may be reviewed and copied at the SEC's Public Reference Room in Washington, DC. Information regarding the operation of the SEC's Public Reference Room may be obtained by calling 1-800-SEC-0330. For a complete list of a fund's portfolio holdings, view the most recent holdings listing, semiannual report, or annual report on Fidelity's web site at http://www.fidelity.com, http://www.advisor.fidelity.com, or http://www.401k.com, as applicable.
NOT FDIC INSURED • MAY LOSE VALUE • NO BANK GUARANTEE
Neither the funds nor Fidelity Distributors Corporation is a bank.
Annual Report
Shareholder Expense Example
As a shareholder of a Fund, you incur two types of costs: (1) transaction costs, and (2) ongoing costs, including management fees and other Fund expenses. This Example is intended to help you understand your ongoing costs (in dollars) of investing in the Funds and to compare these costs with the ongoing costs of investing in other mutual funds.
The Example is based on an investment of $1,000 invested at the beginning of the period and held for the entire period (May 1, 2013 to October 31, 2013).
Actual Expenses
The first line of the accompanying table for each class of each fund provides information about actual account values and actual expenses. You may use the information in this line, together with the amount you invested, to estimate the expenses that you paid over the period. Simply divide your account value by $1,000.00 (for example, an $8,600 account value divided by $1,000.00 = 8.6), then multiply the result by the number in the first line for a class of the fund under the heading entitled "Expenses Paid During Period" to estimate the expenses you paid on your account during this period. In addition, each Fund, as a shareholder in the underlying Fidelity Central Funds, will indirectly bear its pro-rata share of the fees and expenses incurred by the underlying Fidelity Central Funds. These fees and expenses are not included in the Fund's annualized expense ratio used to calculate the expense estimate in the table below.
Hypothetical Example for Comparison Purposes
The second line of the accompanying table for each class of each fund provides information about hypothetical account values and hypothetical expenses based on a Class' actual expense ratio and an assumed rate of return of 5% per year before expenses, which is not the Class' actual return. The hypothetical account values and expenses may not be used to estimate the actual ending account balance or expenses you paid for the period. You may use this information to compare the ongoing costs of investing in the Fund and other funds. To do so, compare this 5% hypothetical example with the 5% hypothetical examples that appear in the shareholder reports of the other funds. In addition, each Fund, as a shareholder in the underlying Fidelity Central Funds, will indirectly bear its pro-rata share of the fees and expenses incurred by the underlying Fidelity Central Funds. These fees and expenses are not included in the Fund's annualized expense ratio used to calculate the expense estimate in the table below.
Please note that the expenses shown in the table are meant to highlight your ongoing costs only and do not reflect any transaction costs. Therefore, the second line of the table is useful in comparing ongoing costs only, and will not help you determine the relative total costs of owning different funds.
Annual Report
Shareholder Expense Example - continued
| Annualized Expense RatioB | Beginning
Account Value
May 1, 2013 | Ending
Account Value
October 31, 2013 | Expenses Paid
During Period*
May 1, 2013 to October 31, 2013 |
Fidelity Series Emerging Markets Fund | | | |
Series Emerging Markets | 1.08% | | | |
Actual | | $ 1,000.00 | $ 1,032.90 | $ 5.53 |
HypotheticalA | | $ 1,000.00 | $ 1,019.76 | $ 5.50 |
Class F | .90% | | | |
Actual | | $ 1,000.00 | $ 1,034.00 | $ 4.61 |
HypotheticalA | | $ 1,000.00 | $ 1,020.67 | $ 4.58 |
Fidelity Series International Growth Fund | | | |
Series International Growth | 1.02% | | | |
Actual | | $ 1,000.00 | $ 1,069.80 | $ 5.32 |
HypotheticalA | | $ 1,000.00 | $ 1,020.06 | $ 5.19 |
Class F | .84% | | | |
Actual | | $ 1,000.00 | $ 1,071.20 | $ 4.39 |
HypotheticalA | | $ 1,000.00 | $ 1,020.97 | $ 4.28 |
Fidelity Series International Small Cap Fund | | |
Series International Small Cap | 1.22% | | | |
Actual | | $ 1,000.00 | $ 1,096.00 | $ 6.45 |
HypotheticalA | | $ 1,000.00 | $ 1,019.06 | $ 6.21 |
Class F | 1.04% | | | |
Actual | | $ 1,000.00 | $ 1,097.30 | $ 5.50 |
HypotheticalA | | $ 1,000.00 | $ 1,019.96 | $ 5.30 |
Fidelity Series International Value Fund | | | |
Series International Value | .87% | | | |
Actual | | $ 1,000.00 | $ 1,069.10 | $ 4.54 |
HypotheticalA | | $ 1,000.00 | $ 1,020.82 | $ 4.43 |
Class F | .69% | | | |
Actual | | $ 1,000.00 | $ 1,070.90 | $ 3.60 |
HypotheticalA | | $ 1,000.00 | $ 1,021.73 | $ 3.52 |
A 5% return per year before expenses
B Annualized expense ratio reflects expenses net of applicable fee waivers.
* Expenses are equal to each Class' annualized expense ratio, multiplied by the average account value over the period, multiplied by 184/ 365 (to reflect the one-half year period).
Annual Report
Fidelity® Series Emerging Markets Fund
Average annual total return reflects the change in the value of an investment, assuming reinvestment of the class' distributions from dividend income and capital gains (the profits earned upon the sale of securities that have grown in value, if any) and assuming a constant rate of performance each year. The $10,000 table and the fund's returns do not reflect the deduction of taxes that a shareholder would pay on fund distributions or the redemption of fund shares. During periods of reimbursement by Fidelity, a fund's total return will be greater than it would be had the reimbursement not occurred. How a fund did yesterday is no guarantee of how it will do tomorrow.
Average Annual Total Returns
Periods ended October 31, 2013 | Past 1
year | Life of
fund A |
Fidelity Series Emerging Markets Fund | 9.59% | 16.86% |
Class F B | 9.84% | 17.10% |
A From December 9, 2008.
B The initial offering of Class F shares took place on June 26, 2009. Returns prior to June 26, 2009, are those of Fidelity Series Emerging Markets Fund, the original class of the fund.
$10,000 Over Life of Fund
Let's say hypothetically that $10,000 was invested in Fidelity Series Emerging Markets Fund, a class of the fund, on December 9, 2008, when the fund started. The chart shows how the value of your investment would have changed, and also shows how the MSCI® Emerging Markets Index performed over the same period.
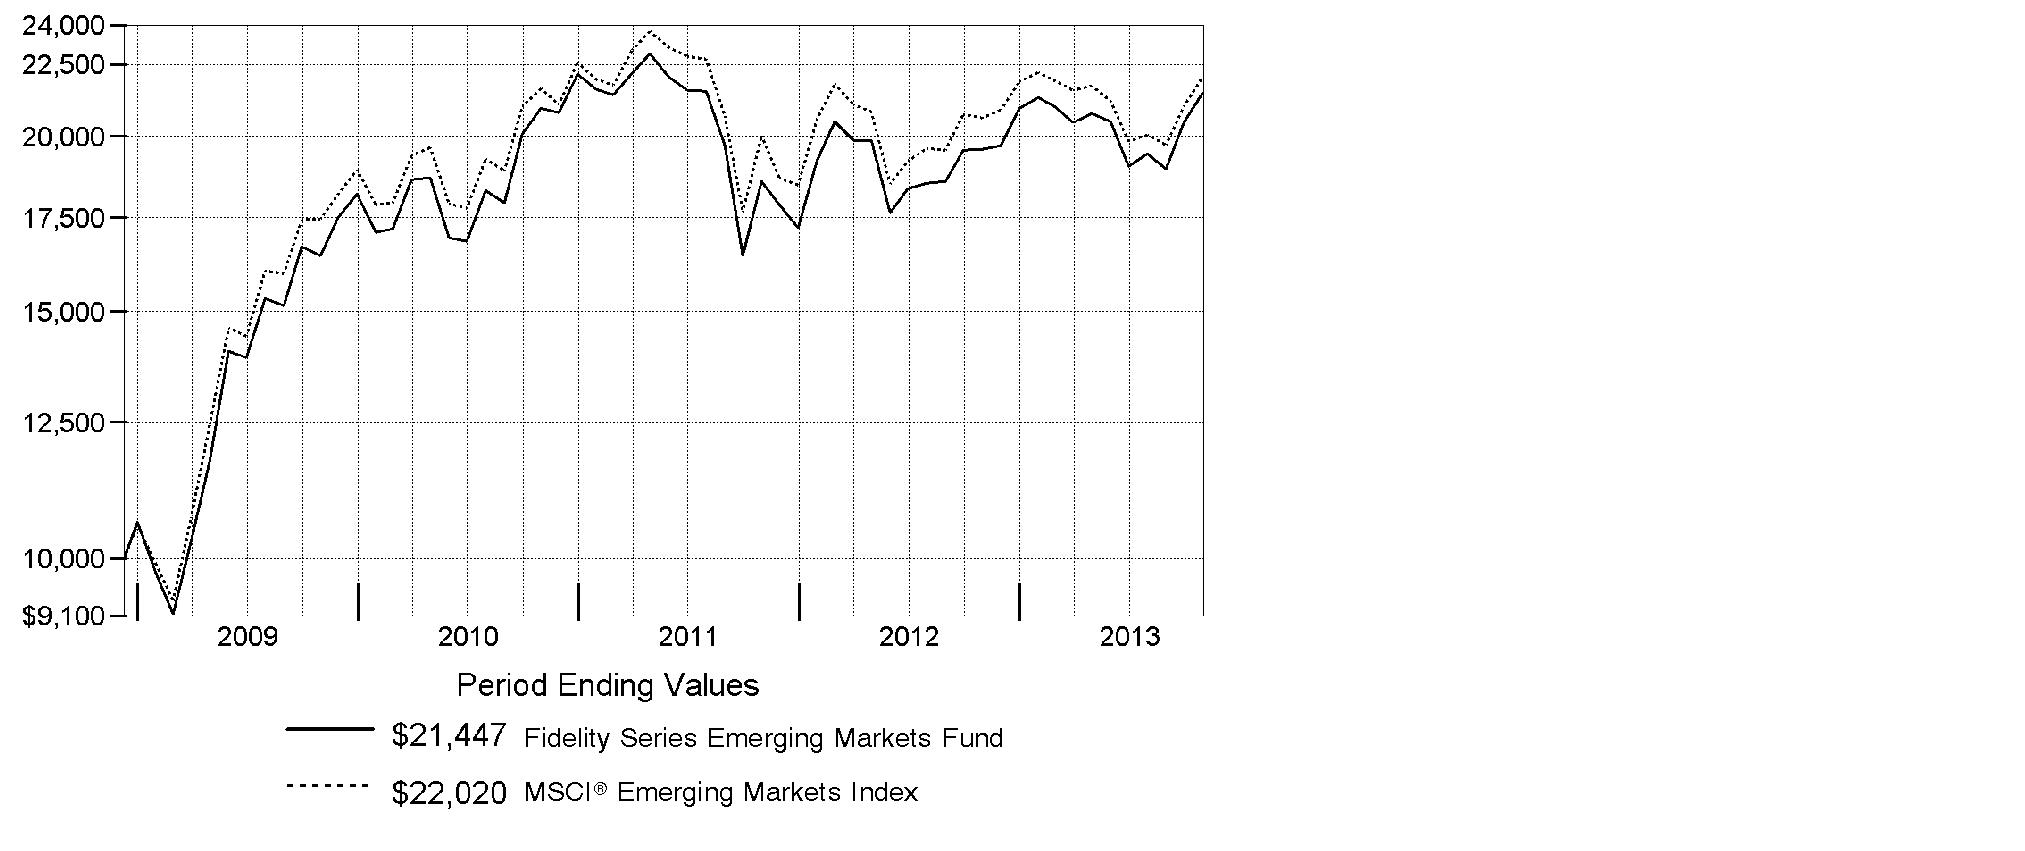
Annual Report
Fidelity Series Emerging Markets Fund
Market Recap: On balance, global equity markets remained upbeat for the 12-month period ending October 31, 2013. The MSCI® ACWI® (All Country World Index) Index gained 23.75% for the period, amid investor preference for higher-risk assets. The period was not without turbulence, however. In the spring and summer, central banks worldwide, especially in the U.S. and China, made clear their intentions to maintain accommodative monetary policies. That stance, combined with modest cyclical improvements around the globe and generally low valuations, underpinned the broad rally in equities. Europe (+32%) shone brightly, with most markets in the region - large and small - registering solid, index-beating gains. Another bright spot was Japan, which, despite a struggling yen and taking a second-half breather, posted a 34% result for the full year. The U.S. - by far the index's biggest constituent - also outperformed the global market with a roughly 28% advance. Meanwhile, Asia-Pacific ex Japan (+14%) lagged, hurt in part by a slowdown in Australia's mining industry as well as currency headwinds. Foreign-exchange and commodity weakness also curbed results in resource-heavy Canada and emerging markets (EM), both of which were up 7%. Country-level EM performance diverged meaningfully for the period, as evidenced by performance in Brazil (-1%), Russia (+12%), India (+1%) and China (+8%).
Comments from Sam Polyak and Gregory Lee, Co-Portfolio Managers of Fidelity® Series Emerging Markets Fund, along with James Hayes, Per Johansson, Douglas Chow and Timothy Gannon: For the year, the fund's Series Emerging Markets and Class F shares gained 9.59% and 9.84%, respectively, ahead of the 6.90% advance of the MSCI® Emerging Markets Index. Relative to the index, our picks were most beneficial in energy and telecommunication services, while materials proved a notable area of weakness. Our top individual relative contributor was Mobile TeleSystems, a Russian wireless telecom provider that was lifted by easing competitive conditions. Shares of Taiwan's ECLAT Textile, a maker of performance fabrics, gained amid wise investments in technology and minimal competition. We also made a good call in owning shares of Bermuda-based oil-services firm BW Offshore, which rose as the firm's operating environment and earnings improved. On the downside, out-of-index exposure to gold-related stocks hurt, with Canada's Yamana Gold, Goldcorp and Barrick Gold all declining alongside the price of the precious metal. We sold Yamana and Barrick. We held a non-index stake in U.K.-registered copper producer Kazakhmys until July, primarily based on its attractive valuation, but the stock disappointed due to the falling price of copper, and it was the fund's largest individual detractor.
The views expressed above reflect those of the portfolio manager(s) only through the end of the period as stated on the cover of this report and do not necessarily represent the views of Fidelity or any other person in the Fidelity organization. Any such views are subject to change at any time based upon market or other conditions and Fidelity disclaims any responsibility to update such views. These views may not be relied on as investment advice and, because investment decisions for a Fidelity fund are based on numerous factors, may not be relied on as an indication of trading intent on behalf of any Fidelity fund.
Annual Report
Fidelity Series Emerging Markets Fund
Investment Changes (Unaudited)
Geographic Diversification (% of fund's net assets) |
As of October 31, 2013 |
 | Korea (South) 18.2% | |
 | Brazil 10.1% | |
 | Russia 8.4% | |
 | Cayman Islands 8.0% | |
 | Taiwan 7.0% | |
 | China 6.8% | |
 | India 6.8% | |
 | Mexico 5.1% | |
 | South Africa 5.0% | |
 | Other* 24.6% | |

* Includes Short-Term Investments and Net Other Assets (Liabilities). |
Percentages are based on country or territory of incorporation and are adjusted for the effect of futures contracts, if applicable. |
As of April 30, 2013 |
| Korea (South) 13.8% | |
| Brazil 11.9% | |
| Russia 8.1% | |
| Taiwan 7.5% | |
| China 6.9% | |
| India 6.8% | |
| Cayman Islands 6.3% | |
| United States of America* 4.9% | |
| Mexico 4.9% | |
| Other 28.9% | |

* Includes Short-Term Investments and Net Other Assets (Liabilities). |
Percentages are based on country or territory of incorporation and are adjusted for the effect of futures contracts, if applicable. |
Asset Allocation as of October 31, 2013 |
| % of fund's
net assets | % of fund's net assets
6 months ago |
Stocks and Equity Futures | 98.7 | 96.7 |
Short-Term Investments and Net Other Assets (Liabilities) | 1.3 | 3.3 |
Top Ten Stocks as of October 31, 2013 |
| % of fund's
net assets | % of fund's net assets
6 months ago |
Samsung Electronics Co. Ltd. (Korea (South), Semiconductors & Semiconductor Equipment) | 4.7 | 5.1 |
Taiwan Semiconductor Manufacturing Co. Ltd. (Taiwan, Semiconductors & Semiconductor Equipment) | 3.1 | 3.1 |
Tencent Holdings Ltd. (Cayman Islands, Internet Software & Services) | 2.1 | 1.1 |
Sberbank (Savings Bank of the Russian Federation) (Russia, Commercial Banks) | 2.0 | 1.7 |
Industrial & Commercial Bank of China Ltd. (H Shares) (China, Commercial Banks) | 1.8 | 1.4 |
Itau Unibanco Holding SA sponsored ADR (Brazil, Commercial Banks) | 1.7 | 1.4 |
Vale SA (PN-A) sponsored ADR (Brazil, Metals & Mining) | 1.6 | 1.8 |
Naspers Ltd. Class N (South Africa, Media) | 1.5 | 1.0 |
Hana Financial Group, Inc. (Korea (South), Commercial Banks) | 1.5 | 0.7 |
KB Financial Group, Inc. (Korea (South), Commercial Banks) | 1.5 | 0.8 |
| 21.5 | |
Market Sectors as of October 31, 2013 |
| % of fund's
net assets | % of fund's net assets
6 months ago |
Financials | 25.9 | 26.5 |
Information Technology | 16.3 | 13.7 |
Energy | 10.1 | 11.2 |
Materials | 10.1 | 9.8 |
Consumer Staples | 8.6 | 9.2 |
Consumer Discretionary | 8.3 | 7.6 |
Industrials | 7.2 | 6.7 |
Telecommunication Services | 6.8 | 6.5 |
Utilities | 3.0 | 3.0 |
Health Care | 1.6 | 1.4 |
Annual Report
Fidelity Series Emerging Markets Fund
Investments October 31, 2013
Showing Percentage of Net Assets
Common Stocks - 93.6% |
| Shares | | Value |
Argentina - 0.2% |
Grupo Financiero Galicia SA sponsored ADR (d) | 1,336,000 | | $ 12,932,480 |
Austria - 0.5% |
Erste Group Bank AG | 939,626 | | 33,138,313 |
Bailiwick of Jersey - 0.4% |
Atrium European Real Estate Ltd. | 4,576,786 | | 27,379,462 |
Bermuda - 1.9% |
Aquarius Platinum Ltd. (Australia) (a) | 11,982,129 | | 7,870,812 |
BW Offshore Ltd. | 23,811,769 | | 32,679,408 |
Cosan Ltd. Class A | 1,882,532 | | 29,668,704 |
GP Investments Ltd. Class A (depositary receipt) (a) | 10,765,900 | | 19,319,221 |
Shangri-La Asia Ltd. | 11,756,000 | | 21,531,691 |
Stolt-Nielsen SA | 759,546 | | 21,498,812 |
TOTAL BERMUDA | | 132,568,648 |
Brazil - 8.8% |
Anhanguera Educacional Participacoes SA | 3,698,148 | | 22,120,875 |
Arezzo Industria e Comercio SA | 1,001,300 | | 14,973,462 |
BHG SA (Brazil Hospitality Group) (a) | 1,298,900 | | 9,508,955 |
BR Properties SA | 4,355,800 | | 36,943,219 |
Companhia de Bebidas das Americas (AmBev) (PN) sponsored ADR | 929,600 | | 34,581,120 |
Companhia de Saneamento Basico do Estado de Sao Paulo (SABESP) sponsored ADR (d) | 2,087,000 | | 22,143,070 |
Companhia Paranaense de Energia-Copel (PN-B) sponsored ADR (d) | 1,382,500 | | 19,189,100 |
Estacio Participacoes SA | 2,581,600 | | 19,936,470 |
Fibria Celulose SA (a) | 1,079,900 | | 14,003,703 |
Gerdau SA sponsored ADR | 4,779,800 | | 37,903,814 |
Itau Unibanco Holding SA sponsored ADR | 7,815,906 | | 120,443,111 |
Petroleo Brasileiro SA - Petrobras: | | | |
(PN) sponsored ADR (non-vtg.) | 1,254,400 | | 22,779,904 |
sponsored ADR | 2,866,574 | | 49,964,385 |
Smiles SA | 1,489,200 | | 19,537,357 |
TIM Participacoes SA sponsored ADR | 337,800 | | 8,586,876 |
Ultrapar Participacoes SA | 2,291,150 | | 61,057,787 |
Vale SA (PN-A) sponsored ADR | 7,699,200 | | 112,716,288 |
TOTAL BRAZIL | | 626,389,496 |
British Virgin Islands - 0.0% |
Luxoft Holding, Inc. | 104,170 | | 3,043,847 |
Canada - 0.8% |
First Quantum Minerals Ltd. (d) | 1,329,500 | | 25,221,800 |
Common Stocks - continued |
| Shares | | Value |
Canada - continued |
Goldcorp, Inc. | 631,700 | | $ 16,091,643 |
Pan American Silver Corp. | 987,200 | | 10,474,192 |
Torex Gold Resources, Inc. (a) | 6,274,500 | | 6,980,693 |
TOTAL CANADA | | 58,768,328 |
Cayman Islands - 8.0% |
21Vianet Group, Inc. ADR (a)(d) | 1,126,534 | | 20,277,612 |
58.com, Inc. ADR | 34,100 | | 822,492 |
Anta Sports Products Ltd. | 15,883,000 | | 22,780,725 |
Anton Oilfield Services Group | 37,062,000 | | 23,423,681 |
China Liansu Group Holdings Ltd. | 26,820,000 | | 17,158,158 |
Cimc Enric Holdings Ltd. | 12,952,000 | | 18,242,724 |
Ctrip.com International Ltd. sponsored ADR (a)(d) | 447,500 | | 24,276,875 |
Eurasia Drilling Co. Ltd. GDR (Reg. S) | 959,339 | | 40,628,007 |
GCL-Poly Energy Holdings Ltd. (a) | 125,797,000 | | 38,616,904 |
Greatview Aseptic Pack Co. Ltd. | 39,890,000 | | 25,108,113 |
Haitian International Holdings Ltd. | 9,643,000 | | 23,233,747 |
Hengan International Group Co. Ltd. | 4,524,000 | | 55,404,850 |
Hilong Holding Ltd. | 17,893,000 | | 11,908,665 |
Springland International Holdings Ltd. | 30,696,000 | | 16,826,777 |
Tencent Holdings Ltd. | 2,720,600 | | 148,504,826 |
Uni-President China Holdings Ltd. | 29,156,000 | | 29,144,718 |
Veripos (e) | 2,887,148 | | 14,258,599 |
Xueda Education Group sponsored ADR (d) | 2,947,085 | | 13,792,358 |
Yingde Gases Group Co. Ltd. | 23,049,500 | | 23,664,906 |
TOTAL CAYMAN ISLANDS | | 568,074,737 |
Chile - 1.5% |
Banco Santander Chile | 600,967,424 | | 36,932,077 |
Embotelladora Andina SA ADR | 231,600 | | 5,998,440 |
Empresa Nacional de Electricidad SA | 11,154,999 | | 17,007,428 |
Empresa Nacional de Telecomunicaciones SA (ENTEL) | 1,318,375 | | 20,288,436 |
Inversiones La Construccion SA | 787,936 | | 11,828,655 |
Sociedad Quimica y Minera de Chile SA (PN-B) sponsored ADR (d) | 424,900 | | 11,731,489 |
TOTAL CHILE | | 103,786,525 |
China - 6.8% |
Anhui Conch Cement Co. Ltd. (H Shares) | 7,732,000 | | 26,976,732 |
BBMG Corp. (H Shares) | 35,424,000 | | 25,404,029 |
China Communications Construction Co. Ltd. (H Shares) | 34,058,000 | | 27,806,931 |
China Construction Bank Corp. (H Shares) | 66,338,000 | | 51,509,707 |
China Pacific Insurance Group Co. Ltd. (H Shares) | 26,645,800 | | 96,231,446 |
Common Stocks - continued |
| Shares | | Value |
China - continued |
China Suntien Green Energy Corp. Ltd. (H Shares) | 25,039,400 | | $ 8,752,325 |
China Telecom Corp. Ltd. (H Shares) | 94,195,782 | | 49,203,675 |
Industrial & Commercial Bank of China Ltd. (H Shares) | 184,169,000 | | 128,987,188 |
Maanshan Iron & Steel Ltd. (H Shares) (a) | 60,618,000 | | 15,480,929 |
PICC Property & Casualty Co. Ltd. (H Shares) | 18,658,500 | | 28,590,607 |
Weichai Power Co. Ltd. (H Shares) | 5,957,000 | | 23,857,197 |
TOTAL CHINA | | 482,800,766 |
Cyprus - 0.4% |
Globaltrans Investment PLC: | | | |
GDR (f) | 324,900 | | 4,938,480 |
GDR (Reg. S) | 1,683,800 | | 25,593,760 |
TOTAL CYPRUS | | 30,532,240 |
Czech Republic - 0.1% |
Ceske Energeticke Zavody A/S | 183,900 | | 5,293,409 |
Denmark - 0.3% |
Auriga Industries A/S Series B (a) | 569,082 | | 22,325,066 |
France - 0.3% |
Technip SA | 193,300 | | 20,248,255 |
Hong Kong - 1.7% |
AIA Group Ltd. | 3,393,200 | | 17,222,033 |
CNOOC Ltd. | 2,482,000 | | 5,048,317 |
CNOOC Ltd. sponsored ADR | 74,600 | | 15,092,326 |
Far East Horizon Ltd. | 35,137,300 | | 25,696,955 |
Lenovo Group Ltd. | 44,060,000 | | 47,168,580 |
Sinotruk Hong Kong Ltd. | 24,050,000 | | 12,594,222 |
TOTAL HONG KONG | | 122,822,433 |
India - 6.8% |
Axis Bank Ltd. | 3,173,431 | | 62,964,983 |
Bajaj Auto Ltd. | 642,685 | | 22,213,014 |
Bharti Airtel Ltd. | 4,369,003 | | 26,026,565 |
Bharti Infratel Ltd. | 8,331,875 | | 22,288,550 |
Eicher Motors Ltd. | 335,896 | | 21,573,186 |
Grasim Industries Ltd. | 475,050 | | 22,330,113 |
Indiabulls Real Estate Ltd. | 17,561,547 | | 17,853,936 |
ITC Ltd. | 11,456,046 | | 62,277,286 |
JK Cement Ltd. | 2,108,305 | | 6,614,968 |
Larsen & Toubro Ltd. | 2,041,084 | | 32,250,479 |
Lupin Ltd. | 1,458,981 | | 21,662,661 |
Maruti Suzuki India Ltd. | 1,257,885 | | 33,398,537 |
Common Stocks - continued |
| Shares | | Value |
India - continued |
Mundra Port and SEZ Ltd. | 11,204,955 | | $ 26,455,942 |
NHPC Ltd. | 48,862,812 | | 14,351,826 |
NTPC Ltd. | 10,819,889 | | 26,178,850 |
Petronet LNG Ltd. | 8,210,397 | | 16,554,294 |
Phoenix Mills Ltd. (a) | 3,528,962 | | 13,411,705 |
SREI Infrastructure Finance Ltd. (e) | 44,360,128 | | 14,720,963 |
Ultratech Cemco Ltd. | 565,063 | | 18,035,087 |
TOTAL INDIA | | 481,162,945 |
Indonesia - 1.6% |
PT AKR Corporindo Tbk | 25,804,000 | | 11,102,128 |
PT Bakrieland Development Tbk (a)(e) | 2,209,211,500 | | 9,799,068 |
PT Bank Rakyat Indonesia Tbk | 42,171,500 | | 29,554,500 |
PT Bank Tabungan Negara Tbk | 130,320,800 | | 11,214,062 |
PT Kalbe Farma Tbk | 167,209,500 | | 19,283,319 |
PT Telkomunikasi Indonesia Tbk sponsored ADR | 784,079 | | 31,959,060 |
TOTAL INDONESIA | | 112,912,137 |
Isle of Man - 0.0% |
IBS Group Holding Ltd. GDR (Reg. S) | 129,698 | | 3,503,459 |
Israel - 0.3% |
NICE Systems Ltd. sponsored ADR | 478,300 | | 18,739,794 |
Kenya - 0.3% |
Equity Bank Ltd. | 58,735,900 | | 24,430,281 |
Korea (South) - 17.1% |
AMOREPACIFIC Group, Inc. | 77,888 | | 27,484,776 |
Daewoo International Corp. | 1,789,060 | | 65,997,351 |
Daou Technology, Inc. (e) | 1,198,370 | | 16,429,478 |
E-Mart Co. Ltd. | 281,914 | | 67,471,473 |
Hana Financial Group, Inc. | 2,758,910 | | 106,323,845 |
Hankook Shell Oil Co. Ltd. | 28,265 | | 14,008,917 |
Hyundai Heavy Industries Co. Ltd. | 794 | | 189,657 |
Hyundai Industrial Development & Construction Co. | 1,237,970 | | 27,529,096 |
Hyundai Mobis | 117,954 | | 33,287,359 |
KB Financial Group, Inc. | 2,698,902 | | 106,239,026 |
Korea Electric Power Corp. (a) | 993,850 | | 26,528,489 |
Korea Plant Service & Engineering Co. Ltd. | 28,996 | | 1,469,908 |
Korean Reinsurance Co. | 2,814,080 | | 31,553,914 |
KT&G Corp. | 392,722 | | 28,678,522 |
LG Chemical Ltd. | 139,998 | | 39,508,314 |
LG Corp. | 525,613 | | 31,052,994 |
Common Stocks - continued |
| Shares | | Value |
Korea (South) - continued |
Lotte Chemical Corp. | 85,719 | | $ 17,567,347 |
NHN Corp. | 119,655 | | 67,309,291 |
Oci Co. Ltd. | 160,717 | | 29,075,881 |
POSCO sponsored ADR | 499,900 | | 37,222,554 |
Samsung Electronics Co. Ltd. | 243,576 | | 336,234,246 |
Samsung Life Insurance Co. Ltd. | 433,575 | | 42,692,379 |
SK Hynix, Inc. (a) | 882,870 | | 26,578,928 |
SK Telecom Co. Ltd. | 154,169 | | 33,579,752 |
TOTAL KOREA (SOUTH) | | 1,214,013,497 |
Luxembourg - 0.4% |
Subsea 7 SA | 1,285,923 | | 27,195,758 |
Malaysia - 0.4% |
Petronas Dagangan Bhd | 2,405,100 | | 23,315,717 |
Tenaga Nasional Bhd | 1,405,750 | | 4,199,659 |
TOTAL MALAYSIA | | 27,515,376 |
Mexico - 5.1% |
Alpek SA de CV | 4,585,400 | | 9,949,428 |
America Movil S.A.B. de CV Series L sponsored ADR | 3,668,400 | | 78,540,444 |
CEMEX SA de CV sponsored ADR | 2,786,801 | | 29,484,355 |
El Puerto de Liverpool S.A.B. de CV Class C | 2,174,900 | | 23,488,870 |
Fomento Economico Mexicano S.A.B. de CV sponsored ADR | 581,000 | | 54,207,300 |
Gruma S.A.B. de CV Series B (a) | 5,018,500 | | 34,394,548 |
Grupo Comercial Chedraui S.A.B. de CV | 7,604,700 | | 23,780,625 |
Grupo Financiero Banorte S.A.B. de CV Series O | 6,682,000 | | 42,650,901 |
Grupo Televisa SA de CV (CPO) sponsored ADR | 2,241,600 | | 68,234,304 |
TOTAL MEXICO | | 364,730,775 |
Netherlands - 0.4% |
Fugro NV (Certificaten Van Aandelen) | 470,868 | | 29,463,110 |
Nigeria - 1.6% |
Guaranty Trust Bank PLC GDR (Reg. S) | 5,642,735 | | 44,013,333 |
Zenith Bank PLC | 540,417,770 | | 73,303,516 |
TOTAL NIGERIA | | 117,316,849 |
Norway - 1.1% |
ElectroMagnetic GeoServices ASA (a)(d) | 8,129,903 | | 9,388,983 |
Spectrum ASA | 1,382,152 | | 8,010,053 |
TGS Nopec Geophysical Co. ASA | 2,334,704 | | 64,240,098 |
TOTAL NORWAY | | 81,639,134 |
Common Stocks - continued |
| Shares | | Value |
Panama - 0.5% |
Copa Holdings SA Class A | 214,800 | | $ 32,121,192 |
Philippines - 1.4% |
Alliance Global Group, Inc. | 35,972,000 | | 21,933,638 |
Metropolitan Bank & Trust Co. | 13,953,882 | | 28,737,602 |
Robinsons Land Corp. | 93,332,450 | | 49,025,722 |
TOTAL PHILIPPINES | | 99,696,962 |
Poland - 0.6% |
Powszechny Zaklad Ubezpieczen SA | 197,900 | | 30,118,500 |
Telekomunikacja Polska SA | 3,246,400 | | 10,517,984 |
TOTAL POLAND | | 40,636,484 |
Portugal - 0.4% |
BPI-SGPS SA (a) | 4,406,446 | | 6,999,937 |
Jeronimo Martins SGPS SA | 1,279,500 | | 23,643,852 |
TOTAL PORTUGAL | | 30,643,789 |
Russia - 6.8% |
DIXY Group OJSC (a) | 668,217 | | 8,807,465 |
E.ON Russia JSC | 626,973,500 | | 48,678,724 |
Gazprom OAO sponsored ADR | 5,510,496 | | 51,412,928 |
LUKOIL Oil Co. | 116,700 | | 7,656,098 |
Magnit OJSC | 190,182 | | 51,177,153 |
Mobile TeleSystems OJSC | 8,560,300 | | 90,111,933 |
Norilsk Nickel OJSC ADR | 1,644,400 | | 24,896,216 |
RusHydro JSC sponsored ADR | 3,231,928 | | 5,442,567 |
Sberbank (Savings Bank of the Russian Federation) | 44,073,600 | | 141,274,090 |
Sistema JSFC | 28,565,600 | | 31,826,697 |
VTB Bank OJSC sponsored GDR (Reg. S) | 8,961,400 | | 24,903,731 |
TOTAL RUSSIA | | 486,187,602 |
Singapore - 1.4% |
Ezion Holdings Ltd. | 28,136,000 | | 50,736,307 |
First Resources Ltd. | 17,115,000 | | 26,867,050 |
Super Group Ltd. Singapore | 6,108,000 | | 20,700,918 |
TOTAL SINGAPORE | | 98,304,275 |
South Africa - 5.0% |
Aspen Pharmacare Holdings Ltd. | 1,450,500 | | 40,380,649 |
Barclays Africa Group Ltd. | 1,783,433 | | 27,534,731 |
Blue Label Telecoms Ltd. | 5,586,339 | | 5,253,148 |
Impala Platinum Holdings Ltd. | 1,985,200 | | 24,125,952 |
JSE Ltd. | 1,754,820 | | 15,347,847 |
Common Stocks - continued |
| Shares | | Value |
South Africa - continued |
Life Healthcare Group Holdings Ltd. | 6,650,400 | | $ 27,161,390 |
MTN Group Ltd. | 3,724,200 | | 74,025,837 |
Naspers Ltd. Class N | 1,156,800 | | 108,204,229 |
Reunert Ltd. | 2,369,700 | | 16,641,898 |
Wilson Bayly Holmes-Ovcon Ltd. | 953,000 | | 16,707,107 |
TOTAL SOUTH AFRICA | | 355,382,788 |
Taiwan - 7.0% |
Chipbond Technology Corp. | 7,241,000 | | 14,612,380 |
Chroma ATE, Inc. | 4,229,012 | | 8,993,924 |
Cleanaway Co. Ltd. | 2,438,000 | | 15,240,088 |
E.SUN Financial Holdings Co. Ltd. | 41,794,700 | | 27,900,997 |
ECLAT Textile Co. Ltd. | 2,858,680 | | 31,417,801 |
Hon Hai Precision Industry Co. Ltd. (Foxconn) | 2,929,500 | | 7,414,566 |
King Slide Works Co. Ltd. | 620,000 | | 5,476,474 |
MediaTek, Inc. | 4,280,000 | | 58,452,862 |
Taiwan Fertilizer Co. Ltd. | 16,598,700 | | 39,473,722 |
Taiwan Semiconductor Manufacturing Co. Ltd. | 40,249,284 | | 148,061,657 |
Taiwan Semiconductor Manufacturing Co. Ltd. sponsored ADR | 3,832,501 | | 70,556,343 |
Tong Hsing Electronics Industries Ltd. | 2,506,870 | | 13,243,359 |
Unified-President Enterprises Corp. | 14,493,866 | | 27,574,537 |
Universal Cement Corp. | 2,889,000 | | 2,650,008 |
Yuanta Financial Holding Co. Ltd. | 46,654,000 | | 25,359,742 |
TOTAL TAIWAN | | 496,428,460 |
Thailand - 0.6% |
Bangkok Bank PCL (For. Reg.) | 6,286,600 | | 41,607,698 |
Togo - 0.3% |
Ecobank Transnational, Inc. | 250,647,623 | | 21,907,990 |
Turkey - 1.1% |
Aygaz A/S | 2,498,147 | | 11,437,978 |
Tupras Turkiye Petrol Rafinelleri A/S | 1,694,632 | | 38,455,519 |
Turkiye Halk Bankasi A/S | 3,730,000 | | 30,176,331 |
TOTAL TURKEY | | 80,069,828 |
United Kingdom - 0.6% |
John Wood Group PLC | 2,106,010 | | 27,419,425 |
Mondi PLC | 732,100 | | 13,076,679 |
TOTAL UNITED KINGDOM | | 40,496,104 |
United States of America - 1.1% |
Cognizant Technology Solutions Corp. Class A (a) | 249,500 | | 21,689,035 |
Common Stocks - continued |
| Shares | | Value |
United States of America - continued |
InvenSense, Inc. (a)(d) | 1,327,607 | | $ 22,423,282 |
Sohu.com, Inc. (a) | 396,900 | | 26,576,424 |
Universal Display Corp. (a)(d) | 285,980 | | 9,122,762 |
TOTAL UNITED STATES OF AMERICA | | 79,811,503 |
TOTAL COMMON STOCKS (Cost $5,736,338,962) |
6,656,021,795
|
Nonconvertible Preferred Stocks - 4.3% |
| | | |
Brazil - 1.3% |
Alpargatas Sa (PN) | 2,978,100 | | 20,605,549 |
Banco do Estado Rio Grande do Sul SA | 2,620,900 | | 18,894,534 |
Braskem SA (PN-A) | 2,165,700 | | 19,218,872 |
Companhia Paranaense de Energia-Copel (PN-B) | 68,100 | | 949,667 |
Lojas Americanas SA (PN) | 4,095,088 | | 30,308,258 |
TOTAL BRAZIL | | 89,976,880 |
Chile - 0.3% |
Embotelladora Andina SA Class A | 4,850,551 | | 20,547,968 |
Korea (South) - 1.1% |
Hyundai Motor Co. Series 2 | 395,199 | | 44,685,530 |
Samsung Electronics Co. Ltd. | 39,484 | | 38,097,014 |
TOTAL KOREA (SOUTH) | | 82,782,544 |
Russia - 1.6% |
Sberbank (Savings Bank of the Russian Federation) | 29,789,500 | | 76,938,155 |
Surgutneftegas | 51,506,450 | | 38,303,714 |
TOTAL RUSSIA | | 115,241,869 |
TOTAL NONCONVERTIBLE PREFERRED STOCKS (Cost $256,391,298) |
308,549,261
|
Government Obligations - 0.1% |
| Principal Amount | | |
United States of America - 0.1% |
U.S. Treasury Bills, yield at date of purchase 0.01% to 0.04% 11/29/13 to 1/2/14 (g)
(Cost $6,224,869) | | $ 6,225,000 | |
6,224,790
|
Money Market Funds - 2.0% |
| Shares | | Value |
Fidelity Cash Central Fund, 0.09% (b) | 100,646,973 | | $ 100,646,973 |
Fidelity Securities Lending Cash Central Fund, 0.09% (b)(c) | 39,316,397 | | 39,316,397 |
TOTAL MONEY MARKET FUNDS (Cost $139,963,370) |
139,963,370
|
TOTAL INVESTMENT PORTFOLIO - 100.0% (Cost $6,138,918,499) | | 7,110,759,216 |
NET OTHER ASSETS (LIABILITIES) - 0.0% | | 3,489,545 |
NET ASSETS - 100% | $ 7,114,248,761 |
Futures Contracts |
| Expiration Date | | Underlying Face Amount at Value | | Unrealized Appreciation/
(Depreciation) |
Purchased |
Equity Index Contracts |
1,072 NYSE E-mini MSCI Emerging Markets Index Contracts (United States) | Dec. 2013 | | $ 54,881,040 | | $ (251,067) |
|
The face value of futures purchased as a percentage of net assets is 0.8% |
Legend |
(a) Non-income producing |
(b) Affiliated fund that is generally available only to investment companies and other accounts managed by Fidelity Investments. The rate quoted is the annualized seven-day yield of the fund at period end. A complete unaudited listing of the fund's holdings as of its most recent quarter end is available upon request. In addition, each Fidelity Central Fund's financial statements, which are not covered by the Fund's Report of Independent Registered Public Accounting Firm, are available on the SEC's website or upon request. |
(c) Investment made with cash collateral received from securities on loan. |
(d) Security or a portion of the security is on loan at period end. |
(e) Affiliated company |
(f) Security exempt from registration under Rule 144A of the Securities Act of 1933. These securities may be resold in transactions exempt from registration, normally to qualified institutional buyers. At the end of the period, the value of these securities amounted to $4,938,480 or 0.1% of net assets. |
(g) Security or a portion of the security was pledged to cover margin requirements for futures contracts. At period end, the value of securities pledged amounted to $624,979. |
Affiliated Central Funds |
Information regarding fiscal year to date income earned by the Fund from investments in Fidelity Central Funds is as follows: |
Fund | Income earned |
Fidelity Cash Central Fund | $ 223,122 |
Fidelity Securities Lending Cash Central Fund | 437,947 |
Total | $ 661,069 |
Other Affiliated Issuers |
An affiliated company is a company in which the Fund has ownership of at least 5% of the voting securities. Fiscal year to date transactions with companies which are or were affiliates are as follows: |
Affiliate | Value, beginning of period | Purchases | Sales Proceeds | Dividend Income | Value,
end of
period |
China Suntien Green Energy Corp. Ltd.
(H Shares) | $ 22,582,764 | $ 9,803,676 | $ 38,896,918 | $ 213,988 | $ - |
Daou Technology, Inc. | - | 18,156,393 | - | - | 16,429,478 |
GP Investments Ltd. Class A (depositary receipt) | 15,128,168 | 9,082,415 | - | - | - |
Indiabulls Real Estate Ltd. | 9,917,615 | 29,431,992 | 17,267,248 | 1,775,021 | - |
PT Bakrieland Development Tbk | 7,766,273 | 6,674,507 | 560,929 | - | 9,799,068 |
SREI Infrastructure Finance Ltd. | 17,681,250 | 5,424,425 | 850,671 | 352,379 | 14,720,963 |
Veripos | 7,361,301 | 3,853,624 | 2,746,690 | 259,404 | 14,258,599 |
Total | $ 80,437,371 | $ 82,427,032 | $ 60,322,456 | $ 2,600,792 | $ 55,208,108 |
Other Information |
Categorizations in the Schedule of Investments are based on country or territory of incorporation. |
The following is a summary of the inputs used, as of October 31, 2013, involving the Fund's assets and liabilities carried at fair value. The inputs or methodology used for valuing securities may not be an indication of the risk associated with investing in those securities. For more information on valuation inputs, and their aggregation into the levels used in the table below, please refer to the Investment Valuation section in the accompanying Notes to Financial Statements. |
Valuation Inputs at Reporting Date: |
Description | Total | Level 1 | Level 2 | Level 3 |
Investments in Securities: | | | | |
Equities: | | | | |
Consumer Discretionary | $ 601,128,996 | $ 601,128,996 | $ - | $ - |
Consumer Staples | 602,742,601 | 602,742,601 | - | - |
Energy | 727,412,685 | 722,364,368 | 5,048,317 | - |
Financials | 1,844,608,493 | 1,738,369,467 | 106,239,026 | - |
Health Care | 108,488,019 | 86,825,358 | 21,662,661 | - |
Industrials | 520,176,916 | 520,176,916 | - | - |
Information Technology | 1,166,473,065 | 1,018,411,408 | 148,061,657 | - |
Materials | 715,183,705 | 692,853,592 | 22,330,113 | - |
Telecommunication Services | 476,955,809 | 394,172,382 | 82,783,427 | - |
Utilities | 201,400,767 | 174,872,278 | 26,528,489 | - |
Government Obligations | 6,224,790 | - | 6,224,790 | - |
Money Market Funds | 139,963,370 | 139,963,370 | - | - |
Total Investments in Securities: | $ 7,110,759,216 | $ 6,691,880,736 | $ 418,878,480 | $ - |
Derivative Instruments: | | | | |
Liabilities | | | | |
Futures Contracts | $ (251,067) | $ (251,067) | $ - | $ - |
Value of Derivative Instruments |
The following table is a summary of the Fund's value of derivative instruments by primary risk exposure as of October 31, 2013. For additional information on derivative instruments, please refer to the Derivative Instruments section in the accompanying Notes to Financial Statements. |
Primary Risk Exposure /
Derivative Type | Value |
| Asset | Liability |
Equity Risk | | |
Futures Contracts (a) | $ - | $ (251,067) |
(a) Reflects gross cumulative appreciation (depreciation) on futures contracts as presented in the Schedule of Investments. Only the period end receivable or payable for daily variation margin and net unrealized appreciation (depreciation) are presented in the Statement of Assets and Liabilities. |
See accompanying notes which are an integral part of the financial statements.
Annual Report
Fidelity Series Emerging Markets Fund
Statement of Assets and Liabilities
| October 31, 2013 |
| | |
Assets | | |
Investment in securities, at value (including securities loaned of $38,062,481) - See accompanying schedule: Unaffiliated issuers (cost $ 5,934,655,035) | $ 6,915,587,738 | |
Fidelity Central Funds (cost $139,963,370) | 139,963,370 | |
Other affiliated issuers (cost $64,300,094) | 55,208,108 | |
Total Investments (cost $6,138,918,499) | | $ 7,110,759,216 |
Foreign currency held at value (cost $1,940,212) | | 1,939,191 |
Receivable for investments sold | | 46,594,717 |
Receivable for fund shares sold | | 253,484,007 |
Dividends receivable | | 6,284,396 |
Distributions receivable from Fidelity Central Funds | | 68,841 |
Prepaid expenses | | 19,964 |
Other receivables | | 1,965,733 |
Total assets | | 7,421,116,065 |
| | |
Liabilities | | |
Payable to custodian bank | $ 428,094 | |
Payable for investments purchased | 259,889,464 | |
Payable for fund shares redeemed | 357,562 | |
Accrued management fee | 4,521,738 | |
Payable for daily variation margin for derivative instruments | 235,740 | |
Other affiliated payables | 631,667 | |
Other payables and accrued expenses | 1,486,642 | |
Collateral on securities loaned, at value | 39,316,397 | |
Total liabilities | | 306,867,304 |
| | |
Net Assets | | $ 7,114,248,761 |
Net Assets consist of: | | |
Paid in capital | | $ 6,410,185,602 |
Undistributed net investment income | | 69,317,447 |
Accumulated undistributed net realized gain (loss) on investments and foreign currency transactions | | (336,173,899) |
Net unrealized appreciation (depreciation) on investments and assets and liabilities in foreign currencies | | 970,919,611 |
Net Assets | | $ 7,114,248,761 |
See accompanying notes which are an integral part of the financial statements.
Annual Report
Statement of Assets and Liabilities - continued
| October 31, 2013 |
| | |
Series Emerging Markets:
Net Asset Value, offering price and redemption price
per share ($3,623,928,346 ÷ 206,367,481 shares) | | $ 17.56 |
| | |
Class F:
Net Asset Value, offering price and redemption price per share ($3,490,320,415 ÷ 198,121,207 shares) | | $ 17.62 |
See accompanying notes which are an integral part of the financial statements.
Annual Report
Fidelity Series Emerging Markets Fund
Financial Statements - continued
Statement of Operations
| Year ended October 31, 2013 |
| | |
Investment Income | | |
Dividends (including $2,600,792 earned from other affiliated issuers) | | $ 155,567,513 |
Interest | | 3,926 |
Income from Fidelity Central Funds | | 661,069 |
Income before foreign taxes withheld | | 156,232,508 |
Less foreign taxes withheld | | (17,084,418) |
Total income | | 139,148,090 |
| | |
Expenses | | |
Management fee | $ 49,113,107 | |
Transfer agent fees | 5,917,293 | |
Accounting and security lending fees | 1,625,992 | |
Custodian fees and expenses | 4,221,647 | |
Independent trustees' compensation | 34,701 | |
Audit | 112,025 | |
Legal | 15,340 | |
Miscellaneous | 55,118 | |
Total expenses before reductions | 61,095,223 | |
Expense reductions | (1,668,425) | 59,426,798 |
Net investment income (loss) | | 79,721,292 |
Realized and Unrealized Gain (Loss) Net realized gain (loss) on: | | |
Investment securities: | | |
Unaffiliated issuers | (5,695,908) | |
Other affiliated issuers | 6,096,969 | |
Foreign currency transactions | (3,784,126) | |
Futures contracts | (4,623,626) | |
Total net realized gain (loss) | | (8,006,691) |
Change in net unrealized appreciation (depreciation) on: Investment securities | 533,754,368 | |
Assets and liabilities in foreign currencies | (222,772) | |
Futures contracts | (251,067) | |
Total change in net unrealized appreciation (depreciation) | | 533,280,529 |
Net gain (loss) | | 525,273,838 |
Net increase (decrease) in net assets resulting from operations | | $ 604,995,130 |
See accompanying notes which are an integral part of the financial statements.
Annual Report
Statement of Changes in Net Assets
| Year ended
October 31,
2013 | Year ended
October 31,
2012 |
Increase (Decrease) in Net Assets | | |
Operations | | |
Net investment income (loss) | $ 79,721,292 | $ 76,582,555 |
Net realized gain (loss) | (8,006,691) | (280,829,756) |
Change in net unrealized appreciation (depreciation) | 533,280,529 | 509,717,190 |
Net increase (decrease) in net assets resulting
from operations | 604,995,130 | 305,469,989 |
Distributions to shareholders from net investment income | (83,765,985) | (31,500,009) |
Distributions to shareholders from net realized gain | (3,180,768) | (158,430,172) |
Total distributions | (86,946,753) | (189,930,181) |
Share transactions - net increase (decrease) | 842,777,045 | 781,840,186 |
Total increase (decrease) in net assets | 1,360,825,422 | 897,379,994 |
| | |
Net Assets | | |
Beginning of period | 5,753,423,339 | 4,856,043,345 |
End of period (including undistributed net investment income of $69,317,447 and undistributed net investment income of $73,362,140, respectively) | $ 7,114,248,761 | $ 5,753,423,339 |
See accompanying notes which are an integral part of the financial statements.
Annual Report
Financial Highlights - Series Emerging Markets
Years ended October 31, | 2013 | 2012 | 2011 | 2010 | 2009 G |
Selected Per-Share Data | | | | | |
Net asset value, beginning of period | $ 16.25 | $ 16.06 | $ 18.85 | $ 16.38 | $ 10.00 |
Income from Investment Operations | | | | | |
Net investment income (loss) D | .20 | .21 | .18 | .15 | .15 |
Net realized and unrealized gain (loss) | 1.34 | .59 | (2.19) | 4.03 | 6.27 |
Total from investment operations | 1.54 | .80 | (2.01) | 4.18 | 6.42 |
Distributions from net investment income | (.22) | (.09) | (.10) | (.09) | (.04) |
Distributions from net realized gain | (.01) | (.52) | (.68) | (1.62) | - |
Total distributions | (.23) | (.61) | (.78) | (1.71) | (.04) |
Net asset value, end of period | $ 17.56 | $ 16.25 | $ 16.06 | $ 18.85 | $ 16.38 |
Total Return B,C | 9.59% | 5.40% | (11.26)% | 27.32% | 64.35% |
Ratios to Average Net Assets E,H | | | | |
Expenses before reductions | 1.09% | 1.10% | 1.12% | 1.15% | 1.21% A |
Expenses net of fee waivers, if any | 1.09% | 1.10% | 1.12% | 1.15% | 1.21% A |
Expenses net of all reductions | 1.06% | 1.07% | 1.07% | 1.08% | 1.09% A |
Net investment income (loss) | 1.22% | 1.37% | 1.00% | .89% | 1.15% A |
Supplemental Data | | | | | |
Net assets, end of period (000 omitted) | $ 3,623,928 | $ 3,182,644 | $ 3,384,616 | $ 2,425,249 | $ 910,106 |
Portfolio turnover rate F | 79% | 80% | 104% | 92% | 109% A |
A Annualized
B Total returns for periods of less than one year are not annualized.
C Total returns would have been lower if certain expenses had not been reduced during the applicable periods shown.
D Calculated based on average shares outstanding during the period.
E Fees and expenses of any underlying Fidelity Central Funds are not included in the Fund's expense ratio. The Fund indirectly bears its proportionate share of the expenses of any underlying Fidelity Central Funds.
F Amount does not include the portfolio activity of any underlying Fidelity Central Funds.
G For the period December 9, 2008 (commencement of operations) to October 31, 2009.
H Expense ratios reflect operating expenses of the class. Expenses before reductions do not reflect amounts reimbursed by the investment adviser or reductions from brokerage service arrangements or reductions from other expense offset arrangements and do not represent the amount paid by the class during periods when reimbursements or reductions occur. Expense ratios before reductions for start-up periods may not be representative of longer-term operating periods. Expenses net of fee waivers reflect expenses after reimbursement by the investment adviser but prior to reductions from brokerage service arrangements or other expense offset arrangements. Expenses net of all reductions represent the net expenses paid by the class.
See accompanying notes which are an integral part of the financial statements.
Annual Report
Financial Highlights - Class F
Years ended October 31, | 2013 | 2012 | 2011 | 2010 | 2009 G |
Selected Per-Share Data | | | | | |
Net asset value, beginning of period | $ 16.30 | $ 16.11 | $ 18.90 | $ 16.40 | $ 13.91 |
Income from Investment Operations | | | | | |
Net investment income (loss) D | .23 | .25 | .21 | .19 | .02 |
Net realized and unrealized gain (loss) | 1.35 | .58 | (2.19) | 4.03 | 2.47 |
Total from investment operations | 1.58 | .83 | (1.98) | 4.22 | 2.49 |
Distributions from net investment income | (.26) | (.12) | (.13) | (.10) | - |
Distributions from net realized gain | (.01) | (.52) | (.68) | (1.62) | - |
Total distributions | (.26) I | (.64) | (.81) | (1.72) | - |
Net asset value, end of period | $ 17.62 | $ 16.30 | $ 16.11 | $ 18.90 | $ 16.40 |
Total Return B,C | 9.84% | 5.60% | (11.07)% | 27.59% | 17.90% |
Ratios to Average Net Assets E,H | | | | |
Expenses before reductions | .90% | .90% | .91% | .92% | .93% A |
Expenses net of fee waivers, if any | .90% | .90% | .91% | .92% | .93% A |
Expenses net of all reductions | .88% | .87% | .86% | .85% | .82% A |
Net investment income (loss) | 1.40% | 1.57% | 1.21% | 1.13% | .28% A |
Supplemental Data | | | | | |
Net assets, end of period (000 omitted) | $ 3,490,320 | $ 2,570,780 | $ 1,471,427 | $ 454,160 | $ 8,025 |
Portfolio turnover rate F | 79% | 80% | 104% | 92% | 109% A |
A Annualized
B Total returns for periods of less than one year are not annualized.
C Total returns would have been lower if certain expenses had not been reduced during the applicable periods shown.
D Calculated based on average shares outstanding during the period.
E Fees and expenses of any underlying Fidelity Central Funds are not included in the Fund's expense ratio. The Fund indirectly bears its proportionate share of the expenses of any underlying Fidelity Central Funds.
F Amount does not include the portfolio activity of any underlying Fidelity Central Funds.
G For the period June 26, 2009 (commencement of operations) to October 31, 2009.
H Expense ratios reflect operating expenses of the class. Expenses before reductions do not reflect amounts reimbursed by the investment adviser or reductions from brokerage service arrangements or reductions from other expense offset arrangements and do not represent the amount paid by the class during periods when reimbursements or reductions occur. Expense ratios before reductions for start-up periods may not be representative of longer-term operating periods. Expenses net of fee waivers reflect expenses after reimbursement by the investment adviser but prior to reductions from brokerage service arrangements or other expense offset arrangements. Expenses net of all reductions represent the net expenses paid by the class.
I Total distributions of $.26 per share is comprised of distributions from net investment income of $.255 and distributions from net realized gain of $.009 per share.
See accompanying notes which are an integral part of the financial statements.
Annual Report
Fidelity Series International Growth Fund
Average annual total return reflects the change in the value of an investment, assuming reinvestment of the class' distributions from dividend income and capital gains (the profits earned upon the sale of securities that have grown in value, if any) and assuming a constant rate of performance each year. The $10,000 table and the fund's returns do not reflect the deduction of taxes that a shareholder would pay on fund distributions or the redemption of fund shares. During periods of reimbursement by Fidelity, a fund's total return will be greater than it would be had the reimbursement not occurred. How a fund did yesterday is no guarantee of how it will do tomorrow.
Average Annual Total Returns
Periods ended October 31, 2013 | Past 1
year | Life of
fund A |
Fidelity Series International Growth Fund | 22.72% | 9.81% |
Class F | 22.88% | 10.04% |
A From December 3, 2009.
$10,000 Over Life of Fund
Let's say hypothetically that $10,000 was invested in Fidelity Series International Growth Fund, a class of the fund, on December 3, 2009, when the fund started. The chart shows how the value of your investment would have changed, and also shows how the MSCI EAFE ® Growth Index performed over the same period.
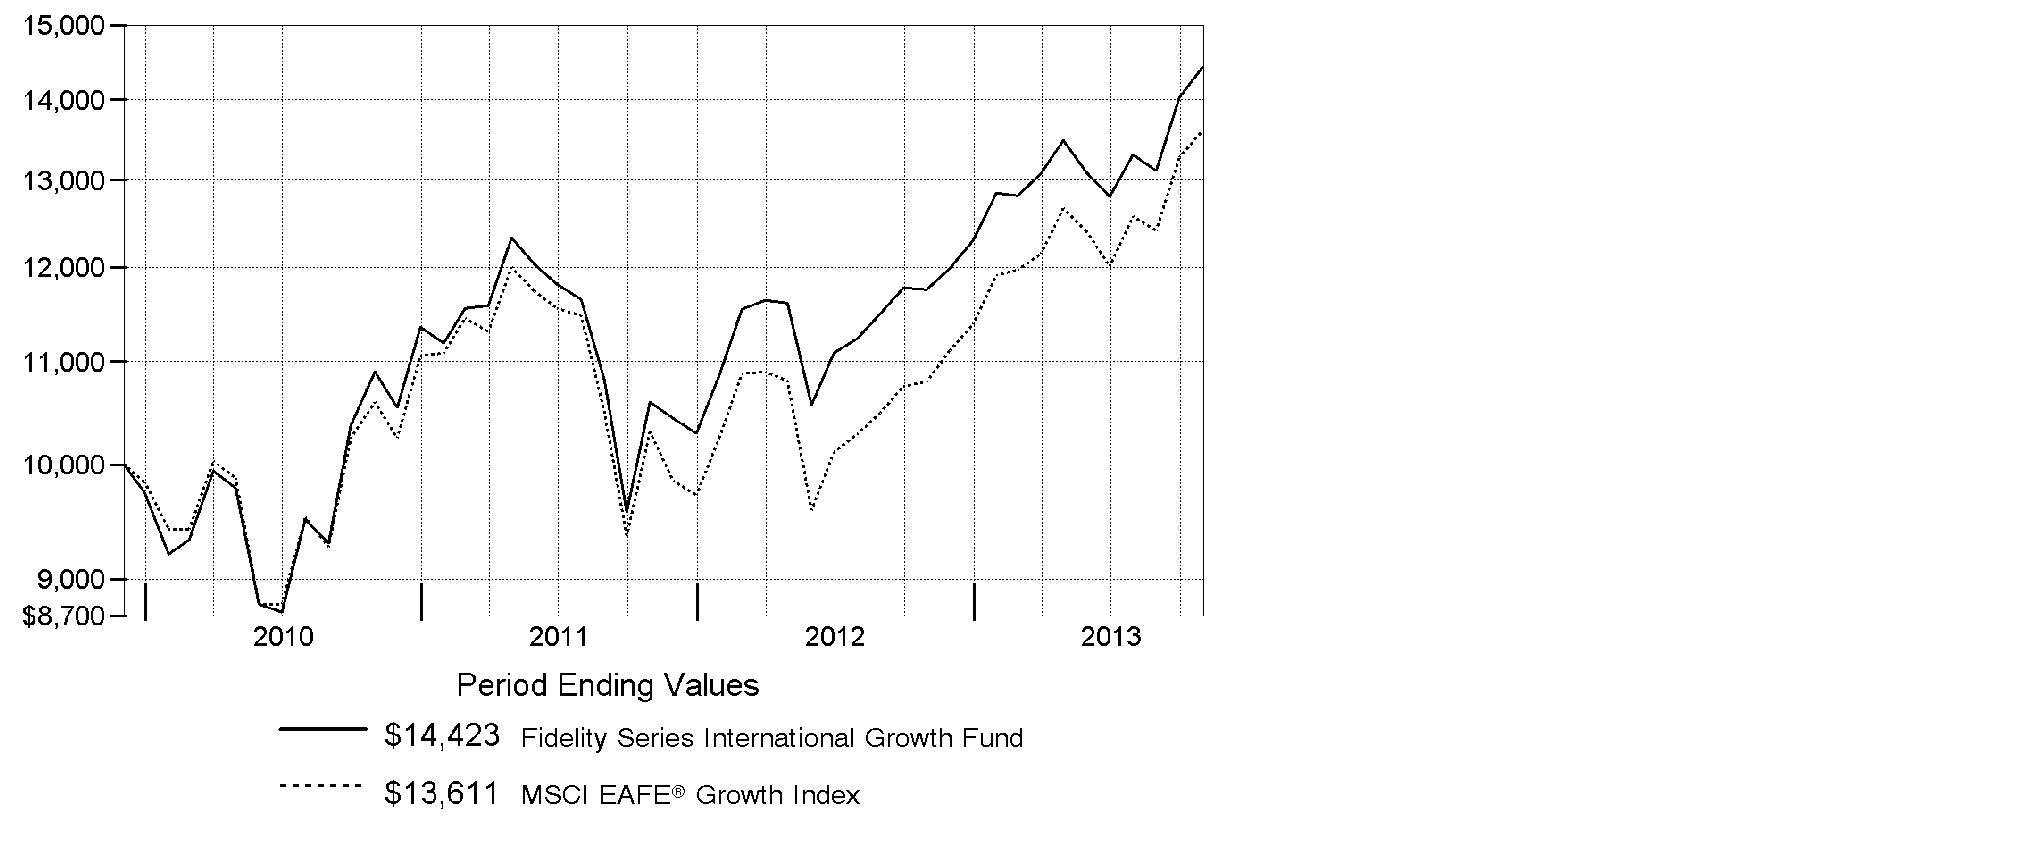
Annual Report
Fidelity Series International Growth Fund
Market Recap: On balance, global equity markets remained upbeat for the 12-month period ending October 31, 2013. The MSCI® ACWI® (All Country World Index) Index gained 23.75% for the period, amid investor preference for higher-risk assets. The period was not without turbulence, however. In the spring and summer, central banks worldwide, especially in the U.S. and China, made clear their intentions to maintain accommodative monetary policies. That stance, combined with modest cyclical improvements around the globe and generally low valuations, underpinned the broad rally in equities. Europe (+32%) shone brightly, with most markets in the region - large and small - registering solid, index-beating gains. Another bright spot was Japan, which, despite a struggling yen and taking a second-half breather, posted a 34% result for the full year. The U.S. - by far the index's biggest constituent - also outperformed the global market with a roughly 28% advance. Meanwhile, Asia-Pacific ex Japan (+14%) lagged, hurt in part by a slowdown in Australia's mining industry as well as currency headwinds. Foreign-exchange and commodity weakness also curbed results in resource-heavy Canada and emerging markets (EM), both of which were up 7%. Country-level EM performance diverged meaningfully for the period, as evidenced by performance in Brazil (-1%), Russia (+12%), India (+1%) and China (+8%).
Comments from Jed Weiss, Portfolio Manager of Fidelity® Series International Growth Fund: For the year, the fund's Series International Growth and Class F shares gained 22.72% and 22.88%, respectively, trailing the 26.07% advance of the MSCI® EAFE® Growth Index. Versus the index, picks in emerging markets detracted. Underweighting Europe and disappointing security selection there also hurt, even as Dutch semiconductor equipment company ASML Holding made an outsized contribution. Stock picking in Canada detracted, with out-of-index gold mining companies Goldcorp and Agnico Eagle Mines suffering from falling gold prices. I ultimately sold both. A moderate cash position curbed performance in an up market. Conversely, stock picking in Hong Kong was helpful, especially casino gaming companies Sands China and Wynn Macau, as was underweighting poor-performing Australia. Also contributing were the fund's out-of-benchmark holdings in companies headquartered in the U.S. but doing all or most of their business abroad. In strong-performing Japan, the impact was mixed, with a detrimental underweighting but favorable stock picking. The fund's biggest individual detractor was automaker Toyota Motor. Instead of owning this outperforming benchmark component, we held DENSO, a parts supplier whose largest customer is Toyota and which tempered the latter's negative relative impact.
The views expressed above reflect those of the portfolio manager(s) only through the end of the period as stated on the cover of this report and do not necessarily represent the views of Fidelity or any other person in the Fidelity organization. Any such views are subject to change at any time based upon market or other conditions and Fidelity disclaims any responsibility to update such views. These views may not be relied on as investment advice and, because investment decisions for a Fidelity fund are based on numerous factors, may not be relied on as an indication of trading intent on behalf of any Fidelity fund.
Annual Report
Fidelity Series International Growth Fund
Investment Changes (Unaudited)
Geographic Diversification (% of fund's net assets) |
As of October 31, 2013 |
| United Kingdom 17.6% | |
| Japan 16.6% | |
| United States of America* 15.1% | |
| Switzerland 12.3% | |
| Sweden 5.3% | |
| Belgium 4.8% | |
| Germany 4.4% | |
| Australia 3.3% | |
| France 3.2% | |
| Other 17.4% | |

* Includes Short-Term Investments and Net Other Assets (Liabilities). |
Percentages are based on country or territory of incorporation and are adjusted for the effect of futures contracts, if applicable. |
As of April 30, 2013 |
| United Kingdom 18.0% | |
| United States of America* 17.1% | |
| Japan 12.9% | |
| Switzerland 10.4% | |
| Sweden 5.4% | |
| Belgium 4.5% | |
| France 3.9% | |
| Australia 3.8% | |
| Germany 3.1% | |
| Other 20.9% | |

* Includes Short-Term Investments and Net Other Assets (Liabilities). |
Percentages are based on country or territory of incorporation and are adjusted for the effect of futures contracts, if applicable. |
Asset Allocation as of October 31, 2013 |
| % of fund's
net assets | % of fund's net assets
6 months ago |
Stocks | 97.7 | 97.5 |
Short-Term Investments and Net Other Assets (Liabilities) | 2.3 | 2.5 |
Top Ten Stocks as of October 31, 2013 |
| % of fund's
net assets | % of fund's net assets
6 months ago |
Nestle SA (Switzerland, Food Products) | 4.3 | 5.0 |
Anheuser-Busch InBev SA NV (Belgium, Beverages) | 3.4 | 3.6 |
Roche Holding AG (participation certificate) (Switzerland, Pharmaceuticals) | 3.3 | 2.5 |
DENSO Corp. (Japan, Auto Components) | 2.9 | 2.2 |
UBS AG (NY Shares) (Switzerland, Capital Markets) | 2.2 | 1.8 |
Linde AG (Germany, Chemicals) | 2.1 | 2.3 |
Keyence Corp. (Japan, Electronic Equipment & Components) | 2.0 | 1.3 |
Prudential PLC (United Kingdom, Insurance) | 1.8 | 0.0 |
Novo Nordisk A/S Series B sponsored ADR (Denmark, Pharmaceuticals) | 1.8 | 2.5 |
SABMiller PLC (United Kingdom, Beverages) | 1.7 | 2.0 |
| 25.5 | |
Market Sectors as of October 31, 2013 |
| % of fund's
net assets | % of fund's net assets
6 months ago |
Consumer Staples | 19.7 | 24.1 |
Consumer Discretionary | 17.0 | 16.1 |
Financials | 15.2 | 11.2 |
Industrials | 14.1 | 14.5 |
Health Care | 12.1 | 11.2 |
Materials | 7.6 | 10.6 |
Information Technology | 7.5 | 6.7 |
Energy | 2.9 | 3.1 |
Telecommunication Services | 1.6 | 0.0 |
Annual Report
Fidelity Series International Growth Fund
Investments October 31, 2013
Showing Percentage of Net Assets
Common Stocks - 97.7% |
| Shares | | Value |
Australia - 3.3% |
Coca-Cola Amatil Ltd. | 7,415,464 | | $ 90,412,563 |
CSL Ltd. | 2,792,640 | | 183,442,726 |
Sydney Airport unit | 12,635,580 | | 50,039,152 |
Transurban Group unit | 6,493,913 | | 43,577,825 |
TOTAL AUSTRALIA | | 367,472,266 |
Austria - 1.1% |
Andritz AG | 1,926,395 | | 118,668,085 |
Bailiwick of Jersey - 0.4% |
Informa PLC | 5,522,821 | | 49,545,354 |
Belgium - 4.8% |
Anheuser-Busch InBev SA NV | 3,637,481 | | 377,074,867 |
KBC Groupe SA | 1,593,072 | | 86,844,190 |
Umicore SA | 1,530,178 | | 72,996,447 |
TOTAL BELGIUM | | 536,915,504 |
Bermuda - 0.4% |
Lazard Ltd. Class A | 1,182,948 | | 45,720,940 |
Brazil - 0.1% |
Arezzo Industria e Comercio SA | 1,071,700 | | 16,026,225 |
Cayman Islands - 2.6% |
Sands China Ltd. | 24,529,600 | | 174,330,060 |
Wynn Macau Ltd. | 30,693,600 | | 117,778,227 |
TOTAL CAYMAN ISLANDS | | 292,108,287 |
Denmark - 1.8% |
Novo Nordisk A/S Series B sponsored ADR | 1,202,666 | | 200,448,342 |
Finland - 1.0% |
Nokian Tyres PLC (d) | 2,096,036 | | 106,066,428 |
France - 3.2% |
Danone SA | 1,648,705 | | 122,268,466 |
Remy Cointreau SA | 508,201 | | 50,149,920 |
Safran SA | 1,722,686 | | 110,107,339 |
Sanofi SA | 741,115 | | 79,020,080 |
TOTAL FRANCE | | 361,545,805 |
Germany - 4.4% |
Bayer AG | 1,225,000 | | 152,253,333 |
Deutsche Bank AG | 926,900 | | 44,796,304 |
Deutsche Bank AG (NY Shares) | 23,900 | | 1,154,848 |
Common Stocks - continued |
| Shares | | Value |
Germany - continued |
Linde AG | 1,269,819 | | $ 241,287,341 |
Siemens AG sponsored ADR (d) | 414,355 | | 53,041,584 |
TOTAL GERMANY | | 492,533,410 |
India - 0.4% |
Housing Development Finance Corp. Ltd. | 2,822,777 | | 39,166,810 |
Ireland - 1.6% |
CRH PLC sponsored ADR (d) | 3,528,105 | | 86,368,010 |
James Hardie Industries PLC CDI | 9,388,573 | | 96,988,554 |
TOTAL IRELAND | | 183,356,564 |
Israel - 0.3% |
Azrieli Group | 1,019,186 | | 32,775,808 |
Italy - 0.8% |
Interpump Group SpA | 2,890,349 | | 32,179,845 |
Prada SpA | 5,741,500 | | 55,985,734 |
TOTAL ITALY | | 88,165,579 |
Japan - 16.6% |
AEON Mall Co. Ltd. | 1,916,100 | | 54,419,095 |
Aozora Bank Ltd. | 16,452,000 | | 47,826,535 |
Autobacs Seven Co. Ltd. | 2,080,800 | | 30,339,061 |
DENSO Corp. | 6,765,200 | | 325,192,465 |
East Japan Railway Co. | 350,000 | | 30,404,744 |
Fanuc Corp. | 572,900 | | 91,897,574 |
Fast Retailing Co. Ltd. | 334,000 | | 112,428,375 |
Japan Tobacco, Inc. | 3,187,200 | | 115,324,636 |
Keyence Corp. | 512,800 | | 219,780,962 |
Kobayashi Pharmaceutical Co. Ltd. | 210,500 | | 11,786,113 |
Mitsui Fudosan Co. Ltd. | 4,946,000 | | 163,840,729 |
Nomura Holdings, Inc. | 3,726,400 | | 27,527,044 |
Seven Bank Ltd. | 15,140,800 | | 53,587,166 |
Shinsei Bank Ltd. | 27,093,000 | | 63,433,014 |
SHO-BOND Holdings Co. Ltd. | 1,139,400 | | 53,355,078 |
SoftBank Corp. | 2,475,700 | | 184,882,575 |
Unicharm Corp. | 1,045,100 | | 67,125,638 |
USS Co. Ltd. | 9,800,100 | | 143,517,530 |
Yamato Kogyo Co. Ltd. | 1,702,700 | | 63,109,215 |
TOTAL JAPAN | | 1,859,777,549 |
Common Stocks - continued |
| Shares | | Value |
Mexico - 0.4% |
Fomento Economico Mexicano S.A.B. de CV sponsored ADR | 422,912 | | $ 39,457,690 |
Netherlands - 1.8% |
ASML Holding NV | 1,129,208 | | 106,868,245 |
ING Groep NV (Certificaten Van Aandelen) (a) | 7,019,504 | | 89,201,937 |
TOTAL NETHERLANDS | | 196,070,182 |
Portugal - 0.8% |
Jeronimo Martins SGPS SA | 5,081,579 | | 93,902,384 |
South Africa - 0.4% |
Clicks Group Ltd. | 7,827,484 | | 48,771,921 |
Spain - 1.9% |
Inditex SA (d) | 1,088,716 | | 178,862,703 |
Prosegur Compania de Seguridad SA (Reg.) | 4,629,389 | | 27,530,722 |
TOTAL SPAIN | | 206,393,425 |
Sweden - 5.3% |
ASSA ABLOY AB (B Shares) | 2,515,539 | | 124,883,125 |
Atlas Copco AB (A Shares) | 4,373,832 | | 121,359,402 |
Fagerhult AB | 262,531 | | 8,062,232 |
H&M Hennes & Mauritz AB (B Shares) | 3,456,925 | | 149,372,150 |
Intrum Justitia AB | 1,552,600 | | 41,330,468 |
SKF AB (B Shares) | 2,857,683 | | 75,719,195 |
Svenska Handelsbanken AB (A Shares) | 1,369,371 | | 62,043,862 |
Swedish Match Co. AB | 358,001 | | 11,811,732 |
TOTAL SWEDEN | | 594,582,166 |
Switzerland - 12.3% |
Credit Suisse Group | 1,386,566 | | 43,133,249 |
Nestle SA | 6,722,494 | | 485,256,239 |
Novartis AG | 1,459,160 | | 113,263,770 |
Roche Holding AG (participation certificate) | 1,318,656 | | 365,070,135 |
Schindler Holding AG: | | | |
(participation certificate) | 443,924 | | 62,966,902 |
(Reg.) | 119,619 | | 17,006,504 |
Swatch Group AG (Bearer) | 73,850 | | 47,247,396 |
UBS AG (NY Shares) | 12,641,213 | | 244,733,884 |
TOTAL SWITZERLAND | | 1,378,678,079 |
Turkey - 1.6% |
Coca-Cola Icecek A/S | 3,037,007 | | 87,097,633 |
Common Stocks - continued |
| Shares | | Value |
Turkey - continued |
Tupras Turkiye Petrol Rafinelleri A/S | 1,842,000 | | $ 41,799,674 |
Turkiye Garanti Bankasi A/S | 13,322,357 | | 53,656,481 |
TOTAL TURKEY | | 182,553,788 |
United Kingdom - 17.6% |
Babcock International Group PLC | 3,574,000 | | 73,064,533 |
Barclays PLC sponsored ADR (d) | 4,319,175 | | 72,605,332 |
BG Group PLC | 8,995,322 | | 183,678,170 |
BHP Billiton PLC ADR (d) | 1,434,890 | | 88,446,620 |
GlaxoSmithKline PLC sponsored ADR | 3,538,868 | | 186,250,623 |
InterContinental Hotel Group PLC ADR | 4,334,187 | | 127,208,388 |
Johnson Matthey PLC | 2,379,927 | | 114,631,888 |
Prudential PLC | 10,082,658 | | 206,198,062 |
Reckitt Benckiser Group PLC | 2,177,387 | | 169,254,458 |
Rexam PLC | 6,830,627 | | 56,896,821 |
Rolls-Royce Group PLC | 8,241,111 | | 151,958,670 |
Rotork PLC | 1,623,797 | | 74,540,957 |
SABMiller PLC | 3,702,483 | | 193,175,703 |
Serco Group PLC | 6,695,669 | | 59,798,605 |
Shaftesbury PLC | 2,830,400 | | 26,957,284 |
Standard Chartered PLC (United Kingdom) | 6,462,798 | | 155,384,943 |
Unite Group PLC | 4,544,900 | | 28,857,679 |
TOTAL UNITED KINGDOM | | 1,968,908,736 |
United States of America - 12.8% |
Autoliv, Inc. | 1,288,427 | | 114,966,341 |
Berkshire Hathaway, Inc. Class B (a) | 365,650 | | 42,079,002 |
BorgWarner, Inc. | 1,109,607 | | 114,433,770 |
Cummins, Inc. | 503,327 | | 63,932,596 |
FMC Technologies, Inc. (a) | 963,545 | | 48,707,200 |
Google, Inc. Class A (a) | 53,697 | | 55,339,054 |
KLA-Tencor Corp. | 803,420 | | 52,704,352 |
Martin Marietta Materials, Inc. (d) | 589,400 | | 57,814,246 |
MasterCard, Inc. Class A | 216,141 | | 154,994,711 |
Mead Johnson Nutrition Co. Class A | 1,435,956 | | 117,260,167 |
Mohawk Industries, Inc. (a) | 429,215 | | 56,836,650 |
National Oilwell Varco, Inc. | 799,182 | | 64,877,595 |
Philip Morris International, Inc. | 861,592 | | 76,785,079 |
PriceSmart, Inc. | 443,975 | | 50,519,915 |
ResMed, Inc. (d) | 1,208,300 | | 62,517,442 |
Solera Holdings, Inc. | 847,399 | | 47,640,772 |
SS&C Technologies Holdings, Inc. (a) | 1,236,100 | | 48,578,730 |
Common Stocks - continued |
| Shares | | Value |
United States of America - continued |
Union Pacific Corp. | 325,900 | | $ 49,341,260 |
Visa, Inc. Class A | 743,324 | | 146,189,531 |
TOTAL UNITED STATES OF AMERICA | | 1,425,518,413 |
TOTAL COMMON STOCKS (Cost $8,102,697,902) |
10,925,129,740
|
Nonconvertible Preferred Stocks - 0.0% |
| | | |
United Kingdom - 0.0% |
Rolls-Royce Group PLC Series C
(Cost $1,150,490) | 708,735,546 | |
1,136,387
|
Money Market Funds - 4.1% |
| | | |
Fidelity Cash Central Fund, 0.09% (b) | 197,076,167 | | 197,076,167 |
Fidelity Securities Lending Cash Central Fund, 0.09% (b)(c) | 254,383,626 | | 254,383,626 |
TOTAL MONEY MARKET FUNDS (Cost $451,459,793) |
451,459,793
|
TOTAL INVESTMENT PORTFOLIO - 101.8% (Cost $8,555,308,185) | 11,377,725,920 |
NET OTHER ASSETS (LIABILITIES) - (1.8)% | (199,343,425) |
NET ASSETS - 100% | $ 11,178,382,495 |
Legend |
(a) Non-income producing |
(b) Affiliated fund that is generally available only to investment companies and other accounts managed by Fidelity Investments. The rate quoted is the annualized seven-day yield of the fund at period end. A complete unaudited listing of the fund's holdings as of its most recent quarter end is available upon request. In addition, each Fidelity Central Fund's financial statements, which are not covered by the Fund's Report of Independent Registered Public Accounting Firm, are available on the SEC's website or upon request. |
(c) Investment made with cash collateral received from securities on loan. |
(d) Security or a portion of the security is on loan at period end. |
Affiliated Central Funds |
Information regarding fiscal year to date income earned by the Fund from investments in Fidelity Central Funds is as follows: |
Fund | Income earned |
Fidelity Cash Central Fund | $ 235,011 |
Fidelity Securities Lending Cash Central Fund | 5,969,221 |
Total | $ 6,204,232 |
Other Information |
Categorizations in the Schedule of Investments are based on country or territory of incorporation. |
The following is a summary of the inputs used, as of October 31, 2013, involving the Fund's assets and liabilities carried at fair value. The inputs or methodology used for valuing securities may not be an indication of the risk associated with investing in those securities. For more information on valuation inputs, and their aggregation into the levels used in the tables below, please refer to the Investment Valuation section in the accompanying Notes to Financial Statements. |
Valuation Inputs at Reporting Date: |
Description | Total | Level 1 | Level 2 | Level 3 |
Investments in Securities: | | | | |
Equities: | | | | |
Consumer Discretionary | $ 1,920,136,857 | $ 1,308,659,426 | $ 611,477,431 | $ - |
Consumer Staples | 2,207,435,124 | 1,150,867,631 | 1,056,567,493 | - |
Energy | 339,062,639 | 339,062,639 | - | - |
Financials | 1,685,944,198 | 891,981,063 | 793,963,135 | - |
Health Care | 1,342,266,451 | 1,149,982,601 | 192,283,850 | - |
Industrials | 1,535,902,784 | 1,360,245,388 | 175,657,396 | - |
Information Technology | 832,096,357 | 612,315,395 | 219,780,962 | - |
Materials | 878,539,142 | 815,429,927 | 63,109,215 | - |
Telecommunication Services | 184,882,575 | - | 184,882,575 | - |
Money Market Funds | 451,459,793 | 451,459,793 | - | - |
Total Investments in Securities: | $ 11,377,725,920 | $ 8,080,003,863 | $ 3,297,722,057 | $ - |
The following is a summary of transfers between Level 1 and Level 2 for the period ended October 31, 2013. Transfers are assumed to have occurred at the beginning of the period, and are primarily attributable to the valuation techniques used for foreign equity securities, as discussed in the accompanying Notes to Financial Statements: |
Transfers | Total |
Level 1 to Level 2 | $ 1,313,273,171 |
Level 2 to Level 1 | $ 0 |
See accompanying notes which are an integral part of the financial statements.
Annual Report
Fidelity Series International Growth Fund
Statement of Assets and Liabilities
| October 31, 2013 |
| | |
Assets | | |
Investment in securities, at value (including securities loaned of $244,524,112) - See accompanying schedule: Unaffiliated issuers (cost $8,103,848,392) | $ 10,926,266,127 | |
Fidelity Central Funds (cost $451,459,793) | 451,459,793 | |
Total Investments (cost $8,555,308,185) | | $ 11,377,725,920 |
Foreign currency held at value (cost $38) | | 38 |
Receivable for investments sold | | 49,772,903 |
Receivable for fund shares sold | | 63,338,426 |
Dividends receivable | | 25,592,531 |
Distributions receivable from Fidelity Central Funds | | 66,278 |
Prepaid expenses | | 34,250 |
Other receivables | | 278,484 |
Total assets | | 11,516,808,830 |
| | |
Liabilities | | |
Payable for investments purchased | $ 74,876,123 | |
Payable for fund shares redeemed | 1,159,053 | |
Accrued management fee | 6,824,481 | |
Other affiliated payables | 950,557 | |
Other payables and accrued expenses | 232,495 | |
Collateral on securities loaned, at value | 254,383,626 | |
Total liabilities | | 338,426,335 |
| | |
Net Assets | | $ 11,178,382,495 |
Net Assets consist of: | | |
Paid in capital | | $ 8,237,076,483 |
Undistributed net investment income | | 94,753,598 |
Accumulated undistributed net realized gain (loss) on investments and foreign currency transactions | | 23,946,006 |
Net unrealized appreciation (depreciation) on investments and assets and liabilities in foreign currencies | | 2,822,606,408 |
Net Assets | | $ 11,178,382,495 |
See accompanying notes which are an integral part of the financial statements.
Annual Report
Statement of Assets and Liabilities - continued
| October 31, 2013 |
| | |
Series International Growth:
Net Asset Value, offering price and redemption price
per share ($5,642,297,582 ÷ 404,567,672 shares) | | $ 13.95 |
| | |
Class F:
Net Asset Value, offering price and redemption price per share ($5,536,084,913 ÷ 395,745,829 shares) | | $ 13.99 |
See accompanying notes which are an integral part of the financial statements.
Annual Report
Fidelity Series International Growth Fund
Financial Statements - continued
Statement of Operations
| Year ended October 31, 2013 |
| | |
Investment Income | | |
Dividends | | $ 236,604,636 |
Interest | | 2,466 |
Income from Fidelity Central Funds | | 6,204,232 |
Income before foreign taxes withheld | | 242,811,334 |
Less foreign taxes withheld | | (16,598,152) |
Total income | | 226,213,182 |
| | |
Expenses | | |
Management fee
Basic fee | $ 69,798,789 | |
Performance adjustment | 11,443,152 | |
Transfer agent fees | 9,561,788 | |
Accounting and security lending fees | 1,819,975 | |
Custodian fees and expenses | 1,065,240 | |
Independent trustees' compensation | 56,151 | |
Audit | 73,534 | |
Legal | 23,410 | |
Interest | 1,909 | |
Miscellaneous | 87,923 | |
Total expenses before reductions | 93,931,871 | |
Expense reductions | (1,296,863) | 92,635,008 |
Net investment income (loss) | | 133,578,174 |
Realized and Unrealized Gain (Loss) Net realized gain (loss) on: | | |
Investment securities: | | |
Unaffiliated issuers | 384,577,210 | |
Foreign currency transactions | 496,934 | |
Futures contracts | (14,920,138) | |
Total net realized gain (loss) | | 370,154,006 |
Change in net unrealized appreciation (depreciation) on: Investment securities | 1,529,307,020 | |
Assets and liabilities in foreign currencies | 629,742 | |
Total change in net unrealized appreciation (depreciation) | | 1,529,936,762 |
Net gain (loss) | | 1,900,090,768 |
Net increase (decrease) in net assets resulting from operations | | $ 2,033,668,942 |
See accompanying notes which are an integral part of the financial statements.
Annual Report
Statement of Changes in Net Assets
| Year ended
October 31,
2013 | Year ended
October 31,
2012 |
Increase (Decrease) in Net Assets | | |
Operations | | |
Net investment income (loss) | $ 133,578,174 | $ 120,932,181 |
Net realized gain (loss) | 370,154,006 | (174,573,044) |
Change in net unrealized appreciation (depreciation) | 1,529,936,762 | 937,528,168 |
Net increase (decrease) in net assets resulting
from operations | 2,033,668,942 | 883,887,305 |
Distributions to shareholders from net investment income | (154,572,907) | (86,292,993) |
Distributions to shareholders from net realized gain | - | (4,902,084) |
Total distributions | (154,572,907) | (91,195,077) |
Share transactions - net increase (decrease) | 189,778,640 | 1,153,946,734 |
Total increase (decrease) in net assets | 2,068,874,675 | 1,946,638,962 |
| | |
Net Assets | | |
Beginning of period | 9,109,507,820 | 7,162,868,858 |
End of period (including undistributed net investment income of $94,753,598 and undistributed net investment income of $115,582,243, respectively) | $ 11,178,382,495 | $ 9,109,507,820 |
See accompanying notes which are an integral part of the financial statements.
Annual Report
Financial Highlights - Series International Growth
Years ended October 31, | 2013 | 2012 | 2011 | 2010 G |
Selected Per-Share Data | | | | |
Net asset value, beginning of period | $ 11.55 | $ 10.53 | $ 10.89 | $ 10.00 |
Income from Investment Operations | | | | |
Net investment income (loss) D | .16 | .15 | .16 | .09 |
Net realized and unrealized gain (loss) | 2.43 | .99 | (.46) | .80 |
Total from investment operations | 2.59 | 1.14 | (.30) | .89 |
Distributions from net investment income | (.19) | (.12) | (.05) | - |
Distributions from net realized gain | - | (.01) | (.01) | - |
Total distributions | (.19) | (.12) I | (.06) | - |
Net asset value, end of period | $ 13.95 | $ 11.55 | $ 10.53 | $ 10.89 |
Total Return B,C | 22.72% | 11.00% | (2.77)% | 8.90% |
Ratios to Average Net Assets E,H | | | | |
Expenses before reductions | 1.04% | 1.05% | 1.00% | 1.01% A |
Expenses net of fee waivers, if any | 1.04% | 1.05% | 1.00% | 1.01% A |
Expenses net of all reductions | 1.02% | 1.04% | .98% | .99% A |
Net investment income (loss) | 1.26% | 1.38% | 1.40% | 1.06% A |
Supplemental Data | | | | |
Net assets, end of period (000 omitted) | $ 5,642,298 | $ 5,045,151 | $ 4,996,927 | $ 3,944,123 |
Portfolio turnover rate F | 41% | 27% | 23% | 63% A |
A Annualized
B Total returns for periods of less than one year are not annualized.
C Total returns would have been lower if certain expenses had not been reduced during the applicable periods shown.
D Calculated based on average shares outstanding during the period.
E Fees and expenses of any underlying Fidelity Central Funds are not included in the Fund's expense ratio. The Fund indirectly bears its proportionate share of the expenses of any underlying Fidelity Central Funds.
F Amount does not include the portfolio activity of any underlying Fidelity Central Funds.
G For the period December 3, 2009 (commencement of operations) to October 31, 2010.
H Expense ratios reflect operating expenses of the class. Expenses before reductions do not reflect amounts reimbursed by the investment adviser or reductions from brokerage service arrangements or reductions from other expense offset arrangements and do not represent the amount paid by the class during periods when reimbursements or reductions occur. Expense ratios before reductions for start-up periods may not be representative of longer-term operating periods. Expenses net of fee waivers reflect expenses after reimbursement by the investment adviser but prior to reductions from brokerage service arrangements or other expense offset arrangements. Expenses net of all reductions represent the net expenses paid by the class.
I Total distributions of $.12 per share is comprised of distributions from net investment income of $.115 and distributions from net realized gain of $.007 per share.
See accompanying notes which are an integral part of the financial statements.
Annual Report
Financial Highlights - Class F
Years ended October 31, | 2013 | 2012 | 2011 | 2010 G |
Selected Per-Share Data | | | | |
Net asset value, beginning of period | $ 11.59 | $ 10.57 | $ 10.91 | $ 10.00 |
Income from Investment Operations | | | | |
Net investment income (loss) D | .18 | .17 | .18 | .11 |
Net realized and unrealized gain (loss) | 2.43 | 1.00 | (.45) | .80 |
Total from investment operations | 2.61 | 1.17 | (.27) | .91 |
Distributions from net investment income | (.21) | (.14) | (.06) | - |
Distributions from net realized gain | - | (.01) | (.01) | - |
Total distributions | (.21) | (.15) | (.07) | - |
Net asset value, end of period | $ 13.99 | $ 11.59 | $ 10.57 | $ 10.91 |
Total Return B,C | 22.88% | 11.23% | (2.50)% | 9.10% |
Ratios to Average Net Assets E,H | | | | |
Expenses before reductions | .85% | .85% | .79% | .78% A |
Expenses net of fee waivers, if any | .85% | .85% | .79% | .78% A |
Expenses net of all reductions | .84% | .84% | .77% | .75% A |
Net investment income (loss) | 1.44% | 1.58% | 1.62% | 1.29% A |
Supplemental Data | | | | |
Net assets, end of period (000 omitted) | $ 5,536,085 | $ 4,064,357 | $ 2,165,942 | $ 744,325 |
Portfolio turnover rate F | 41% | 27% | 23% | 63% A |
A Annualized
B Total returns for periods of less than one year are not annualized.
C Total returns would have been lower if certain expenses had not been reduced during the applicable periods shown.
D Calculated based on average shares outstanding during the period.
E Fees and expenses of any underlying Fidelity Central Funds are not included in the Fund's expense ratio. The Fund indirectly bears its proportionate share of the expenses of any underlying Fidelity Central Funds.
F Amount does not include the portfolio activity of any underlying Fidelity Central Funds.
G For the period December 3, 2009 (commencement of operations) to October 31, 2010.
H Expense ratios reflect operating expenses of the class. Expenses before reductions do not reflect amounts reimbursed by the investment adviser or reductions from brokerage service arrangements or reductions from other expense offset arrangements and do not represent the amount paid by the class during periods when reimbursements or reductions occur. Expense ratios before reductions for start-up periods may not be representative of longer-term operating periods. Expenses net of fee waivers reflect expenses after reimbursement by the investment adviser but prior to reductions from brokerage service arrangements or other expense offset arrangements. Expenses net of all reductions represent the net expenses paid by the class.
See accompanying notes which are an integral part of the financial statements.
Annual Report
Fidelity Series International Small Cap Fund
Average annual total return reflects the change in the value of an investment, assuming reinvestment of the class' distributions from dividend income and capital gains (the profits earned upon the sale of securities that have grown in value, if any) and assuming a constant rate of performance each year. The $10,000 table and the fund's returns do not reflect the deduction of taxes that a shareholder would pay on fund distributions or the redemption of fund shares. During periods of reimbursement by Fidelity, a fund's total return will be greater than it would be had the reimbursement not occurred. How a fund did yesterday is no guarantee of how it will do tomorrow.
Average Annual Total Returns
Periods ended October 31, 2013 | Past 1
year | Life of
fund A |
Fidelity Series International Small Cap Fund | 27.95% | 13.32% |
Class F | 28.14% | 13.54% |
A From December 3, 2009.
$10,000 Over Life of Fund
Let's say hypothetically that $10,000 was invested in Fidelity Series International Small Cap Fund, a class of the fund, on December 3, 2009, when the fund started. The chart shows how the value of your investment would have changed, and also shows how the MSCI EAFE Small Cap Index performed over the same period.
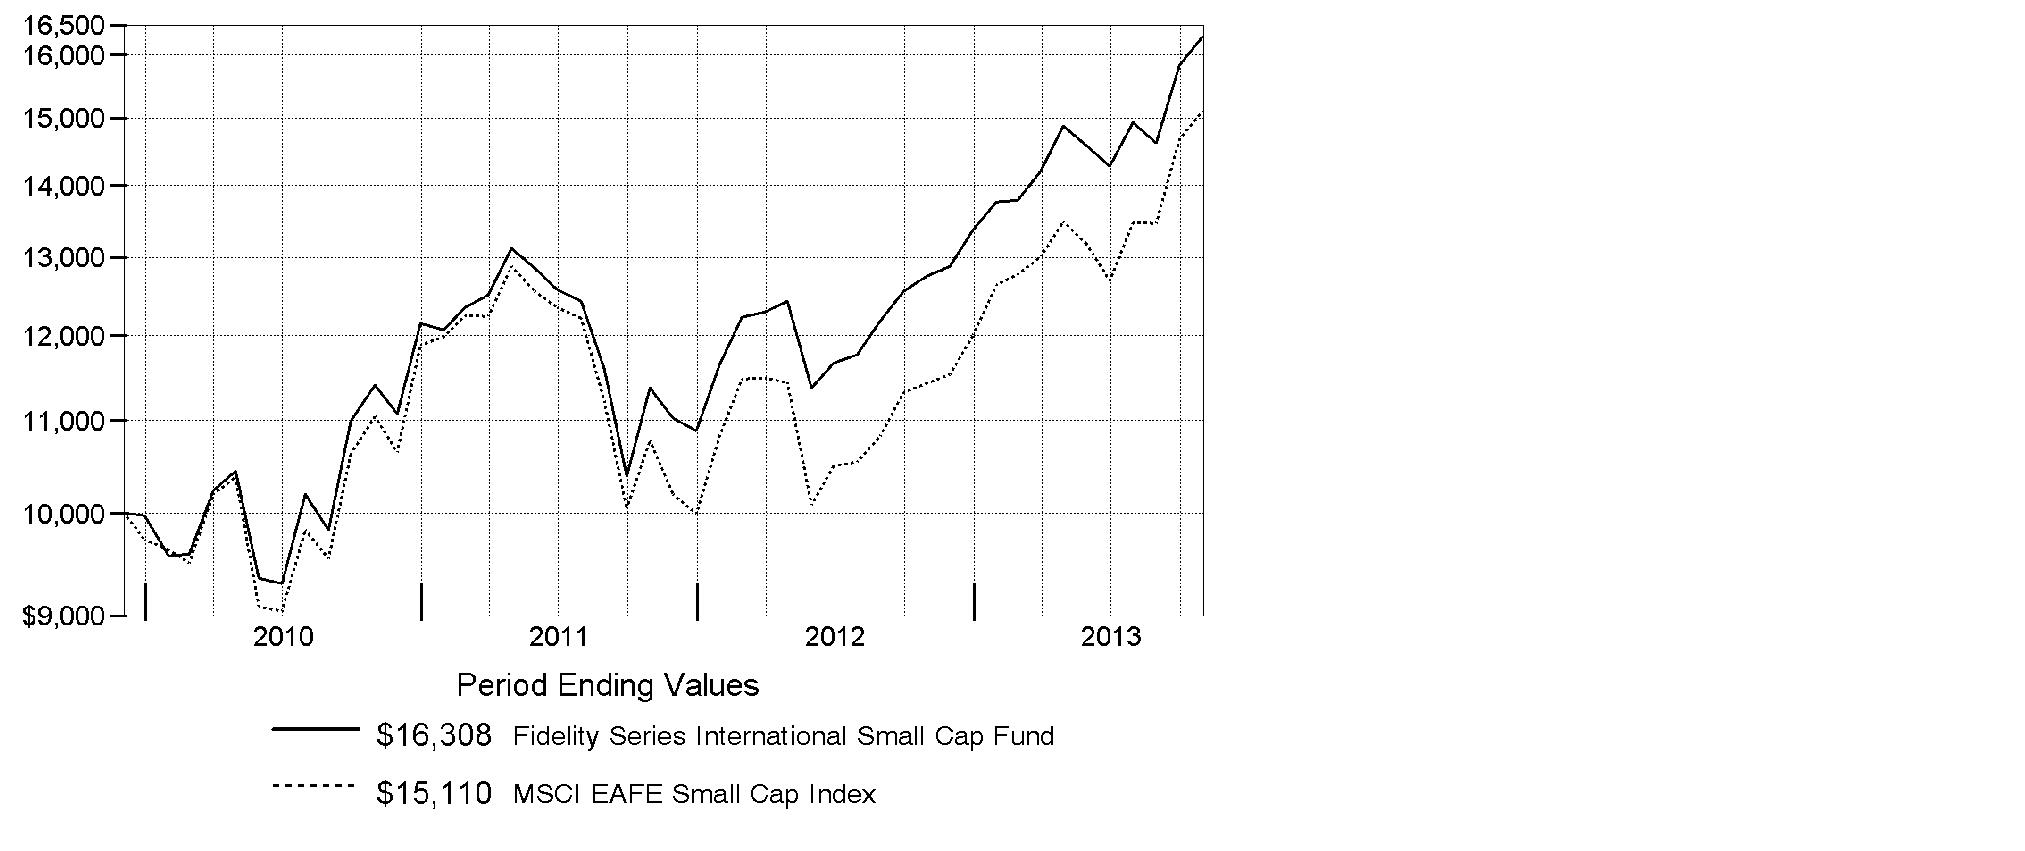
Annual Report
Fidelity Series International Small Cap Fund
Market Recap: On balance, global equity markets remained upbeat for the 12-month period ending October 31, 2013. The MSCI® ACWI® (All Country World Index) Index gained 23.75% for the period, amid investor preference for higher-risk assets. The period was not without turbulence, however. In the spring and summer, central banks worldwide, especially in the U.S. and China, made clear their intentions to maintain accommodative monetary policies. That stance, combined with modest cyclical improvements around the globe and generally low valuations, underpinned the broad rally in equities. Europe (+32%) shone brightly, with most markets in the region - large and small - registering solid, index-beating gains. Another bright spot was Japan, which, despite a struggling yen and taking a second-half breather, posted a 34% result for the full year. The U.S. - by far the index's biggest constituent - also outperformed the global market with a roughly 28% advance. Meanwhile, Asia-Pacific ex Japan (+14%) lagged, hurt in part by a slowdown in Australia's mining industry as well as currency headwinds. Foreign-exchange and commodity weakness also curbed results in resource-heavy Canada and emerging markets (EM), both of which were up 7%. Country-level EM performance diverged meaningfully for the period, as evidenced by performance in Brazil (-1%), Russia (+12%), India (+1%) and China (+8%).
Comments from Jed Weiss, Portfolio Manager of Fidelity® Series International Small Cap Fund: For the year, the fund's Series International Small Cap and Class F shares gained 27.95% and 28.14%, respectively, trailing the 32.33% increase in the MSCI® EAFE® Small Cap Index. Europe was a big detractor, as poor stock picking in the region weighed on the fund's result. The fund also had a moderate cash position, which hurt performance in an up market. Further, stock picking in Canada was a negative, with out-of-index mining-related companies Eldorado Gold, Copper Mountain Mining and Agnico Eagle Mines hurting results. I ultimately sold all three stocks. Emerging markets, especially South African drug store chain Clicks Group - which was not in the benchmark - posed an additional challenge. On the positive side, the fund was significantly helped by a large underweighting in the Asia-Pacific ex Japan region, especially Australia, which included a large number of poor-performing mining companies that I chose to avoid. The fund's out-of-benchmark U.S. holdings also helped. The vast majority of these investments were in companies that do all or most of their business abroad but that happen to be based here. Of final note, stock picking in Japan proved very helpful in relative terms, with investment bank Nihon M&A Center producing an outsized contribution.
The views expressed above reflect those of the portfolio manager(s) only through the end of the period as stated on the cover of this report and do not necessarily represent the views of Fidelity or any other person in the Fidelity organization. Any such views are subject to change at any time based upon market or other conditions and Fidelity disclaims any responsibility to update such views. These views may not be relied on as investment advice and, because investment decisions for a Fidelity fund are based on numerous factors, may not be relied on as an indication of trading intent on behalf of any Fidelity fund.
Annual Report
Fidelity Series International Small Cap Fund
Investment Changes (Unaudited)
Geographic Diversification (% of fund's net assets) |
As of October 31, 2013 |
| Japan 24.6% | |
| United Kingdom 19.5% | |
| United States of America* 15.0% | |
| Germany 5.1% | |
| Italy 3.5% | |
| Netherlands 3.4% | |
| France 2.7% | |
| Sweden 2.4% | |
| Ireland 2.0% | |
| Other 21.8% | |

* Includes Short-Term Investments and Net Other Assets (Liabilities). |
Percentages are based on country or territory of incorporation and are adjusted for the effect of futures contracts, if applicable. |
As of April 30, 2013 |
| Japan 23.7% | |
| United Kingdom 18.4% | |
| United States of America* 17.1% | |
| Germany 4.0% | |
| Turkey 3.6% | |
| Netherlands 3.0% | |
| Italy 2.7% | |
| France 2.5% | |
| Sweden 2.3% | |
| Other 22.7% | |

* Includes Short-Term Investments and Net Other Assets (Liabilities). |
Percentages are based on country or territory of incorporation and are adjusted for the effect of futures contracts, if applicable. |
Asset Allocation as of October 31, 2013 |
| % of fund's
net assets | % of fund's net assets
6 months ago |
Stocks | 97.3 | 95.5 |
Short-Term Investments and Net Other Assets (Liabilities) | 2.7 | 4.5 |
Top Ten Stocks as of October 31, 2013 |
| % of fund's
net assets | % of fund's net assets
6 months ago |
USS Co. Ltd. (Japan, Specialty Retail) | 2.3 | 2.2 |
PriceSmart, Inc. (United States of America, Food & Staples Retailing) | 2.0 | 2.0 |
Intrum Justitia AB (Sweden, Commercial Services & Supplies) | 1.7 | 1.4 |
Aalberts Industries NV (Netherlands, Machinery) | 1.5 | 1.1 |
CTS Eventim AG (Germany, Media) | 1.5 | 1.2 |
Unite Group PLC (United Kingdom, Real Estate Management & Development) | 1.5 | 1.3 |
Spirax-Sarco Engineering PLC (United Kingdom, Machinery) | 1.5 | 1.4 |
Azimut Holding SpA (Italy, Capital Markets) | 1.4 | 1.1 |
Interpump Group SpA (Italy, Machinery) | 1.4 | 1.2 |
Spectris PLC (United Kingdom, Electronic Equipment & Components) | 1.3 | 1.0 |
| 16.1 | |
Market Sectors as of October 31, 2013 |
| % of fund's
net assets | % of fund's net assets
6 months ago |
Industrials | 24.7 | 23.7 |
Financials | 18.5 | 16.8 |
Consumer Discretionary | 18.1 | 19.2 |
Consumer Staples | 9.9 | 10.1 |
Materials | 9.5 | 9.7 |
Information Technology | 7.2 | 7.2 |
Health Care | 6.1 | 5.3 |
Energy | 3.3 | 3.5 |
Annual Report
Fidelity Series International Small Cap Fund
Investments October 31, 2013
Showing Percentage of Net Assets
Common Stocks - 96.3% |
| Shares | | Value |
Australia - 1.3% |
Imdex Ltd. | 5,194,572 | | $ 3,534,948 |
Ramsay Health Care Ltd. | 328,640 | | 12,051,827 |
RCG Corp. Ltd. | 1,202,175 | | 840,814 |
Sydney Airport unit | 3,267,686 | | 12,940,620 |
TOTAL AUSTRALIA | | 29,368,209 |
Austria - 1.7% |
Andritz AG | 433,624 | | 26,711,723 |
Zumtobel AG | 662,319 | | 11,838,806 |
TOTAL AUSTRIA | | 38,550,529 |
Bailiwick of Jersey - 1.3% |
Informa PLC | 3,261,447 | | 29,258,516 |
Belgium - 2.0% |
Gimv NV (d) | 315,309 | | 15,968,533 |
KBC Ancora (a) | 525,381 | | 17,112,932 |
Umicore SA | 250,433 | | 11,946,793 |
TOTAL BELGIUM | | 45,028,258 |
Bermuda - 0.4% |
Lazard Ltd. Class A | 255,101 | | 9,859,654 |
Brazil - 0.3% |
Arezzo Industria e Comercio SA | 510,100 | | 7,628,047 |
British Virgin Islands - 0.3% |
Gem Diamonds Ltd. (a) | 2,606,074 | | 6,664,834 |
Canada - 1.6% |
Painted Pony Petroleum Ltd. (a)(e) | 25,000 | | 164,245 |
Pason Systems, Inc. | 977,200 | | 20,309,715 |
ShawCor Ltd. Class A | 227,900 | | 9,580,259 |
TAG Oil Ltd. (a)(d)(f) | 1,366,957 | | 5,558,814 |
TOTAL CANADA | | 35,613,033 |
Denmark - 1.2% |
Jyske Bank A/S (Reg.) (a) | 254,219 | | 14,350,942 |
Spar Nord Bank A/S (a) | 1,595,300 | | 14,230,137 |
TOTAL DENMARK | | 28,581,079 |
Finland - 1.4% |
Nokian Tyres PLC | 370,000 | | 18,723,237 |
Tikkurila Oyj | 553,100 | | 14,336,047 |
TOTAL FINLAND | | 33,059,284 |
Common Stocks - continued |
| Shares | | Value |
France - 2.7% |
Laurent-Perrier Group SA | 132,224 | | $ 12,353,262 |
Remy Cointreau SA | 109,254 | | 10,781,324 |
Saft Groupe SA | 406,719 | | 12,910,967 |
Vetoquinol SA | 208,127 | | 8,285,376 |
Virbac SA | 88,700 | | 17,842,064 |
TOTAL FRANCE | | 62,172,993 |
Germany - 4.5% |
alstria office REIT-AG | 788,729 | | 10,000,034 |
Bilfinger Berger AG | 206,235 | | 22,896,873 |
CompuGROUP Holding AG | 696,315 | | 18,147,369 |
CTS Eventim AG | 700,186 | | 34,176,858 |
Fielmann AG | 164,395 | | 18,392,282 |
TOTAL GERMANY | | 103,613,416 |
Greece - 0.6% |
Titan Cement Co. SA (Reg.) (a) | 535,299 | | 14,608,725 |
India - 0.6% |
Jyothy Laboratories Ltd. (a) | 4,369,647 | | 13,139,290 |
Ireland - 2.0% |
FBD Holdings PLC | 842,600 | | 18,190,238 |
James Hardie Industries PLC CDI | 2,697,858 | | 27,870,194 |
TOTAL IRELAND | | 46,060,432 |
Israel - 1.3% |
Azrieli Group | 403,779 | | 12,985,052 |
Ituran Location & Control Ltd. | 505,995 | | 9,259,709 |
Strauss Group Ltd. | 359,955 | | 6,357,461 |
TOTAL ISRAEL | | 28,602,222 |
Italy - 3.5% |
Azimut Holding SpA | 1,295,164 | | 32,901,702 |
Beni Stabili SpA SIIQ | 22,780,464 | | 15,650,669 |
Interpump Group SpA | 2,941,066 | | 32,744,506 |
TOTAL ITALY | | 81,296,877 |
Japan - 24.6% |
Air Water, Inc. | 446,000 | | 6,375,246 |
Anicom Holdings, Inc. (a)(d) | 125,000 | | 1,481,295 |
Aozora Bank Ltd. | 7,652,000 | | 22,244,630 |
ARNEST ONE Corp. (d) | 335,600 | | 9,201,440 |
Artnature, Inc. | 62,400 | | 1,331,870 |
Common Stocks - continued |
| Shares | | Value |
Japan - continued |
Asahi Co. Ltd. | 626,000 | | $ 10,611,416 |
Autobacs Seven Co. Ltd. (d) | 1,170,300 | | 17,063,535 |
Azbil Corp. | 695,300 | | 16,752,995 |
Coca-Cola Central Japan Co. Ltd. | 517,500 | | 9,165,257 |
Cosmos Pharmaceutical Corp. | 109,800 | | 13,377,000 |
Daikokutenbussan Co. Ltd. | 567,100 | | 17,017,503 |
FCC Co. Ltd. | 1,050,400 | | 23,996,302 |
GCA Savvian Group Corp. | 693,400 | | 7,643,825 |
Glory Ltd. | 308,100 | | 7,639,925 |
Goldcrest Co. Ltd. | 959,410 | | 25,667,927 |
Hajime Construction Co. Ltd. (d) | 58,200 | | 4,012,977 |
Harmonic Drive Systems, Inc. | 285,600 | | 6,148,424 |
Iwatsuka Confectionary Co. Ltd. | 19,200 | | 990,251 |
Kamigumi Co. Ltd. | 992,000 | | 8,628,777 |
Kobayashi Pharmaceutical Co. Ltd. | 303,500 | | 16,993,279 |
Kyoto Kimono Yuzen Co. Ltd. | 378,600 | | 3,978,602 |
Lasertec Corp. (a)(d) | 829,400 | | 8,568,474 |
Meiko Network Japan Co. Ltd. | 514,400 | | 5,938,325 |
Miraial Co. Ltd. (d) | 301,300 | | 4,887,353 |
Nabtesco Corp. | 494,100 | | 12,059,755 |
Nagaileben Co. Ltd. | 774,000 | | 12,772,713 |
Nihon M&A Center, Inc. (d) | 373,100 | | 28,775,555 |
Nihon Parkerizing Co. Ltd. | 1,059,000 | | 20,687,629 |
Nippon Seiki Co. Ltd. | 843,000 | | 13,744,200 |
Nippon Thompson Co. Ltd. | 1,817,000 | | 9,889,262 |
NS Tool Co. Ltd. | 1,000 | | 17,033 |
Obic Co. Ltd. | 575,100 | | 18,059,682 |
OSG Corp. | 1,583,600 | | 25,617,338 |
San-Ai Oil Co. Ltd. | 138,000 | | 595,998 |
Seven Bank Ltd. | 7,100,900 | | 25,131,902 |
SHO-BOND Holdings Co. Ltd. (d) | 542,300 | | 25,394,470 |
Shoei Co. Ltd. | 502,500 | | 4,721,067 |
Software Service, Inc. | 25,000 | | 939,959 |
Techno Medica Co. Ltd. | 185,400 | | 4,037,458 |
The Nippon Synthetic Chemical Industry Co. Ltd. | 1,878,000 | | 18,106,333 |
Tocalo Co. Ltd. | 458,400 | | 7,505,133 |
Tsutsumi Jewelry Co. Ltd. | 258,100 | | 6,288,758 |
USS Co. Ltd. | 3,579,000 | | 52,412,644 |
Workman Co. Ltd. | 34,700 | | 1,359,873 |
Yamato Kogyo Co. Ltd. | 775,800 | | 28,754,407 |
TOTAL JAPAN | | 566,587,797 |
Common Stocks - continued |
| Shares | | Value |
Korea (South) - 0.9% |
Coway Co. Ltd. | 371,866 | | $ 21,233,859 |
Mexico - 0.4% |
Consorcio ARA S.A.B. de CV (a) | 21,856,627 | | 8,543,471 |
Netherlands - 3.4% |
Aalberts Industries NV | 1,156,000 | | 34,593,080 |
ASM International NV (depositary receipt) | 354,000 | | 11,689,080 |
Heijmans NV (Certificaten Van Aandelen) (d)(g) | 1,237,505 | | 16,464,500 |
VastNed Retail NV | 352,538 | | 16,300,714 |
TOTAL NETHERLANDS | | 79,047,374 |
Philippines - 0.5% |
Jollibee Food Corp. | 2,911,430 | | 11,951,583 |
Portugal - 0.4% |
Jeronimo Martins SGPS SA | 490,900 | | 9,071,330 |
South Africa - 1.7% |
City Lodge Hotels Ltd. | 248,156 | | 3,264,498 |
Clicks Group Ltd. | 3,802,193 | | 23,690,915 |
Nampak Ltd. | 3,805,070 | | 12,584,069 |
TOTAL SOUTH AFRICA | | 39,539,482 |
Spain - 1.3% |
Grifols SA | 251,200 | | 10,301,923 |
Prosegur Compania de Seguridad SA (Reg.) | 3,282,186 | | 19,518,980 |
TOTAL SPAIN | | 29,820,903 |
Sweden - 2.4% |
Fagerhult AB | 525,974 | | 16,152,472 |
Intrum Justitia AB | 1,464,303 | | 38,979,987 |
TOTAL SWEDEN | | 55,132,459 |
Switzerland - 0.4% |
Zehnder Group AG | 194,093 | | 9,144,736 |
Turkey - 1.8% |
Albaraka Turk Katilim Bankasi A/S (a) | 16,981,671 | | 15,142,079 |
Coca-Cola Icecek A/S | 926,910 | | 26,582,641 |
TOTAL TURKEY | | 41,724,720 |
United Kingdom - 19.5% |
Babcock International Group PLC | 948,800 | | 19,396,651 |
Bellway PLC | 1,056,800 | | 25,484,876 |
Berendsen PLC | 1,072,609 | | 16,690,865 |
Britvic PLC | 1,925,612 | | 19,297,039 |
Common Stocks - continued |
| Shares | | Value |
United Kingdom - continued |
Dechra Pharmaceuticals PLC | 1,628,170 | | $ 18,013,194 |
Derwent London PLC | 336,590 | | 13,513,798 |
Elementis PLC | 4,914,382 | | 20,416,355 |
Fenner PLC | 1,419,285 | | 9,102,726 |
Great Portland Estates PLC | 2,684,300 | | 24,661,958 |
H&T Group PLC | 1,288,592 | | 3,409,112 |
Hilton Food Group PLC | 607,000 | | 4,165,569 |
InterContinental Hotel Group PLC ADR | 507,293 | | 14,889,050 |
Johnson Matthey PLC | 347,290 | | 16,727,617 |
Meggitt PLC | 2,621,434 | | 24,063,362 |
Persimmon PLC | 802,200 | | 16,271,031 |
Rotork PLC | 613,400 | | 28,158,337 |
Serco Group PLC | 2,527,232 | | 22,570,552 |
Shaftesbury PLC | 2,279,155 | | 21,707,119 |
Spectris PLC | 804,416 | | 29,820,190 |
Spirax-Sarco Engineering PLC | 720,000 | | 33,686,793 |
Ted Baker PLC | 393,949 | | 10,782,399 |
Ultra Electronics Holdings PLC | 759,510 | | 23,552,220 |
Unite Group PLC | 5,364,825 | | 34,063,763 |
TOTAL UNITED KINGDOM | | 450,444,576 |
United States of America - 12.3% |
ANSYS, Inc. (a) | 74,815 | | 6,542,572 |
Autoliv, Inc. | 232,800 | | 20,772,744 |
BPZ Energy, Inc. (a)(d) | 2,192,211 | | 4,406,344 |
Broadridge Financial Solutions, Inc. | 261,895 | | 9,208,228 |
Dril-Quip, Inc. (a) | 159,705 | | 18,752,561 |
Evercore Partners, Inc. Class A | 337,200 | | 17,018,484 |
Greenhill & Co., Inc. | 221,505 | | 11,363,207 |
Kansas City Southern | 77,169 | | 9,377,577 |
Kennedy-Wilson Holdings, Inc. | 711,888 | | 14,266,236 |
Martin Marietta Materials, Inc. (d) | 162,280 | | 15,918,045 |
Mohawk Industries, Inc. (a) | 161,862 | | 21,433,766 |
Oceaneering International, Inc. | 178,867 | | 15,361,098 |
PriceSmart, Inc. | 408,289 | | 46,459,205 |
ResMed, Inc. (d) | 434,600 | | 22,486,204 |
Common Stocks - continued |
| Shares | | Value |
United States of America - continued |
Solera Holdings, Inc. | 432,172 | | $ 24,296,710 |
SS&C Technologies Holdings, Inc. (a) | 680,888 | | 26,758,898 |
TOTAL UNITED STATES OF AMERICA | | 284,421,879 |
TOTAL COMMON STOCKS (Cost $1,572,715,226) |
2,219,769,567
|
Nonconvertible Preferred Stocks - 1.0% |
| | | |
Brazil - 0.4% |
Banco ABC Brasil SA | 1,046,879 | | 6,444,273 |
Banco Pine SA | 566,764 | | 2,669,119 |
TOTAL BRAZIL | | 9,113,392 |
Germany - 0.6% |
Sartorius AG (non-vtg.) | 132,821 | | 14,012,240 |
TOTAL NONCONVERTIBLE PREFERRED STOCKS (Cost $23,448,501) |
23,125,632
|
Money Market Funds - 4.9% |
| | | |
Fidelity Cash Central Fund, 0.09% (b) | 68,690,571 | | 68,690,571 |
Fidelity Securities Lending Cash Central Fund, 0.09% (b)(c) | 43,450,278 | | 43,450,278 |
TOTAL MONEY MARKET FUNDS (Cost $112,140,849) |
112,140,849
|
TOTAL INVESTMENT PORTFOLIO - 102.2% (Cost $1,708,304,576) | 2,355,036,048 |
NET OTHER ASSETS (LIABILITIES) - (2.2)% | (49,846,977) |
NET ASSETS - 100% | $ 2,305,189,071 |
Legend |
(a) Non-income producing |
(b) Affiliated fund that is generally available only to investment companies and other accounts managed by Fidelity Investments. The rate quoted is the annualized seven-day yield of the fund at period end. A complete unaudited listing of the fund's holdings as of its most recent quarter end is available upon request. In addition, each Fidelity Central Fund's financial statements, which are not covered by the Fund's Report of Independent Registered Public Accounting Firm, are available on the SEC's website or upon request. |
(c) Investment made with cash collateral received from securities on loan. |
(d) Security or a portion of the security is on loan at period end. |
(e) Security exempt from registration under Rule 144A of the Securities Act of 1933. These securities may be resold in transactions exempt from registration, normally to qualified institutional buyers. At the end of the period, the value of these securities amounted to $164,245 or 0.0% of net assets. |
(f) Security or a portion of the security purchased on a delayed delivery or when-issued basis. |
(g) Affiliated company |
Affiliated Central Funds |
Information regarding fiscal year to date income earned by the Fund from investments in Fidelity Central Funds is as follows: |
Fund | Income earned |
Fidelity Cash Central Fund | $ 110,640 |
Fidelity Securities Lending Cash Central Fund | 1,028,689 |
Total | $ 1,139,329 |
Other Affiliated Issuers |
An affiliated company is a company in which the Fund has ownership of at least 5% of the voting securities. Fiscal year to date transactions with companies which are or were affiliates are as follows: |
Affiliate | Value, beginning of period | Purchases | Sales
Proceeds | Dividend Income | Value,
end of
period |
Boyner Buyuk Magazacilik A/S | $ 13,040,346 | $ 333,602 | $ 20,318,501 | $ - | $ - |
Heijmans NV (Certificaten Van Aandelen) | 4,502,302 | 7,067,324 | - | 248,724 | 16,464,500 |
Total | $ 17,542,648 | $ 7,400,926 | $ 20,318,501 | $ 248,724 | $ 16,464,500 |
Other Information |
Categorizations in the Schedule of Investments are based on country or territory of incorporation. |
The following is a summary of the inputs used, as of October 31, 2013, involving the Fund's assets and liabilities carried at fair value. The inputs or methodology used for valuing securities may not be an indication of the risk associated with investing in those securities. For more information on valuation inputs, and their aggregation into the levels used in the tables below, please refer to the Investment Valuation section in the accompanying Notes to Financial Statements. |
Valuation Inputs at Reporting Date: |
Description | Total | Level 1 | Level 2 | Level 3 |
Investments in Securities: | | | |
Equities: | | | | |
Consumer Discretionary | $ 416,976,170 | $ 263,647,031 | $ 140,114,722 | $ 13,214,417 |
Consumer Staples | 230,773,196 | 171,898,036 | 58,875,160 | - |
Energy | 74,729,034 | 74,133,036 | 595,998 | - |
Financials | 423,979,334 | 341,809,755 | 82,169,579 | - |
Health Care | 138,890,327 | 121,140,197 | 17,750,130 | - |
Industrials | 573,172,005 | 441,496,333 | 131,675,672 | - |
Information Technology | 165,843,891 | 117,575,387 | 48,268,504 | - |
Materials | 218,531,242 | 144,607,627 | 73,923,615 | - |
Money Market Funds | 112,140,849 | 112,140,849 | - | - |
Total Investments in Securities: | $ 2,355,036,048 | $ 1,788,448,251 | $ 553,373,380 | $ 13,214,417 |
The following is a summary of transfers between Level 1 and Level 2 for the period ended October 31, 2013. Transfers are assumed to have occurred at the beginning of the period, and are primarily attributable to the valuation techniques used for foreign equity securities, as discussed in the accompanying Notes to Financial Statements: |
Transfers | Total |
Level 1 to Level 2 | $ 357,740,981 |
Level 2 to Level 1 | $ 0 |
See accompanying notes which are an integral part of the financial statements.
Annual Report
Fidelity Series International Small Cap Fund
Statement of Assets and Liabilities
| October 31, 2013 |
| | |
Assets | | |
Investment in securities, at value (including securities loaned of $42,049,036) - See accompanying schedule: Unaffiliated issuers (cost $1,584,386,456) | $ 2,226,430,699 | |
Fidelity Central Funds (cost $112,140,849) | 112,140,849 | |
Other affiliated issuers (cost $11,777,271) | 16,464,500 | |
Total Investments (cost $1,708,304,576) | | $ 2,355,036,048 |
Foreign currency held at value (cost $27) | | 27 |
Receivable for investments sold | | 6,010,671 |
Receivable for fund shares sold | | 1,032,993 |
Dividends receivable | | 4,884,298 |
Distributions receivable from Fidelity Central Funds | | 37,836 |
Prepaid expenses | | 7,148 |
Other receivables | | 24,562 |
Total assets | | 2,367,033,583 |
| | |
Liabilities | | |
Payable for investments purchased
Regular delivery | $ 15,375,723 | |
Delayed delivery | 498,384 | |
Payable for fund shares redeemed | 413,159 | |
Accrued management fee | 1,761,753 | |
Other affiliated payables | 247,823 | |
Other payables and accrued expenses | 97,392 | |
Collateral on securities loaned, at value | 43,450,278 | |
Total liabilities | | 61,844,512 |
| | |
Net Assets | | $ 2,305,189,071 |
Net Assets consist of: | | |
Paid in capital | | $ 1,578,088,565 |
Undistributed net investment income | | 22,673,543 |
Accumulated undistributed net realized gain (loss) on investments and foreign currency transactions | | 57,709,897 |
Net unrealized appreciation (depreciation) on investments and assets and liabilities in foreign currencies | | 646,717,066 |
Net Assets | | $ 2,305,189,071 |
See accompanying notes which are an integral part of the financial statements.
Annual Report
Statement of Assets and Liabilities - continued
| October 31, 2013 |
| | |
Series International Small Cap:
Net Asset Value, offering price and redemption price
per share ($1,163,381,488 ÷ 73,861,999 shares) | | $ 15.75 |
| | |
Class F:
Net Asset Value, offering price and redemption price per share ($1,141,807,583 ÷ 72,290,078 shares) | | $ 15.79 |
See accompanying notes which are an integral part of the financial statements.
Annual Report
Fidelity Series International Small Cap Fund
Financial Statements - continued
Statement of Operations
| Year ended October 31, 2013 |
| | |
Investment Income | | |
Dividends (including $248,724 earned from other affiliated issuers) | | $ 48,702,831 |
Interest | | 177 |
Income from Fidelity Central Funds | | 1,139,329 |
Income before foreign taxes withheld | | 49,842,337 |
Less foreign taxes withheld | | (3,580,355) |
Total income | | 46,261,982 |
| | |
Expenses | | |
Management fee
Basic fee | $ 17,375,043 | |
Performance adjustment | 2,513,299 | |
Transfer agent fees | 1,964,643 | |
Accounting and security lending fees | 910,377 | |
Custodian fees and expenses | 325,589 | |
Independent trustees' compensation | 11,490 | |
Audit | 65,880 | |
Legal | 4,767 | |
Miscellaneous | 17,627 | |
Total expenses before reductions | 23,188,715 | |
Expense reductions | (148,842) | 23,039,873 |
Net investment income (loss) | | 23,222,109 |
Realized and Unrealized Gain (Loss) Net realized gain (loss) on: | | |
Investment securities: | | |
Unaffiliated issuers | 83,785,293 | |
Other affiliated issuers | 10,001,843 | |
Foreign currency transactions | (747,708) | |
Total net realized gain (loss) | | 93,039,428 |
Change in net unrealized appreciation (depreciation) on: Investment securities (net of decrease in deferred foreign taxes of $960,122) | 390,641,645 | |
Assets and liabilities in foreign currencies | 82,449 | |
Total change in net unrealized appreciation (depreciation) | | 390,724,094 |
Net gain (loss) | | 483,763,522 |
Net increase (decrease) in net assets resulting from operations | | $ 506,985,631 |
See accompanying notes which are an integral part of the financial statements.
Annual Report
Statement of Changes in Net Assets
| Year ended
October 31,
2013 | Year ended
October 31,
2012 |
Increase (Decrease) in Net Assets | | |
Operations | | |
Net investment income (loss) | $ 23,222,109 | $ 22,876,168 |
Net realized gain (loss) | 93,039,428 | (16,909,242) |
Change in net unrealized appreciation (depreciation) | 390,724,094 | 197,365,351 |
Net increase (decrease) in net assets resulting
from operations | 506,985,631 | 203,332,277 |
Distributions to shareholders from net investment income | (20,487,378) | (16,161,385) |
Distributions to shareholders from net realized gain | (1,498,848) | (1,284,494) |
Total distributions | (21,986,226) | (17,445,879) |
Share transactions - net increase (decrease) | (56,862,699) | 103,425,618 |
Total increase (decrease) in net assets | 428,136,706 | 289,312,016 |
| | |
Net Assets | | |
Beginning of period | 1,877,052,365 | 1,587,740,349 |
End of period (including undistributed net investment income of $22,673,543 and undistributed net investment income of $19,938,812, respectively) | $ 2,305,189,071 | $ 1,877,052,365 |
See accompanying notes which are an integral part of the financial statements.
Annual Report
Financial Highlights - Series International Small Cap
Years ended October 31, | 2013 | 2012 | 2011 | 2010 H |
Selected Per-Share Data | | | | |
Net asset value, beginning of period | $ 12.44 | $ 11.22 | $ 11.40 | $ 10.00 |
Income from Investment Operations | | | | |
Net investment income (loss) D | .15 | .15 | .17 G | .06 |
Net realized and unrealized gain (loss) | 3.29 | 1.19 | (.19) | 1.34 |
Total from investment operations | 3.44 | 1.34 | (.02) | 1.40 |
Distributions from net investment income | (.12) | (.11) | (.09) | - |
Distributions from net realized gain | (.01) | (.01) | (.07) | - |
Total distributions | (.13) | (.12) | (.16) | - |
Net asset value, end of period | $ 15.75 | $ 12.44 | $ 11.22 | $ 11.40 |
Total Return B,C | 27.95% | 12.07% | (.23)% | 14.00% |
Ratios to Average Net Assets E,I | | | | |
Expenses before reductions | 1.23% | 1.22% | 1.14% | 1.21% A |
Expenses net of fee waivers, if any | 1.23% | 1.22% | 1.14% | 1.21% A |
Expenses net of all reductions | 1.22% | 1.22% | 1.13% | 1.18% A |
Net investment income (loss) | 1.05% | 1.27% | 1.47% G | .68% A |
Supplemental Data | | | | |
Net assets, end of period (000 omitted) | $ 1,163,381 | $ 1,040,585 | $ 1,107,242 | $ 701,814 |
Portfolio turnover rate F | 29% | 25% | 22% | 21% A |
A Annualized
B Total returns for periods of less than one year are not annualized.
C Total returns would have been lower if certain expenses had not been reduced during the applicable periods shown.
D Calculated based on average shares outstanding during the period.
E Fees and expenses of any underlying Fidelity Central Funds are not included in the Fund's expense ratio. The Fund indirectly bears its proportionate share of the expenses of any underlying Fidelity Central Funds.
F Amount does not include the portfolio activity of any underlying Fidelity Central Funds.
G Investment income per share reflects a large, non-recurring dividend which amounted to $.06 per share. Excluding this non-recurring dividend, the ratio of net investment income (loss) to average net assets would have been 1.00%.
H For the period December 3, 2009 (commencement of operations) to October 31, 2010.
I Expense ratios reflect operating expenses of the class. Expenses before reductions do not reflect amounts reimbursed by the investment adviser or reductions from brokerage service arrangements or reductions from other expense offset arrangements and do not represent the amount paid by the class during periods when reimbursements or reductions occur. Expense ratios before reductions for start-up periods may not be representative of longer-term operating periods. Expenses net of fee waivers reflect expenses after reimbursement by the investment adviser but prior to reductions from brokerage service arrangements or other expense offset arrangements. Expenses net of all reductions represent the net expenses paid by the class.
See accompanying notes which are an integral part of the financial statements.
Annual Report
Financial Highlights - Class F
Years ended October 31, | 2013 | 2012 | 2011 | 2010 H |
Selected Per-Share Data | | | | |
Net asset value, beginning of period | $ 12.48 | $ 11.26 | $ 11.43 | $ 10.00 |
Income from Investment Operations | | | | |
Net investment income (loss) D | .17 | .17 | .20 G | .09 |
Net realized and unrealized gain (loss) | 3.30 | 1.19 | (.20) | 1.34 |
Total from investment operations | 3.47 | 1.36 | - | 1.43 |
Distributions from net investment income | (.15) | (.13) | (.10) | - |
Distributions from net realized gain | (.01) | (.01) | (.07) | - |
Total distributions | (.16) | (.14) | (.17) | - |
Net asset value, end of period | $ 15.79 | $ 12.48 | $ 11.26 | $ 11.43 |
Total Return B,C | 28.14% | 12.25% | (.03)% | 14.30% |
Ratios to Average Net Assets E,I | | | | |
Expenses before reductions | 1.04% | 1.02% | .93% | .98% A |
Expenses net of fee waivers, if any | 1.04% | 1.02% | .93% | .98% A |
Expenses net of all reductions | 1.03% | 1.01% | .92% | .94% A |
Net investment income (loss) | 1.24% | 1.47% | 1.68% G | .92% A |
Supplemental Data | | | | |
Net assets, end of period (000 omitted) | $ 1,141,808 | $ 836,468 | $ 480,498 | $ 130,513 |
Portfolio turnover rate F | 29% | 25% | 22% | 21% A |
A Annualized
B Total returns for periods of less than one year are not annualized.
C Total returns would have been lower if certain expenses had not been reduced during the applicable periods shown.
D Calculated based on average shares outstanding during the period.
E Fees and expenses of any underlying Fidelity Central Funds are not included in the Fund's expense ratio. The Fund indirectly bears its proportionate share of the expenses of any underlying Fidelity Central Funds.
F Amount does not include the portfolio activity of any underlying Fidelity Central Funds.
G Investment income per share reflects a large, non-recurring dividend which amounted to $.06 per share. Excluding this non-recurring dividend, the ratio of net investment income (loss) to average net assets would have been 1.21%.
H For the period December 3, 2009 (commencement of operations) to October 31, 2010.
I Expense ratios reflect operating expenses of the class. Expenses before reductions do not reflect amounts reimbursed by the investment adviser or reductions from brokerage service arrangements or reductions from other expense offset arrangements and do not represent the amount paid by the class during periods when reimbursements or reductions occur. Expense ratios before reductions for start-up periods may not be representative of longer-term operating periods. Expenses net of fee waivers reflect expenses after reimbursement by the investment adviser but prior to reductions from brokerage service arrangements or other expense offset arrangements. Expenses net of all reductions represent the net expenses paid by the class.
See accompanying notes which are an integral part of the financial statements.
Annual Report
Fidelity Series International Value Fund
Average annual total return reflects the change in the value of an investment, assuming reinvestment of the class' distributions from dividend income and capital gains (the profits earned upon the sale of securities that have grown in value, if any) and assuming a constant rate of performance each year. The $10,000 table and the fund's returns do not reflect the deduction of taxes that a shareholder would pay on fund distributions or the redemption of fund shares. During periods of reimbursement by Fidelity, a fund's total return will be greater than it would be had the reimbursement not occurred. How a fund did yesterday is no guarantee of how it will do tomorrow.
Average Annual Total Returns
Periods ended October 31, 2013 | Past 1
year | Life of
fund A |
Fidelity Series International Value Fund | 25.78% | 4.86% |
Class F | 26.05% | 5.09% |
A From December 3, 2009.
$10,000 Over Life of Fund
Let's say hypothetically that $10,000 was invested in Fidelity Series International Value Fund, a class of the fund, on December 3, 2009, when the fund started. The chart shows how the value of your investment would have changed, and also shows how the MSCI EAFE Value Index performed over the same period.
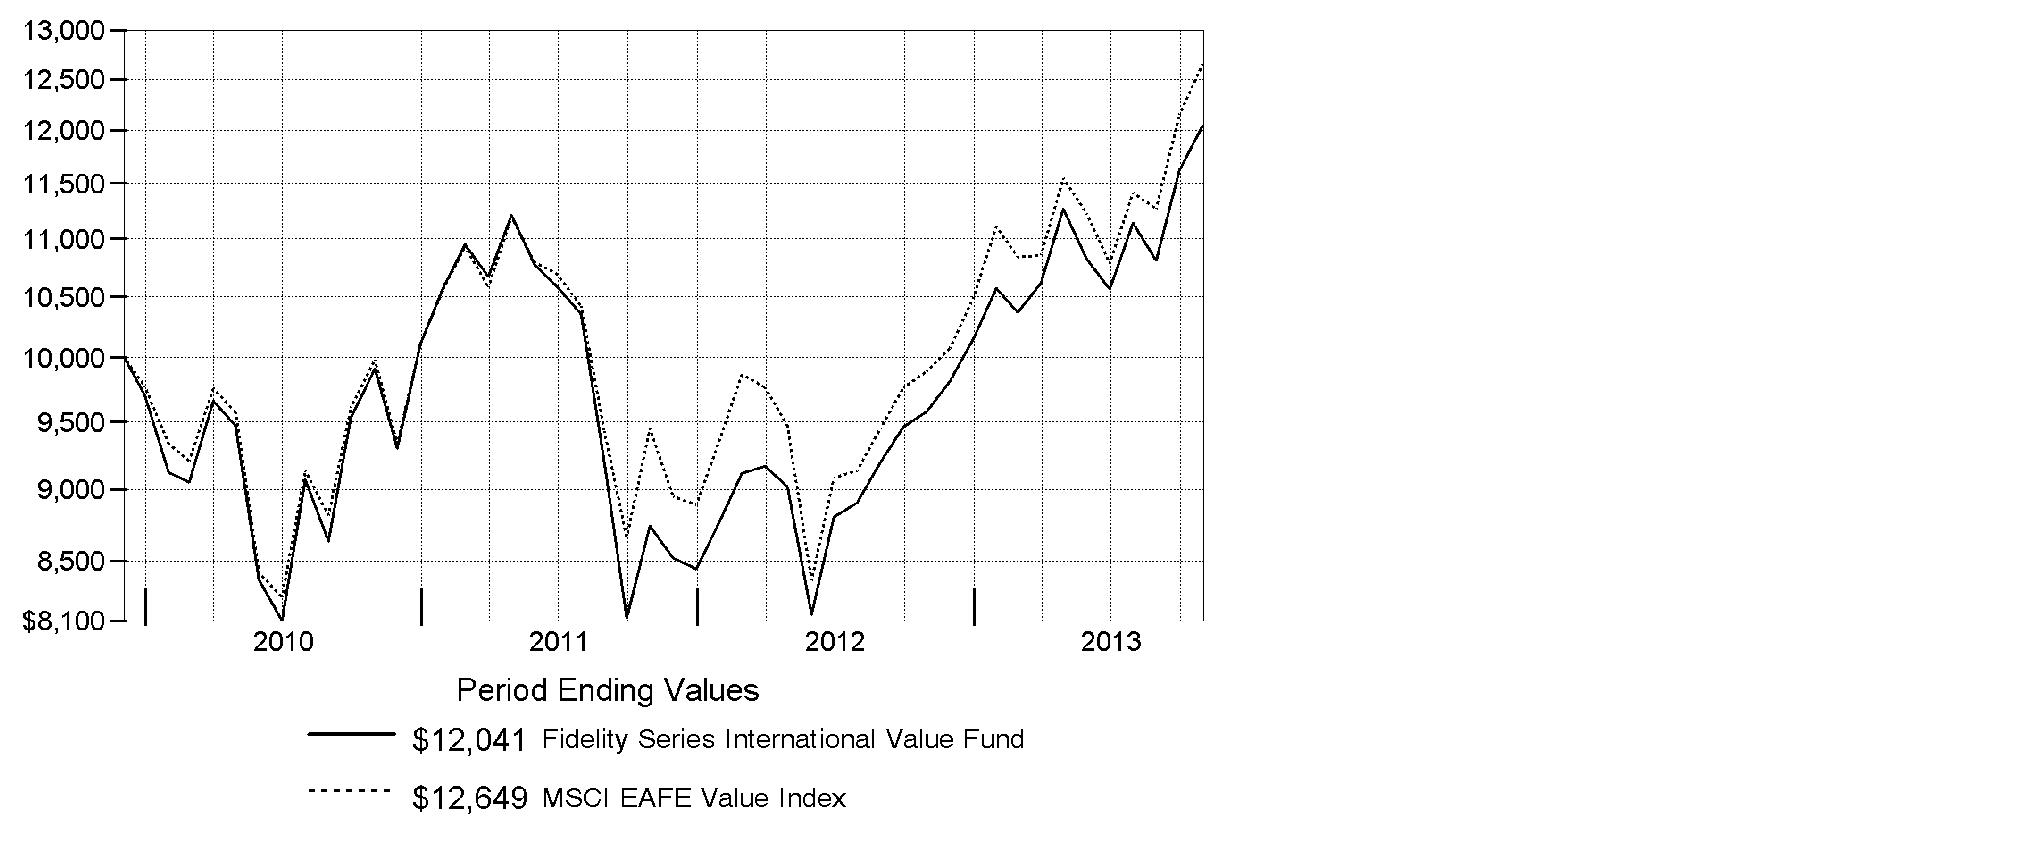
Annual Report
Fidelity Series International Value Fund
Market Recap: On balance, global equity markets remained upbeat for the 12-month period ending October 31, 2013. The MSCI® ACWI® (All Country World Index) Index gained 23.75% for the period, amid investor preference for higher-risk assets. The period was not without turbulence, however. In the spring and summer, central banks worldwide, especially in the U.S. and China, made clear their intentions to maintain accommodative monetary policies. That stance, combined with modest cyclical improvements around the globe and generally low valuations, underpinned the broad rally in equities. Europe (+32%) shone brightly, with most markets in the region - large and small - registering solid, index-beating gains. Another bright spot was Japan, which, despite a struggling yen and taking a second-half breather, posted a 34% result for the full year. The U.S. - by far the index's biggest constituent - also outperformed the global market with a roughly 28% advance. Meanwhile, Asia-Pacific ex Japan (+14%) lagged, hurt in part by a slowdown in Australia's mining industry as well as currency headwinds. Foreign-exchange and commodity weakness also curbed results in resource-heavy Canada and emerging markets (EM), both of which were up 7%. Country-level EM performance diverged meaningfully for the period, as evidenced by performance in Brazil (-1%), Russia (+12%), India (+1%) and China (+8%).
Comments from Alex Zavratsky, Portfolio Manager of Fidelity® Series International Value Fund: For the year, the fund's Series International Value and Class F shares rose 25.78% and 26.05%, respectively, trailing the 27.95% gain of the benchmark MSCI® EAFE® Value Index. The fund performed relatively well through the first half of the reporting period when investors generally gravitated towards the high-quality, steady compounders I seek. However, performance took a turn during the second half - specifically in the third quarter - when investors became more bullish on the European recovery. Versus the index, it hurt to largely avoid Germany-based Daimler - the world's third-largest luxury automobile manufacturer. Daimler's stock rose 85% during the past year amid an improving economic environment in Europe. Daimler was not held at period end. By contrast, a non-index investment in Japan-based SoftBank was a winner. The Internet and telecom-services provider saw significant growth during the period. In June, SoftBank completed its protracted takeover of telecom giant Sprint, the U.S.'s third-largest mobile carrier, and sported two consecutive quarters of better-than-expected financial results in the second half of the period. Additionally, the firm stands to benefit from the planned initial public offering of Alibaba, China's - and the world's - biggest Internet retailer, which is about 37% owned by SoftBank.
The views expressed above reflect those of the portfolio manager(s) only through the end of the period as stated on the cover of this report and do not necessarily represent the views of Fidelity or any other person in the Fidelity organization. Any such views are subject to change at any time based upon market or other conditions and Fidelity disclaims any responsibility to update such views. These views may not be relied on as investment advice and, because investment decisions for a Fidelity fund are based on numerous factors, may not be relied on as an indication of trading intent on behalf of any Fidelity fund.
Annual Report
Fidelity Series International Value Fund
Investment Changes (Unaudited)
Geographic Diversification (% of fund's net assets) |
As of October 31, 2013 |
| United Kingdom 24.8% | |
| Japan 18.9% | |
| France 15.6% | |
| Germany 9.0% | |
| Australia 6.8% | |
| Switzerland 5.7% | |
| Netherlands 3.2% | |
| Spain 3.1% | |
| United States of America* 2.8% | |
| Other 10.1% | |

* Includes Short-Term Investments and Net Other Assets (Liabilities). |
Percentages are based on country or territory of incorporation and are adjusted for the effect of futures contracts, if applicable. |
As of April 30, 2013 |
| United Kingdom 26.8% | |
| Japan 19.4% | |
| Germany 9.0% | |
| Switzerland 8.7% | |
| Australia 8.4% | |
| France 7.9% | |
| Singapore 3.3% | |
| Spain 2.8% | |
| Netherlands 2.4% | |
| Other* 11.3% | |

* Includes Short-Term Investments and Net Other Assets (Liabilities). |
Percentages are based on country or territory of incorporation and are adjusted for the effect of futures contracts, if applicable. |
Asset Allocation as of October 31, 2013 |
| % of fund's
net assets | % of fund's net assets
6 months ago |
Stocks | 98.0 | 98.6 |
Short-Term Investments and Net Other Assets (Liabilities) | 2.0 | 1.4 |
Top Ten Stocks as of October 31, 2013 |
| % of fund's
net assets | % of fund's net assets
6 months ago |
HSBC Holdings PLC sponsored ADR (United Kingdom, Commercial Banks) | 3.7 | 3.7 |
Total SA (France, Oil, Gas & Consumable Fuels) | 3.6 | 0.0 |
Vodafone Group PLC sponsored ADR (United Kingdom, Wireless Telecommunication Services) | 3.4 | 3.2 |
Sanofi SA (France, Pharmaceuticals) | 3.4 | 3.7 |
Royal Dutch Shell PLC Class A sponsored ADR (United Kingdom, Oil, Gas & Consumable Fuels) | 2.7 | 4.0 |
Australia & New Zealand Banking Group Ltd. (Australia, Commercial Banks) | 2.3 | 2.4 |
Westpac Banking Corp. (Australia, Commercial Banks) | 2.2 | 2.7 |
Sumitomo Mitsui Financial Group, Inc. (Japan, Commercial Banks) | 2.2 | 2.5 |
BASF AG (Germany, Chemicals) | 1.9 | 0.5 |
BNP Paribas SA (France, Commercial Banks) | 1.9 | 1.7 |
| 27.3 | |
Market Sectors as of October 31, 2013 |
| % of fund's
net assets | % of fund's net assets
6 months ago |
Financials | 31.5 | 35.1 |
Health Care | 10.7 | 12.4 |
Consumer Discretionary | 10.1 | 8.7 |
Telecommunication Services | 10.1 | 8.7 |
Industrials | 9.2 | 6.2 |
Materials | 7.1 | 6.0 |
Energy | 7.0 | 7.7 |
Consumer Staples | 6.4 | 6.1 |
Information Technology | 3.3 | 2.3 |
Utilities | 2.6 | 5.4 |
Annual Report
Fidelity Series International Value Fund
Investments October 31, 2013
Showing Percentage of Net Assets
Common Stocks - 96.5% |
| Shares | | Value |
Australia - 6.8% |
Ansell Ltd. | 2,739,980 | | $ 50,473,100 |
Australia & New Zealand Banking Group Ltd. | 8,036,752 | | 257,046,479 |
Telstra Corp. Ltd. | 18,817,636 | | 92,128,831 |
Transurban Group unit | 8,142,809 | | 54,642,849 |
Westfield Group unit | 5,624,180 | | 57,515,806 |
Westpac Banking Corp. | 7,830,637 | | 253,784,629 |
TOTAL AUSTRALIA | | 765,591,694 |
Bailiwick of Guernsey - 0.1% |
Resolution Ltd. | 2,464,700 | | 14,124,091 |
Bailiwick of Jersey - 1.0% |
Informa PLC | 6,054,620 | | 54,316,135 |
Wolseley PLC | 1,072,045 | | 57,772,799 |
TOTAL BAILIWICK OF JERSEY | | 112,088,934 |
Belgium - 1.2% |
Anheuser-Busch InBev SA NV | 429,700 | | 44,544,307 |
KBC Groupe SA | 939,574 | | 51,219,620 |
UCB SA | 668,034 | | 43,918,062 |
TOTAL BELGIUM | | 139,681,989 |
Bermuda - 0.4% |
Hongkong Land Holdings Ltd. | 7,450,000 | | 45,892,000 |
Denmark - 0.6% |
A.P. Moller - Maersk A/S Series B | 7,232 | | 69,973,295 |
Finland - 1.4% |
Nokia Corp. (a) | 6,512,851 | | 49,502,804 |
Sampo Oyj (A Shares) | 2,312,667 | | 109,555,424 |
TOTAL FINLAND | | 159,058,228 |
France - 15.6% |
Arkema SA | 627,223 | | 71,211,798 |
Atos Origin SA (d) | 888,119 | | 75,823,444 |
BNP Paribas SA | 2,913,736 | | 215,767,061 |
Cap Gemini SA | 954,505 | | 62,790,191 |
Carrefour SA | 2,316,919 | | 84,873,597 |
GDF Suez | 4,565,424 | | 113,684,240 |
Havas SA | 6,075,942 | | 50,619,609 |
Kering SA | 266,245 | | 60,496,046 |
Renault SA | 932,959 | | 81,716,435 |
Sanofi SA | 3,560,539 | | 379,636,190 |
Schneider Electric SA | 406,624 | | 34,257,416 |
Common Stocks - continued |
| Shares | | Value |
France - continued |
Total SA | 6,677,185 | | $ 409,665,201 |
Vivendi SA | 4,728,010 | | 120,011,722 |
TOTAL FRANCE | | 1,760,552,950 |
Germany - 7.5% |
Allianz SE | 968,496 | | 162,925,458 |
BASF AG | 2,099,608 | | 218,452,419 |
Bayer AG | 1,060,546 | | 131,813,603 |
Deutsche Post AG | 3,034,602 | | 102,696,755 |
Fresenius SE & Co. KGaA | 479,700 | | 62,350,163 |
HeidelbergCement Finance AG | 791,038 | | 62,358,289 |
Siemens AG | 890,084 | | 113,745,890 |
TOTAL GERMANY | | 854,342,577 |
Hong Kong - 0.9% |
Hysan Development Co. Ltd. | 12,103,000 | | 56,588,901 |
Wing Hang Bank Ltd. | 3,309,369 | | 47,081,568 |
TOTAL HONG KONG | | 103,670,469 |
Italy - 0.2% |
Unione di Banche Italiane ScpA | 3,861,763 | | 26,740,875 |
Japan - 18.9% |
AEON Financial Service Co. Ltd. (d) | 760,900 | | 23,367,434 |
AEON Mall Co. Ltd. | 1,144,700 | | 32,510,588 |
Air Water, Inc. | 2,272,500 | | 32,483,739 |
Astellas Pharma, Inc. | 1,006,700 | | 56,119,883 |
Daikin Industries Ltd. | 799,000 | | 45,969,182 |
DENSO Corp. | 881,200 | | 42,357,890 |
Dentsu, Inc. | 1,213,300 | | 45,841,142 |
East Japan Railway Co. | 558,500 | | 48,517,284 |
Hoya Corp. | 3,081,600 | | 73,894,824 |
Isuzu Motors Ltd. | 7,078,000 | | 44,078,833 |
Itochu Corp. | 5,680,000 | | 68,297,158 |
Japan Exchange Group, Inc. | 1,349,600 | | 31,375,700 |
Japan Tobacco, Inc. | 2,501,700 | | 90,520,721 |
JFE Holdings, Inc. | 2,268,600 | | 51,575,914 |
JTEKT Corp. | 3,531,600 | | 45,339,652 |
Kansai Electric Power Co., Inc. (a) | 3,503,100 | | 44,338,811 |
KDDI Corp. | 1,865,100 | | 101,007,270 |
Leopalace21 Corp. (a) | 2,705,100 | | 18,780,180 |
Mitsubishi Electric Corp. | 5,395,000 | | 59,301,657 |
Common Stocks - continued |
| Shares | | Value |
Japan - continued |
MS&AD Insurance Group Holdings, Inc. | 2,492,300 | | $ 64,444,286 |
Nippon Telegraph & Telephone Corp. | 1,606,400 | | 83,501,208 |
Omron Corp. | 1,256,400 | | 47,945,762 |
ORIX Corp. | 5,892,300 | | 102,061,041 |
Santen Pharmaceutical Co. Ltd. | 1,080,000 | | 54,826,988 |
Seven & i Holdings Co., Ltd. | 2,102,500 | | 77,810,658 |
Seven Bank Ltd. | 9,707,000 | | 34,355,557 |
Shinsei Bank Ltd. | 20,324,000 | | 47,584,711 |
SoftBank Corp. | 853,200 | | 63,716,045 |
Sumitomo Corp. | 4,698,900 | | 61,148,224 |
Sumitomo Mitsui Financial Group, Inc. | 5,147,100 | | 248,789,677 |
Sumitomo Mitsui Trust Holdings, Inc. | 16,471,000 | | 81,351,729 |
Tokyo Tatemono Co. Ltd. | 4,053,000 | | 38,049,591 |
Toyota Motor Corp. | 1,957,200 | | 126,901,305 |
USS Co. Ltd. | 3,078,200 | | 45,078,689 |
TOTAL JAPAN | | 2,133,243,333 |
Netherlands - 3.2% |
AEGON NV | 4,444,601 | | 35,365,172 |
ING Groep NV (Certificaten Van Aandelen) (a) | 6,040,034 | | 76,755,100 |
Koninklijke Philips Electronics NV | 3,432,226 | | 121,297,386 |
Royal DSM NV | 965,258 | | 73,117,205 |
Unilever NV (Certificaten Van Aandelen) (Bearer) | 1,374,269 | | 54,483,552 |
TOTAL NETHERLANDS | | 361,018,415 |
Norway - 1.1% |
Telenor ASA | 4,966,853 | | 119,310,266 |
Singapore - 1.7% |
Singapore Telecommunications Ltd. | 34,892,000 | | 106,175,946 |
United Overseas Bank Ltd. | 5,190,491 | | 87,079,241 |
TOTAL SINGAPORE | | 193,255,187 |
Spain - 3.1% |
Amadeus IT Holding SA Class A | 1,470,974 | | 54,623,829 |
Banco Bilbao Vizcaya Argentaria SA sponsored ADR (d) | 14,753,805 | | 172,324,442 |
International Consolidated Airlines Group SA CDI (a) | 7,477,700 | | 41,712,320 |
Repsol YPF SA | 2,970,337 | | 79,772,247 |
TOTAL SPAIN | | 348,432,838 |
Common Stocks - continued |
| Shares | | Value |
Sweden - 1.5% |
Svenska Cellulosa AB (SCA) (B Shares) | 2,085,412 | | $ 59,214,946 |
Svenska Handelsbanken AB (A Shares) | 2,374,763 | | 107,596,456 |
TOTAL SWEDEN | | 166,811,402 |
Switzerland - 5.7% |
Novartis AG | 2,776,021 | | 215,481,924 |
Roche Holding AG (participation certificate) | 321,765 | | 89,080,694 |
Swiss Re Ltd. | 1,484,050 | | 130,356,296 |
Syngenta AG (Switzerland) | 192,799 | | 77,816,895 |
UBS AG (NY Shares) | 6,753,271 | | 130,743,327 |
TOTAL SWITZERLAND | | 643,479,136 |
United Kingdom - 24.8% |
Barclays PLC | 41,411,364 | | 174,236,903 |
BHP Billiton PLC | 6,040,433 | | 186,398,690 |
British American Tobacco PLC (United Kingdom) | 1,378,300 | | 76,043,960 |
BT Group PLC | 10,912,595 | | 66,028,115 |
Bunzl PLC | 3,347,718 | | 73,913,657 |
Compass Group PLC | 5,760,900 | | 82,856,133 |
GlaxoSmithKline PLC sponsored ADR | 1,077,710 | | 56,719,877 |
HSBC Holdings PLC sponsored ADR (d) | 7,634,501 | | 420,202,930 |
Imperial Tobacco Group PLC | 3,165,610 | | 118,213,963 |
ITV PLC | 26,568,285 | | 81,322,614 |
Kingfisher PLC | 13,051,905 | | 79,001,028 |
Legal & General Group PLC | 35,389,646 | | 122,736,750 |
National Grid PLC | 10,993,151 | | 138,148,288 |
Next PLC | 690,200 | | 60,258,001 |
Prudential PLC | 5,154,955 | | 105,422,770 |
Reed Elsevier PLC | 6,389,091 | | 89,534,907 |
Rolls-Royce Group PLC | 2,391,900 | | 44,104,483 |
Royal Dutch Shell PLC Class A sponsored ADR | 4,506,501 | | 300,403,357 |
Taylor Wimpey PLC | 23,224,385 | | 41,036,253 |
Tesco PLC | 18,676,189 | | 109,061,152 |
Vodafone Group PLC sponsored ADR | 10,366,472 | | 381,693,499 |
TOTAL UNITED KINGDOM | | 2,807,337,330 |
Common Stocks - continued |
| Shares | | Value |
United States of America - 0.8% |
AbbVie, Inc. | 1,316,660 | | $ 63,792,177 |
Cabot Corp. | 654,155 | | 30,490,165 |
TOTAL UNITED STATES OF AMERICA | | 94,282,342 |
TOTAL COMMON STOCKS (Cost $9,132,988,926) |
10,918,887,351
|
Nonconvertible Preferred Stocks - 1.5% |
| | | |
Germany - 1.5% |
Volkswagen AG
(Cost $134,683,127) | 657,440 | |
167,102,051
|
Money Market Funds - 4.7% |
| | | |
Fidelity Cash Central Fund, 0.09% (b) | 301,766,952 | | 301,766,952 |
Fidelity Securities Lending Cash Central Fund, 0.09% (b)(c) | 226,982,734 | | 226,982,734 |
TOTAL MONEY MARKET FUNDS (Cost $528,749,686) |
528,749,686
|
TOTAL INVESTMENT PORTFOLIO - 102.7% (Cost $9,796,421,739) | 11,614,739,088 |
NET OTHER ASSETS (LIABILITIES) - (2.7)% | (303,165,765) |
NET ASSETS - 100% | $ 11,311,573,323 |
Legend |
(a) Non-income producing |
(b) Affiliated fund that is generally available only to investment companies and other accounts managed by Fidelity Investments. The rate quoted is the annualized seven-day yield of the fund at period end. A complete unaudited listing of the fund's holdings as of its most recent quarter end is available upon request. In addition, each Fidelity Central Fund's financial statements, which are not covered by the Fund's Report of Independent Registered Public Accounting Firm, are available on the SEC's website or upon request. |
(c) Investment made with cash collateral received from securities on loan. |
(d) Security or a portion of the security is on loan at period end. |
Affiliated Central Funds |
Information regarding fiscal year to date income earned by the Fund from investments in Fidelity Central Funds is as follows: |
Fund | Income earned |
Fidelity Cash Central Fund | $ 135,726 |
Fidelity Securities Lending Cash Central Fund | 10,120,143 |
Total | $ 10,255,869 |
Other Information |
Categorizations in the Schedule of Investments are based on country or territory of incorporation. |
The following is a summary of the inputs used, as of October 31, 2013, involving the Fund's assets and liabilities carried at fair value. The inputs or methodology used for valuing securities may not be an indication of the risk associated with investing in those securities. For more information on valuation inputs, and their aggregation into the levels used in the tables below, please refer to the Investment Valuation section in the accompanying Notes to Financial Statements. |
Valuation Inputs at Reporting Date: |
Description | Total | Level 1 | Level 2 | Level 3 |
Investments in Securities: | | | | |
Equities: | | | | |
Consumer Discretionary | $ 1,152,517,071 | $ 848,259,212 | $ 304,257,859 | $ - |
Consumer Staples | 714,766,856 | 371,363,658 | 343,403,198 | - |
Energy | 789,840,805 | 380,175,604 | 409,665,201 | - |
Financials | 3,583,731,793 | 2,469,281,354 | 1,114,450,439 | - |
Health Care | 1,204,212,661 | 498,147,676 | 706,064,985 | - |
Industrials | 1,042,690,007 | 479,073,574 | 563,616,433 | - |
Information Technology | 364,580,854 | 193,237,464 | 171,343,390 | - |
Materials | 803,905,114 | 455,629,876 | 348,275,238 | - |
Telecommunication Services | 1,133,572,902 | 819,320,264 | 314,252,638 | - |
Utilities | 296,171,339 | 113,684,240 | 182,487,099 | - |
Money Market Funds | 528,749,686 | 528,749,686 | - | - |
Total Investments in Securities: | $ 11,614,739,088 | $ 7,156,922,608 | $ 4,457,816,480 | $ - |
The following is a summary of transfers between Level 1 and Level 2 for the period ended October 31, 2013. Transfers are assumed to have occurred at the beginning of the period, and are primarily attributable to the valuation techniques used for foreign equity securities, as discussed in the accompanying Notes to Financial Statements: |
Transfers | Total |
Level 1 to Level 2 | $ 765,164,398 |
Level 2 to Level 1 | $ 0 |
See accompanying notes which are an integral part of the financial statements.
Annual Report
Fidelity Series International Value Fund
Statement of Assets and Liabilities
| October 31, 2013 |
| | |
Assets | | |
Investment in securities, at value (including securities loaned of $221,537,181) - See accompanying schedule: Unaffiliated issuers (cost $9,267,672,053) | $ 11,085,989,402 | |
Fidelity Central Funds (cost $528,749,686) | 528,749,686 | |
Total Investments (cost $9,796,421,739) | | $ 11,614,739,088 |
Cash | | 998,350 |
Foreign currency held at value (cost $30) | | 30 |
Receivable for investments sold | | 51,949,260 |
Receivable for fund shares sold | | 63,338,426 |
Dividends receivable | | 37,092,079 |
Distributions receivable from Fidelity Central Funds | | 49,427 |
Prepaid expenses | | 34,920 |
Other receivables | | 574,900 |
Total assets | | 11,768,776,480 |
| | |
Liabilities | | |
Payable for investments purchased | $ 222,241,821 | |
Payable for fund shares redeemed | 1,159,053 | |
Accrued management fee | 5,653,060 | |
Other affiliated payables | 954,331 | |
Other payables and accrued expenses | 212,158 | |
Collateral on securities loaned, at value | 226,982,734 | |
Total liabilities | | 457,203,157 |
| | |
Net Assets | | $ 11,311,573,323 |
Net Assets consist of: | | |
Paid in capital | | $ 9,327,349,081 |
Undistributed net investment income | | 245,251,345 |
Accumulated undistributed net realized gain (loss) on investments and foreign currency transactions | | (79,359,473) |
Net unrealized appreciation (depreciation) on investments and assets and liabilities in foreign currencies | | 1,818,332,370 |
Net Assets | | $ 11,311,573,323 |
See accompanying notes which are an integral part of the financial statements.
Annual Report
Statement of Assets and Liabilities - continued
| October 31, 2013 |
| | |
Series International Value:
Net Asset Value, offering price and redemption price
per share ($5,710,397,209 ÷ 512,560,043 shares) | | $ 11.14 |
| | |
Class F:
Net Asset Value, offering price and redemption price per share ($5,601,176,114 ÷ 501,190,195 shares) | | $ 11.18 |
See accompanying notes which are an integral part of the financial statements.
Annual Report
Fidelity Series International Value Fund
Financial Statements - continued
Statement of Operations
| Year ended October 31, 2013 |
| | |
Investment Income | | |
Dividends | | $ 355,489,975 |
Interest | | 2,014 |
Income from Fidelity Central Funds | | 10,255,869 |
Income before foreign taxes withheld | | 365,747,858 |
Less foreign taxes withheld | | (22,257,054) |
Total income | | 343,490,804 |
| | |
Expenses | | |
Management fee
Basic fee | $ 70,433,562 | |
Performance adjustment | (3,937,564) | |
Transfer agent fees | 9,645,681 | |
Accounting and security lending fees | 1,819,849 | |
Custodian fees and expenses | 984,114 | |
Independent trustees' compensation | 56,634 | |
Audit | 74,807 | |
Legal | 23,533 | |
Interest | 2,304 | |
Miscellaneous | 87,127 | |
Total expenses before reductions | 79,190,047 | |
Expense reductions | (2,630,141) | 76,559,906 |
Net investment income (loss) | | 266,930,898 |
Realized and Unrealized Gain (Loss) Net realized gain (loss) on: | | |
Investment securities: | | |
Unaffiliated issuers | 868,090,560 | |
Foreign currency transactions | (4,289,247) | |
Total net realized gain (loss) | | 863,801,313 |
Change in net unrealized appreciation (depreciation) on: Investment securities | 1,177,646,283 | |
Assets and liabilities in foreign currencies | 581,195 | |
Total change in net unrealized appreciation (depreciation) | | 1,178,227,478 |
Net gain (loss) | | 2,042,028,791 |
Net increase (decrease) in net assets resulting from operations | | $ 2,308,959,689 |
See accompanying notes which are an integral part of the financial statements.
Annual Report
Statement of Changes in Net Assets
| Year ended
October 31,
2013 | Year ended
October 31,
2012 |
Increase (Decrease) in Net Assets | | |
Operations | | |
Net investment income (loss) | $ 266,930,898 | $ 273,702,376 |
Net realized gain (loss) | 863,801,313 | 88,283,539 |
Change in net unrealized appreciation (depreciation) | 1,178,227,478 | 445,133,181 |
Net increase (decrease) in net assets resulting
from operations | 2,308,959,689 | 807,119,096 |
Distributions to shareholders from net investment income | (264,134,724) | (180,442,293) |
Distributions to shareholders from net realized gain | (56,993,210) | - |
Total distributions | (321,127,934) | (180,442,293) |
Share transactions - net increase (decrease) | 101,473,805 | 2,136,137,238 |
Total increase (decrease) in net assets | 2,089,305,560 | 2,762,814,041 |
| | |
Net Assets | | |
Beginning of period | 9,222,267,763 | 6,459,453,722 |
End of period (including undistributed net investment income of $245,251,345 and undistributed net investment income of $242,455,171, respectively) | $ 11,311,573,323 | $ 9,222,267,763 |
See accompanying notes which are an integral part of the financial statements.
Annual Report
Financial Highlights - Series International Value
Years ended October 31, | 2013 | 2012 | 2011 | 2010 G |
Selected Per-Share Data | | | | |
Net asset value, beginning of period | $ 9.16 | $ 8.59 | $ 9.91 | $ 10.00 |
Income from Investment Operations | | | | |
Net investment income (loss) D | .26 | .29 | .30 | .18 |
Net realized and unrealized gain (loss) | 2.03 | .50 | (1.45) | (.27) |
Total from investment operations | 2.29 | .79 | (1.15) | (.09) |
Distributions from net investment income | (.26) | (.22) | (.13) | - |
Distributions from net realized gain | (.06) | - | (.04) | - |
Total distributions | (.31) I | (.22) | (.17) | - |
Net asset value, end of period | $ 11.14 | $ 9.16 | $ 8.59 | $ 9.91 |
Total Return B, C | 25.78% | 9.56% | (11.84)% | (.90)% |
Ratios to Average Net Assets E, H | | | | |
Expenses before reductions | .88% | .90% | .95% | 1.01% A |
Expenses net of fee waivers, if any | .88% | .90% | .95% | 1.01% A |
Expenses net of all reductions | .85% | .87% | .93% | .99% A |
Net investment income (loss) | 2.58% | 3.35% | 3.05% | 2.24% A |
Supplemental Data | | | | |
Net assets, end of period (000 omitted) | $ 5,710,397 | $ 5,107,633 | $ 4,503,487 | $ 3,865,058 |
Portfolio turnover rate F | 80% | 63% | 78% | 72% A |
A Annualized
B Total returns for periods of less than one year are not annualized.
C Total returns would have been lower if certain expenses had not been reduced during the applicable periods shown.
D Calculated based on average shares outstanding during the period.
E Fees and expenses of any underlying Fidelity Central Funds are not included in the Fund's expense ratio. The Fund indirectly bears its proportionate share of the expenses of any underlying Fidelity Central Funds.
F Amount does not include the portfolio activity of any underlying Fidelity Central Funds.
G For the period December 3, 2009 (commencement of operations) to October 31, 2010.
H Expense ratios reflect operating expenses of the class. Expenses before reductions do not reflect amounts reimbursed by the investment adviser or reductions from brokerage service arrangements or reductions from other expense offset arrangements and do not represent the amount paid by the class during periods when reimbursements or reductions occur. Expense ratios before reductions for start-up periods may not be representative of longer-term operating periods. Expenses net of fee waivers reflect expenses after reimbursement by the investment adviser but prior to reductions from brokerage service arrangements or other expense offset arrangements. Expenses net of all reductions represent the net expenses paid by the class.
I Total distributions of $.31 per share is comprised of distributions from net investment income of $.256 and distributions from net realized gain of $.057 per share.
See accompanying notes which are an integral part of the financial statements.
Annual Report
Financial Highlights - Class F
Years ended October 31, | 2013 | 2012 | 2011 | 2010 G |
Selected Per-Share Data | | | | |
Net asset value, beginning of period | $ 9.19 | $ 8.62 | $ 9.93 | $ 10.00 |
Income from Investment Operations | | | | |
Net investment income (loss) D | .28 | .30 | .31 | .20 |
Net realized and unrealized gain (loss) | 2.04 | .51 | (1.44) | (.27) |
Total from investment operations | 2.32 | .81 | (1.13) | (.07) |
Distributions from net investment income | (.27) | (.24) | (.14) | - |
Distributions from net realized gain | (.06) | - | (.04) | - |
Total distributions | (.33) | (.24) | (.18) | - |
Net asset value, end of period | $ 11.18 | $ 9.19 | $ 8.62 | $ 9.93 |
Total Return B, C | 26.05% | 9.77% | (11.61)% | (.70)% |
Ratios to Average Net Assets E, H | | | | |
Expenses before reductions | .69% | .70% | .74% | .78% A |
Expenses net of fee waivers, if any | .69% | .70% | .74% | .78% A |
Expenses net of all reductions | .67% | .67% | .72% | .75% A |
Net investment income (loss) | 2.76% | 3.55% | 3.26% | 2.47% A |
Supplemental Data | | | | |
Net assets, end of period (000 omitted) | $ 5,601,176 | $ 4,114,635 | $ 1,955,967 | $ 730,524 |
Portfolio turnover rate F | 80% | 63% | 78% | 72% A |
A Annualized
B Total returns for periods of less than one year are not annualized.
C Total returns would have been lower if certain expenses had not been reduced during the applicable periods shown.
D Calculated based on average shares outstanding during the period.
E Fees and expenses of any underlying Fidelity Central Funds are not included in the Fund's expense ratio. The Fund indirectly bears its proportionate share of the expenses of any underlying Fidelity Central Funds.
F Amount does not include the portfolio activity of any underlying Fidelity Central Funds.
G For the period December 3, 2009 (commencement of operations) to October 31, 2010.
H Expense ratios reflect operating expenses of the class. Expenses before reductions do not reflect amounts reimbursed by the investment adviser or reductions from brokerage service arrangements or reductions from other expense offset arrangements and do not represent the amount paid by the class during periods when reimbursements or reductions occur. Expense ratios before reductions for start-up periods may not be representative of longer-term operating periods. Expenses net of fee waivers reflect expenses after reimbursement by the investment adviser but prior to reductions from brokerage service arrangements or other expense offset arrangements. Expenses net of all reductions represent the net expenses paid by the class.
See accompanying notes which are an integral part of the financial statements.
Annual Report
Notes to Financial Statements
For the period ended October 31, 2013
1. Organization.
Fidelity Series Emerging Markets Fund, Fidelity Series International Growth Fund, Fidelity Series International Small Cap Fund and Fidelity Series International Value Fund (the Funds) are funds of Fidelity Investment Trust (the Trust). The Trust is registered under the Investment Company Act of 1940, as amended (the 1940 Act), as an open-end management investment company organized as a Massachusetts business trust. Each Fund is authorized to issue an unlimited number of shares. Shares of the Funds are only available for purchase by mutual funds for which Fidelity Management & Research Company (FMR) or an affiliate serves as an investment manager. Fidelity Series Emerging Markets Fund offers Series Emerging Markets shares and Class F shares. Fidelity Series International Growth Fund offers Series International Growth shares and Class F shares. Fidelity Series International Small Cap Fund offers Series International Small Cap shares and Class F shares. Fidelity Series International Value Fund offers Series International Value shares and Class F shares. All classes have equal rights as to assets and voting privileges. Each class has exclusive voting rights with respect to matters that affect that class. The Funds' investments in emerging markets can be subject to social, economic, regulatory, and political uncertainties and can be extremely volatile.
2. Investments in Fidelity Central Funds.
The Funds invests in Fidelity Central Funds, which are open-end investment companies generally available only to other investment companies and accounts managed by FMR and its affiliates. The Funds' Schedules of Investments list each of the Fidelity Central Funds held as of period end, if any, as an investment of each Fund, but do not include the underlying holdings of each Fidelity Central Fund. As an Investing Fund, each Fund indirectly bears its proportionate share of the expenses of the underlying Fidelity Central Funds.
The Money Market Central Funds seek preservation of capital and current income and are managed by Fidelity Investments Money Management, Inc. (FIMM), an affiliate of FMR.
A complete unaudited list of holdings for each Fidelity Central Fund is available upon request or at the Securities and Exchange Commission (the SEC) website at www.sec.gov. In addition, the financial statements of the Fidelity Central Funds, which are not covered by the Funds' Report of Independent Registered Public Accounting Firm, are available on the SEC website or upon request.
Annual Report
Notes to Financial Statements - continued
3. Significant Accounting Policies.
The financial statements have been prepared in conformity with accounting principles generally accepted in the United States of America (GAAP), which require management to make certain estimates and assumptions at the date of the financial statements. Actual results could differ from those estimates. Subsequent events, if any, through the date that the financial statements were issued have been evaluated in the preparation of the financial statements. The following summarizes the significant accounting policies of the Funds:
Investment Valuation. Investments are valued as of 4:00 p.m. Eastern time on the last calendar day of the period. In accordance with valuation policies and procedures approved by the Board of Trustees (the Board), each Fund attempts to obtain prices from one or more third party pricing vendors or brokers to value its investments. When current market prices, quotations or currency exchange rates are not readily available or reliable, investments will be fair valued in good faith by the FMR Fair Value Committee (the Committee), in accordance with procedures adopted by the Board. Factors used in determining fair value vary by investment type and may include market or investment specific events, changes in interest rates and credit quality. The frequency with which these procedures are used cannot be predicted and they may be utilized to a significant extent. The Committee oversees each Fund's valuation policies and procedures and is responsible for approving and reporting to the Board all fair value determinations.
Each Fund categorizes the inputs to valuation techniques used to value their investments into a disclosure hierarchy consisting of three levels as shown below:
Level 1 - quoted prices in active markets for identical investments
Level 2 - other significant observable inputs (including quoted prices for similar investments, interest rates, prepayment speeds, etc.)
Level 3 - unobservable inputs (including the Fund's own assumptions based on the best information available)
Valuation techniques used to value each Fund's investments by major category are as follows:
Equity securities, including restricted securities, for which market quotations are readily available, are valued at the last reported sale price or official closing price as reported by a third party pricing vendor on the primary market or exchange on which they are traded and are categorized as Level 1 in the hierarchy. In the event there were no sales during the day or closing prices are not available, securities are valued at the last quoted bid price or may be valued using the last available price and are generally categorized as Level 2 in the hierarchy. For foreign equity securities, when market or security specific events arise, comparisons to the valuation of American Depositary Receipts (ADRs),
Annual Report
3. Significant Accounting Policies - continued
Investment Valuation - continued
futures contracts, Exchange-Traded Funds (ETFs) and certain indexes as well as quoted prices for similar securities may be used and would be categorized as Level 2 in the hierarchy. Utilizing these techniques may result in transfers between Level 1 and Level 2. For equity securities, including restricted securities, where observable inputs are limited, assumptions about market activity and risk are used and these securities may be categorized as Level 3 in the hierarchy.
Debt securities, including restricted securities, are valued based on evaluated prices received from third party pricing vendors or from brokers who make markets in such securities. For U.S. government and government agency obligations, pricing vendors utilize matrix pricing which considers yield or price of bonds of comparable quality, coupon, maturity and type as well as broker-supplied prices. When independent prices are unavailable or unreliable, debt securities may be valued utilizing pricing methodologies which consider similar factors that would be used by third party pricing vendors. Debt securities are generally categorized as Level 2 in the hierarchy but may be Level 3 depending on the circumstances.
Futures contracts are valued at the settlement price established each day by the board of trade or exchange on which they are traded and are categorized as Level 1 in the hierarchy. Investments in open-end mutual funds, including the Fidelity Central Funds, are valued at their closing net asset value (NAV) each business day and are categorized as Level 1 in the hierarchy.
Changes in valuation techniques may result in transfers in or out of an assigned level within the disclosure hierarchy. The aggregate value of investments by input level, as of October 31, 2013, including information on transfers between Levels 1 and 2, is included at the end of each applicable Fund's Schedule of Investments.
Foreign Currency. The Funds may use foreign currency contracts to facilitate transactions in foreign-denominated securities. Gains and losses from these transactions may arise from changes in the value of the foreign currency or if the counterparties do not perform under the contracts' terms.
Foreign-denominated assets, including investment securities, and liabilities are translated into U.S. dollars at the exchange rates at period end. Purchases and sales of investment securities, income and dividends received and expenses denominated in foreign currencies are translated into U.S. dollars at the exchange rate in effect on the transaction date.
The effects of exchange rate fluctuations on investments are included with the net realized and unrealized gain (loss) on investment securities. Other foreign currency transactions resulting in realized and unrealized gain (loss) are disclosed separately.
Annual Report
Notes to Financial Statements - continued
3. Significant Accounting Policies - continued
Investment Transactions and Income. For financial reporting purposes, the Funds' investment holdings and NAV include trades executed through the end of the last business day of the period. The NAV per share for processing shareholder transactions is calculated as of the close of business of the New York Stock Exchange (NYSE), normally 4:00 p.m. Eastern time and includes trades executed through the end of the prior business day. Gains and losses on securities sold are determined on the basis of identified cost. Dividend income is recorded on the ex-dividend date, except for certain dividends from foreign securities where the ex-dividend date may have passed, which are recorded as soon as the Funds are informed of the ex-dividend date. Non-cash dividends included in dividend income, if any, are recorded at the fair market value of the securities received. Distributions received on securities that represent a return of capital or capital gain are recorded as a reduction of cost of investments and/or as a realized gain. Subsequent to ex-dividend date the Funds determine the components of these distributions, based upon receipt of tax filings or other correspondence relating to the underlying investment. Interest income and distributions from the Fidelity Central Funds are accrued as earned. Interest income includes coupon interest and amortization of premium and accretion of discount on debt securities. Investment income is recorded net of foreign taxes withheld where recovery of such taxes is uncertain.
Class Allocations and Expenses. Investment income, realized and unrealized capital gains and losses, common expenses of each Fund, and certain fund-level expense reductions, if any, are allocated daily on a pro-rata basis to each class based on the relative net assets of each class to the total net assets of each Fund. Each class differs with respect to transfer agent fees incurred. Certain expense reductions may also differ by class. For the reporting period, the allocated portion of income and expenses to each class as a percent of its average net assets may vary due to the timing of recording these transactions in relation to fluctuating net assets of the classes. Expenses directly attributable to a fund are charged to that fund. Expenses attributable to more than one fund are allocated among the respective funds on the basis of relative net assets or other appropriate methods. Expense estimates are accrued in the period to which they relate and adjustments are made when actual amounts are known.
Income Tax Information and Distributions to Shareholders. Each year, each Fund intends to qualify as a regulated investment company under Subchapter M of the Internal Revenue Code, including distributing substantially all of its taxable income and realized gains. As a result, no provision for U.S. Federal income taxes is required. As of October 31, 2013, each Fund did not have any unrecognized tax benefits in the financial statements; nor is each Fund aware of any tax positions for which it is reasonably possible that the total amounts of unrecognized tax benefits will significantly change in the next twelve months. Each Fund files a U.S. federal tax return, in addition to state and local tax
Annual Report
3. Significant Accounting Policies - continued
Income Tax Information and Distributions to Shareholders - continued
returns as required. The Fund's federal income tax returns are subject to examination by the Internal Revenue Service (IRS) for a period of three fiscal years after they are filed. State and local tax returns may be subject to examination for an additional fiscal year depending on the jurisdiction. Foreign taxes are provided for based on each Fund's understanding of the tax rules and rates that exist in the foreign markets in which it invests.
Distributions are declared and recorded on the ex-dividend date. Income dividends and capital gain distributions are declared separately for each class. Income and capital gain distributions are determined in accordance with income tax regulations, which may differ from GAAP.
Capital accounts within the financial statements are adjusted for permanent book-tax differences. These adjustments have no impact on net assets or the results of operations. Temporary book-tax differences will reverse in a subsequent period.
Book-tax differences are primarily due to futures contracts, foreign currency transactions, passive foreign investment companies (PFIC), market discount, partnerships, capital loss carryforwards and losses deferred due to wash sales.
The federal tax cost of investment securities and unrealized appreciation (depreciation) as of period end were as follows for each Fund:
| Tax cost | Gross unrealized
appreciation | Gross unrealized
depreciation | Net unrealized
appreciation
(depreciation) on
securities and
other investments |
Fidelity Series Emerging Markets Fund | $ 6,191,992,464 | $ 1,222,465,081 | $ (303,698,329) | $ 918,766,752 |
Fidelity Series International Growth Fund | 8,576,465,274 | 2,856,187,392 | (54,926,746) | 2,801,260,646 |
Fidelity Series International Small Cap Fund | 1,723,986,871 | 668,275,054 | (37,225,877) | 631,049,177 |
Fidelity Series International Value Fund | 9,860,659,757 | 1,866,792,951 | (112,713,620) | 1,754,079,331 |
Annual Report
Notes to Financial Statements - continued
3. Significant Accounting Policies - continued
Income Tax Information and Distributions to Shareholders - continued
The tax-based components of distributable earnings as of period end were as follows for each Fund:
| Undistributed
ordinary income | Undistributed
long-term
capital gain | Capital loss
carryforward | Net unrealized
appreciation
(depreciation) |
Fidelity Series Emerging Markets Fund | $ 70,981,850 | $ - | $ (285,015,404) | $ 918,096,713 |
Fidelity Series International Growth Fund | 94,753,598 | 45,103,094 | - | 2,801,449,319 |
Fidelity Series International Small Cap Fund | 29,539,645 | 66,526,090 | - | 631,034,771 |
Fidelity Series International Value Fund | 284,440,274 | - | (54,310,384) | 1,754,094,351 |
Capital loss carryforwards are only available to offset future capital gains of the Funds to the extent provided by regulations and may be limited. Under the Regulated Investment Company Modernization Act of 2010 (the Act), the Funds are permitted to carry forward capital losses incurred in taxable years beginning after December 22, 2010 for an unlimited period and such capital losses are required to be used prior to any losses that expire. The capital loss carryforward information presented below, including any applicable limitation, is estimated as of fiscal period end and is subject to adjustment.
| 2019 | Total with
expiration |
Fidelity Series International Value Fund | $ (54,310,384) | $ (54,310,384) |
| No expiration | | |
| Short-term | Long-term | Total no
expiration | Total capital loss
carryfoward |
Fidelity Series Emerging Markets Fund | $ (285,015,404) | $ - | $ (285,015,404) | $ (285,015,404) |
Fidelity Series International Value Fund | - | - | - | (54,310,384) |
Annual Report
3. Significant Accounting Policies - continued
Income Tax Information and Distributions to Shareholders - continued
The tax character of distributions paid was as follows:
October 31, 2013 | | | |
| Ordinary Income | Long-term
Capital Gains | Total |
Fidelity Series Emerging Markets Fund | $ 86,946,753 | $ - | $ 86,946,753 |
Fidelity Series International Growth Fund | 154,572,907 | - | 154,572,907 |
Fidelity Series International Small Cap Fund | 21,986,226 | - | 21,986,226 |
Fidelity Series International Value Fund | 321,127,934 | - | 321,127,934 |
October 31, 2012 | | | |
| Ordinary Income | Long-term
Capital Gains | Total |
Fidelity Series Emerging Markets Fund | $ 37,299,957 | $ 152,630,224 | $ 189,930,181 |
Fidelity Series International Growth Fund | 91,195,077 | - | 91,195,077 |
Fidelity Series International Small Cap Fund | 17,445,879 | - | 17,445,879 |
Fidelity Series International Value Fund | 180,442,293 | - | 180,442,293 |
Delayed Delivery Transactions and When-Issued Securities. During the period, the Funds transacted in securities on a delayed delivery or when-issued basis. Payment and delivery may take place after the customary settlement period for that security. The price of the underlying securities and the date when the securities will be delivered and paid for are fixed at the time the transaction is negotiated. The securities purchased on a delayed delivery or when-issued basis are identified as such in each applicable Fund's Schedule of Investments. With respect to purchase commitments, each applicable Fund identifies securities as segregated in its records with a value at least equal to the amount of the commitment. Losses may arise due to changes in the value of the underlying securities or if the counterparty does not perform under the contract's terms, or if the issuer does not issue the securities due to political, economic, or other factors.
Restricted Securities. The Funds may invest in securities that are subject to legal or contractual restrictions on resale. These securities generally may be resold in transactions exempt from registration or to the public if the securities are registered. Disposal of these securities may involve time-consuming negotiations and expense, and prompt sale at an acceptable price may be difficult. Information regarding restricted securities is included at the end of each applicable Fund's Schedule of Investments.
Annual Report
Notes to Financial Statements - continued
3. Significant Accounting Policies - continued
New Accounting Pronouncement. The Financial Accounting Standards Board issued in December 2011, Accounting Standard Update No. 2011-11, Disclosures about Offsetting Assets and Liabilities, and in January 2013, Accounting Standards Update No. 2013-1 Clarifying the Scope of Disclosures about Offsetting Assets and Liabilities. These updates create new disclosure requirements requiring entities to disclose both gross and net information for derivatives and other financial instruments that are either offset in the Statement of Assets and Liabilities or subject to an enforceable master netting arrangement or similar agreement. The disclosure requirements are effective for annual reporting periods beginning on or after January 1, 2013, and interim periods within those annual periods. Management expects that the impact of the updates' adoption will be limited to additional financial statement disclosures as applicable.
4. Derivative Instruments.
Risk Exposures and the Use of Derivative Instruments. The Funds' investment objective allows the Funds to enter into various types of derivative contracts, including futures contracts. Derivatives are investments whose value is primarily derived from underlying assets, indices or reference rates and may be transacted on an exchange or over-the-counter (OTC). Derivatives may involve a future commitment to buy or sell a specified asset based on specified terms, to exchange future cash flows at periodic intervals based on a notional principal amount, or for one party to make one or more payments upon the occurrence of specified events in exchange for periodic payments from the other party.
The Funds used derivatives to increase returns, to gain exposure to certain types of assets and to manage exposure to certain risks as defined below. The success of any strategy involving derivatives depends on analysis of numerous economic factors, and if the strategies for investment do not work as intended, the Funds may not achieve their objectives.
The Funds' use of derivatives increased or decreased their exposure to the following risk:
Equity Risk | Equity risk relates to the fluctuations in the value of financial instruments as a result of changes in market prices (other than those arising from interest rate risk or foreign exchange risk), whether caused by factors specific to an individual investment, its issuer, or all factors affecting all instruments traded in a market or market segment. |
The Funds are also exposed to additional risks from investing in derivatives, such as liquidity risk and counterparty credit risk. Liquidity risk is the risk that the Funds will be unable to close out the derivative in the open market in a timely manner. Counterparty credit risk is the risk that the counterparty will not be able to fulfill its obligation to the Funds. Counterparty credit risk related to exchange-traded futures contracts may be mitigated by the protection provided by the exchange on which they trade.
Annual Report
4. Derivative Instruments - continued
Risk Exposures and the Use of Derivative Instruments - continued
Investing in derivatives may involve greater risks than investing in the underlying assets directly and, to varying degrees, may involve risk of loss in excess of any initial investment and collateral received and amounts recognized in the Statement of Assets and Liabilities. In addition, there may be the risk that the change in value of the derivative contract does not correspond to the change in value of the underlying instrument.
Net Realized Gain (Loss) and Change in Net Unrealized Appreciation (Depreciation) on Derivatives. The table below, which reflects the impacts of derivatives on the financial performance of the applicable Funds, summarizes the net realized gain (loss) and change in net unrealized appreciation (depreciation) for derivatives during the period as presented in the Statement of Operations.
Primary Risk Exposure / Derivative Type | Net Realized
Gain (Loss) | Change in
Net Unrealized Appreciation
(Depreciation) |
Fidelity Series Emerging Markets Fund | | |
Equity Risk | | |
Futures Contracts (a) | $ (4,623,626) | $ (251,067) |
Fidelity Series International Growth Fund | | |
Equity Risk | | |
Futures Contracts (a) | $ (14,920,138) | $ - |
(a) A summary of the value of derivatives by primary risk exposure as of period end, if any, is included at the end of the Schedule of Investments and is representative of activity for the period.
Futures Contracts. A futures contract is an agreement between two parties to buy or sell a specified underlying instrument for a fixed price at a specified future date. The Funds used futures contracts to manage their exposure to the stock market.
Upon entering into a futures contract, a fund is required to deposit either cash or securities (initial margin) with a clearing broker in an amount equal to a certain percentage of the face value of the contract. Futures contracts are marked-to-market daily and subsequent daily payments (variation margin) are made or received by a fund depending on the daily fluctuations in the value of the futures contracts and are recorded as unrealized appreciation or (depreciation). This receivable and/or payable, if any, is included in daily variation margin for derivative instruments in the Statement of Assets and Liabilities. Realized gain or (loss) is recorded upon the expiration or closing of a futures contract. The net realized gain (loss) and change in net unrealized appreciation (depreciation) on futures contracts during the period is included in the Statement of Operations.
Annual Report
Notes to Financial Statements - continued
4. Derivative Instruments - continued
Futures Contracts - continued
Any open futures contracts at period end are presented in the Schedule of Investments under the caption "Futures Contracts". The underlying face amount at value reflects each contract's exposure to the underlying instrument or index at period end and is representative of activity for the period. Securities deposited to meet initial margin requirements are identified in the Schedule of Investments.
5. Purchases and Sales of Investments.
Purchases and sales of securities, other than short-term securities, are noted in the table below.
| Purchases ($) | Sales ($) |
Fidelity Series Emerging Markets Fund | 5,541,843,012 | 4,699,585,798 |
Fidelity Series International Growth Fund | 4,154,771,681 | 3,995,060,275 |
Fidelity Series International Small Cap Fund | 568,439,276 | 568,627,391 |
Fidelity Series International Value Fund | 7,872,287,660 | 7,938,246,098 |
6. Fees and Other Transactions with Affiliates.
Management Fee. FMR and its affiliates provide the Funds with investment management related services for which the Funds pay a monthly management fee. The management fee is the sum of an individual fund fee rate and an annualized group fee rate. The individual fund fee rate is applied to each Fund's average net assets. The group fee rate is based upon the average net assets of all the mutual funds advised by FMR, including any mutual funds previously advised by FMR that are currently advised by Fidelity SelectCo, LLC, an affiliate of FMR. The group fee rate decreases as assets under management increase and increases as assets under management decrease. In addition, the management fee for Fidelity Series International Growth Fund, Fidelity Series International Small Cap Fund and Fidelity Series International Value Fund is subject to a performance adjustment (up to a maximum ± .20% of each applicable Fund's average net assets over a 36 month performance period). The upward or downward adjustment to the management fee is based on each applicable Fund's relative investment performance of the asset-weighted return of all classes as compared to an appropriate benchmark index over the same 36 month performance period. For the reporting period, each Fund's annual management fee rate expressed as a percentage of each Fund's average net assets,
Annual Report
6. Fees and Other Transactions with Affiliates - continued
Management Fee - continued
including the performance adjustment, if applicable was as follows. The performance adjustment included in the management fee rate may be higher or lower than the maximum performance adjustment rate due to the difference between the average net asset for the reporting and performance periods.
| Individual Rate | Group Rate | Total |
Fidelity Series Emerging Markets Fund | .55% | .25% | .80% |
Fidelity Series International Growth Fund | .45% | .25% | .82% |
Fidelity Series International Small Cap Fund | .60% | .25% | .98% |
Fidelity Series International Value Fund | .45% | .25% | .66% |
Transfer Agent Fees. Fidelity Investments Institutional Operations Company, Inc. (FIIOC), an affiliate of FMR, is the transfer, dividend disbursing and shareholder servicing agent for each class of the Funds. FIIOC receives account fees and asset-based fees that vary according to the account size and type of account of the shareholders of the respective classes of each Fund except for Class F. FIIOC receives no fees for providing transfer agency services to Class F. FIIOC pays for typesetting, printing and mailing of shareholder reports, except proxy statements. For the period, transfer agent fees for each class were as follows:
Fidelity Series Emerging Markets Fund | Amount | % of
Average
Net Assets |
Series Emerging Markets | $ 5,917,293 | .19 |
Fidelity Series International Growth Fund | | |
Series International Growth | $ 9,561,788 | .19 |
Fidelity Series International Small Cap Fund | | |
Series International Small Cap | $ 1,964,643 | .19 |
Fidelity Series International Value Fund | | |
Series International Value | $ 9,645,681 | .19 |
Accounting and Security Lending Fees. FSC maintains each Fund's accounting records. The accounting fee is based on the level of average net assets for each month. Under a separate contract, FSC administers the security lending program. The security lending fee is based on the number and duration of lending transactions.
Brokerage Commissions. Certain Funds placed a portion of their portfolio transactions with brokerage firms which are affiliates of the investment adviser. Brokerage commissions are included in net realized gain (loss) and change in net unrealized
Annual Report
Notes to Financial Statements - continued
6. Fees and Other Transactions with Affiliates - continued
Brokerage Commissions - continued
appreciation (depreciation) in the Statement of Operations. The commissions paid to these affiliated firms were as follows:
| Amount |
Fidelity Series Emerging Markets Fund | $ 31,619 |
Fidelity Series International Growth Fund | 12,346 |
Fidelity Series International Small Cap Fund | 1,963 |
Fidelity Series International Value Fund | 4,957 |
Interfund Lending Program. Pursuant to an Exemptive Order issued by the SEC, the Funds, along with other registered investment companies having management contracts with FMR, may participate in an interfund lending program. This program provides an alternative credit facility allowing the funds to borrow from, or lend money to, other participating affiliated funds. At period end, there were no interfund loans outstanding. Each applicable fund's activity in this program during the period for which loans were outstanding was as follows:
| Borrower or
Lender | Average Loan
Balance | Weighted
Average
Interest Rate | Interest Expense |
Fidelity Series International Growth Fund | Borrower | $ 35,997,400 | .38% | $ 1,909 |
Fidelity Series International Value Fund | Borrower | $ 23,125,455 | .33% | $ 2,304 |
Other. During the period, FMR reimbursed Fidelity Series Emerging Markets Fund and Fidelity Series International Small Cap Fund for certain losses in the amount of $5,002 and $1,469, respectively.
7. Committed Line of Credit.
Certain Funds participate with other funds managed by FMR or an affiliate in a $4.25 billion credit facility (the "line of credit") to be utilized for temporary or emergency purposes to fund shareholder redemptions or for other short-term liquidity purposes. The participating funds have agreed to pay commitment fees on their pro-rata portion of the line of credit, which are reflected in Miscellaneous expenses on the Statement of Operations, and are as follows:
Annual Report
7. Committed Line of Credit - continued
Fidelity Series Emerging Markets Fund | $ 13,144 |
Fidelity Series International Growth Fund | 21,193 |
Fidelity Series International Small Cap Fund | 4,336 |
Fidelity Series International Value Fund | 21,377 |
During the period, there were no borrowings on this line of credit.
8. Security Lending.
Certain Funds lend portfolio securities through a lending agent from time to time in order to earn additional income. For equity securities, a lending agent is used and may loan securities to certain qualified borrowers, including Fidelity Capital Markets (FCM), a broker-dealer affiliated with the Funds. On the settlement date of the loan, each applicable Fund receives collateral (in the form of U.S. Treasury obligations, letters of credit and/or cash) against the loaned securities and maintains collateral in an amount not less than 100% of the market value of the loaned securities during the period of the loan. The market value of the loaned securities is determined at the close of business of the Funds and any additional required collateral is delivered to the Funds on the next business day. If the borrower defaults on its obligation to return the securities loaned because of insolvency or other reasons, the Funds may apply collateral received from the borrower against the obligation. The Funds may experience delays and costs in recovering the securities loaned. Any cash collateral received is invested in the Fidelity Securities Lending Cash Central Fund. The value of loaned securities and cash collateral at period end are disclosed on each applicable Fund's Statement of Assets and Liabilities. Security lending income represents the income earned on investing cash collateral, less rebates paid to borrowers and any lending agent fees associated with the loan, plus any premium payments received for lending certain types of securities. Security lending income is presented on each applicable Fund's Statement of Operations as a component of income from Fidelity Central Funds. Security lending activity as of and during the period was as follows:
| Total Security
Lending Income | Security Lending
Income From
Securities Loaned
to FCM | Value of
Securities
Loaned to FCM
at Period End |
Fidelity Series Emerging Markets Fund | $ 437,947 | $ 3,840 | $ - |
Fidelity Series International Growth Fund | $ 5,969,221 | $ 20,130 | $ 2,488,694 |
Fidelity Series International Small Cap Fund | $ 1,028,689 | $ 18,434 | $ 3,264,794 |
Fidelity Series International Value Fund | $ 10,120,143 | $ 440 | $ - |
Annual Report
Notes to Financial Statements - continued
9. Expense Reductions.
Commissions paid to certain brokers with whom FMR, or its affiliates, places trades on behalf of Certain Funds include an amount in addition to trade execution, which may be rebated back to the Funds to offset certain expenses. In addition, through arrangements with each applicable Fund's custodian, credits realized as a result of uninvested cash balances were used to reduce the Fund's expenses. All of the applicable expense reductions are noted in the table below.
| Brokerage
Service
reduction | Custody
expense
reduction |
| | |
Fidelity Series Emerging Markets Fund | $ 1,668,355 | $ 70 |
Fidelity Series International Growth Fund | 1,296,863 | - |
Fidelity Series International Small Cap Fund | 148,819 | 23 |
Fidelity Series International Value Fund | 2,630,141 | - |
10. Distributions to Shareholders.
Distributions to shareholders of each class were as follows:
Years ended October 31, | 2013 | 2012 |
Fidelity Series Emerging Markets Fund | | |
From net investment income | | |
Series Emerging Markets | $ 42,756,925 | $ 19,056,860 |
Class F | 41,009,060 | 12,443,149 |
Total | $ 83,765,985 | $ 31,500,009 |
From net realized gain | | |
Series Emerging Markets | $ 1,733,389 | $ 106,349,572 |
Class F | 1,447,379 | 52,080,600 |
Total | $ 3,180,768 | $ 158,430,172 |
Fidelity Series International Growth Fund | | |
From net investment income | | |
Series International Growth | $ 79,982,034 | $ 54,043,921 |
Class F | 74,590,873 | 32,249,072 |
Total | $ 154,572,907 | $ 86,292,993 |
From net realized gain | | |
Series International Growth | $ - | $ 3,289,630 |
Class F | - | 1,612,454 |
Total | $ - | $ 4,902,084 |
Fidelity Series International Small Cap Fund | | |
From net investment income | | |
Series International Small Cap | $ 10,164,093 | $ 10,151,789 |
Class F | 10,323,285 | 6,009,596 |
Total | $ 20,487,378 | $ 16,161,385 |
Annual Report
10. Distributions to Shareholders - continued
Years ended October 31, | 2013 | 2012 |
From net realized gain | | |
Series International Small Cap | $ 819,685 | $ 861,944 |
Class F | 679,163 | 422,550 |
Total | $ 1,498,848 | $ 1,284,494 |
Fidelity Series International Value Fund | | |
From net investment income | | |
Series International Value | $ 139,841,918 | $ 118,015,488 |
Class F | 124,292,806 | 62,426,805 |
Total | $ 264,134,724 | $ 180,442,293 |
From net realized gain | | |
Series International Value | $ 31,136,677 | $ - |
Class F | 25,856,533 | - |
Total | $ 56,993,210 | $ - |
11. Share Transactions.
Transactions for each class of shares were as follows:
| Shares | Dollars |
Years ended October 31, | 2013 | 2012 | 2013 | 2012 |
Fidelity Series Emerging
Markets Fund | | | |
Series Emerging Markets | | | |
Shares sold | 38,959,533 | 31,451,952 | $ 645,995,579 | $ 484,451,657 |
Reinvestment of distributions | 2,717,796 | 8,531,050 | 44,490,314 | 125,406,431 |
Shares redeemed | (31,216,858) | (54,815,665) | (524,357,869) | (853,291,218) |
Net increase (decrease) | 10,460,471 | (14,832,663) | $ 166,128,024 | $ (243,433,130) |
Class F | | | | |
Shares sold | 48,367,901 | 67,812,678 | $ 813,845,994 | $ 1,052,327,163 |
Reinvestment of distributions | 2,590,387 | 4,383,407 | 42,456,439 | 64,523,749 |
Shares redeemed | (10,556,755) | (5,795,660) | (179,653,412) | (91,577,596) |
Net increase (decrease) | 40,401,533 | 66,400,425 | $ 676,649,021 | $ 1,025,273,316 |
Fidelity Series
International Growth Fund | | | |
Series International Growth | | | |
Shares sold | 39,398,443 | 74,889,920 | $ 510,170,838 | $ 802,763,519 |
Reinvestment of distributions | 6,859,523 | 5,615,431 | 79,982,034 | 57,333,551 |
Shares redeemed | (78,355,276) | (118,422,240) | (971,293,070) | (1,274,656,413) |
Net increase (decrease) | (32,097,310) | (37,916,889) | $ (381,140,198) | $ (414,559,343) |
Annual Report
Notes to Financial Statements - continued
11. Share Transactions - continued
| Shares | Dollars |
Years ended October 31, | 2013 | 2012 | 2013 | 2012 |
Class F | | | | |
Shares sold | 72,396,842 | 152,782,939 | $ 918,440,640 | $ 1,648,033,706 |
Reinvestment of distributions | 6,386,205 | 3,310,022 | 74,590,873 | 33,861,526 |
Shares redeemed | (33,723,110) | (10,402,417) | (422,112,675) | (113,389,155) |
Net increase (decrease) | 45,059,937 | 145,690,544 | $ 570,918,838 | $ 1,568,506,077 |
Fidelity Series International
Small Cap Fund | | |
Series International Small Cap | | | |
Shares sold | 5,971,087 | 10,958,013 | $ 84,453,632 | $ 125,024,787 |
Reinvestment of distributions | 869,658 | 1,029,321 | 10,983,778 | 11,013,733 |
Shares redeemed | (16,651,980) | (26,995,589) | (224,499,941) | (307,921,860) |
Net increase (decrease) | (9,811,235) | (15,008,255) | $ (129,062,531) | $ (171,883,340) |
Class F | | | | |
Shares sold | 12,254,974 | 28,473,754 | $ 168,713,546 | $ 323,989,745 |
Reinvestment of distributions | 869,759 | 600,014 | 11,002,448 | 6,432,146 |
Shares redeemed | (7,885,777) | (4,713,797) | (107,516,162) | (55,112,933) |
Net increase (decrease) | 5,238,956 | 24,359,971 | $ 72,199,832 | $ 275,308,958 |
Fidelity Series International
Value Fund | | |
Series International Value | | | |
Shares sold | 47,159,267 | 161,153,053 | $ 484,088,995 | $ 1,352,278,473 |
Reinvestment of distributions | 18,706,630 | 14,462,682 | 170,978,595 | 118,015,488 |
Shares redeemed | (110,968,953) | (141,961,766) | (1,082,752,825) | (1,195,927,164) |
Net increase (decrease) | (45,103,056) | 33,653,969 | $ (427,685,235) | $ 274,366,797 |
Class F | | | | |
Shares sold | 89,535,804 | 225,653,958 | $ 896,793,608 | $ 1,901,915,436 |
Reinvestment of distributions | 16,409,764 | 7,640,980 | 150,149,339 | 62,426,805 |
Shares redeemed | (52,596,433) | (12,312,893) | (517,783,907) | (102,571,800) |
Net increase (decrease) | 53,349,135 | 220,982,045 | $ 529,159,040 | $ 1,861,770,441 |
12. Other.
The Funds' organizational documents provide former and current trustees and officers with a limited indemnification against liabilities arising in connection with the performance of their duties to the Funds. In the normal course of business, the Funds may also enter into contracts that provide general indemnifications. The Funds' maximum exposure under these arrangements is unknown as this would be dependent on future claims that may be made against the Funds. The risk of material loss from such claims is considered remote.
At the end of the period, mutual funds managed by FMR or an FMR affiliate were the owners of record of all of the outstanding shares of the Funds.
Annual Report
To the Trustees of Fidelity Investment Trust and the Shareholders of Fidelity Series Emerging Markets Fund, Fidelity Series International Small Cap Fund and Fidelity Series International Value Fund:
We have audited the accompanying statements of assets and liabilities of Fidelity Series Emerging Markets Fund, Fidelity Series International Small Cap Fund and Fidelity Series International Value Fund (funds of Fidelity Investment Trust), including the schedules of investments, as of October 31, 2013, and the related statements of operations for the year then ended, the statements of changes in net assets for each of the two years in the period then ended, and the financial highlights for each of the periods presented. These financial statements and financial highlights are the responsibility of the Funds' management. Our responsibility is to express an opinion on these financial statements and financial highlights based on our audits.
We conducted our audits in accordance with the standards of the Public Company Accounting Oversight Board (United States). Those standards require that we plan and perform the audit to obtain reasonable assurance about whether the financial statements and financial highlights are free of material misstatement. The Funds are not required to have, nor were we engaged to perform, an audit of their internal control over financial reporting. Our audits included consideration of internal control over financial reporting as a basis for designing audit procedures that are appropriate in the circumstances, but not for the purpose of expressing an opinion on the effectiveness of the Funds' internal control over financial reporting. Accordingly, we express no such opinion. An audit also includes examining, on a test basis, evidence supporting the amounts and disclosures in the financial statements, assessing the accounting principles used and significant estimates made by management, as well as evaluating the overall financial statement presentation. Our procedures included confirmation of securities owned as of October 31, 2013, by correspondence with the custodians and brokers; where replies were not received from brokers, we performed other auditing procedures. We believe that our audits provide a reasonable basis for our opinion.
In our opinion, the financial statements and financial highlights referred to above present fairly, in all material respects, the financial position of Fidelity Series Emerging Markets Fund, Fidelity Series International Small Cap Fund and Fidelity Series International Value Fund as of October 31, 2013, the results of their operations for the year then ended, the changes in their net assets for each of the two years in the period then ended, and the financial highlights for each of the periods presented, in conformity with accounting principles generally accepted in the United States of America.
DELOITTE & TOUCHE LLP
Boston, Massachusetts
December 16, 2013
Annual Report
Report of Independent Registered Public Accounting Firm
To the Trustees of Fidelity Investment Trust and the Shareholders of Fidelity Series International Growth Fund:
In our opinion, the accompanying statement of assets and liabilities, including the schedule of investments, and the related statement of operations and of changes in net assets and the financial highlights present fairly, in all material respects, the financial position of Fidelity Series International Growth Fund (a fund of Fidelity Investment Trust) at October 31, 2013, the results of each of their operations for the year then ended, the changes in each of their net assets for each of the two years in the period then ended and the financial highlights for each of the periods indicated, in conformity with accounting principles generally accepted in the United States of America. These financial statements and financial highlights (hereafter referred to as "financial statements") are the responsibility of the Fidelity Series International Growth Fund's management. Our responsibility is to express an opinion on these financial statements based on our audit. We conducted our audits of these financial statements in accordance with the standards of the Public Company Accounting Oversight Board (United States). Those standards require that we plan and perform the audit to obtain reasonable assurance about whether the financial statements are free of material misstatement. An audit includes examining, on a test basis, evidence supporting the amounts and disclosures in the financial statements, assessing the accounting principles used and significant estimates made by management, and evaluating the overall financial statement presentation. We believe that our audits, which included confirmation of securities at October 31, 2013 by correspondence with the custodian and brokers, provide a reasonable basis for our opinion.
PricewaterhouseCoopers LLP
Boston, Massachusetts
December 16, 2013
Annual Report
The Trustees, Member of the Advisory Board, and executive officers of the trust and funds, as applicable, are listed below. The Board of Trustees governs each fund and is responsible for protecting the interests of shareholders. The Trustees are experienced executives who meet periodically throughout the year to oversee each fund's activities, review contractual arrangements with companies that provide services to each fund, oversee management of the risks associated with such activities and contractual arrangements, and review each fund's performance. Except for James C. Curvey, Ned C. Lautenbach, Ronald P. O'Hanley, and William S. Stavropoulos, each of the Trustees oversees 171 funds. Mr. Curvey oversees 394 funds. Mr. Lautenbach, Mr. O'Hanley, and Mr. Stavropoulos each oversees 245 funds.
The Trustees hold office without limit in time except that (a) any Trustee may resign; (b) any Trustee may be removed by written instrument, signed by at least two-thirds of the number of Trustees prior to such removal; (c) any Trustee who requests to be retired or who has become incapacitated by illness or injury may be retired by written instrument signed by a majority of the other Trustees; and (d) any Trustee may be removed at any special meeting of shareholders by a two-thirds vote of the outstanding voting securities of the trust. Each Trustee who is not an interested person of the trust and the funds (as defined in the 1940 Act) (Independent Trustee), shall retire not later than the last day of the calendar year in which his or her 75th birthday occurs. The Independent Trustees may waive this mandatory retirement age policy with respect to individual Trustees. The executive officers and Advisory Board Member hold office without limit in time, except that any officer and Advisory Board Member may resign or may be removed by a vote of a majority of the Trustees at any regular meeting or any special meeting of the Trustees. Except as indicated, each individual has held the office shown or other offices in the same company for the past five years.
Experience, Skills, Attributes, and Qualifications of the Funds' Trustees. The Governance and Nominating Committee has adopted a statement of policy that describes the experience, qualifications, attributes, and skills that are necessary and desirable for potential Independent Trustee candidates (Statement of Policy). The Board believes that each Trustee satisfied at the time he or she was initially elected or appointed a Trustee, and continues to satisfy, the standards contemplated by the Statement of Policy. The Governance and Nominating Committee also engages professional search firms to help identify potential Independent Trustee candidates who have the experience, qualifications, attributes, and skills consistent with the Statement of Policy. From time to time, additional criteria based on the composition and skills of the current Independent Trustees, as well as experience or skills that may be appropriate in light of future changes to board composition, business conditions, and regulatory or other developments, have also been considered by the professional search firms and the Governance and Nominating Committee. In addition, the Board takes into account the Trustees' commitment and participation in Board and committee meetings, as well as their leadership of standing and ad hoc committees throughout their tenure.
Annual Report
Trustees and Officers - continued
In determining that a particular Trustee was and continues to be qualified to serve as a Trustee, the Board has considered a variety of criteria, none of which, in isolation, was controlling. The Board believes that, collectively, the Trustees have balanced and diverse experience, qualifications, attributes, and skills, which allow the Board to operate effectively in governing each fund and protecting the interests of shareholders. Information about the specific experience, skills, attributes, and qualifications of each Trustee, which in each case led to the Board's conclusion that the Trustee should serve (or continue to serve) as a trustee of the funds, is provided below.
Board Structure and Oversight Function. James C. Curvey is an interested person (as defined in the 1940 Act) and currently serves as Chairman. The Trustees have determined that an interested Chairman is appropriate and benefits shareholders because an interested Chairman has a personal and professional stake in the quality and continuity of services provided to the funds. Independent Trustees exercise their informed business judgment to appoint an individual of their choosing to serve as Chairman, regardless of whether the Trustee happens to be independent or a member of management. The Independent Trustees have determined that they can act independently and effectively without having an Independent Trustee serve as Chairman and that a key structural component for assuring that they are in a position to do so is for the Independent Trustees to constitute a substantial majority for the Board. The Independent Trustees also regularly meet in executive session. Ned C. Lautenbach serves as Chairman of the Independent Trustees and as such (i) acts as a liaison between the Independent Trustees and management with respect to matters important to the Independent Trustees and (ii) with management prepares agendas for Board meetings.
Fidelity funds are overseen by different Boards of Trustees. The funds' Board oversees Fidelity's equity and high income funds and another Board oversees Fidelity's investment-grade bond, money market, and asset allocation funds. The asset allocation funds may invest in Fidelity funds overseen by the funds' Board. The use of separate Boards, each with its own committee structure, allows the Trustees of each group of Fidelity funds to focus on the unique issues of the funds they oversee, including common research, investment, and operational issues. On occasion, the separate Boards establish joint committees to address issues of overlapping consequences for the Fidelity funds overseen by each Board.
The Trustees operate using a system of committees to facilitate the timely and efficient consideration of all matters of importance to the Trustees, each fund, and fund shareholders and to facilitate compliance with legal and regulatory requirements and oversight of the funds' activities and associated risks. The Board, acting through its committees, has charged FMR and its affiliates with (i) identifying events or circumstances the occurrence of which could have demonstrably adverse effects on the funds' business and/or reputation; (ii) implementing processes and controls to lessen the possibility that such events or circumstances occur or to mitigate the effects of such events or circumstances if they do occur; and (iii) creating and maintaining a system designed to evaluate continuously business and market conditions in order to facilitate the identification and implementation processes described in (i) and (ii) above. Because the day-to-day operations and activities of the funds are carried out by or through FMR, its affiliates and other service providers, the funds' exposure to risks is mitigated but not eliminated by the processes overseen by the Trustees. While each of the Board's committees has responsibility for overseeing different aspects of the funds' activities, oversight is exercised primarily through the Operations, Audit, and Compliance Committees. In addition, the Independent Trustees have worked with FMR to enhance the Board's oversight of investment and financial risks, legal and regulatory risks, technology risks, and operational risks, including the development of additional risk reporting to the Board. For example, a working group comprised of Independent Trustees and FMR has worked and continues to work to review the Fidelity funds' valuation-related activities, reporting and risk management. Appropriate personnel, including but not limited to the funds' Chief Compliance Officer (CCO), FMR's internal auditor, the independent accountants, the funds' Treasurer and portfolio management personnel, make periodic reports to the Board's committees, as appropriate, including an annual review of FMR's risk management program for the Fidelity funds. The responsibilities of each standing committee, including their oversight responsibilities, are described further under "Standing Committees of the Funds' Trustees."
Annual Report
The funds' Statements of Additional Information (SAIs) include more information about the Trustees. To request a free copy, call Fidelity at 1-800-544-8544 for Fidelity Series Emerging Markets Fund, Fidelity Series International Growth Fund, Fidelity Series International Small Cap Fund, and Fidelity Series International Value Fund or 1-800-835-5092 for Class F.
Interested Trustees*:
Correspondence intended for each Trustee who is an interested person may be sent to Fidelity Investments, 245 Summer Street, Boston, Massachusetts 02210.
Name, Year of Birth; Principal Occupations and Other Relevant Experience+ |
James C. Curvey (1935) |
Year of Election or Appointment: 2007 Trustee Chairman of the Board of Trustees |
| Mr. Curvey also serves as Trustee of other Fidelity funds. Mr. Curvey is a Director of Fidelity Investments Money Management, Inc. (2009-present), Director of Fidelity Research & Analysis Co. (2009-present) and Director of FMR and FMR Co., Inc. (2007-present). Mr. Curvey is also Vice Chairman (2007-present) and Director of FMR LLC. In addition, Mr. Curvey serves as an Overseer for the Boston Symphony Orchestra and a member of the Trustees of Villanova University. Previously, Mr. Curvey was the Vice Chairman (2006-2007) and Director (2000-2007) of FMR Corp. |
Ronald P. O'Hanley (1957) |
Year of Election or Appointment: 2011 Trustee |
| Mr. O'Hanley also serves as Trustee of other Fidelity funds. He is Director of Fidelity SelectCo, LLC (2013-present), FMR Co., Inc. (2010-present), Director of Fidelity Investments Money Management, Inc. (2010-present), Director of Fidelity Research & Analysis Company (2010-present), President of Fidelity Asset Management and Corporate Services and a Member of Fidelity's Executive Committee (2010-present). Previously, Mr. O'Hanley served as President and Chief Executive Officer of BNY Mellon Asset Management (2007-2010). Mr. O'Hanley also served as Vice Chairman of Bank New York Mellon Corp. and a member of that firm's Executive Committee. Prior to the 2007 merger of The Bank of New York and Mellon Financial Corporation, he was Vice Chairman of Mellon Financial Corporation and President and Chief Executive Officer of Mellon Asset Management. He joined Mellon in February 1997. Mr. O'Hanley currently serves as Chairman of the Boston Public Library Foundation Board of Directors and sits on the Board of Directors of Beth Israel Deaconess Medical Center, the Board of Trustees of the Marine Biological Laboratory and the Advisory Board of the Maxwell School of Citizenship and Public Administration at Syracuse University. Mr. O'Hanley also chairs the Council on Asset Management for the Financial Services Roundtable and is a member of the Board of Directors of Institutional Investor's U.S. Institute. |
* Trustees have been determined to be "Interested Trustees" by virtue of, among other things, their affiliation with the trust or various entities under common control with FMR.
+ The information above includes each Trustee's principal occupation during the last five years and other information relating to the experience, attributes, and skills relevant to each Trustee's qualifications to serve as a Trustee, which led to the conclusion that each Trustee should serve as a Trustee for each fund.
Annual Report
Independent Trustees:
Correspondence intended for each Independent Trustee (that is, the Trustees other than the Interested Trustees) may be sent to Fidelity Investments, P.O. Box 55235, Boston, Massachusetts 02205-5235.
Name, Year of Birth; Principal Occupations and Other Relevant Experience+ |
Dennis J. Dirks (1948) |
Year of Election or Appointment: 2005 Trustee |
| Mr. Dirks also serves as Trustee of other Fidelity funds. Prior to his retirement in May 2003, Mr. Dirks was Chief Operating Officer and a member of the Board of The Depository Trust & Clearing Corporation (DTCC). He also served as President, Chief Operating Officer, and Board member of The Depository Trust Company (DTC) and President and Board member of the National Securities Clearing Corporation (NSCC). In addition, Mr. Dirks served as Chief Executive Officer and Board member of the Government Securities Clearing Corporation, Chief Executive Officer and Board member of the Mortgage-Backed Securities Clearing Corporation, as a Trustee and a member of the Finance Committee of Manhattan College (2005-2008), and as a Trustee and a member of the Finance Committee of AHRC of Nassau County (2006-2008). Mr. Dirks is a member of the Independent Directors Council (IDC) Governing Council (2010-present) and Board of Directors for The Brookville Center for Children's Services, Inc. (2009-present). |
Alan J. Lacy (1953) |
Year of Election or Appointment: 2008 Trustee |
| Mr. Lacy also serves as Trustee of other Fidelity funds. Mr. Lacy serves as Senior Adviser (2007-present) of Oak Hill Capital Partners, L.P. (private equity). Mr. Lacy also served as Chief Executive Officer (2000-2005) and Vice Chairman (2005-2006) of Sears Holdings Corporation and Sears, Roebuck and Co. (retail). In addition, Mr. Lacy serves as a member of the Board of Directors of Dave & Buster's Entertainment, Inc. (restaurant and entertainment complexes, 2010-present), Earth Fare, Inc. (retail grocery, 2012-present), The Hillman Companies, Inc. (hardware wholesalers, 2010-present), and Bristol-Myers Squibb Company (global pharmaceuticals, 2008-present). Mr. Lacy is a member of the Board of Trustees of The National Parks Conservation Association (2006-present). Previously, Mr. Lacy served as Chairman of the Board of Trustees of the National Parks Conservation Association (2008-2011) and as a member of the Board of Directors for the Western Union Company (global money transfer, 2006-2011). |
Ned C. Lautenbach (1944) |
Year of Election or Appointment: 2000 Trustee Chairman of the Independent Trustees |
| Mr. Lautenbach also serves as Trustee of other Fidelity funds. Mr. Lautenbach currently serves as the Lead Director of the Eaton Corporation Board of Directors (diversified industrial, 1997-present). Mr. Lautenbach is Chairman of the Board of Directors of the Philharmonic Center for the Arts in Naples, Florida (2012-present) and a member of the Council on Foreign Relations (1994-present). Previously, Mr. Lautenbach was a Partner/Advisory Partner at Clayton, Dubilier & Rice, LLC (private equity investment, 1998-2010), as well as a Director of Sony Corporation (2006-2007). |
Joseph Mauriello (1944) |
Year of Election or Appointment: 2008 Trustee |
| Mr. Mauriello also serves as Trustee of other Fidelity funds. Prior to his retirement in January 2006, Mr. Mauriello served in numerous senior management positions including Deputy Chairman and Chief Operating Officer (2004-2005), and Vice Chairman of Financial Services (2002-2004) of KPMG LLP US (professional services, 1965-2005). Mr. Mauriello currently serves as a member of the Board of Directors of XL Group plc. (global insurance and re-insurance, 2006-present). Previously, Mr. Mauriello served as a Director of the Hamilton Funds of the Bank of New York (2006-2007) and of Arcadia Resources Inc. (health care services and products, 2007-2012). |
Robert W. Selander (1950) |
Year of Election or Appointment: 2011 Trustee |
| Mr. Selander also serves as Trustee of other Fidelity funds. Previously, Mr. Selander served as a Member of the Advisory Board of other Fidelity funds (2011), and Executive Vice Chairman (2010), Chief Executive Officer (2009-2010), and President and Chief Executive Officer (1997-2009) of Mastercard, Inc. |
Cornelia M. Small (1944) |
Year of Election or Appointment: 2005 Trustee |
| Ms. Small also serves as Trustee of other Fidelity funds. Ms. Small is a member of the Board of Directors (2009-present) and Chair of the Investment Committee (2010-present) of the Teagle Foundation. Ms. Small also serves on the Investment Committee of the Berkshire Taconic Community Foundation (2008-present). Previously, Ms. Small served as Chairperson (2002-2008) and a member of the Investment Committee and Chairperson (2008-2012) and a member of the Board of Trustees of Smith College. In addition, Ms. Small served as Chief Investment Officer, Director of Global Equity Investments, and a member of the Board of Directors of Scudder, Stevens & Clark and Scudder Kemper Investments. |
William S. Stavropoulos (1939) |
Year of Election or Appointment: 2001 Trustee Vice Chairman of the Independent Trustees |
| Mr. Stavropoulos also serves as Trustee of other Fidelity funds. Mr. Stavropoulos serves as President and Founder of the Michigan Baseball Foundation, the Great Lakes Loons (2007-present). Mr. Stavropoulos is Chairman Emeritus of the Board of Directors of The Dow Chemical Company, where he previously served in numerous senior management positions, including President, CEO (1995-2000; 2002-2004), Chairman of the Executive Committee (2000-2006), and as a member of the Board of Directors (1990-2006). Currently, Mr. Stavropoulos is Chairman of the Board of Directors of Univar Inc. (global distributor of commodity and specialty chemicals), a Director of Teradata Corporation (data warehousing and technology solutions), and Maersk Inc. (industrial conglomerate), and a member of the Advisory Board for Metalmark Capital LLC (private equity investment, 2005-present). Mr. Stavropoulos is an operating advisor to Clayton, Dubilier & Rice, LLC (private equity investment). In addition, Mr. Stavropoulos is a member of the University of Notre Dame Advisory Council for the College of Science, a Trustee of the Rollin L. Gerstacker Foundation, and a Director of the Naples Philharmonic Center for the Arts. Previously, Mr. Stavropoulos served as a Director of Chemical Financial Corporation (bank holding company, 1993-2012) and Tyco International, Ltd. (multinational manufacturing and services, 2007-2012). |
David M. Thomas (1949) |
Year of Election or Appointment: 2008 Trustee |
| Mr. Thomas also serves as Trustee of other Fidelity funds. Mr. Thomas serves as Non-Executive Chairman of the Board of Directors of Fortune Brands Home and Security (home and security products, 2011-present), and as a member of the Board of Directors of Interpublic Group of Companies, Inc. (marketing communication, 2004-present). Previously, Mr. Thomas served as Executive Chairman (2005-2006) and Chairman and Chief Executive Officer (2000-2005) of IMS Health, Inc. (pharmaceutical and healthcare information solutions), and a Director of Fortune Brands, Inc. (consumer products, 2000-2011). |
+ The information above includes each Trustee's principal occupation during the last five years and other information relating to the experience, attributes, and skills relevant to each Trustee's qualifications to serve as a Trustee, which led to the conclusion that each Trustee should serve as a Trustee for each fund.
Advisory Board Member and Executive Officers:
Correspondence intended for each executive officer and Peter S. Lynch may be sent to Fidelity Investments, 245 Summer Street, Boston, Massachusetts 02210. Executive officers appear below in alphabetical order.
Name, Year of Birth; Principal Occupation |
Peter S. Lynch (1944) |
Year of Election or Appointment: 2003 Member of the Advisory Board |
| Mr. Lynch also serves as Member of the Advisory Board of other Fidelity funds. Mr. Lynch is Vice Chairman and a Director of FMR and FMR Co., Inc. In addition, Mr. Lynch serves as a Trustee of Boston College and as the Chairman of the Inner-City Scholarship Fund. Previously, Mr. Lynch served on the Special Olympics International Board of Directors (1997-2006). |
Elizabeth Paige Baumann (1968) |
Year of Election or Appointment: 2012 Anti-Money Laundering (AML) Officer |
| Ms. Baumann also serves as AML Officer of other funds. She is Chief AML Officer of FMR LLC (2012-present) and is an employee of Fidelity Investments. Previously, Ms. Baumann served as Vice President and Deputy Anti-Money Laundering Officer (2007-2012). |
William C. Coffey (1969) |
Year of Election or Appointment: 2009 Assistant Secretary |
| Mr. Coffey also serves as Assistant Secretary of other funds. He is Senior Vice President and Deputy General Counsel of FMR LLC (2010-present), and is an employee of Fidelity Investments. Previously, Mr. Coffey served as Vice President and Associate General Counsel of FMR LLC (2005-2009). |
Jonathan Davis (1968) |
Year of Election or Appointment: 2010 Assistant Treasurer |
| Mr. Davis also serves as Assistant Treasurer of other funds. Mr. Davis is an employee of Fidelity Investments. Previously, Mr. Davis served as Vice President and Associate General Counsel of FMR LLC (2003-2010). |
Adrien E. Deberghes (1967) |
Year of Election or Appointment: 2008 Deputy Treasurer |
| Mr. Deberghes also serves as an officer of other funds. He is an employee of Fidelity Investments (2008-present). Prior to joining Fidelity Investments, Mr. Deberghes was Senior Vice President of Mutual Fund Administration at State Street Corporation (2007-2008), Senior Director of Mutual Fund Administration at Investors Bank & Trust (2005-2007), and Director of Finance for Dunkin' Brands (2000-2005). |
Stephanie J. Dorsey (1969) |
Year of Election or Appointment: 2010 Assistant Treasurer |
| Ms. Dorsey also serves as an officer of other funds. She is an employee of Fidelity Investments (2008-present) and has served in other fund officer roles. Prior to joining Fidelity Investments, Ms. Dorsey served as Treasurer (2004-2008) of the JPMorgan Mutual Funds and Vice President (2004-2008) of JPMorgan Chase Bank. |
Scott C. Goebel (1968) |
Year of Election or Appointment: 2008 Secretary and Chief Legal Officer (CLO) |
| Mr. Goebel serves as Secretary and CLO of other funds. Mr. Goebel also serves as Secretary of Fidelity Investments Money Management, Inc. (FIMM) (2010-present) and Fidelity Research and Analysis Company (FRAC) (2010-present); General Counsel, Secretary, and Senior Vice President of FMR (2008-present) and FMR Co., Inc. (2008-present); Chief Legal Officer of Fidelity Management & Research (Hong Kong) Limited (2008-present) and Assistant Secretary of Fidelity Management & Research (Japan) Inc. (2008-present), and Fidelity Management & Research (U.K.) Inc. (2008-present). Previously, Mr. Goebel served as Secretary and CLO of other Fidelity funds (2008-2013), Assistant Secretary of FIMM (2008-2010), FRAC (2008-2010), and certain funds (2007-2008); and as Vice President and Secretary of Fidelity Distributors Corporation (FDC) (2005-2007). Mr. Goebel has been employed by FMR LLC or an affiliate since 2001. |
Joseph A. Hanlon (1968) |
Year of Election or Appointment: 2012 Chief Compliance Officer |
| Mr. Hanlon also serves as Chief Compliance Officer of other funds. Mr. Hanlon serves as Compliance Officer of FMR, FMR Co., Inc., Fidelity Investments Money Management, Inc. (FIMM), Fidelity Research and Analysis Company (FRAC), and Fidelity Management & Research (Hong Kong) (2009-present), as Senior Vice President of the Fidelity Asset Management Division (2009-present), and is an employee of Fidelity Investments. Previously, Mr. Hanlon served as Compliance Officer of Fidelity Management & Research (Japan) Inc. (2009-2013), Strategic Advisers, Inc. (2009-2013), and Fidelity Management & Research (U.K.) Inc. (2009-2013). |
Bruce T. Herring (1965) |
Year of Election or Appointment: 2006 Vice President of certain Equity Funds |
| Mr. Herring also serves as Vice President of other funds. He serves as Chief Investment Officer of Fidelity Global Asset Allocation (GAA) (2013-present), Chief Investment Officer and Director of Fidelity Management & Research (U.K.) Inc. (2010-present), Group Chief Investment Officer of FMR, and President of Fidelity Research & Analysis Company (2010-present). Previously, Mr. Herring served as Vice President (2005-2006) and Senior Vice President (2006-2007) of Fidelity Management & Research Company, Vice President of FMR Co., Inc. (2001-2007), and as a portfolio manager for Fidelity U.S. Equity Funds. |
Brian B. Hogan (1964) |
Year of Election or Appointment: 2009 Vice President |
| Mr. Hogan also serves as Vice President of other funds. Mr. Hogan serves as President of FMR's Equity Division (2009-present). Previously, Mr. Hogan served as Senior Vice President, Equity Research of FMR (2006-2009) and as a portfolio manager. |
Chris Maher (1972) |
Year of Election or Appointment: 2013 Assistant Treasurer |
| Mr. Maher serves as Assistant Treasurer of other funds. Mr. Maher is Vice President of Valuation Oversight and is an employee of Fidelity Investments. Previously, Mr. Maher served as Vice President of Asset Management Compliance (2013), Vice President of FMR's Program Management Group (2010-2013), and Vice President of Valuation Oversight (2008-2010). |
Christine Reynolds (1958) |
Year of Election or Appointment: 2008 Chief Financial Officer |
| Ms. Reynolds also serves as Chief Financial Officer of other funds. Ms. Reynolds became President of Fidelity Pricing and Cash Management Services (FPCMS) in August 2008. Ms. Reynolds served as Chief Operating Officer of FPCMS (2007-2008). Previously, Ms. Reynolds served as President, Treasurer, and Anti-Money Laundering officer of the Fidelity funds (2004-2007). |
Kenneth B. Robins (1969) |
Year of Election or Appointment: 2008 President and Treasurer |
| Mr. Robins also serves as an officer of other funds. Mr. Robins serves as Executive Vice President of Fidelity Investments Money Management, Inc. (FIMM) (2013-present) and is an employee of Fidelity Investments (2004-present). Previously, Mr. Robins served in other fund officer roles. |
Gary W. Ryan (1958) |
Year of Election or Appointment: 2005 Assistant Treasurer |
| Mr. Ryan also serves as Assistant Treasurer of other funds. Mr. Ryan is an employee of Fidelity Investments and has served in other fund officer roles. Previously, Mr. Ryan served as Vice President of Fund Reporting in Fidelity Pricing and Cash Management Services (FPCMS) (1999-2005). |
Stephen Sadoski (1971) |
Year of Election or Appointment: 2012 Deputy Treasurer |
| Mr. Sadoski also serves as Deputy Treasurer of other funds. He is an employee of Fidelity Investments (2012-present) and has served in another fund officer role. Prior to joining Fidelity Investments, Mr. Sadoski served as an assistant chief accountant in the Division of Investment Management of the Securities and Exchange Commission (SEC) (2009-2012) and as a senior manager at Deloitte & Touche LLP (1997-2009). |
Stacie M. Smith (1974) |
Year of Election or Appointment: 2013 Deputy Treasurer |
| Ms. Smith also serves as an officer of other funds. She is an employee of Fidelity Investments (2009-present) and has served in other fund officer roles. Prior to joining Fidelity Investments, Ms. Smith served as Senior Audit Manager of Ernst & Young LLP (1996-2009). |
Renee Stagnone (1975) |
Year of Election or Appointment: 2013 Deputy Treasurer |
| Ms. Stagnone also serves as Deputy Treasurer of other funds. Ms. Stagnone is an employee of Fidelity Investments. |
Joseph F. Zambello (1957) |
Year of Election or Appointment: 2011 Deputy Treasurer |
| Mr. Zambello also serves as Deputy Treasurer of other funds. Mr. Zambello is an employee of Fidelity Investments. Previously, Mr. Zambello served as Vice President of FMR's Program Management Group (2009-2011) and Vice President of the Transfer Agent Oversight Group (2005-2009). |
Annual Report
The Board of Trustees of each fund voted to pay to shareholders of record at the opening of business on record date, the following distributions per share derived from capital gains realized from sales of portfolio securities, and dividends derived from net investment income:
Fund | Pay Date | Record Date | Dividends | Capital Gains |
Series Emerging Markets Fund | 12/09/13 | 12/06/13 | $0.166 | $0.006 |
Class F | 12/09/13 | 12/06/13 | $0.192 | $0.006 |
Series International Growth Fund | 12/09/13 | 12/06/13 | $0.097 | $0.050 |
Class F | 12/09/13 | 12/06/13 | $0.117 | $0.050 |
Series International Small Cap Fund | 12/09/13 | 12/06/13 | $0.126 | $0.441 |
Class F | 12/09/13 | 12/06/13 | $0.145 | $0.441 |
Series International Value Fund | 12/09/13 | 12/06/13 | $0.237 | $0.036 |
Class F | 12/09/13 | 12/06/13 | $0.254 | $0.036 |
The funds hereby designate as capital gain dividend the amounts noted below for the taxable year ended October 31, 2013, or, if subsequently determined to be different, the net capital gain of such year.
Fund | |
Series International Growth Fund | $45,103,094 |
Series International Small Cap Fund | $66,526,090 |
A percentage of the dividends distributed during the fiscal year for the following funds qualifies for the dividends-received deduction for corporate shareholders.
Fund | December 07, 2012 |
Series Emerging Markets Fund | 0% |
Class F | 0% |
Series International Growth Fund | 12% |
Class F | 10% |
Series International Small Cap Fund | 8% |
Class F | 7% |
Series International Value Fund | 0% |
Class F | 0% |
Annual Report
A percentage of the dividends distributed during the fiscal year for the following funds may be taken into account as a dividend for purposes of the maximum rate under section 1(h)(11) of the Internal Revenue Code.
Fund | December 07, 2012 |
Series Emerging Markets Fund | 100% |
Class F | 98% |
Series International Growth Fund | 100% |
Class F | 100% |
Series International Small Cap Fund | 100% |
Class F | 100% |
Series International Value Fund | 63% |
Class F | 59% |
The amounts per share which represent income derived from sources within, and taxes paid to, foreign countries or possessions of the United States are as follows:
Fund | Pay Date | Income | Taxes |
Series Emerging Markets Fund | 12/10/12 | $0.197 | $0.0379 |
Class F | 12/10/12 | $0.221 | $0.0379 |
Series International Growth Fund | 12/10/12 | $0.101 | $0.0108 |
Class F | 12/10/12 | $0.112 | $0.0108 |
Series International Small Cap Fund | 12/10/12 | $0.110 | $0.0133 |
Class F | 12/10/12 | $0.131 | $0.0133 |
Series International Value Fund | 12/10/12 | $0.206 | $0.0080 |
Class F | 12/10/12 | $0.217 | $0.0080 |
The fund will notify shareholders in January 2014 of amounts for use in preparing 2013 income tax returns.
Annual Report
Board Approval of Investment Advisory Contracts and Management Fees
Fidelity Series Emerging Markets Fund
Fidelity Series International Growth Fund
Fidelity Series International Small Cap Fund
Fidelity Series International Value Fund
Each year, the Board of Trustees, including the Independent Trustees (together, the Board), votes on the renewal of the management contract and sub-advisory agreements (together, the Advisory Contracts) for each fund. The Board, assisted by the advice of fund counsel and Independent Trustees' counsel, requests and considers a broad range of information relevant to the renewal of the Advisory Contracts throughout the year.
The Board meets regularly and, at each of its meetings, covers an extensive agenda of topics and materials and considers factors that are relevant to its annual consideration of the renewal of each fund's Advisory Contracts, including the services and support provided to each fund and its shareholders. The Board has established various standing committees, each composed of and chaired by Independent Trustees with varying backgrounds, to which the Board has assigned specific subject matter responsibilities in order to enhance effective decision-making by the Board. The Board, acting directly and through its Committees, requests and receives information concerning the annual consideration of the renewal of each fund's Advisory Contracts. The Board also meets as needed to consider matters specifically related to the Board's annual consideration of the renewal of Advisory Contracts. Members of the Board may also meet with trustees of other Fidelity funds through ad hoc joint committees to discuss certain matters relevant to the Fidelity funds.
At its July 2013 meeting, the Board, including the Independent Trustees, unanimously determined to renew each fund's Advisory Contracts. In reaching its determination, the Board considered all factors it believed relevant, including (i) the nature, extent, and quality of the services to be provided to each fund and its shareholders (including the investment performance of each fund); (ii) the competitiveness of each fund's management fee and total expense ratio relative to peer funds; (iii) the total costs of the services to be provided by and the profits to be realized by Fidelity from its relationship with each fund; (iv) the extent to which economies of scale exist and would be realized as each fund grows; and (v) whether fee levels reflect these economies of scale, if any, for the benefit of fund shareholders.
In considering whether to renew the Advisory Contracts for each fund, the Board reached a determination, with the assistance of fund counsel and Independent Trustees' counsel and through the exercise of its business judgment, that the renewal of the Advisory Contracts was in the best interests of each fund and its shareholders and that the compensation payable under the Advisory Contracts was fair and reasonable. The Board's decision to renew the Advisory Contracts was not based on any single factor, but rather was based on a comprehensive consideration of all the information provided to the Board at its meetings throughout the year. The Board, in reaching its determination to renew the Advisory Contracts, was aware that shareholders in each fund have a broad range of investment choices available to them, including a wide choice among mutual funds offered by Fidelity's competitors, and that each fund's shareholders, who have the opportunity to review and weigh the disclosure provided by the fund in its prospectus and other public disclosures, have chosen to invest in that fund, which is a part of the Fidelity family of funds.
Annual Report
Nature, Extent, and Quality of Services Provided. The Board considered the staffing within the investment adviser, Fidelity Management & Research Company (FMR), and the sub-advisers (together, the Investment Advisers) as it relates to the funds, including the backgrounds of the funds' investment personnel, and also considered the funds' investment objectives, strategies, and related investment philosophies. The Independent Trustees also had discussions with senior management of Fidelity's investment operations and investment groups. The Board considered the structure of the portfolio manager compensation program and whether this structure provides appropriate incentives to act in the best interests of each fund.
Resources Dedicated to Investment Management and Support Services. The Board and the Fund Oversight and Research Committees reviewed the general qualifications and capabilities of the Investment Advisers' investment staff, including its size, education, experience, and resources, as well as the Investment Advisers' approach to recruiting, training, managing, and compensating investment personnel. The Board noted that FMR has continued to increase the resources devoted to non-U.S. offices, including expansion of Fidelity's global investment organization. The Board also noted that Fidelity's analysts have extensive resources, tools and capabilities that allow them to conduct sophisticated quantitative and fundamental analysis, as well as credit analysis of issuers, counterparties and guarantors. Further, the Board believes that Fidelity's investment professionals have sufficient access to global information and data so as to provide competitive investment results over time, and that those professionals also have access to sophisticated tools that permit them to assess portfolio construction and risk and performance attribution characteristics continuously, as well as to transmit new information and research conclusions rapidly around the world. Additionally, in its deliberations, the Board considered the Investment Advisers' trading and risk management capabilities and resources, which are an integral part of the investment management process.
Shareholder and Administrative Services. The Board considered (i) the nature, extent, quality, and cost of advisory, administrative, and shareholder services performed by the Investment Advisers and their affiliates under the Advisory Contracts and under separate agreements covering transfer agency, pricing and bookkeeping, and securities lending services for each fund; (ii) the nature and extent of the supervision of third party service providers, principally custodians and subcustodians; and (iii) the resources devoted to, and the record of compliance with, each fund's compliance policies and procedures. The Board also reviewed the allocation of fund brokerage, including allocations to brokers affiliated with the Investment Advisers, the use of brokerage commissions to pay fund expenses, and the use of "soft" commission dollars to pay for research services.
Annual Report
Board Approval of Investment Advisory Contracts and
Management Fees - continued
The Board noted that the growth of fund assets over time across the complex allows Fidelity to reinvest in the development of services designed to enhance the value or convenience of the Fidelity funds as investment vehicles. These services include 24-hour access to account information and market information through telephone representatives and over the Internet, investor education materials and asset allocation tools, and the expanded availability of Fidelity Investor Centers.
Investment in a Large Fund Family. The Board considered the benefits to shareholders of investing in a Fidelity fund, including the benefits of investing in a fund that is part of a large family of funds offering a variety of investment disciplines and providing a large variety of mutual fund investor services. The Board noted that Fidelity had taken, or had made recommendations that resulted in the Fidelity funds taking, a number of actions over the previous year that benefited particular funds, including (i) continuing to dedicate additional resources to investment research and to the support of the senior management team that oversees asset management; (ii) persisting in efforts to enhance Fidelity's global research capabilities; (iii) launching new funds and making other enhancements to meet client needs for global and income-oriented solutions; (iv) continuing to launch dedicated lower cost underlying funds to meet portfolio construction needs related to expanding underlying fund options for Fidelity funds of funds, specifically for the Freedom Fund product lines; (v) rationalizing product lines and gaining increased efficiencies through the mergers of several funds into other funds; (vi) strengthening Fidelity's index fund offerings by reducing investment minimums and adopting or lowering existing expense caps for certain funds and classes; (vii) enhancing Global Asset Allocation product offerings by launching new funds and strategies, including "open architecture" target date funds that utilize affiliated and unaffiliated sub-advisers; (viii) modifying the eligibility criteria for Institutional Class shares of Advisor funds to increase their marketability to a portion of the defined contribution plan market; (ix) creating a new low-cost retirement share class for certain Advisor funds to appeal to large retirement plans; (x) transitioning the management of certain Fidelity commodity funds to Geode Capital Management LLC, a registered commodity pool operator, while retaining administrative responsibilities for the funds; (xi) reorganizing a number of funds; and (xii) taking steps toward establishing a new Fidelity adviser to manage sector-based funds and products.
Investment Performance. The Board considered whether each fund has operated in accordance with its investment objective, as well as its record of compliance with its investment restrictions and its performance history. The Board noted that there was a portfolio management change for a sleeve of Fidelity Series Emerging Markets Fund in July 2010 and for a sleeve of Fidelity Series International Value Fund in September 2011.
Annual Report
The Board took into account discussions with the Investment Advisers about fund investment performance that occur at Board meetings throughout the year. In this regard the Board noted that as part of regularly scheduled fund reviews and other reports to the Board on fund performance, the Board periodically considers annualized return information for each fund, for different time periods, measured against a securities market index ("benchmark index") and a peer group of mutual funds with similar objectives ("peer group"). In its evaluation of fund investment performance, the Board gave particular attention to information indicating changes in performance of certain Fidelity funds for specific time periods and the Investment Advisers' explanations for any overperformance or underperformance.
In addition to reviewing absolute and relative fund performance, the Independent Trustees periodically consider the appropriateness of fund performance metrics in evaluating the results achieved. In general, the Independent Trustees believe that fund performance should be evaluated based on net performance (after fees and expenses) of both the highest performing and lowest performing classes, where applicable, compared to appropriate benchmark indices, over appropriate time periods which may include full market cycles, and compared to peer groups, as applicable, over the same periods, taking into account relevant factors including the following: general market conditions; issuer-specific information; tactical opportunities for investment; and fund cash flows and other factors.
The Independent Trustees recognize that shareholders evaluate performance on a net basis over their own holding periods, for which one-, three-, and five-year periods are used as a proxy. For this reason, the performance information reviewed by the Board also included net cumulative calendar year total return information for each fund and an appropriate benchmark index and peer group for the most recent one- and three-year periods, as shown below. Returns are shown compared to the 25th percentile (top of box) and 75th percentile (bottom of box) of the peer universe. For each fund (except Fidelity Series Emerging Markets Fund), returns of the benchmark index are "net MA," i.e., adjusted for tax withholding rates applicable to U.S.-based mutual funds organized as Massachusetts business trusts.
Annual Report
Board Approval of Investment Advisory Contracts and
Management Fees - continued
Fidelity Series Emerging Markets Fund
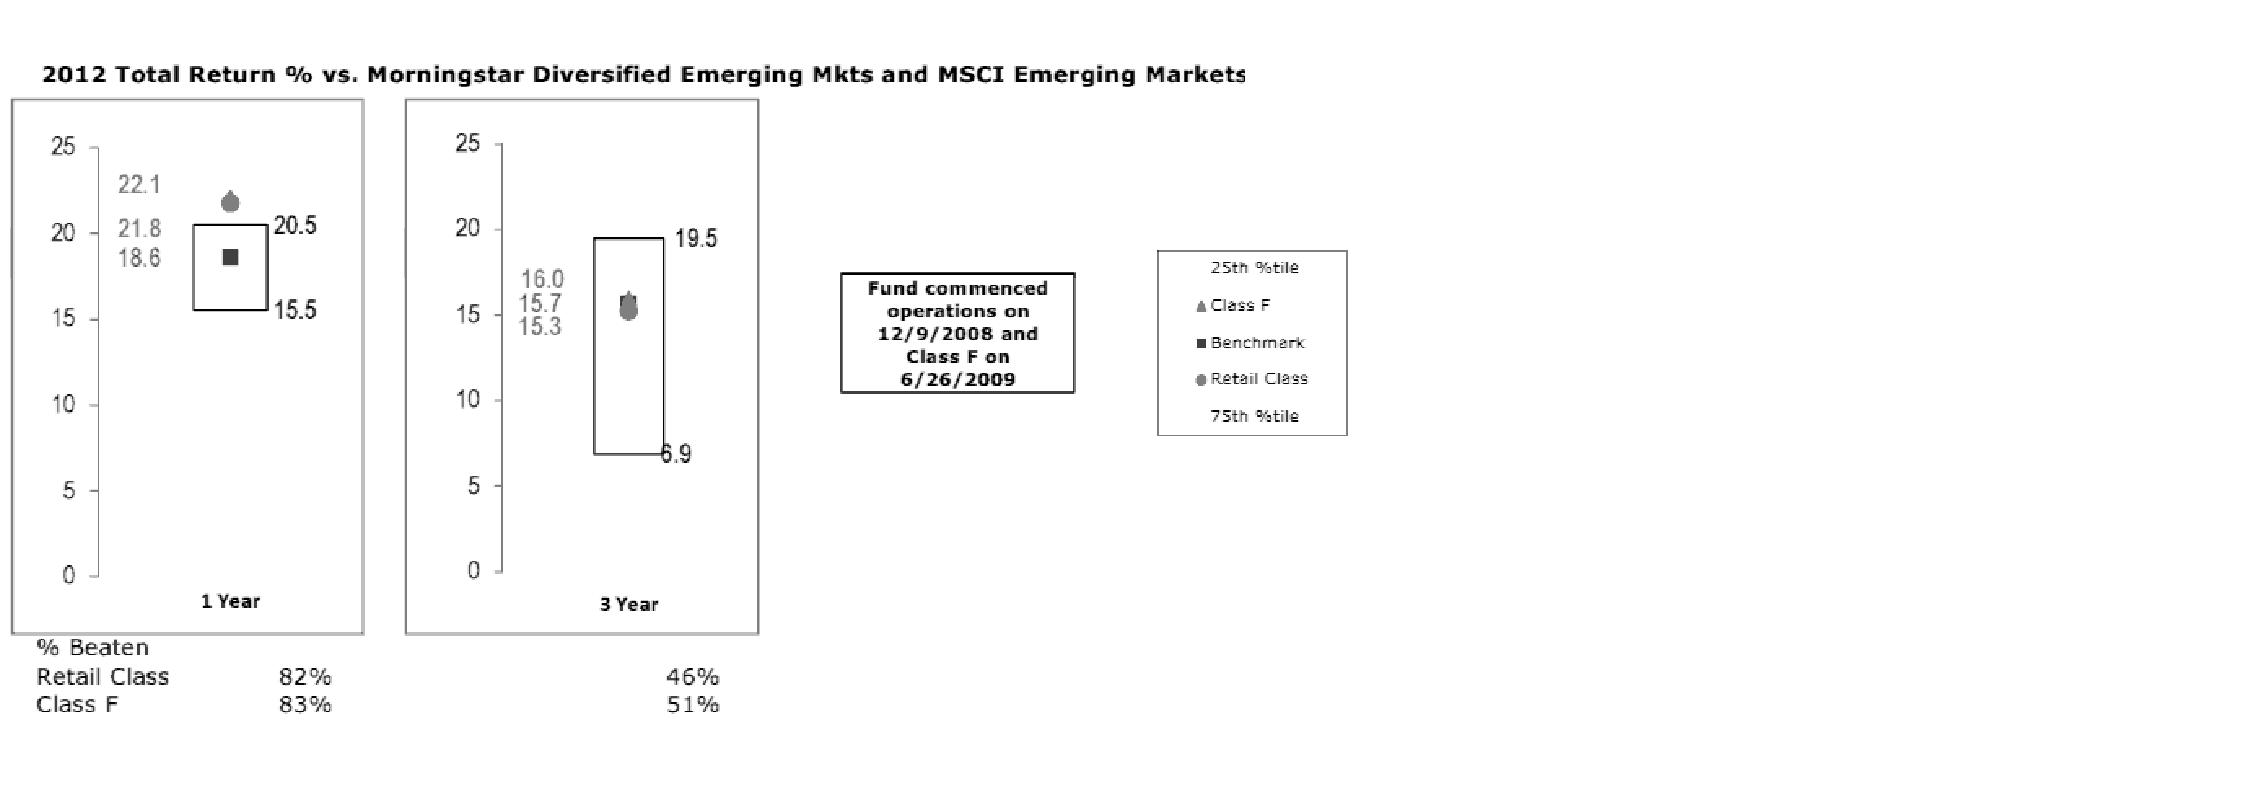
Fidelity Series International Growth Fund
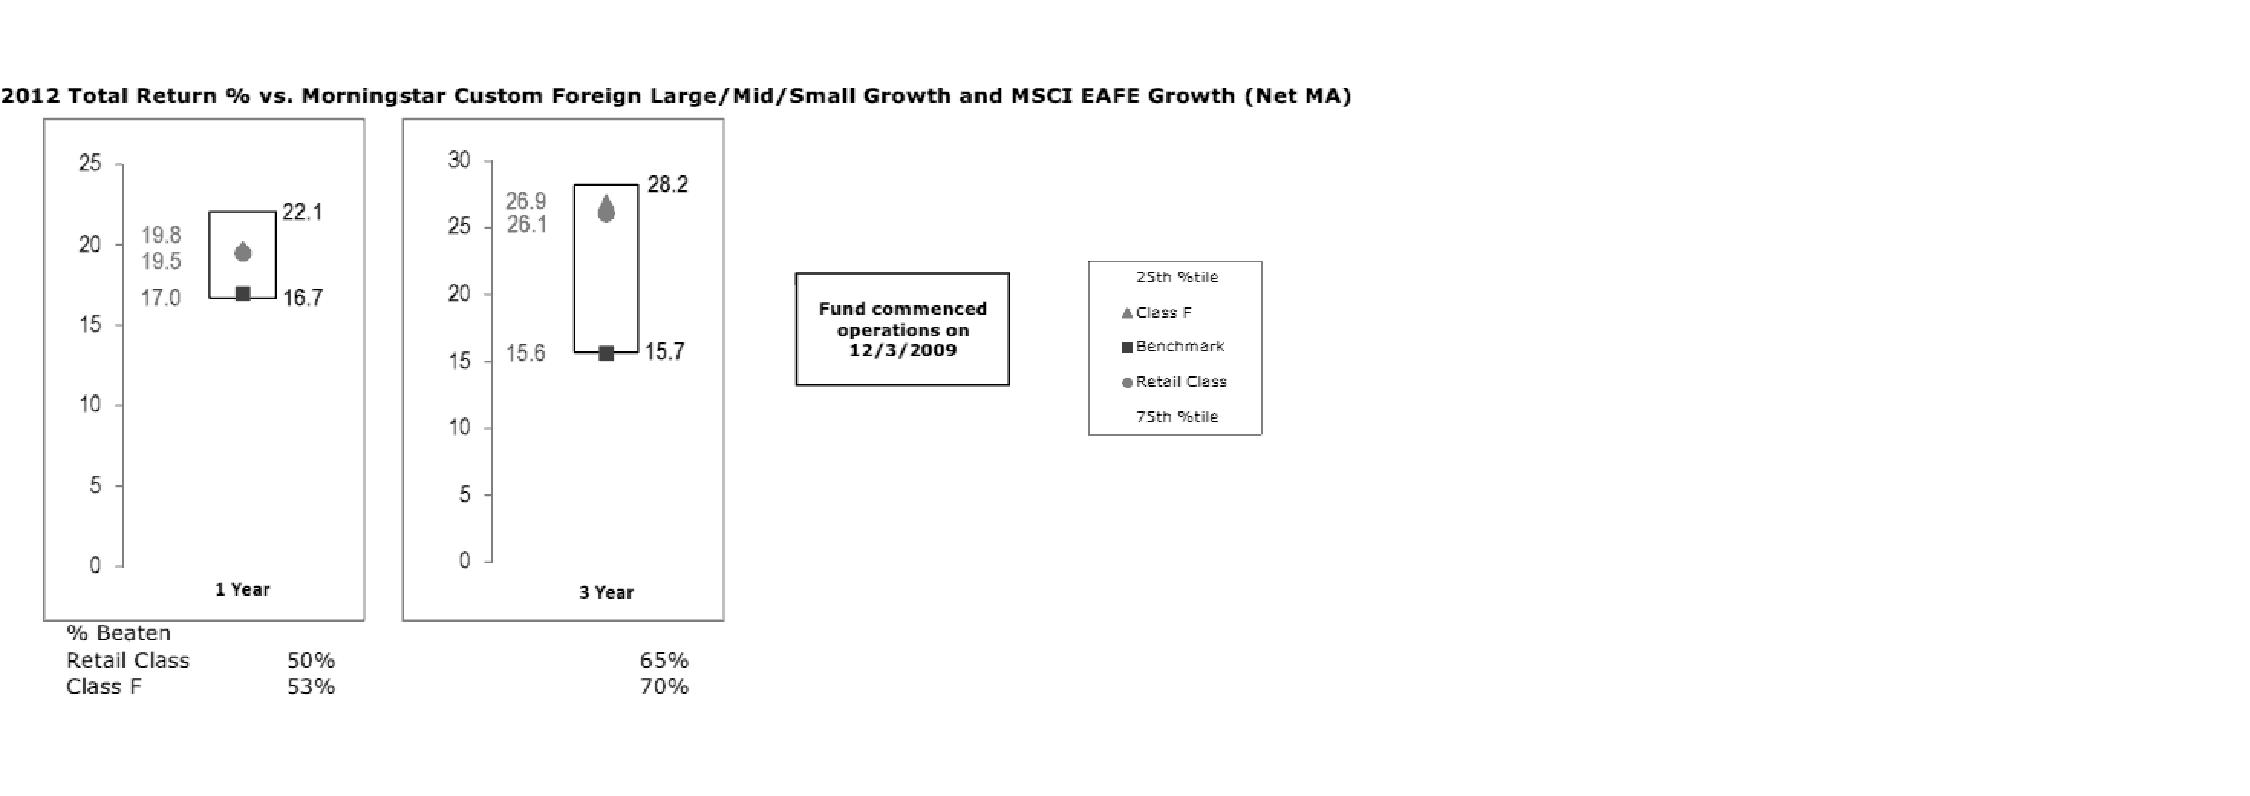
Annual Report
Fidelity Series International Small Cap Fund
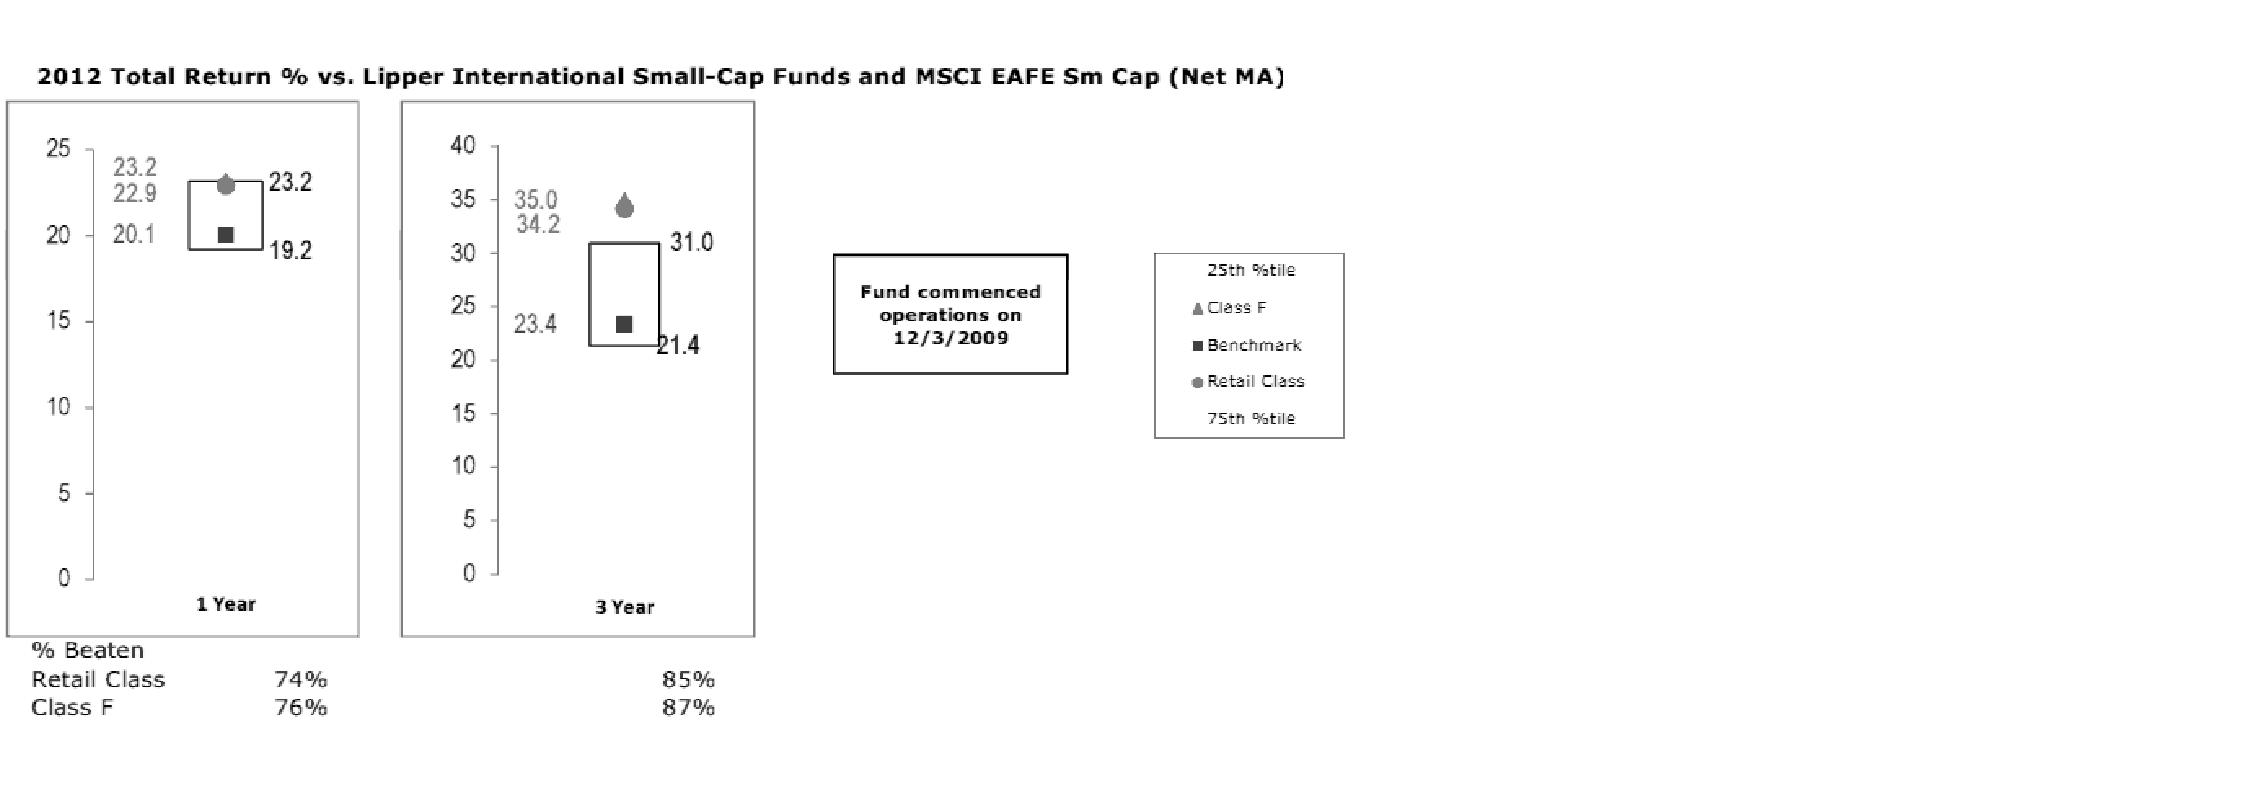
Fidelity Series International Value Fund
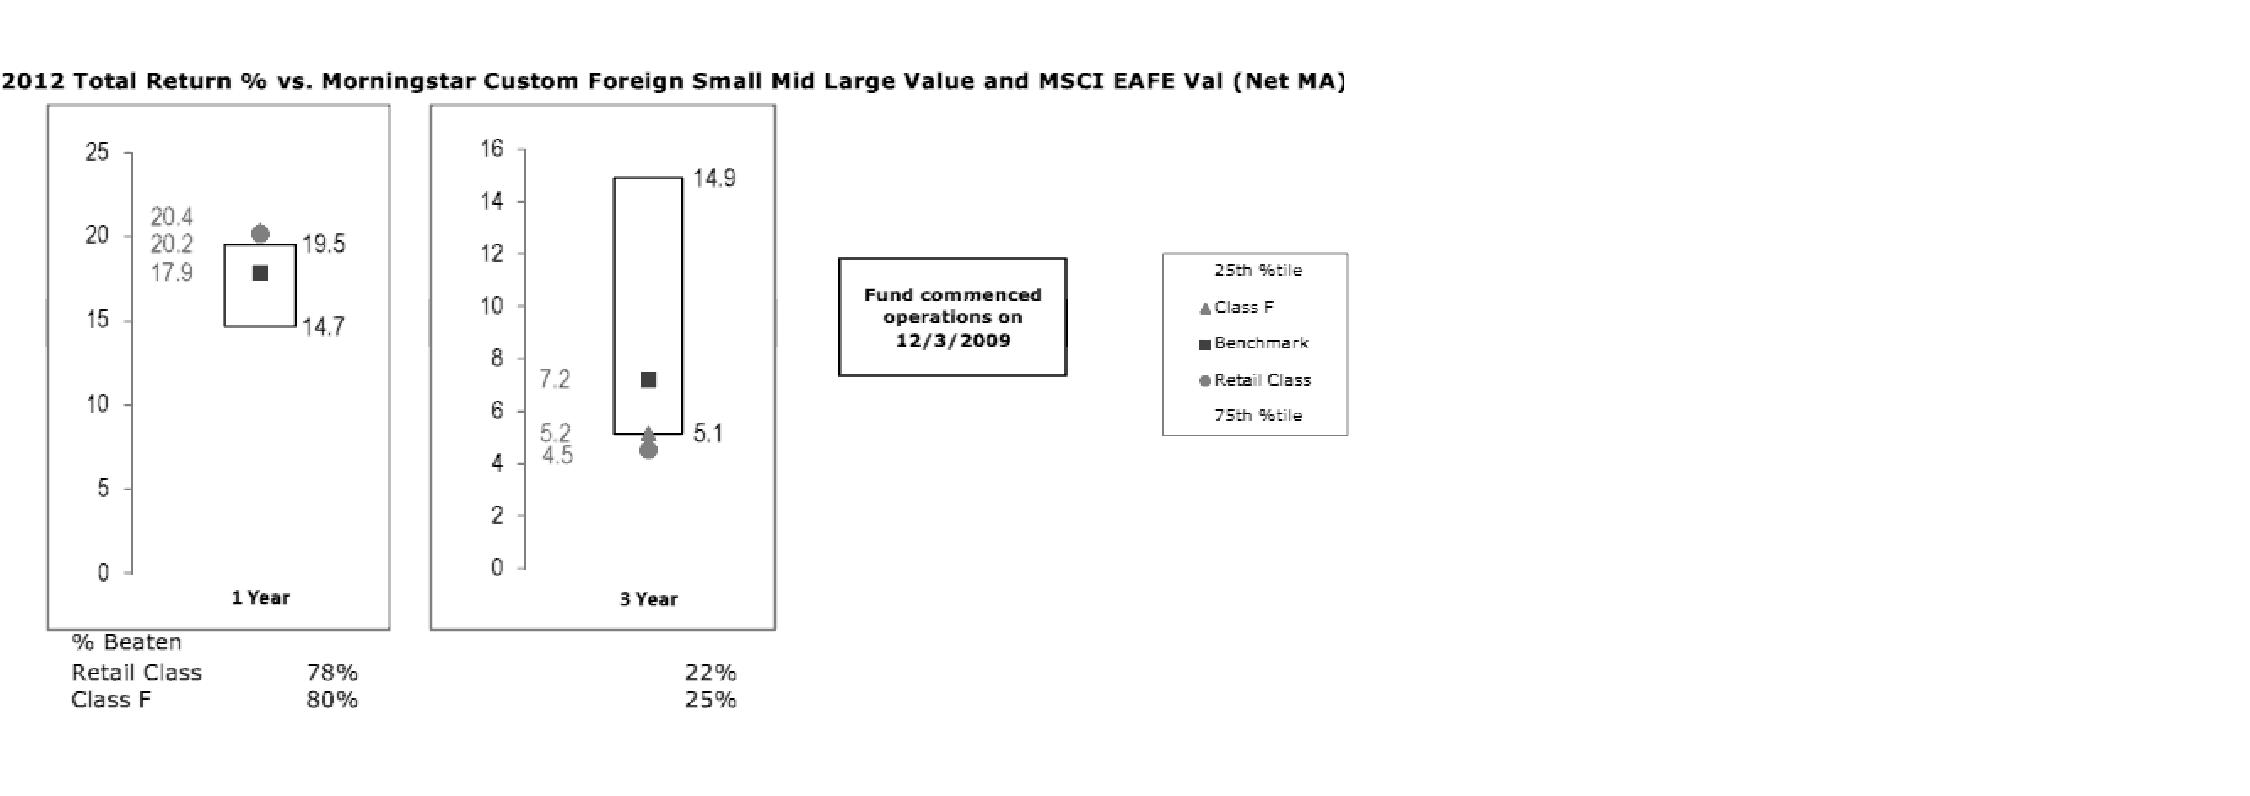
The Board also considered that each of Fidelity Series International Growth Fund's, Fidelity Series International Small Cap Fund's, and Fidelity Series International Value Fund's management fee is subject to upward or downward adjustment depending upon whether, and to what extent, the fund's investment performance for the performance period exceeds, or is exceeded by, a securities index, thus leading to a performance adjustment for the same period. The Board noted that the performance adjustment provides FMR with a strong economic incentive to seek to achieve superior performance for each fund's shareholders and helps to more closely align the interests of FMR and each fund's shareholders.
Annual Report
Board Approval of Investment Advisory Contracts and
Management Fees - continued
Based on its review, the Board concluded that the nature, extent, and quality of services provided to each fund under the Advisory Contracts should benefit each fund's shareholders.
Competitiveness of Management Fee and Total Expense Ratio. The Board considered each fund's management fee and total expense ratio compared to "mapped groups" of competitive funds and classes. Fidelity creates "mapped groups" by combining similar Lipper investment objective categories that have comparable management fee characteristics. Combining Lipper investment objective categories aids the Board's management fee and total expense ratio comparisons by broadening the competitive group used for comparison and by reducing the number of universes to which various Fidelity funds are compared.
Management Fee. The Board considered two proprietary management fee comparisons for the 12-month (or shorter) periods shown in the charts below. The group of Lipper funds used by the Board for management fee comparisons is referred to below as the "Total Mapped Group." For Fidelity Series International Small Cap Fund, the Total Mapped Group is broader than the Lipper peer group used by the Board for performance comparisons because the Total Mapped Group combines several Lipper investment objective categories while the Lipper peer group does not. The Total Mapped Group comparison focuses on a fund's standing in terms of gross management fees before expense reimbursements or caps, and without giving effect to the fund's performance adjustment (if applicable), relative to the total universe of funds with comparable investment mandates, regardless of whether their management fee structures also are comparable. Funds with comparable investment mandates offer exposure to similar types of securities. Funds with comparable management fee structures have similar management fee contractual arrangements (e.g., flat rate charged for advisory services, all-inclusive fee rate, etc.). "TMG %" represents the percentage of funds in the Total Mapped Group that had management fees that were lower than a fund's. For example, a TMG % of 19% would mean that 81% of the funds in the Total Mapped Group had higher management fees than a fund. The "Asset-Size Peer Group" (ASPG) comparison focuses on a fund's standing relative to a subset of non-Fidelity funds within the Total Mapped Group that are similar in size and management fee structure. The ASPG represents at least 15% of the funds in the Total Mapped Group with comparable asset size and management fee structures, subject to a minimum of 50 funds (or all funds in the Total Mapped Group if fewer than 50). Additional information, such as the ASPG quartile in which a fund's management fee ranked and the impact of a fund's performance adjustment (if applicable), is also included in the charts and considered by the Board.
Annual Report
Fidelity Series Emerging Markets Fund
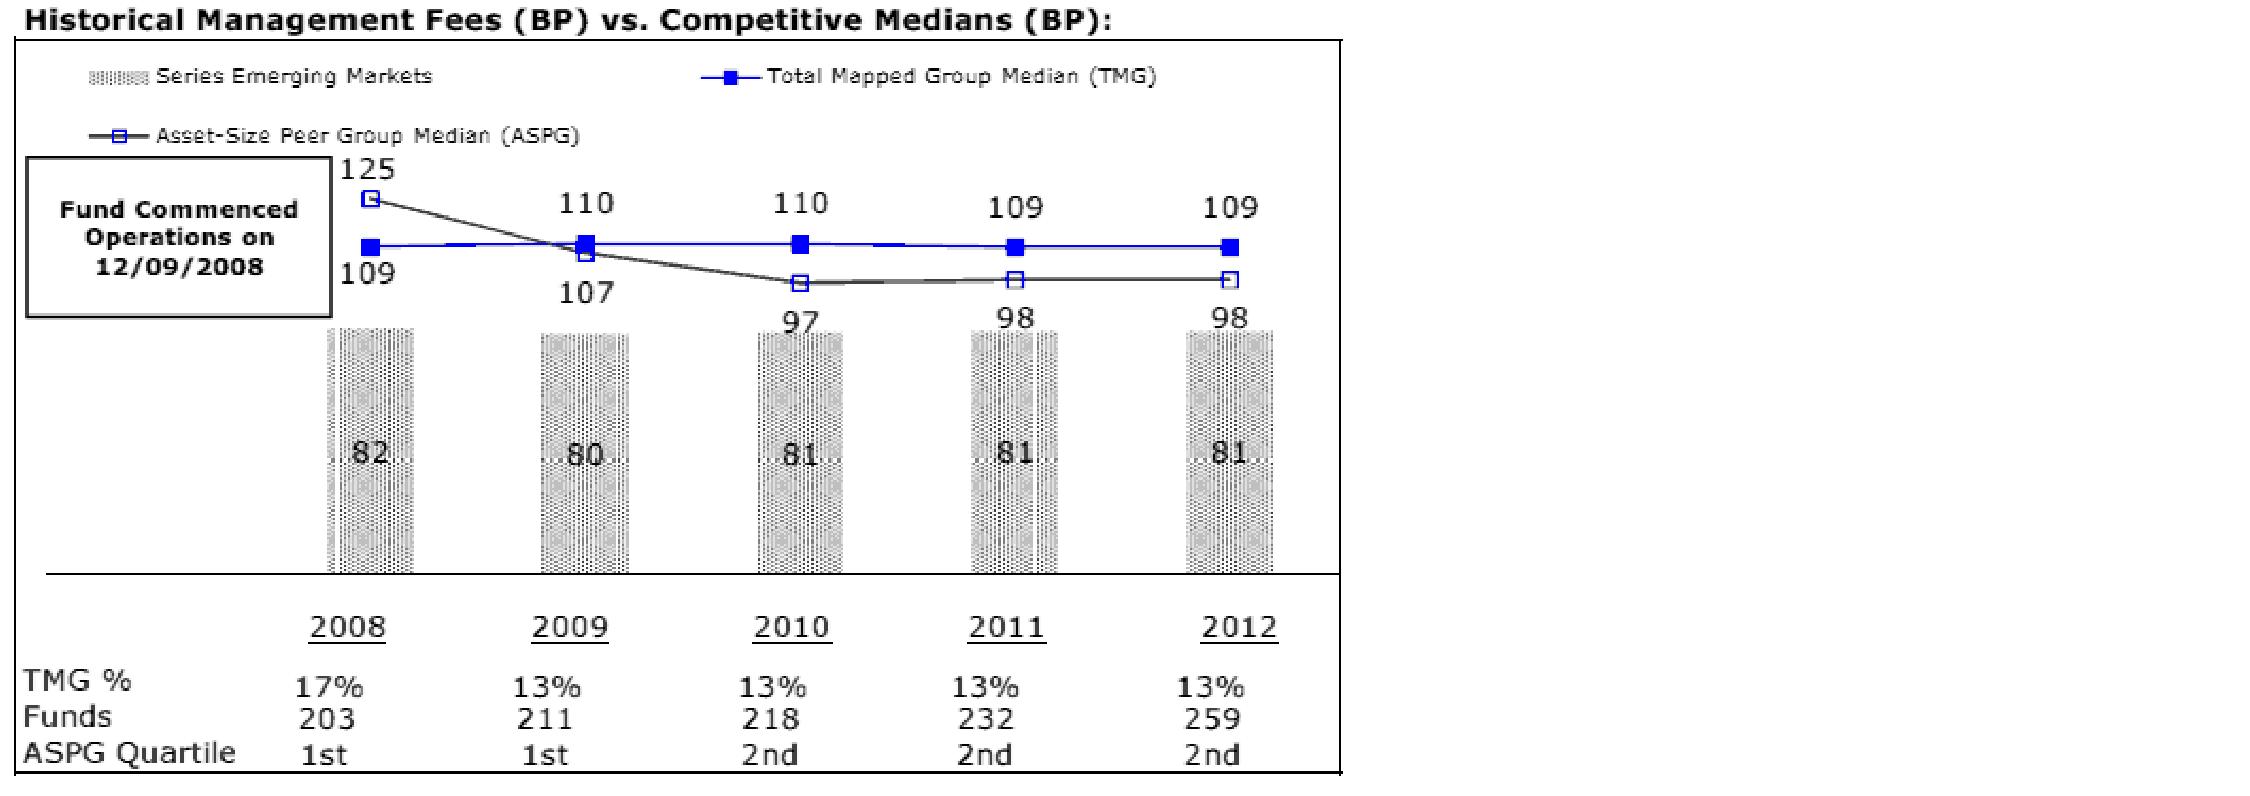
Fidelity Series International Growth Fund
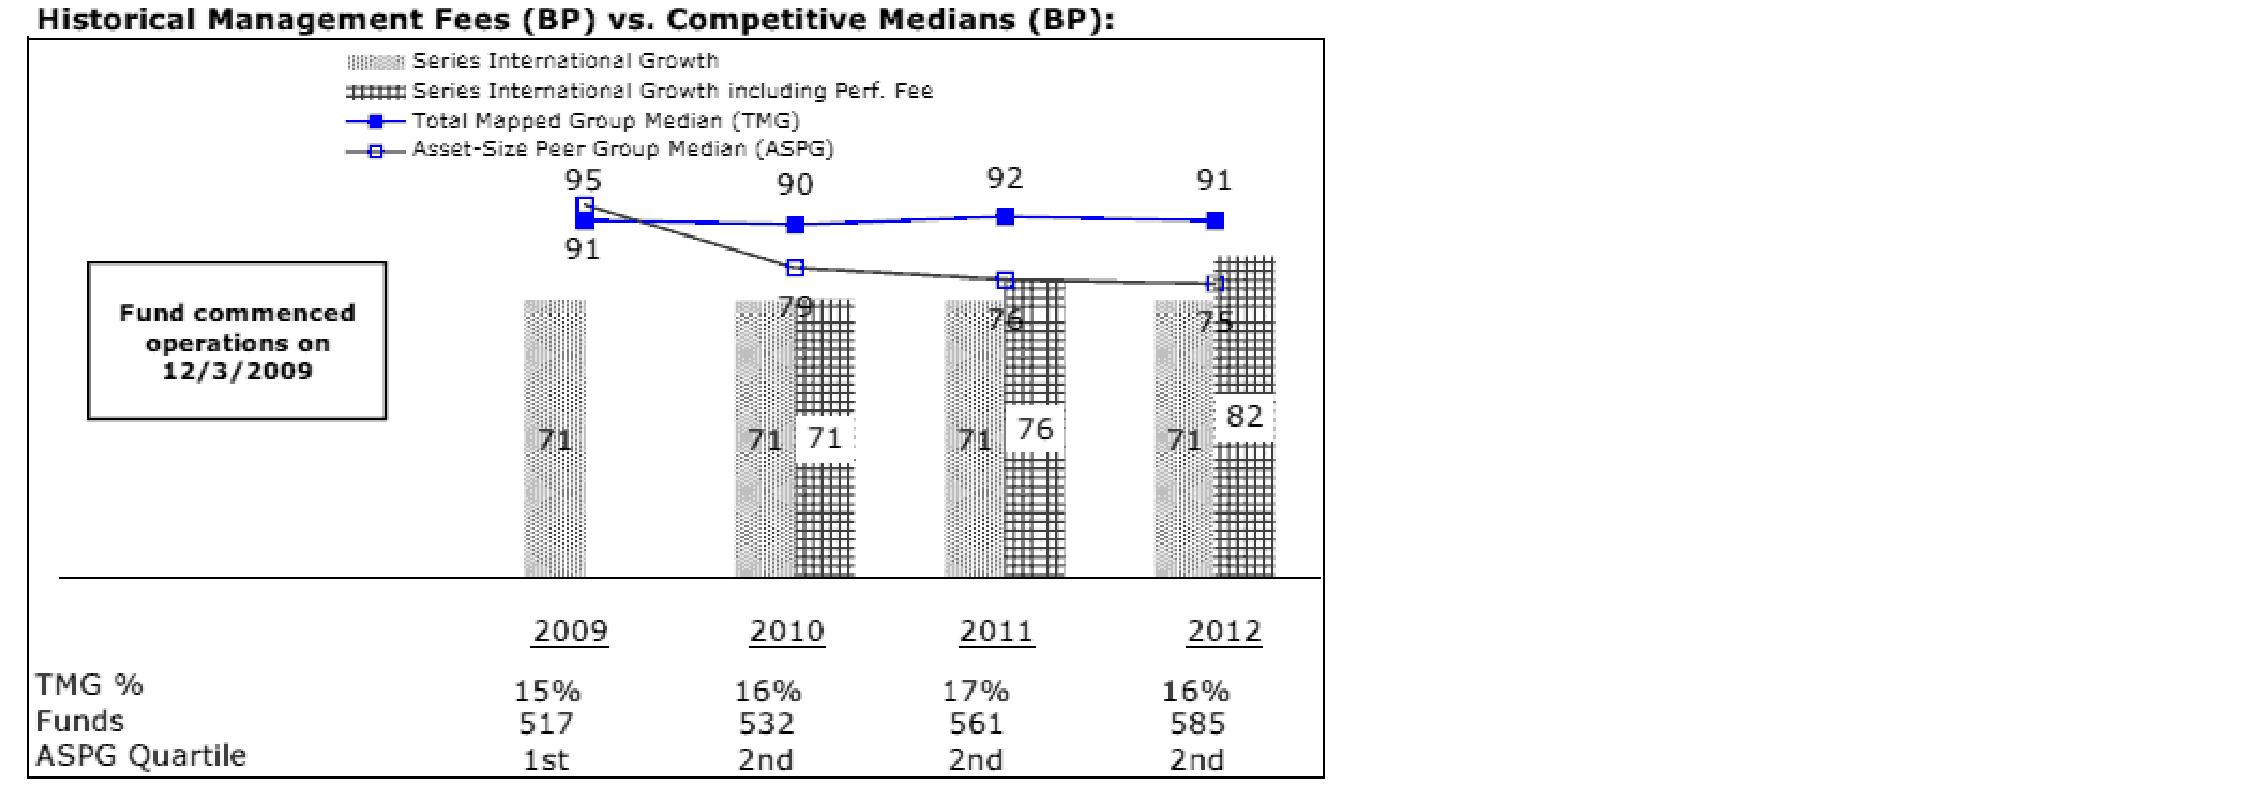
Annual Report
Board Approval of Investment Advisory Contracts and
Management Fees - continued
Fidelity Series International Small Cap Fund
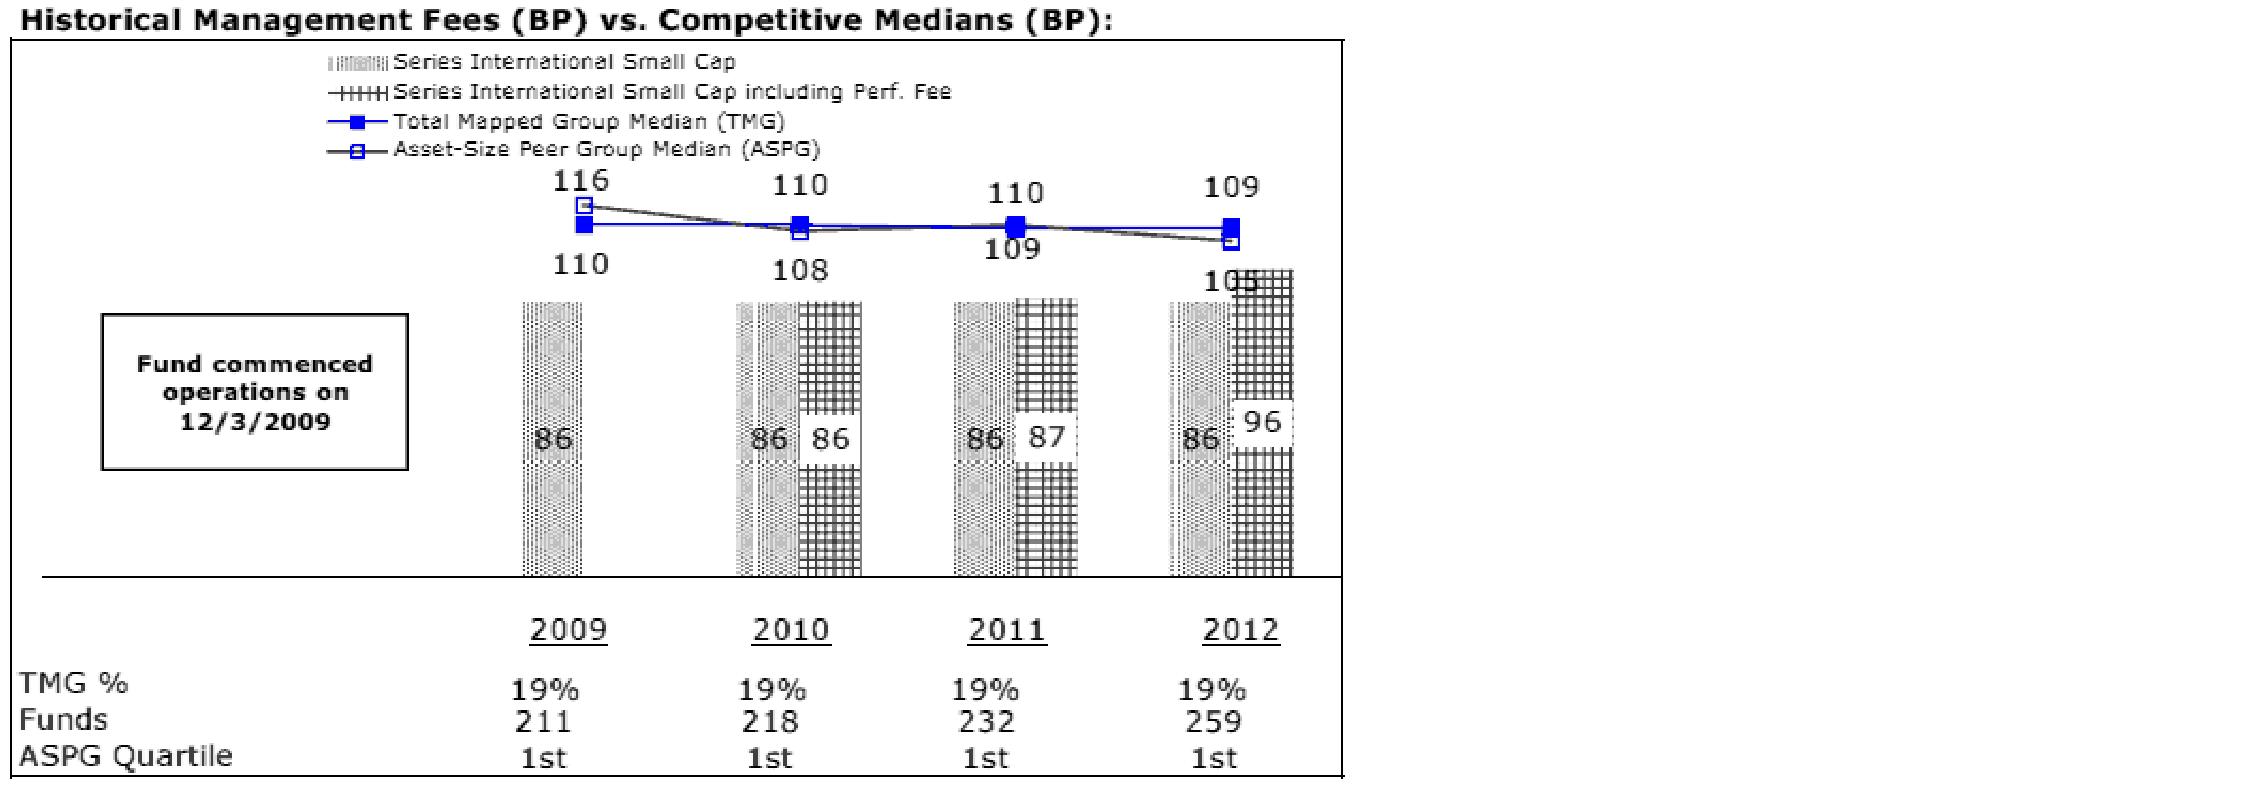
Fidelity Series International Value Fund
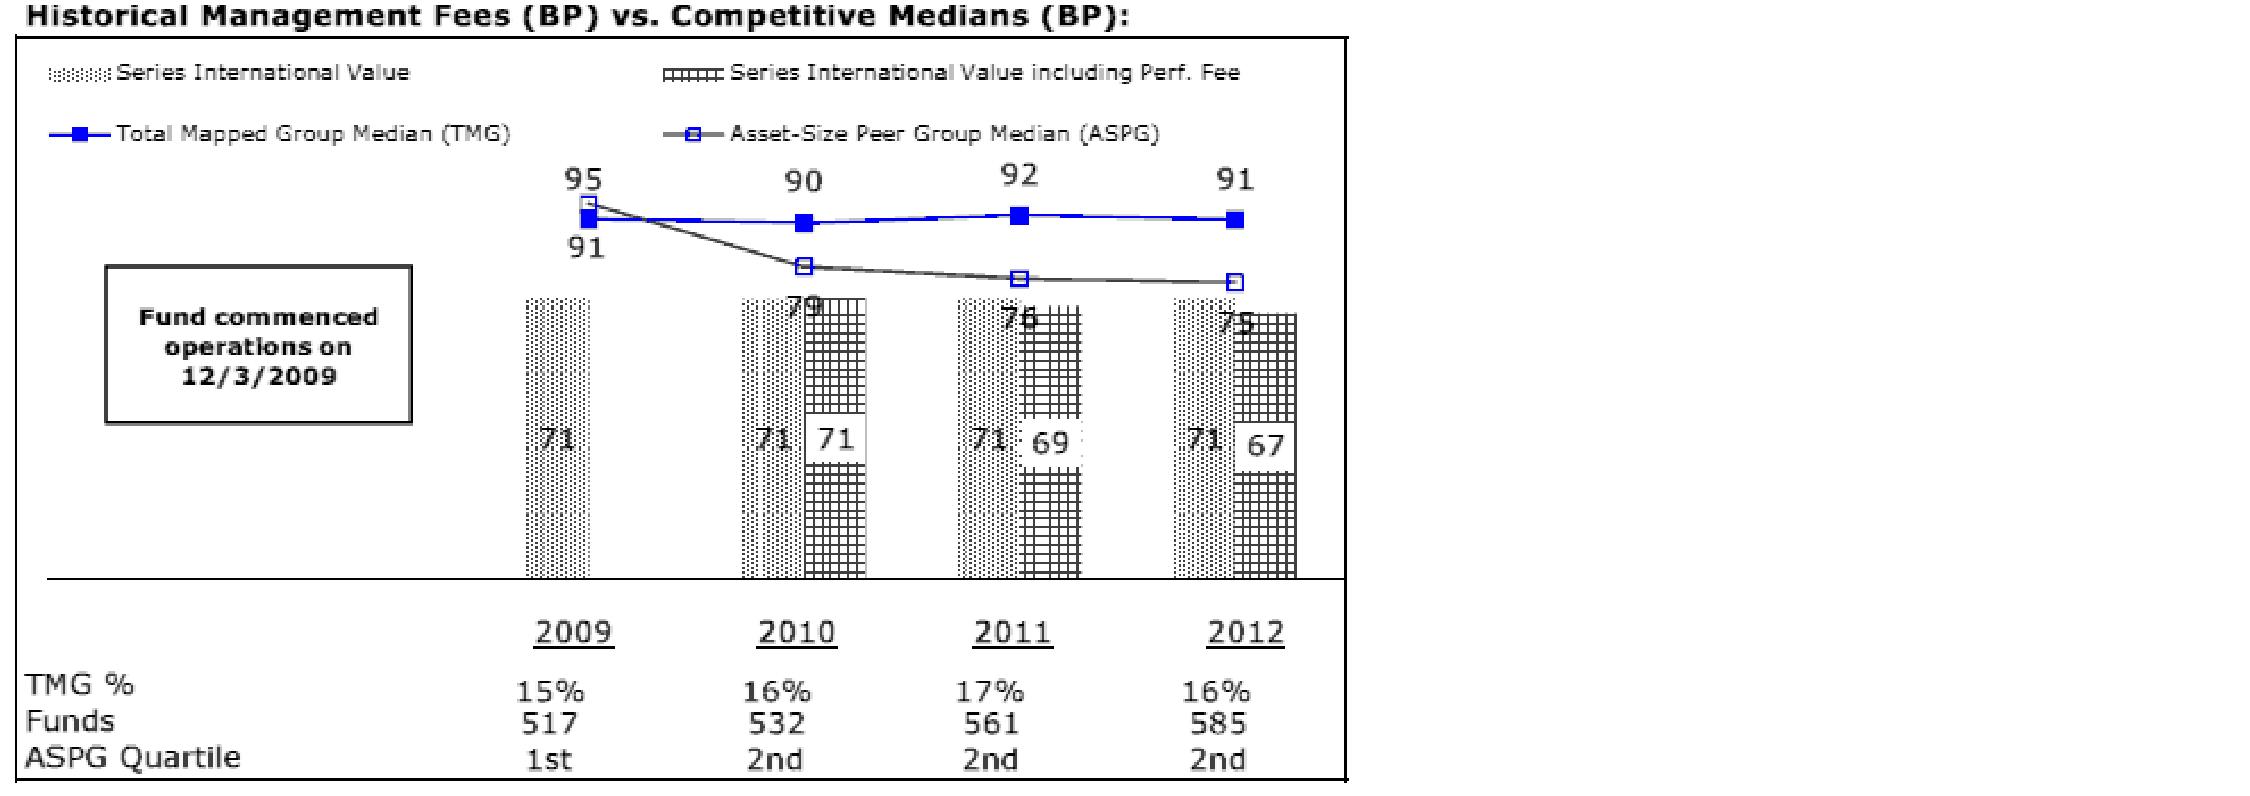
The Board noted that each fund's management fee ranked below the median of its Total Mapped Group and below the median of its ASPG for 2012. The Board also noted the effect of each of Fidelity Series International Growth Fund's and Fidelity Series International Small Cap Fund's positive performance adjustment and Fidelity Series International Value Fund's negative performance adjustment on the fund's management fee ranking.
Annual Report
Based on its review, the Board concluded that each fund's management fee is fair and reasonable in light of the services that the fund receives and the other factors considered.
Total Expense Ratio. In its review of the total expense ratio of each class of each fund, the Board considered the fund's management fee as well as other fund or class expenses, as applicable, such as transfer agent fees, pricing and bookkeeping fees, and custodial, legal, and audit fees. The Board also noted the effects of any waivers and reimbursements on fees and expenses, as well as the impact of each fund's performance adjustment. As part of its review, the Board also considered the current and historical total expense ratios of each class of each fund compared to competitive fund median expenses. Each class of each fund is compared to those funds and classes in the Total Mapped Group (used by the Board for management fee comparisons) that have a similar sales load structure.
The Board noted that the total expense ratio of each class of each fund ranked below its competitive median for 2012.
Fees Charged to Other Fidelity Clients. The Board also considered Fidelity fee structures and other information with respect to clients of FMR and its affiliates, such as other mutual funds advised or subadvised by FMR or its affiliates, pension plan clients, and other institutional clients. The Board noted the findings of the 2013 ad hoc joint committee (created with the board of other Fidelity funds), which reviewed and compared Fidelity's institutional investment advisory business with its business of providing services to the Fidelity funds, including the differences in services provided, fees charged, and costs incurred, as well as competition in their respective marketplaces.
Based on its review of total expense ratios and fees charged to other Fidelity clients, the Board concluded that the total expense ratio of each class of each fund was reasonable in light of the services that the fund and its shareholders receive and the other factors considered.
Costs of the Services and Profitability. The Board considered the revenues earned and the expenses incurred by Fidelity in conducting the business of developing, marketing, distributing, managing, administering and servicing each fund and servicing each fund's shareholders. The Board also considered the level of Fidelity's profits in respect of all the Fidelity funds.
On an annual basis, FMR presents to the Board Fidelity's profitability for each fund. Fidelity calculates the profitability for each fund, as well as aggregate profitability for groups of Fidelity funds and all Fidelity funds, using a series of detailed revenue and cost allocation methodologies which originate with the books and records of Fidelity on which Fidelity's audited financial statements are based. The Audit Committee of the Board reviews any significant changes from the prior year's methodologies.
Annual Report
Board Approval of Investment Advisory Contracts and
Management Fees - continued
PricewaterhouseCoopers LLP (PwC), independent registered public accounting firm and auditor to Fidelity and certain Fidelity funds, has been engaged annually by the Board as part of the Board's assessment of Fidelity's profitability analysis. PwC's engagement includes the review and assessment of the methodologies used by Fidelity in determining the revenues and expenses attributable to Fidelity's mutual fund business, and completion of agreed-upon procedures surrounding the mathematical accuracy of fund profitability and its conformity to allocation methodologies. After considering PwC's reports issued under the engagement and information provided by Fidelity, the Board concluded that while other allocation methods may also be reasonable, Fidelity's profitability methodologies are reasonable in all material respects.
The Board also reviewed Fidelity's non-fund businesses and fall-out benefits related to the mutual fund business as well as cases where Fidelity's affiliates may benefit from or be related to the funds' business.
The Board considered the costs of the services provided by and the profits realized by Fidelity in connection with the operation of each fund and was satisfied that the profitability was not excessive in the circumstances.
Economies of Scale. The Board considered whether there have been economies of scale in respect of the management of the Fidelity funds, whether the Fidelity funds (including each fund) have appropriately benefited from any such economies of scale, and whether there is potential for realization of any further economies of scale. The Board considered the extent to which each fund will benefit from economies of scale through increased services to the fund, through waivers or reimbursements, or through fee or expense reductions. The Board also noted that in 2009, it and the board of other Fidelity funds created an ad hoc committee (the Economies of Scale Committee) to analyze whether FMR attains economies of scale in respect of the management and servicing of the Fidelity funds, whether the Fidelity funds have appropriately benefited from such economies of scale, and whether there is potential for realization of any further economies of scale.
The Board recognized that each fund's management contract incorporates a "group fee" structure, which provides for lower group fee rates as total fund assets under FMR's management increase, and for higher group fee rates as total fund assets under FMR's management decrease. FMR calculates the group fee rates based on a tiered asset "breakpoint" schedule that varies based on asset class. The Board considered that the group fee is designed to deliver the benefits of economies of scale to fund shareholders when total Fidelity fund assets increase, even if assets of any particular fund are unchanged or have declined, because some portion of Fidelity's costs are attributable to services provided to all Fidelity funds, and all funds benefit if those costs can be allocated among more assets. The Board also considered that although each fund is offered only to other funds advised by FMR or an affiliate, it continues to incur investment management expenses. The Board further noted that each fund may continue to realize benefits from the group fee structure, even though assets may not be expected to grow significantly at the fund level. The Board concluded that, given the group fee structure, fund shareholders will benefit from lower management fees as assets under FMR's management increase at the fund complex level, regardless of whether Fidelity achieves any such economies of scale.
Annual Report
The Board concluded, taking into account the analysis of the Economies of Scale Committee, that economies of scale, if any, are being appropriately shared between fund shareholders and Fidelity.
Amendment to Description of Group Fee Rate. At its July 2013 meeting, the Board voted to approve an amendment to each fund's management contract to modify the description of the "group fee rate" effective August 1, 2013. The Board noted that under the prior description in the contract, the group fee rate was based on the average net assets of all registered investment companies with which FMR has management contracts. Under the contract's tiered asset breakpoint schedule, the group fee rate is lower as total fund assets under FMR's management increase, and higher as total fund assets under FMR's management decrease. The Board considered that the prior description would have excluded the assets of 64 Fidelity sector funds from the group fee rate calculation once Fidelity SelectCo, LLC, an affiliate of FMR, assumed management responsibilities for those funds. The Board noted that modifying the description of the group fee rate to continue to include the assets of those 64 funds for purposes of determining group fee rate breakpoints would avoid an immediate adverse impact on the group fee rate for any fund.
Additional Information Requested by the Board. In order to develop fully the factual basis for consideration of the Fidelity funds' Advisory Contracts, the Board requested and received additional information on certain topics, including: (i) fund performance trends and Fidelity's long-term strategies for certain funds; (ii) the potential to further rationalize the Fidelity fund lineup with the possibility of achieving savings for the funds and Fidelity; (iii) the methodology with respect to competitive fund data and peer group classifications; (iv) the arrangements with, and performance of, certain sub-advisers on behalf of the Fidelity funds, as well as certain proposed participating affiliate arrangements; (v) the realization of fall-out benefits in certain Fidelity business units; (vi) Fidelity's group fee structures, including the rationale for the individual fee rates of certain categories of funds and the definition of group assets; (vii) trends regarding industry use of performance fee structures and the performance adjustment methodologies applicable to the Fidelity funds; (viii) additional competitive analysis regarding the total expenses for certain classes; and (ix) fund profitability methodology, including Fidelity's cost allocation methodology, and the impact of certain factors on fund profitability results.
Annual Report
Board Approval of Investment Advisory Contracts and
Management Fees - continued
Based on its evaluation of all of the conclusions noted above, and after considering all factors it believed relevant, the Board ultimately concluded that the advisory fee structures are fair and reasonable, and that each fund's Advisory Contracts should be renewed.
Annual Report
Investment Adviser
Fidelity Management & Research Company
Boston, MA
Investment Sub-Advisers
FMR Co., Inc.
Fidelity Management & Research (U.K.) Inc.
Fidelity Management & Research (Hong Kong) Limited
Fidelity Management & Research (Japan) Inc.
FIL Investment Advisors
FIL Investment Advisors (UK) Limited
FIL Investments (Japan) Limited
General Distributor
Fidelity Distributors Corporation
Smithfield, RI
Transfer and Service Agents
Fidelity Investments Institutional Operations Company, Inc.
Boston, MA
Fidelity Service Company, Inc.
Boston, MA
Custodians
The Northern Trust Company
Chicago, IL
Fidelity Series Emerging Markets Fund
State Street Bank and Trust Company
Quincy, MA
Fidelity Series International Growth Fund, Fidelity Series International Small Cap Fund, Fidelity Series International Value Fund
(Fidelity Investment logo)(registered trademark)
Corporate Headquarters
245 Summer St., Boston, MA 02210
www.fidelity.com
GSV-S-ANN-1213
1.907943.103
Fidelity®
Global Commodity Stock
Fund
Annual Report
October 31, 2013
(Fidelity Cover Art)
Contents
Performance | (Click Here) | How the fund has done over time. |
Management's Discussion of Fund Performance | (Click Here) | The Portfolio Manager's review of fund performance and strategy. |
Shareholder Expense Example | (Click Here) | An example of shareholder expenses. |
Investment Changes | (Click Here) | A summary of major shifts in the fund's investments over the past six months. |
Investments | (Click Here) | A complete list of the fund's investments with their market values. |
Financial Statements | (Click Here) | Statements of assets and liabilities, operations, and changes in net assets, as well as financial highlights. |
Notes | (Click Here) | Notes to the financial statements. |
Report of Independent Registered Public Accounting Firm | (Click Here) | |
Trustees and Officers | (Click Here) | |
Distributions | (Click Here) | |
Board Approval of Investment Advisory Contracts and Management Fees | (Click Here) | |
To view a fund's proxy voting guidelines and proxy voting record for the 12-month period ended June 30, visit http://www.fidelity.com/proxyvotingresults or visit the Securities and Exchange Commission's (SEC) web site at http://www.sec.gov. You may also call 1-800-544-8544 to request a free copy of the proxy voting guidelines.
Standard & Poor's, S&P and S&P 500 are registered service marks of The McGraw-Hill Companies, Inc. and have been licensed for use by Fidelity Distributors Corporation.
Other third-party marks appearing herein are the property of their respective owners.
All other marks appearing herein are registered or unregistered trademarks or service marks of FMR LLC or an affiliated company. © 2013 FMR LLC. All rights reserved.
Annual Report
This report and the financial statements contained herein are submitted for the general information of the shareholders of the fund. This report is not authorized for distribution to prospective investors in the fund unless preceded or accompanied by an effective prospectus.
A fund files its complete schedule of portfolio holdings with the SEC for the first and third quarters of each fiscal year on Form N-Q. Forms N-Q are available on the SEC's web site at http://www.sec.gov. A fund's Forms N-Q may be reviewed and copied at the SEC's Public Reference Room in Washington, DC. Information regarding the operation of the SEC's Public Reference Room may be obtained by calling 1-800-SEC-0330. For a complete list of a fund's portfolio holdings, view the most recent holdings listing, semiannual report, or annual report on Fidelity's web site at http://www.fidelity.com, http://www.advisor.fidelity.com, or http://www.401k.com, as applicable.
NOT FDIC INSURED • MAY LOSE VALUE • NO BANK GUARANTEE
Neither the fund nor Fidelity Distributors Corporation is a bank.
Annual Report
Average annual total return reflects the change in the value of an investment, assuming reinvestment of the class' distributions from dividend income and capital gains (the profits earned upon the sale of securities that have grown in value, if any) and assuming a constant rate of performance each year. The $10,000 table and the fund's returns do not reflect the deduction of taxes that a shareholder would pay on fund distributions or the redemption of fund shares. During periods of reimbursement by Fidelity, a fund's total return will be greater than it would be had the reimbursement not occurred. How a fund did yesterday is no guarantee of how it will do tomorrow.
Average Annual Total Returns
Periods ended October 31, 2013 | Past 1
year | Life of
fund A |
Fidelity® Global Commodity Stock Fund | -1.75% | 8.86% |
A From March 25, 2009
$10,000 Over Life of Fund
Let's say hypothetically that $10,000 was invested in Fidelity® Global Commodity Stock Fund, a class of the fund, on March 25, 2009, when the fund started. The chart shows how the value of your investment would have changed, and also shows how the MSCI® ACWI® (All Country World Index) Index performed over the same period.
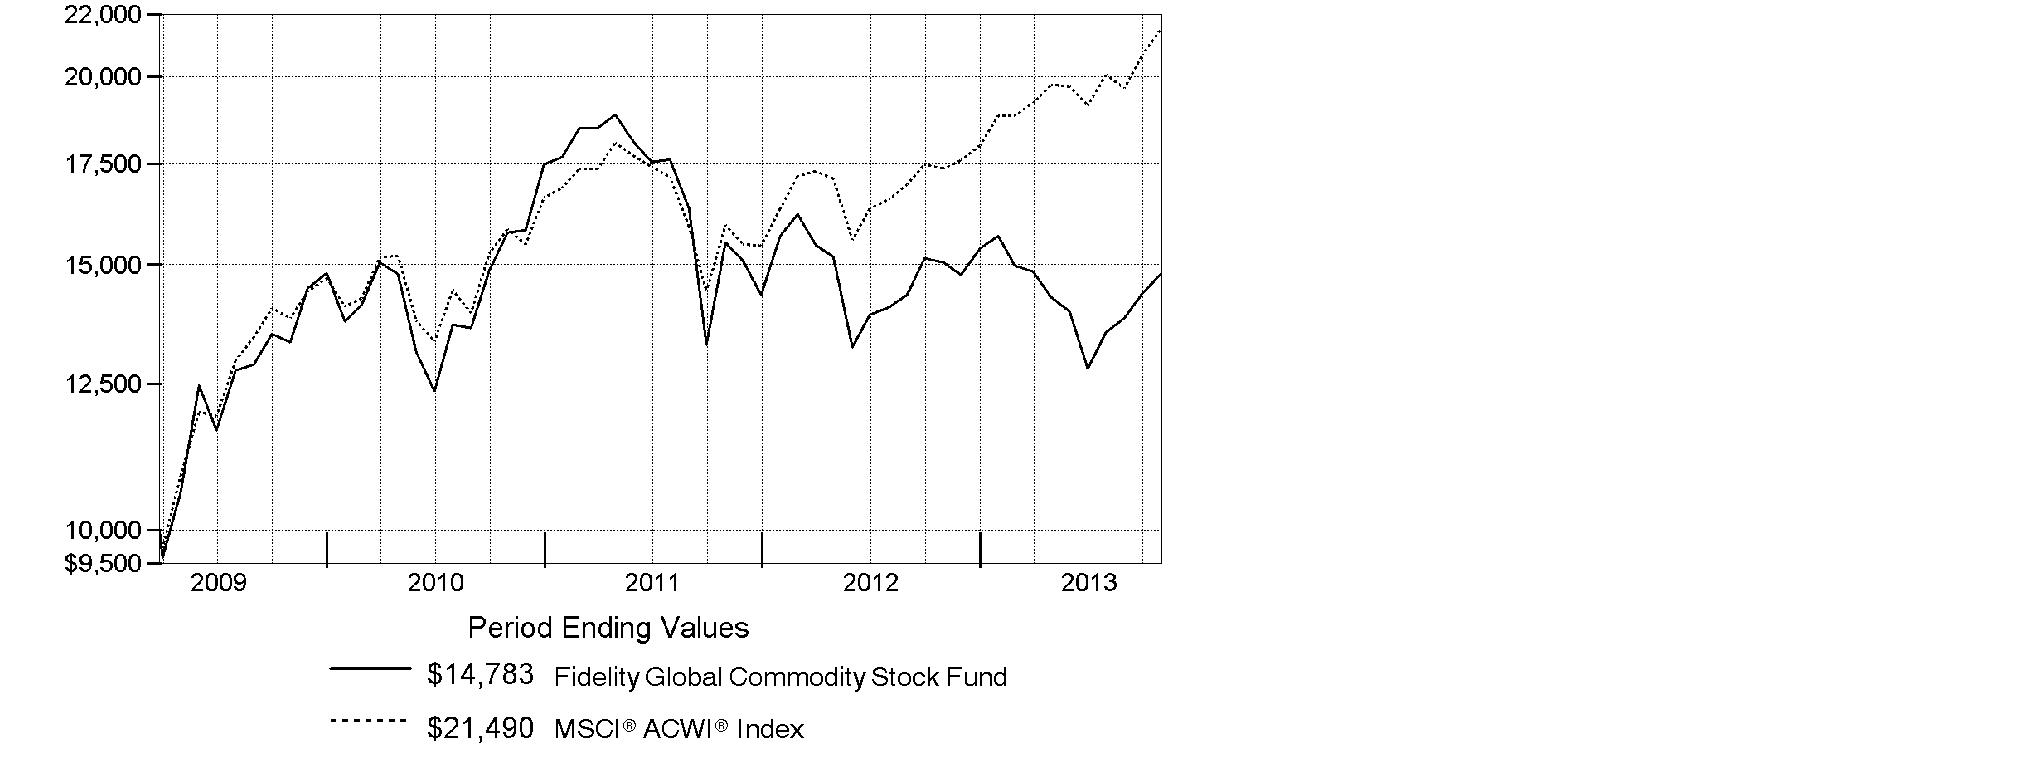
Annual Report
Market Recap: On balance, global equity markets remained upbeat for the 12-month period ending October 31, 2013. The MSCI® ACWI® (All Country World Index) Index gained 23.75% for the period, amid investor preference for higher-risk assets. The period was not without turbulence, however. In the spring and summer, central banks worldwide, especially in the U.S. and China, made clear their intentions to maintain accommodative monetary policies. That stance, combined with modest cyclical improvements around the globe and generally low valuations, underpinned the broad rally in equities. Europe (+32%) shone brightly, with most markets in the region - large and small - registering solid, index-beating gains. Another bright spot was Japan, which, despite a struggling yen and taking a second-half breather, posted a 34% result for the full year. The U.S. - by far the index's biggest constituent - also outperformed the global market with a roughly 28% advance. Meanwhile, Asia-Pacific ex Japan (+14%) lagged, hurt in part by a slowdown in Australia's mining industry as well as currency headwinds. Foreign-exchange and commodity weakness also curbed results in resource-heavy Canada and emerging markets (EM), both of which were up 7%. Country-level EM performance diverged meaningfully for the period, as evidenced by performance in Brazil (-1%), Russia (+12%), India (+1%) and China (+8%).
Comments from S. Joseph Wickwire II, Portfolio Manager of Fidelity® Global Commodity Stock Fund: For the year, the fund's Retail Class shares returned -1.75%, lagging the broad market MSCI ACWI index and the MSCI® ACWI® (All Country World Index) Commodity Producers Sector Capped Index, which returned 0.57%. Relative to the sector benchmark, the fund was hurt by a sizable overweighting in gold stocks. The market was unfavorable to gold and gold stocks for much of the period, as the price of the precious metal price fell by 23% by period end. The gold stocks owned by the fund were hit particularly hard, including Barrick Gold, the fund's largest individual detractor. Conversely, positioning in fertilizers & agricultural chemicals helped, due in part to good timing with potash-related fertilizing companies such as Potash Corporation of Saskatchewan, along with underweightings in K&S, and Uralkali, both of which I sold from the fund by period end. Overweighting oil & gas exploration & production also contributed, with investments in Petrominerales, Anadarko Petroleum and a non-index stake in C&C Energia among the fund's top relative performers. I sold Petrominerales and C&C Energia by period end to take profits, but remained overweighted in Anadarko.
The views expressed above reflect those of the portfolio manager(s) only through the end of the period as stated on the cover of this report and do not necessarily represent the views of Fidelity or any other person in the Fidelity organization. Any such views are subject to change at any time based upon market or other conditions and Fidelity disclaims any responsibility to update such views. These views may not be relied on as investment advice and, because investment decisions for a Fidelity fund are based on numerous factors, may not be relied on as an indication of trading intent on behalf of any Fidelity fund.
Annual Report
Shareholder Expense Example
As a shareholder of the Fund, you incur two types of costs: (1) transaction costs, including sales charges (loads) on purchase payments or redemption proceeds, redemption fees and (2) ongoing costs, including management fees, distribution and/or service (12b-1) fees and other Fund expenses. This Example is intended to help you understand your ongoing costs (in dollars) of investing in the Fund and to compare these costs with the ongoing costs of investing in other mutual funds.
The Example is based on an investment of $1,000 invested at the beginning of the period and held for the entire period (May 1, 2013 to October 31, 2013).
Actual Expenses
The first line of the accompanying table for each class of the Fund provides information about actual account values and actual expenses. You may use the information in this line, together with the amount you invested, to estimate the expenses that you paid over the period. Simply divide your account value by $1,000.00 (for example, an $8,600 account value divided by $1,000.00 = 8.6), then multiply the result by the number in the first line for a class of the Fund under the heading entitled "Expenses Paid During Period" to estimate the expenses you paid on your account during this period. A small balance maintenance fee of $12.00 that is charged once a year may apply for certain accounts with a value of less than $2,000. This fee is not included in the table below. If it was, the estimate of expenses you paid during the period would be higher, and your ending account value lower, by this amount. In addition, the Fund, as a shareholder in the underlying Fidelity Central Funds, will indirectly bear its pro-rata share of the fees and expenses incurred by the underlying Fidelity Central Funds. These fees and expenses are not included in the Fund's annualized expense ratio used to calculate the expense estimate in the table below.
Hypothetical Example for Comparison Purposes
The second line of the accompanying table for each class of the Fund provides information about hypothetical account values and hypothetical expenses based on a Class' actual expense ratio and an assumed rate of return of 5% per year before expenses, which is not the Class' actual return. The hypothetical account values and expenses may not be used to estimate the actual ending account balance or expenses you paid for the period. You may use this information to compare the ongoing costs of investing in the Fund and other funds. To do so, compare this 5% hypothetical example with the 5% hypothetical examples that appear in the shareholder reports of the other funds. A small balance maintenance fee of $12.00 that is charged once a year may apply for certain accounts with a value of less than $2,000. This fee is not included in the table below. If it was, the estimate of expenses you paid during the period would be higher, and your ending account value lower, by this amount. In addition, the Fund, as a shareholder in the underlying Fidelity Central Funds, will indirectly bear its pro-rata share of the fees and expenses incurred by the underlying Fidelity Central Funds. These fees and expenses are not included in the Fund's annualized expense ratio used to calculate the expense estimate in the table below.
Please note that the expenses shown in the table are meant to highlight your ongoing costs only and do not reflect any transaction costs. Therefore, the second line of the table is useful in comparing ongoing costs only, and will not help you determine the relative total costs of owning different funds. In addition, if these transactional costs were included, your costs would have been higher.
Annual Report
| Annualized
Expense Ratio B | Beginning
Account Value
May 1, 2013 | Ending
Account Value
October 31, 2013 | Expenses Paid
During Period*
May 1, 2013
to October 31, 2013 |
Class A | 1.33% | | | |
Actual | | $ 1,000.00 | $ 1,036.60 | $ 6.83 |
HypotheticalA | | $ 1,000.00 | $ 1,018.50 | $ 6.77 |
Class T | 1.59% | | | |
Actual | | $ 1,000.00 | $ 1,035.20 | $ 8.16 |
HypotheticalA | | $ 1,000.00 | $ 1,017.19 | $ 8.08 |
Class B | 2.08% | | | |
Actual | | $ 1,000.00 | $ 1,032.40 | $ 10.66 |
HypotheticalA | | $ 1,000.00 | $ 1,014.72 | $ 10.56 |
Class C | 2.09% | | | |
Actual | | $ 1,000.00 | $ 1,032.50 | $ 10.71 |
HypotheticalA | | $ 1,000.00 | $ 1,014.67 | $ 10.61 |
Global Commodity Stock | 1.08% | | | |
Actual | | $ 1,000.00 | $ 1,037.10 | $ 5.55 |
HypotheticalA | | $ 1,000.00 | $ 1,019.76 | $ 5.50 |
Institutional Class | 1.02% | | | |
Actual | | $ 1,000.00 | $ 1,037.90 | $ 5.24 |
HypotheticalA | | $ 1,000.00 | $ 1,020.06 | $ 5.19 |
A 5% return per year before expenses
B Annualized expense ratio reflects expenses net of applicable fee waivers.
* Expenses are equal to each Class' annualized expense ratio, multiplied by the average account value over the period, multiplied by 184/365 (to reflect the one-half year period).
Annual Report
Investment Changes (Unaudited)
Top Ten Stocks as of October 31, 2013 |
| % of fund's
net assets | % of fund's net assets
6 months ago |
Monsanto Co. | 6.3 | 6.4 |
BHP Billiton PLC | 5.3 | 5.2 |
Syngenta AG (Switzerland) | 4.4 | 4.4 |
Potash Corp. of Saskatchewan, Inc. | 3.4 | 1.6 |
Peabody Energy Corp. | 3.3 | 3.0 |
Rio Tinto PLC | 3.3 | 3.1 |
Chevron Corp. | 3.3 | 0.4 |
Bunge Ltd. | 3.1 | 2.0 |
Archer Daniels Midland Co. | 3.1 | 2.5 |
International Paper Co. | 2.5 | 2.2 |
| 38.0 | |
Top Industries (% of fund's net assets) |
As of October 31, 2013 |
 | Energy 33.6% | |
 | Agriculture 32.5% | |
 | Metals 30.9% | |
 | Other 2.5% | |
 | Short-Term Investments and
Net Other Assets 0.5% | |

As of April 30, 2013 |
| Metals 37.6% | |
| Energy 35.7% | |
| Agriculture 24.9% | |
| Other 1.6% | |
| Short-Term Investments and
Net Other Assets 0.2% | |

Annual Report
Investments October 31, 2013
Showing Percentage of Net Assets
Common Stocks - 99.5% |
| Shares | | Value |
AEROSPACE & DEFENSE - 0.1% |
Aerospace & Defense - 0.1% |
Precision Castparts Corp. | 500 | | $ 126,725 |
Rolls-Royce Group PLC | 6,800 | | 125,386 |
| | 252,111 |
CHEMICALS - 22.2% |
Commodity Chemicals - 0.2% |
Axiall Corp. | 16,400 | | 637,796 |
Cabot Corp. | 2,800 | | 130,508 |
| | 768,304 |
Diversified Chemicals - 0.3% |
Eastman Chemical Co. | 1,700 | | 133,943 |
FMC Corp. | 1,700 | | 123,692 |
Huntsman Corp. | 5,800 | | 134,676 |
Lanxess AG | 10,100 | | 710,896 |
| | 1,103,207 |
Fertilizers & Agricultural Chemicals - 21.7% |
Agrium, Inc. | 86,600 | | 7,392,126 |
CF Industries Holdings, Inc. | 29,872 | | 6,440,403 |
China BlueChemical Ltd. (H Shares) | 906,000 | | 581,953 |
Intrepid Potash, Inc. (d) | 99,700 | | 1,480,545 |
Israel Chemicals Ltd. | 202,400 | | 1,674,876 |
Israel Corp. Ltd. (Class A) (a) | 1,000 | | 504,502 |
Monsanto Co. | 248,400 | | 26,052,190 |
Potash Corp. of Saskatchewan, Inc. | 456,000 | | 14,170,048 |
Sociedad Quimica y Minera de Chile SA (PN-B) sponsored ADR (d) | 102,300 | | 2,824,503 |
Syngenta AG (Switzerland) | 45,287 | | 18,278,589 |
Taiwan Fertilizer Co. Ltd. | 240,000 | | 570,749 |
The Mosaic Co. | 143,359 | | 6,573,010 |
Yara International ASA | 84,800 | | 3,660,913 |
| | 90,204,407 |
TOTAL CHEMICALS | | 92,075,918 |
CONSTRUCTION & ENGINEERING - 0.3% |
Construction & Engineering - 0.3% |
Boart Longyear Ltd. (d) | 2,635,000 | | 1,070,902 |
Chiyoda Corp. | 11,000 | | 139,494 |
| | 1,210,396 |
Common Stocks - continued |
| Shares | | Value |
CONSTRUCTION MATERIALS - 0.1% |
Construction Materials - 0.1% |
Eagle Materials, Inc. | 5,400 | | $ 405,054 |
Vulcan Materials Co. | 3,400 | | 182,070 |
| | 587,124 |
CONTAINERS & PACKAGING - 0.5% |
Paper Packaging - 0.5% |
Rock-Tenn Co. Class A | 20,100 | | 2,150,901 |
ELECTRICAL EQUIPMENT - 0.0% |
Electrical Components & Equipment - 0.0% |
Eaton Corp. PLC | 1,900 | | 134,064 |
ENERGY EQUIPMENT & SERVICES - 1.1% |
Oil & Gas Drilling - 0.8% |
Ensco PLC Class A | 7,500 | | 432,375 |
Noble Corp. | 14,100 | | 531,570 |
Ocean Rig UDW, Inc. (United States) (a) | 63,747 | | 1,117,485 |
Vantage Drilling Co. (a) | 717,582 | | 1,277,296 |
| | 3,358,726 |
Oil & Gas Equipment & Services - 0.3% |
Cameron International Corp. (a) | 11,200 | | 614,432 |
FMC Technologies, Inc. (a) | 400 | | 20,220 |
Halliburton Co. | 200 | | 10,606 |
National Oilwell Varco, Inc. | 4,900 | | 397,782 |
TGS Nopec Geophysical Co. ASA | 4,800 | | 132,073 |
| | 1,175,113 |
TOTAL ENERGY EQUIPMENT & SERVICES | | 4,533,839 |
FOOD PRODUCTS - 6.9% |
Agricultural Products - 6.9% |
Archer Daniels Midland Co. | 311,500 | | 12,740,350 |
Bunge Ltd. | 158,400 | | 13,009,392 |
China Agri-Industries Holdings Ltd. | 1,458,300 | | 684,666 |
Golden Agri-Resources Ltd. | 3,377,000 | | 1,631,138 |
Ingredion, Inc. | 400 | | 26,304 |
Kernel Holding SA (a) | 8,400 | | 113,142 |
PT Charoen Pokphand Indonesia Tbk | 806,500 | | 279,027 |
Wilmar International Ltd. | 78,000 | | 217,260 |
| | 28,701,279 |
Common Stocks - continued |
| Shares | | Value |
MACHINERY - 0.5% |
Construction & Farm Machinery & Heavy Trucks - 0.5% |
Caterpillar, Inc. | 3,000 | | $ 250,080 |
Manitowoc Co., Inc. | 65,300 | | 1,270,738 |
Samsung Heavy Industries Co. Ltd. | 9,190 | | 337,282 |
| | 1,858,100 |
METALS & MINING - 30.9% |
Aluminum - 0.3% |
Alcoa, Inc. | 130,900 | | 1,213,443 |
Diversified Metals & Mining - 16.1% |
Anglo American PLC (United Kingdom) | 217,351 | | 5,175,234 |
BHP Billiton PLC | 716,093 | | 22,097,554 |
Boliden AB | 8,400 | | 119,647 |
Copper Mountain Mining Corp. (a) | 793,131 | | 1,308,383 |
First Quantum Minerals Ltd. | 93,424 | | 1,772,337 |
Freeport-McMoRan Copper & Gold, Inc. | 163,100 | | 5,995,556 |
Glencore Xstrata PLC | 1,649,452 | | 8,992,087 |
Grupo Mexico SA de CV Series B | 755,611 | | 2,386,612 |
Iluka Resources Ltd. | 53,014 | | 516,094 |
Norilsk Nickel OJSC sponsored ADR | 41,300 | | 626,521 |
Rio Tinto PLC | 270,887 | | 13,706,931 |
Sesa Sterlite Ltd. | 13,072 | | 42,849 |
Sumitomo Metal Mining Co. Ltd. | 45,000 | | 623,277 |
Teck Resources Ltd. Class B (sub. vtg.) | 89,100 | | 2,384,204 |
Turquoise Hill Resources Ltd. (a)(d) | 109,214 | | 526,875 |
Walter Energy, Inc. (d) | 26,000 | | 413,140 |
| | 66,687,301 |
Gold - 8.2% |
Agnico Eagle Mines Ltd. (Canada) | 38,000 | | 1,128,356 |
AngloGold Ashanti Ltd. sponsored ADR | 64,700 | | 976,970 |
Argonaut Gold, Inc. (a) | 93,200 | | 518,448 |
B2Gold Corp. (a) | 281,680 | | 697,007 |
Barrick Gold Corp. | 252,500 | | 4,911,236 |
Compania de Minas Buenaventura SA sponsored ADR | 23,600 | | 342,200 |
Detour Gold Corp. (a) | 106,500 | | 870,263 |
Eldorado Gold Corp. | 232,250 | | 1,565,931 |
Franco-Nevada Corp. | 26,746 | | 1,203,333 |
Gold Fields Ltd. sponsored ADR | 145,000 | | 667,000 |
Goldcorp, Inc. | 178,510 | | 4,547,284 |
Harmony Gold Mining Co. Ltd. sponsored ADR | 95,800 | | 325,720 |
Kinross Gold Corp. | 245,005 | | 1,245,410 |
Common Stocks - continued |
| Shares | | Value |
METALS & MINING - CONTINUED |
Gold - continued |
New Gold, Inc. (a) | 467,100 | | $ 2,741,718 |
Newcrest Mining Ltd. | 170,030 | | 1,655,250 |
Newmont Mining Corp. | 85,000 | | 2,317,100 |
Osisko Mining Corp. (a) | 251,528 | | 1,227,907 |
Premier Gold Mines Ltd. (a) | 504,000 | | 1,116,616 |
Pretium Resources, Inc. (a) | 60,300 | | 197,212 |
Randgold Resources Ltd. sponsored ADR | 32,500 | | 2,401,750 |
Romarco Minerals, Inc. (a) | 1,116,500 | | 401,561 |
Royal Gold, Inc. | 25,900 | | 1,244,236 |
Torex Gold Resources, Inc. (a) | 327,400 | | 364,249 |
Yamana Gold, Inc. | 151,100 | | 1,498,464 |
| | 34,165,221 |
Precious Metals & Minerals - 0.9% |
Aquarius Platinum Ltd. (United Kingdom) (a) | 242,800 | | 168,375 |
Fresnillo PLC | 36,200 | | 566,210 |
Impala Platinum Holdings Ltd. | 38,700 | | 470,318 |
Industrias Penoles SA de CV | 11,200 | | 327,701 |
Silver Wheaton Corp. | 64,200 | | 1,456,838 |
Tahoe Resources, Inc. (a) | 27,300 | | 524,189 |
| | 3,513,631 |
Steel - 5.4% |
African Minerals Ltd. (a)(d) | 376,300 | | 1,125,265 |
ArcelorMittal SA Class A unit (d) | 157,000 | | 2,474,320 |
Carpenter Technology Corp. | 800 | | 47,464 |
Eregli Demir ve Celik Fabrikalari T.A.S. | 79,770 | | 110,689 |
Fortescue Metals Group Ltd. | 144,789 | | 712,975 |
Gerdau SA sponsored ADR | 179,500 | | 1,423,435 |
Hyundai Steel Co. | 9,415 | | 776,244 |
JFE Holdings, Inc. | 70,500 | | 1,602,796 |
Jindal Steel & Power Ltd. (a) | 50,655 | | 197,157 |
London Mining PLC (a) | 539,586 | | 1,126,887 |
Nippon Steel & Sumitomo Metal Corp. | 236,000 | | 778,931 |
POSCO | 12,732 | | 3,799,125 |
SunCoke Energy, Inc. (a) | 4,000 | | 80,000 |
Tata Steel Ltd. | 50,717 | | 275,625 |
Thyssenkrupp AG (a) | 39,000 | | 996,826 |
Common Stocks - continued |
| Shares | | Value |
METALS & MINING - CONTINUED |
Steel - continued |
Vale SA (PN-A) sponsored ADR | 453,900 | | $ 6,645,096 |
Voestalpine AG | 8,500 | | 401,449 |
| | 22,574,284 |
TOTAL METALS & MINING | | 128,153,880 |
OIL, GAS & CONSUMABLE FUELS - 32.5% |
Coal & Consumable Fuels - 4.1% |
Alpha Natural Resources, Inc. (a) | 65,037 | | 455,259 |
Cameco Corp. | 47,600 | | 903,471 |
China Shenhua Energy Co. Ltd. (H Shares) | 210,000 | | 639,236 |
Coal India Ltd. | 50,901 | | 237,845 |
CONSOL Energy, Inc. | 20,500 | | 748,250 |
Peabody Energy Corp. | 713,098 | | 13,891,149 |
Whitehaven Coal Ltd. (d) | 58,500 | | 89,572 |
| | 16,964,782 |
Integrated Oil & Gas - 17.6% |
BG Group PLC | 282,650 | | 5,771,515 |
BP PLC | 580,900 | | 4,509,301 |
Cenovus Energy, Inc. | 49,800 | | 1,479,695 |
Chevron Corp. | 113,100 | | 13,567,476 |
China Petroleum & Chemical Corp. (H Shares) | 1,469,000 | | 1,189,167 |
ENI SpA | 77,727 | | 1,973,252 |
Exxon Mobil Corp. | 103,061 | | 9,236,327 |
Gazprom OAO sponsored ADR | 312,000 | | 2,910,960 |
Hess Corp. | 17,200 | | 1,396,640 |
Imperial Oil Ltd. | 5,400 | | 235,805 |
InterOil Corp. (a)(d) | 12,300 | | 854,235 |
LUKOIL Oil Co. sponsored ADR | 29,500 | | 1,931,365 |
Occidental Petroleum Corp. | 41,300 | | 3,968,104 |
Origin Energy Ltd. | 29,218 | | 404,013 |
PetroChina Co. Ltd. (H Shares) | 1,226,000 | | 1,396,146 |
Petroleo Brasileiro SA - Petrobras (PN) sponsored ADR (non-vtg.) | 191,400 | | 3,475,824 |
PTT PCL (For. Reg.) | 42,600 | | 433,870 |
Repsol YPF SA | 34,309 | | 921,413 |
Royal Dutch Shell PLC Class A (United Kingdom) | 178,850 | | 5,956,569 |
Statoil ASA | 66,200 | | 1,566,372 |
Suncor Energy, Inc. | 97,332 | | 3,537,054 |
Common Stocks - continued |
| Shares | | Value |
OIL, GAS & CONSUMABLE FUELS - CONTINUED |
Integrated Oil & Gas - continued |
Surgutneftegaz JSC (Reg.) | 99,200 | | $ 87,320 |
Total SA | 102,700 | | 6,300,951 |
| | 73,103,374 |
Oil & Gas Exploration & Production - 10.7% |
Anadarko Petroleum Corp. | 52,900 | | 5,040,841 |
Apache Corp. | 26,800 | | 2,379,840 |
Baytex Energy Corp. | 4,300 | | 179,481 |
Beach Energy Ltd. | 100,000 | | 135,156 |
Bonanza Creek Energy, Inc. (a) | 200 | | 10,108 |
Cabot Oil & Gas Corp. | 50,600 | | 1,787,192 |
Cairn India Ltd. | 1,100 | | 5,644 |
Canadian Natural Resources Ltd. | 74,000 | | 2,348,497 |
Chesapeake Energy Corp. | 31,800 | | 889,128 |
Cimarex Energy Co. | 5,000 | | 526,750 |
CNOOC Ltd. | 120,000 | | 244,077 |
CNOOC Ltd. sponsored ADR | 8,800 | | 1,780,328 |
Cobalt International Energy, Inc. (a) | 68,900 | | 1,599,169 |
Concho Resources, Inc. (a) | 5,800 | | 641,538 |
ConocoPhillips Co. | 64,000 | | 4,691,200 |
Continental Resources, Inc. (a) | 2,200 | | 250,580 |
Denbury Resources, Inc. (a) | 26,900 | | 510,831 |
Devon Energy Corp. | 22,200 | | 1,403,484 |
Double Eagle Petroleum Co. (a)(d) | 139,905 | | 388,936 |
EOG Resources, Inc. | 15,300 | | 2,729,520 |
EQT Corp. | 9,000 | | 770,490 |
INPEX Corp. | 83,200 | | 961,124 |
Kodiak Oil & Gas Corp. (a) | 700 | | 9,079 |
Kunlun Energy Co. Ltd. | 86,000 | | 140,653 |
Lundin Petroleum AB (a) | 5,900 | | 121,823 |
Marathon Oil Corp. | 53,800 | | 1,896,988 |
Murphy Oil Corp. | 10,700 | | 645,424 |
Noble Energy, Inc. | 26,100 | | 1,955,673 |
Northern Oil & Gas, Inc. (a) | 10,300 | | 169,229 |
NOVATEK OAO GDR (Reg. S) | 2,400 | | 337,200 |
Oil & Natural Gas Corp. Ltd. | 34,000 | | 162,044 |
Oil Search Ltd. ADR | 6,941 | | 55,828 |
Pacific Rubiales Energy Corp. | 25,074 | | 518,723 |
Painted Pony Petroleum Ltd. (a)(e) | 15,000 | | 98,547 |
Painted Pony Petroleum Ltd. (a) | 143,100 | | 940,138 |
PDC Energy, Inc. (a) | 300 | | 20,343 |
Common Stocks - continued |
| Shares | | Value |
OIL, GAS & CONSUMABLE FUELS - CONTINUED |
Oil & Gas Exploration & Production - continued |
Penn West Petroleum Ltd. | 25,800 | | $ 288,028 |
Pioneer Natural Resources Co. | 7,500 | | 1,535,850 |
Platino Energy Corp. (a) | 137,400 | | 79,068 |
PTT Exploration and Production PCL (For. Reg.) | 27,600 | | 149,417 |
QEP Resources, Inc. | 12,300 | | 406,638 |
Rosetta Resources, Inc. (a) | 6,100 | | 365,634 |
Santos Ltd. | 30,700 | | 440,174 |
Southwestern Energy Co. (a) | 21,700 | | 807,674 |
Talisman Energy, Inc. | 77,500 | | 966,288 |
Tullow Oil PLC | 80,400 | | 1,215,008 |
Whiting Petroleum Corp. (a) | 6,500 | | 434,785 |
Woodside Petroleum Ltd. | 36,352 | | 1,333,781 |
| | 44,367,951 |
Oil & Gas Storage & Transport - 0.1% |
Access Midstream Partners LP | 3,400 | | 182,036 |
Phillips 66 Partners LP | 6,400 | | 215,040 |
| | 397,076 |
TOTAL OIL, GAS & CONSUMABLE FUELS | | 134,833,183 |
PAPER & FOREST PRODUCTS - 3.8% |
Forest Products - 0.4% |
Boise Cascade Co. | 13,700 | | 350,857 |
Canfor Corp. (a) | 9,100 | | 188,607 |
West Fraser Timber Co. Ltd. | 11,100 | | 1,017,433 |
| | 1,556,897 |
Paper Products - 3.4% |
Fibria Celulose SA sponsored ADR (a)(d) | 18,600 | | 242,730 |
International Paper Co. | 235,400 | | 10,501,194 |
Nine Dragons Paper (Holdings) Ltd. | 898,000 | | 741,287 |
Stora Enso Oyj (R Shares) | 120,700 | | 1,122,581 |
UPM-Kymmene Corp. | 105,400 | | 1,675,781 |
| | 14,283,573 |
TOTAL PAPER & FOREST PRODUCTS | | 15,840,470 |
Common Stocks - continued |
| Shares | | Value |
REAL ESTATE INVESTMENT TRUSTS - 0.0% |
Specialized REITs - 0.0% |
Rayonier, Inc. | 700 | | $ 32,914 |
Weyerhaeuser Co. | 4,200 | | 127,680 |
| | 160,594 |
SPECIALTY RETAIL - 0.3% |
Specialty Stores - 0.3% |
Tsutsumi Jewelry Co. Ltd. | 52,200 | | 1,271,884 |
TRADING COMPANIES & DISTRIBUTORS - 0.3% |
Trading Companies & Distributors - 0.3% |
Daewoo International Corp. | 31,200 | | 1,150,949 |
TOTAL COMMON STOCKS (Cost $462,108,346) |
412,914,692
|
Nonconvertible Preferred Stocks - 0.0% |
| | | |
PAPER & FOREST PRODUCTS - 0.0% |
Paper Products - 0.0% |
Suzano Papel e Celulose SA
(Cost $108,030) | 28,500 | |
115,516
|
Money Market Funds - 1.8% |
| | | |
Fidelity Cash Central Fund, 0.09% (b) | 1,219,168 | | 1,219,168 |
Fidelity Securities Lending Cash Central Fund, 0.09% (b)(c) | 6,069,934 | | 6,069,934 |
TOTAL MONEY MARKET FUNDS (Cost $7,289,102) |
7,289,102
|
TOTAL INVESTMENT PORTFOLIO - 101.3% (Cost $469,505,478) | | 420,319,310 |
NET OTHER ASSETS (LIABILITIES) - (1.3)% | | (5,252,796) |
NET ASSETS - 100% | $ 415,066,514 |
Legend |
(a) Non-income producing |
(b) Affiliated fund that is generally available only to investment companies and other accounts managed by Fidelity Investments. The rate quoted is the annualized seven-day yield of the fund at period end. A complete unaudited listing of the fund's holdings as of its most recent quarter end is available upon request. In addition, each Fidelity Central Fund's financial statements, which are not covered by the Fund's Report of Independent Registered Public Accounting Firm, are available on the SEC's website or upon request. |
(c) Investment made with cash collateral received from securities on loan. |
(d) Security or a portion of the security is on loan at period end. |
(e) Security exempt from registration under Rule 144A of the Securities Act of 1933. These securities may be resold in transactions exempt from registration, normally to qualified institutional buyers. At the end of the period, the value of these securities amounted to $98,547 or 0.0% of net assets. |
Affiliated Central Funds |
Information regarding fiscal year to date income earned by the Fund from investments in Fidelity Central Funds is as follows: |
Fund | Income earned |
Fidelity Cash Central Fund | $ 2,304 |
Fidelity Securities Lending Cash Central Fund | 554,965 |
Total | $ 557,269 |
Other Information |
The following is a summary of the inputs used, as of October 31, 2013, involving the Fund's assets and liabilities carried at fair value. The inputs or methodology used for valuing securities may not be an indication of the risk associated with investing in those securities. For more information on valuation inputs, and their aggregation into the levels used in the tables below, please refer to the Investment Valuation section in the accompanying Notes to Financial Statements. |
Valuation Inputs at Reporting Date: |
Description | Total | Level 1 | Level 2 | Level 3 |
Investments in Securities: | | | | |
Common Stocks | $ 412,914,692 | $ 326,519,152 | $ 86,395,540 | $ - |
Nonconvertible Preferred Stocks | 115,516 | 115,516 | - | - |
Money Market Funds | 7,289,102 | 7,289,102 | - | - |
Total Investments in Securities: | $ 420,319,310 | $ 333,923,770 | $ 86,395,540 | $ - |
The following is a summary of transfers between Level 1 and Level 2 for the period ended October 31, 2013. Transfers are assumed to have occurred at the beginning of the period, and are primarily attributable to the valuation techniques used for foreign equity securities, as discussed in the accompanying Notes to Financial Statements: |
Transfers | Total |
Level 1 to Level 2 | $ 7,714,186 |
Level 2 to Level 1 | $ 0 |
Distribution of investments by country or territory of incorporation, as a percentage of total net assets, is as follows (Unaudited): |
United States of America | 38.7% |
Canada | 16.3% |
United Kingdom | 14.6% |
Switzerland | 4.5% |
Bermuda | 3.7% |
Bailiwick of Jersey | 2.8% |
Brazil | 2.7% |
Australia | 1.5% |
France | 1.5% |
Korea (South) | 1.5% |
Russia | 1.5% |
Japan | 1.3% |
Norway | 1.3% |
Others (Individually Less Than 1%) | 8.1% |
| 100.0% |
See accompanying notes which are an integral part of the financial statements.
Annual Report
Statement of Assets and Liabilities
| October 31, 2013 |
| | |
Assets | | |
Investment in securities, at value (including securities loaned of $5,895,555) - See accompanying schedule: Unaffiliated issuers (cost $462,216,376) | $ 413,030,208 | |
Fidelity Central Funds (cost $7,289,102) | 7,289,102 | |
Total Investments (cost $469,505,478) | | $ 420,319,310 |
Foreign currency held at value (cost $42,375) | | 42,375 |
Receivable for investments sold | | 10,513,562 |
Receivable for fund shares sold | | 210,272 |
Dividends receivable | | 753,835 |
Distributions receivable from Fidelity Central Funds | | 21,487 |
Prepaid expenses | | 911 |
Other receivables | | 8,785 |
Total assets | | 431,870,537 |
| | |
Liabilities | | |
Payable for investments purchased | $ 9,650,706 | |
Payable for fund shares redeemed | 629,022 | |
Accrued management fee | 242,227 | |
Distribution and service plan fees payable | 41,930 | |
Other affiliated payables | 121,216 | |
Other payables and accrued expenses | 48,988 | |
Collateral on securities loaned, at value | 6,069,934 | |
Total liabilities | | 16,804,023 |
| | |
Net Assets | | $ 415,066,514 |
Net Assets consist of: | | |
Paid in capital | | $ 501,612,128 |
Undistributed net investment income | | 4,309,466 |
Accumulated undistributed net realized gain (loss) on investments and foreign currency transactions | | (41,679,876) |
Net unrealized appreciation (depreciation) on investments and assets and liabilities in foreign currencies | | (49,175,204) |
Net Assets | | $ 415,066,514 |
See accompanying notes which are an integral part of the financial statements.
Annual Report
Statement of Assets and Liabilities - continued
| October 31, 2013 |
| | |
Calculation of Maximum Offering Price Class A:
Net Asset Value and redemption price per share ($71,293,097 ÷ 5,031,565 shares) | | $ 14.17 |
| | |
Maximum offering price per share (100/94.25 of $14.17) | | $ 15.03 |
Class T:
Net Asset Value and redemption price per share ($12,551,178 ÷ 888,204 shares) | | $ 14.13 |
| | |
Maximum offering price per share (100/96.50 of $14.13) | | $ 14.64 |
Class B:
Net Asset Value and offering price per share ($2,303,213 ÷ 164,359 shares)A | | $ 14.01 |
| | |
Class C:
Net Asset Value and offering price per share ($23,829,687 ÷ 1,707,183 shares)A | | $ 13.96 |
| | |
Global Commodity Stock:
Net Asset Value, offering price and redemption price per share ($273,475,891 ÷ 19,204,409 shares) | | $ 14.24 |
| | |
Institutional Class:
Net Asset Value, offering price and redemption price per share ($31,613,448 ÷ 2,220,504 shares) | | $ 14.24 |
A Redemption price per share is equal to net asset value less any applicable contingent deferred sales charge.
See accompanying notes which are an integral part of the financial statements.
Annual Report
Financial Statements - continued
Statement of Operations
| Year ended October 31, 2013 |
| | |
Investment Income | | |
Dividends | | $ 12,264,754 |
Income from Fidelity Central Funds | | 557,269 |
Income before foreign taxes withheld | | 12,822,023 |
Less foreign taxes withheld | | (937,571) |
Total income | | 11,884,452 |
| | |
Expenses | | |
Management fee | $ 3,417,195 | |
Transfer agent fees | 1,423,008 | |
Distribution and service plan fees | 573,855 | |
Accounting and security lending fees | 252,628 | |
Custodian fees and expenses | 70,188 | |
Independent trustees' compensation | 2,944 | |
Registration fees | 93,616 | |
Audit | 54,128 | |
Legal | 1,376 | |
Interest | 1,106 | |
Miscellaneous | 5,026 | |
Total expenses before reductions | 5,895,070 | |
Expense reductions | (69,435) | 5,825,635 |
Net investment income (loss) | | 6,058,817 |
Realized and Unrealized Gain (Loss) Net realized gain (loss) on: | | |
Investment securities: | | |
Unaffiliated issuers | (781,472) | |
Foreign currency transactions | 9,027 | |
Total net realized gain (loss) | | (772,445) |
Change in net unrealized appreciation (depreciation) on: Investment securities | (21,267,158) | |
Assets and liabilities in foreign currencies | 18,814 | |
Total change in net unrealized appreciation (depreciation) | | (21,248,344) |
Net gain (loss) | | (22,020,789) |
Net increase (decrease) in net assets resulting from operations | | $ (15,961,972) |
See accompanying notes which are an integral part of the financial statements.
Annual Report
Statement of Changes in Net Assets
| Year ended
October 31,
2013 | Year ended
October 31,
2012 |
Increase (Decrease) in Net Assets | | |
Operations | | |
Net investment income (loss) | $ 6,058,817 | $ 6,227,231 |
Net realized gain (loss) | (772,445) | (27,607,132) |
Change in net unrealized appreciation (depreciation) | (21,248,344) | (8,995,088) |
Net increase (decrease) in net assets resulting
from operations | (15,961,972) | (30,374,989) |
Distributions to shareholders from net investment income | (5,697,049) | (3,692,921) |
Distributions to shareholders from net realized gain | - | (671,463) |
Total distributions | (5,697,049) | (4,364,384) |
Share transactions - net increase (decrease) | (152,423,209) | (156,629,581) |
Redemption fees | 18,199 | 31,600 |
Total increase (decrease) in net assets | (174,064,031) | (191,337,354) |
| | |
Net Assets | | |
Beginning of period | 589,130,545 | 780,467,899 |
End of period (including undistributed net investment income of $4,309,466 and undistributed net investment income of $4,752,569, respectively) | $ 415,066,514 | $ 589,130,545 |
See accompanying notes which are an integral part of the financial statements.
Annual Report
Financial Highlights - Class A
Years ended October 31, | 2013 | 2012 | 2011 | 2010 | 2009 I |
Selected Per-Share Data | | | | | |
Net asset value, beginning of period | $ 14.59 | $ 15.14 | $ 15.60 | $ 13.29 | $ 10.00 |
Income from Investment Operations | | | | | |
Net investment income (loss) E | .16 | .11 | .12 | .19 H | (.01) |
Net realized and unrealized gain (loss) | (.45) | (.59) | (.38) | 2.20 | 3.29 |
Total from investment operations | (.29) | (.48) | (.26) | 2.39 | 3.28 |
Distributions from net investment income | (.13) | (.05) | (.13) | - K | - |
Distributions from net realized gain | - | (.01) | (.06) | (.08) | - |
Total distributions | (.13) | (.07) M | (.20) L | (.08) | - |
Redemption fees added to paid in capital E | - K | - K | - K | - K | .01 |
Net asset value, end of period | $ 14.17 | $ 14.59 | $ 15.14 | $ 15.60 | $ 13.29 |
Total Return B, C, D | (2.00)% | (3.19)% | (1.80)% | 18.04% | 32.90% |
Ratios to Average Net Assets F, J | | | | | |
Expenses before reductions | 1.36% | 1.34% | 1.32% | 1.37% | 1.65% A |
Expenses net of fee waivers, if any | 1.35% | 1.34% | 1.32% | 1.37% | 1.50% A |
Expenses net of all reductions | 1.34% | 1.33% | 1.31% | 1.36% | 1.48% A |
Net investment income (loss) | 1.12% | .80% | .71% | 1.35% H | (.15)% A |
Supplemental Data | | | | | |
Net assets, end of period (000 omitted) | $ 71,293 | $ 99,694 | $ 127,979 | $ 60,370 | $ 15,705 |
Portfolio turnover rate G | 65% | 91% | 71% | 54% | 25% A |
A Annualized
B Total returns for periods of less than one year are not annualized.
C Total returns would have been lower if certain expenses had not been reduced during the applicable periods shown.
D Total returns do not include the effect of the sales charges.
E Calculated based on average shares outstanding during the period.
F Fees and expenses of any underlying Fidelity Central Funds are not included in the Fund's expense ratio. The Fund indirectly bears its proportionate share of the expenses of any underlying Fidelity Central Funds.
G Amount does not include the portfolio activity of any underlying Fidelity Central Funds.
H Investment income per share reflects a large, non-recurring dividend which amounted to $.13 per share. Excluding this non-recurring dividend, the ratio of net investment income (loss) to average net assets would have been .42%.
I For the period March 25, 2009 (commencement of operations) to October 31, 2009.
J Expense ratios reflect operating expenses of the class. Expenses before reductions do not reflect amounts reimbursed by the investment adviser or reductions from brokerage service arrangements or reductions from other expense offset arrangements and do not represent the amount paid by the class during periods when reimbursements or reductions occur. Expense ratios before reductions for start-up periods may not be representative of longer-term operating periods. Expenses net of fee waivers reflect expenses after reimbursement by the investment adviser but prior to reductions from brokerage service arrangements or other expense offset arrangements. Expenses net of all reductions represent the net expenses paid by the class.
K Amount represents less than $.01 per share.
L Total distributions of $.20 per share is comprised of distributions from net investment income of $.133 and distributions from net realized gain of $.062 per share.
M Total distributions of $.07 per share is comprised of distributions from net investment income of $.052 and distributions from net realized gain of $.014 per share.
See accompanying notes which are an integral part of the financial statements.
Annual Report
Financial Highlights - Class T
Years ended October 31, | 2013 | 2012 | 2011 | 2010 | 2009 I |
Selected Per-Share Data | | | | | |
Net asset value, beginning of period | $ 14.54 | $ 15.08 | $ 15.55 | $ 13.27 | $ 10.00 |
Income from Investment Operations | | | | | |
Net investment income (loss) E | .12 | .08 | .07 | .16 H | (.03) |
Net realized and unrealized gain (loss) | (.45) | (.60) | (.38) | 2.19 | 3.29 |
Total from investment operations | (.33) | (.52) | (.31) | 2.35 | 3.26 |
Distributions from net investment income | (.08) | (.01) | (.10) | - | - |
Distributions from net realized gain | - | (.01) | (.06) | (.07) | - |
Total distributions | (.08) | (.02) | (.16) | (.07) | - |
Redemption fees added to paid in capital E | - K | - K | - K | - K | .01 |
Net asset value, end of period | $ 14.13 | $ 14.54 | $ 15.08 | $ 15.55 | $ 13.27 |
Total Return B, C, D | (2.26)% | (3.43)% | (2.09)% | 17.73% | 32.70% |
Ratios to Average Net Assets F, J | | | | | |
Expenses before reductions | 1.62% | 1.61% | 1.60% | 1.63% | 2.04% A |
Expenses net of fee waivers, if any | 1.61% | 1.61% | 1.60% | 1.63% | 1.75% A |
Expenses net of all reductions | 1.60% | 1.60% | 1.59% | 1.61% | 1.73% A |
Net investment income (loss) | .86% | .53% | .43% | 1.10% H | (.40)% A |
Supplemental Data | | | | | |
Net assets, end of period (000 omitted) | $ 12,551 | $ 16,692 | $ 20,831 | $ 11,762 | $ 4,665 |
Portfolio turnover rate G | 65% | 91% | 71% | 54% | 25% A |
A Annualized
B Total returns for periods of less than one year are not annualized.
C Total returns would have been lower if certain expenses had not been reduced during the applicable periods shown.
D Total returns do not include the effect of the sales charges.
E Calculated based on average shares outstanding during the period.
F Fees and expenses of any underlying Fidelity Central Funds are not included in the Fund's expense ratio. The Fund indirectly bears its proportionate share of the expenses of any underlying Fidelity Central Funds.
G Amount does not include the portfolio activity of any underlying Fidelity Central Funds.
H Investment income per share reflects a large, non-recurring dividend which amounted to $.13 per share. Excluding this non-recurring dividend, the ratio of net investment income (loss) to average net assets would have been .17%.
I For the period March 25, 2009 (commencement of operations) to October 31, 2009.
J Expense ratios reflect operating expenses of the class. Expenses before reductions do not reflect amounts reimbursed by the investment adviser or reductions from brokerage service arrangements or reductions from other expense offset arrangements and do not represent the amount paid by the class during periods when reimbursements or reductions occur. Expense ratios before reductions for start-up periods may not be representative of longer-term operating periods. Expenses net of fee waivers reflect expenses after reimbursement by the investment adviser but prior to reductions from brokerage service arrangements or other expense offset arrangements. Expenses net of all reductions represent the net expenses paid by the class.
K Amount represents less than $.01 per share.
See accompanying notes which are an integral part of the financial statements.
Annual Report
Financial Highlights - Class B
Years ended October 31, | 2013 | 2012 | 2011 | 2010 | 2009 I |
Selected Per-Share Data | | | | | |
Net asset value, beginning of period | $ 14.41 | $ 15.00 | $ 15.46 | $ 13.22 | $ 10.00 |
Income from Investment Operations | | | | | |
Net investment income (loss) E | .05 | - K | (.01) | .08 H | (.07) |
Net realized and unrealized gain (loss) | (.45) | (.59) | (.39) | 2.20 | 3.28 |
Total from investment operations | (.40) | (.59) | (.40) | 2.28 | 3.21 |
Distributions from net investment income | - K | - | - | - | - |
Distributions from net realized gain | - | - | (.06) | (.04) | - |
Total distributions | - K | - | (.06) | (.04) | - |
Redemption fees added to paid in capital E | - K | - K | - K | - K | .01 |
Net asset value, end of period | $ 14.01 | $ 14.41 | $ 15.00 | $ 15.46 | $ 13.22 |
Total Return B, C, D | (2.75)% | (3.93)% | (2.62)% | 17.23% | 32.20% |
Ratios to Average Net Assets F, J | | | | | |
Expenses before reductions | 2.11% | 2.10% | 2.11% | 2.16% | 2.66% A |
Expenses net of fee waivers, if any | 2.11% | 2.10% | 2.11% | 2.16% | 2.25% A |
Expenses net of all reductions | 2.10% | 2.10% | 2.10% | 2.15% | 2.23% A |
Net investment income (loss) | .36% | .03% | (.09)% | .56% H | (.90)% A |
Supplemental Data | | | | | |
Net assets, end of period (000 omitted) | $ 2,303 | $ 3,097 | $ 4,324 | $ 4,348 | $ 2,726 |
Portfolio turnover rate G | 65% | 91% | 71% | 54% | 25% A |
A Annualized
B Total returns for periods of less than one year are not annualized.
C Total returns would have been lower if certain expenses had not been reduced during the applicable periods shown.
D Total returns do not include the effect of the contingent deferred sales charge.
E Calculated based on average shares outstanding during the period.
F Fees and expenses of any underlying Fidelity Central Funds are not included in the Fund's expense ratio. The Fund indirectly bears its proportionate share of the expenses of any underlying Fidelity Central Funds.
G Amount does not include the portfolio activity of any underlying Fidelity Central Funds.
H Investment income per share reflects a large, non-recurring dividend which amounted to $.13 per share. Excluding this non-recurring dividend, the ratio of net investment income (loss) to average net assets would have been (.37)%.
I For the period March 25, 2009 (commencement of operations) to October 31, 2009.
J Expense ratios reflect operating expenses of the class. Expenses before reductions do not reflect amounts reimbursed by the investment adviser or reductions from brokerage service arrangements or reductions from other expense offset arrangements and do not represent the amount paid by the class during periods when reimbursements or reductions occur. Expense ratios before reductions for start-up periods may not be representative of longer-term operating periods. Expenses net of fee waivers reflect expenses after reimbursement by the investment adviser but prior to reductions from brokerage service arrangements or other expense offset arrangements. Expenses net of all reductions represent the net expenses paid by the class.
K Amount represents less than $.01 per share.
See accompanying notes which are an integral part of the financial statements.
Annual Report
Financial Highlights - Class C
Years ended October 31, | 2013 | 2012 | 2011 | 2010 | 2009 I |
Selected Per-Share Data | | | | | |
Net asset value, beginning of period | $ 14.37 | $ 14.95 | $ 15.45 | $ 13.22 | $ 10.00 |
Income from Investment Operations | | | | | |
Net investment income (loss) E | .05 | .01 | (.01) | .08 H | (.07) |
Net realized and unrealized gain (loss) | (.44) | (.59) | (.38) | 2.19 | 3.28 |
Total from investment operations | (.39) | (.58) | (.39) | 2.27 | 3.21 |
Distributions from net investment income | (.02) | - | (.05) | - | - |
Distributions from net realized gain | - | - | (.06) | (.04) | - |
Total distributions | (.02) | - | (.11) | (.04) | - |
Redemption fees added to paid in capital E | - K | - K | - K | - K | .01 |
Net asset value, end of period | $ 13.96 | $ 14.37 | $ 14.95 | $ 15.45 | $ 13.22 |
Total Return B, C, D | (2.75)% | (3.88)% | (2.58)% | 17.21% | 32.20% |
Ratios to Average Net Assets F, J | | | | | |
Expenses before reductions | 2.11% | 2.10% | 2.09% | 2.14% | 2.53% A |
Expenses net of fee waivers, if any | 2.11% | 2.10% | 2.09% | 2.14% | 2.25% A |
Expenses net of all reductions | 2.10% | 2.09% | 2.08% | 2.13% | 2.23% A |
Net investment income (loss) | .36% | .03% | (.07)% | .58% H | (.90)% A |
Supplemental Data | | | | | |
Net assets, end of period (000 omitted) | $ 23,830 | $ 31,865 | $ 37,185 | $ 14,338 | $ 4,798 |
Portfolio turnover rate G | 65% | 91% | 71% | 54% | 25% A |
A Annualized
B Total returns for periods of less than one year are not annualized.
C Total returns would have been lower if certain expenses had not been reduced during the applicable periods shown.
D Total returns do not include the effect of the contingent deferred sales charge.
E Calculated based on average shares outstanding during the period.
F Fees and expenses of any underlying Fidelity Central Funds are not included in the Fund's expense ratio. The Fund indirectly bears its proportionate share of the expenses of any underlying Fidelity Central Funds.
G Amount does not include the portfolio activity of any underlying Fidelity Central Funds.
H Investment income per share reflects a large, non-recurring dividend which amounted to $.13 per share. Excluding this non-recurring dividend, the ratio of net investment income (loss) to average net assets would have been (.34)%.
I For the period March 25, 2009 (commencement of operations) to October 31, 2009.
J Expense ratios reflect operating expenses of the class. Expenses before reductions do not reflect amounts reimbursed by the investment adviser or reductions from brokerage service arrangements or reductions from other expense offset arrangements and do not represent the amount paid by the class during periods when reimbursements or reductions occur. Expense ratios before reductions for start-up periods may not be representative of longer-term operating periods. Expenses net of fee waivers reflect expenses after reimbursement by the investment adviser but prior to reductions from brokerage service arrangements or other expense offset arrangements. Expenses net of all reductions represent the net expenses paid by the class.
K Amount represents less than $.01 per share.
See accompanying notes which are an integral part of the financial statements.
Annual Report
Financial Highlights - Global Commodity Stock
Years ended October 31, | 2013 | 2012 | 2011 | 2010 | 2009 H |
Selected Per-Share Data | | | | | |
Net asset value, beginning of period | $ 14.66 | $ 15.21 | $ 15.66 | $ 13.31 | $ 10.00 |
Income from Investment Operations | | | | | |
Net investment income (loss) D | .19 | .15 | .16 | .23 G | .01 |
Net realized and unrealized gain (loss) | (.45) | (.60) | (.39) | 2.21 | 3.29 |
Total from investment operations | (.26) | (.45) | (.23) | 2.44 | 3.30 |
Distributions from net investment income | (.16) | (.08) | (.16) | (.01) | - |
Distributions from net realized gain | - | (.01) | (.06) | (.08) | - |
Total distributions | (.16) | (.10) K | (.22) | (.09) | - |
Redemption fees added to paid in capital D | - J | - J | - J | - J | .01 |
Net asset value, end of period | $ 14.24 | $ 14.66 | $ 15.21 | $ 15.66 | $ 13.31 |
Total Return B, C | (1.75)% | (2.96)% | (1.59)% | 18.38% | 33.10% |
Ratios to Average Net Assets E, I | | | | | |
Expenses before reductions | 1.11% | 1.10% | 1.08% | 1.10% | 1.42% A |
Expenses net of fee waivers, if any | 1.11% | 1.10% | 1.08% | 1.10% | 1.25% A |
Expenses net of all reductions | 1.09% | 1.09% | 1.07% | 1.09% | 1.23% A |
Net investment income (loss) | 1.37% | 1.04% | .95% | 1.62% G | .10% A |
Supplemental Data | | | | | |
Net assets, end of period (000 omitted) | $ 273,476 | $ 387,242 | $ 531,224 | $ 310,186 | $ 159,439 |
Portfolio turnover rate F | 65% | 91% | 71% | 54% | 25% A |
A Annualized
B Total returns for periods of less than one year are not annualized.
C Total returns would have been lower if certain expenses had not been reduced during the applicable periods shown.
D Calculated based on average shares outstanding during the period.
E Fees and expenses of any underlying Fidelity Central Funds are not included in the Fund's expense ratio. The Fund indirectly bears its proportionate share of the expenses of any underlying Fidelity Central Funds.
F Amount does not include the portfolio activity of any underlying Fidelity Central Funds.
G Investment income per share reflects a large, non-recurring dividend which amounted to $.13 per share. Excluding this non-recurring dividend, the ratio of net investment income (loss) to average net assets would have been .69%.
H For the period March 25, 2009 (commencement of operations) to October 31, 2009.
I Expense ratios reflect operating expenses of the class. Expenses before reductions do not reflect amounts reimbursed by the investment adviser or reductions from brokerage service arrangements or reductions from other expense offset arrangements and do not represent the amount paid by the class during periods when reimbursements or reductions occur. Expense ratios before reductions for start-up periods may not be representative of longer-term operating periods. Expenses net of fee waivers reflect expenses after reimbursement by the investment adviser but prior to reductions from brokerage service arrangements or other expense offset arrangements. Expenses net of all reductions represent the net expenses paid by the class.
J Amount represents less than $.01 per share.
K Total distributions of $.10 per share is comprised of distributions from net investment income of $.084 and distributions from net realized gain of $.014 per share.
See accompanying notes which are an integral part of the financial statements.
Annual Report
Financial Highlights - Institutional Class
Years ended October 31, | 2013 | 2012 | 2011 | 2010 | 2009 H |
Selected Per-Share Data | | | | | |
Net asset value, beginning of period | $ 14.67 | $ 15.22 | $ 15.66 | $ 13.31 | $ 10.00 |
Income from Investment Operations | | | | | |
Net investment income (loss) D | .20 | .16 | .16 | .23 G | .01 |
Net realized and unrealized gain (loss) | (.45) | (.60) | (.38) | 2.21 | 3.29 |
Total from investment operations | (.25) | (.44) | (.22) | 2.44 | 3.30 |
Distributions from net investment income | (.18) | (.09) | (.16) | (.01) | - |
Distributions from net realized gain | - | (.01) | (.06) | (.08) | - |
Total distributions | (.18) | (.11) K | (.22) | (.09) | - |
Redemption fees added to paid in capital D | - J | - J | - J | - J | .01 |
Net asset value, end of period | $ 14.24 | $ 14.67 | $ 15.22 | $ 15.66 | $ 13.31 |
Total Return B, C | (1.71)% | (2.90)% | (1.50)% | 18.39% | 33.10% |
Ratios to Average Net Assets E, I | | | | | |
Expenses before reductions | 1.04% | 1.04% | 1.03% | 1.09% | 1.36% A |
Expenses net of fee waivers, if any | 1.04% | 1.04% | 1.03% | 1.09% | 1.25% A |
Expenses net of all reductions | 1.03% | 1.03% | 1.03% | 1.07% | 1.23% A |
Net investment income (loss) | 1.43% | 1.10% | .99% | 1.64% G | .10% A |
Supplemental Data | | | | | |
Net assets, end of period (000 omitted) | $ 31,613 | $ 50,540 | $ 58,925 | $ 35,739 | $ 9,811 |
Portfolio turnover rate F | 65% | 91% | 71% | 54% | 25% A |
A Annualized
B Total returns for periods of less than one year are not annualized.
C Total returns would have been lower if certain expenses had not been reduced during the applicable periods shown.
D Calculated based on average shares outstanding during the period.
E Fees and expenses of any underlying Fidelity Central Funds are not included in the Fund's expense ratio. The Fund indirectly bears its proportionate share of the expenses of any underlying Fidelity Central Funds.
F Amount does not include the portfolio activity of any underlying Fidelity Central Funds.
G Investment income per share reflects a large, non-recurring dividend which amounted to $.13 per share. Excluding this non-recurring dividend, the ratio of net investment income (loss) to average net assets would have been .71%.
H For the period March 25, 2009 (commencement of operations) to October 31, 2009.
I Expense ratios reflect operating expenses of the class. Expenses before reductions do not reflect amounts reimbursed by the investment adviser or reductions from brokerage service arrangements or reductions from other expense offset arrangements and do not represent the amount paid by the class during periods when reimbursements or reductions occur. Expense ratios before reductions for start-up periods may not be representative of longer-term operating periods. Expenses net of fee waivers reflect expenses after reimbursement by the investment adviser but prior to reductions from brokerage service arrangements or other expense offset arrangements. Expenses net of all reductions represent the net expenses paid by the class.
J Amount represents less than $.01 per share.
K Total distributions of $.11 per share is comprised of distributions from net investment income of $.093 and distributions from net realized gain of $.014 per share.
See accompanying notes which are an integral part of the financial statements.
Annual Report
Notes to Financial Statements
For the period ended October 31, 2013
1. Organization.
Fidelity Global Commodity Stock Fund (the Fund) is a non-diversified fund of Fidelity Investment Trust (the Trust) and is authorized to issue an unlimited number of shares. The Trust is registered under the Investment Company Act of 1940, as amended (the 1940 Act), as an open-end management investment company organized as a Massachusetts business trust. The Fund offers Class A, Class T, Class C, Global Commodity Stock and Institutional Class shares, each of which, along with Class B shares, has equal rights as to assets and voting privileges. Class B shares are closed to new accounts and additional purchases, except for exchanges and reinvestments. Each class has exclusive voting rights with respect to matters that affect that class. Class B shares will automatically convert to Class A shares after a holding period of seven years from the initial date of purchase. The Fund's investments in emerging markets can be subject to social, economic, regulatory, and political uncertainties and can be extremely volatile.
2. Investments in Fidelity Central Funds.
The Fund invests in Fidelity Central Funds, which are open-end investment companies generally available only to other investment companies and accounts managed by Fidelity Management & Research Company (FMR) and its affiliates. The Fund's Schedule of Investments lists each of the Fidelity Central Funds held as of period end, if any, as an investment of the Fund, but does not include the underlying holdings of each Fidelity Central Fund. As an Investing Fund, the Fund indirectly bears its proportionate share of the expenses of the underlying Fidelity Central Funds.
The Money Market Central Funds seek preservation of capital and current income and are managed by Fidelity Investments Money Management, Inc. (FIMM), an affiliate of FMR.
A complete unaudited list of holdings for each Fidelity Central Fund is available upon request or at the Securities and Exchange Commission (the SEC) website at www.sec.gov. In addition, the financial statements of the Fidelity Central Funds, which are not covered by the Fund's Report of Independent Registered Public Accounting Firm, are available on the SEC website or upon request.
3. Significant Accounting Policies.
The financial statements have been prepared in conformity with accounting principles generally accepted in the United States of America (GAAP), which require management to make certain estimates and assumptions at the date of the financial statements. Actual results could differ from those estimates. Subsequent events, if any, through the date that the financial statements were issued have been evaluated in the preparation of
Annual Report
3. Significant Accounting Policies - continued
the financial statements. The following summarizes the significant accounting policies of the Fund:
Investment Valuation. Investments are valued as of 4:00 p.m. Eastern time on the last calendar day of the period. In accordance with valuation policies and procedures approved by the Board of Trustees (the Board), the Fund attempts to obtain prices from one or more third party pricing vendors or brokers to value its investments. When current market prices, quotations or currency exchange rates are not readily available or reliable, investments will be fair valued in good faith by the FMR Fair Value Committee (the Committee), in accordance with procedures adopted by the Board. Factors used in determining fair value vary by investment type and may include market or investment specific events. The frequency with which these procedures are used cannot be predicted and they may be utilized to a significant extent. The Committee oversees the Fund's valuation policies and procedures and is responsible for approving and reporting to the Board all fair value determinations.
The Fund categorizes the inputs to valuation techniques used to value its investments into a disclosure hierarchy consisting of three levels as shown below:
Level 1 - quoted prices in active markets for identical investments
Level 2 - other significant observable inputs (including quoted prices for similar investments, interest rates, prepayment speeds, etc.)
Level 3 - unobservable inputs (including the Fund's own assumptions based on the best information available)
Valuation techniques used to value the Fund's investments by major category are as follows:
Equity securities, including restricted securities, for which market quotations are readily available, are valued at the last reported sale price or official closing price as reported by a third party pricing vendor on the primary market or exchange on which they are traded and are categorized as Level 1 in the hierarchy. In the event there were no sales during the day or closing prices are not available, securities are valued at the last quoted bid price or may be valued using the last available price and are generally categorized as Level 2 in the hierarchy. For foreign equity securities, when market or security specific events arise, comparisons to the valuation of American Depositary Receipts (ADRs), futures contracts, Exchange-Traded Funds (ETFs) and certain indexes as well as quoted prices for similar securities may be used and would be categorized as Level 2 in the hierarchy. Utilizing these techniques may result in transfers between Level 1 and Level 2. For equity securities, including restricted securities, where observable inputs are
Annual Report
Notes to Financial Statements - continued
3. Significant Accounting Policies - continued
Investment Valuation - continued
limited, assumptions about market activity and risk are used and these securities may be categorized as Level 3 in the hierarchy.
Investments in open-end mutual funds, including the Fidelity Central Funds, are valued at their closing net asset value (NAV) each business day and are categorized as Level 1 in the hierarchy.
Changes in valuation techniques may result in transfers in or out of an assigned level within the disclosure hierarchy. The aggregate value of investments by input level, as of October 31, 2013, including information on transfers between Levels 1 and 2, is included at the end of the Fund's Schedule of Investments.
Foreign Currency. The Fund may use foreign currency contracts to facilitate transactions in foreign-denominated securities. Gains and losses from these transactions may arise from changes in the value of the foreign currency or if the counterparties do not perform under the contracts' terms.
Foreign-denominated assets, including investment securities, and liabilities are translated into U.S. dollars at the exchange rates at period end. Purchases and sales of investment securities, income and dividends received and expenses denominated in foreign currencies are translated into U.S. dollars at the exchange rate in effect on the transaction date.
The effects of exchange rate fluctuations on investments are included with the net realized and unrealized gain (loss) on investment securities. Other foreign currency transactions resulting in realized and unrealized gain (loss) are disclosed separately.
Investment Transactions and Income. For financial reporting purposes, the Fund's investment holdings and NAV include trades executed through the end of the last business day of the period. The NAV per share for processing shareholder transactions is calculated as of the close of business of the New York Stock Exchange (NYSE), normally 4:00 p.m. Eastern time and includes trades executed through the end of the prior business day. Gains and losses on securities sold are determined on the basis of identified cost and may include proceeds received from litigation. Dividend income is recorded on the ex-dividend date, except for certain dividends from foreign securities where the ex-dividend date may have passed, which are recorded as soon as the Fund is informed of the ex-dividend date. Non-cash dividends included in dividend income, if any, are recorded at the fair market value of the securities received. Distributions received on securities that represent a return of capital or capital gain are recorded as a reduction of cost of investments and/or as a realized gain. Subsequent to ex-dividend date the Fund determines the components of these distributions, based upon receipt of tax filings or
Annual Report
3. Significant Accounting Policies - continued
Investment Transactions and Income - continued
other correspondence relating to the underlying investment. Interest income and distributions from the Fidelity Central Funds are accrued as earned. Investment income is recorded net of foreign taxes withheld where recovery of such taxes is uncertain.
Class Allocations and Expenses. Investment income, realized and unrealized capital gains and losses, common expenses of the Fund, and certain fund-level expense reductions, if any, are allocated daily on a pro-rata basis to each class based on the relative net assets of each class to the total net assets of the Fund. Each class differs with respect to transfer agent and distribution and service plan fees incurred. Certain expense reductions may also differ by class. For the reporting period, the allocated portion of income and expenses to each class as a percent of its average net assets may vary due to the timing of recording these transactions in relation to fluctuating net assets of the classes. Expenses directly attributable to a fund are charged to that fund. Expenses attributable to more than one fund are allocated among the respective funds on the basis of relative net assets or other appropriate methods. Expense estimates are accrued in the period to which they relate and adjustments are made when actual amounts are known.
Income Tax Information and Distributions to Shareholders. Each year, the Fund intends to qualify as a regulated investment company under Subchapter M of the Internal Revenue Code, including distributing substantially all of its taxable income and realized gains. As a result, no provision for U.S. Federal income taxes is required. As of October 31, 2013, the Fund did not have any unrecognized tax benefits in the financial statements; nor is the Fund aware of any tax positions for which it is reasonably possible that the total amounts of unrecognized tax benefits will significantly change in the next twelve months. The Fund files a U.S. federal tax return, in addition to state and local tax returns as required. The Fund's federal income tax returns are subject to examination by the Internal Revenue Service (IRS) for a period of three fiscal years after they are filed. State and local tax returns may be subject to examination for an additional fiscal year depending on the jurisdiction. Foreign taxes are provided for based on the Fund's understanding of the tax rules and rates that exist in the foreign markets in which it invests.
Distributions are declared and recorded on the ex-dividend date. Income dividends and capital gain distributions are declared separately for each class. Income and capital gain distributions are determined in accordance with income tax regulations, which may differ from GAAP. In addition, the Fund claimed a portion of the payment made to redeeming shareholders as a distribution for income tax purposes.
Annual Report
Notes to Financial Statements - continued
3. Significant Accounting Policies - continued
Income Tax Information and Distributions to Shareholders - continued
Capital accounts within the financial statements are adjusted for permanent book-tax differences. These adjustments have no impact on net assets or the results of operations. Temporary book-tax differences will reverse in a subsequent period.
Book-tax differences are primarily due to foreign currency transactions, passive foreign investment companies (PFIC), partnerships, capital loss carryforwards and losses deferred due to wash sales.
The federal tax cost of investment securities and unrealized appreciation (depreciation) as of period end were as follows:
Gross unrealized appreciation | $ 30,185,400 |
Gross unrealized depreciation | (86,132,208) |
Net unrealized appreciation (depreciation) on securities and other investments | $ (55,946,808) |
| |
Tax Cost | $ 476,266,118 |
The tax-based components of distributable earnings as of period end were as follows:
Undistributed ordinary income | $ 4,627,021 |
Capital loss carryforward | $ (35,236,790) |
Net unrealized appreciation (depreciation) | $ (55,935,844) |
Capital loss carryforwards are only available to offset future capital gains of the Fund to the extent provided by regulations and may be limited. Under the Regulated Investment Company Modernization Act of 2010 (the Act), the Fund is permitted to carry forward capital losses incurred in taxable years beginning after December 22, 2010 for an unlimited period and such capital losses are required to be used prior to any losses that expire. The capital loss carryforward information presented below, including any applicable limitation, is estimated as of fiscal period end and is subject to adjustment.
Fiscal year of expiration | |
2019 | $ (6,952,413) |
No expiration | |
Short-term | (22,719,124) |
Long-term | (5,565,253) |
Total no expiration | (28,284,377) |
Total capital loss carryforward | $ (35,236,790) |
Annual Report
3. Significant Accounting Policies - continued
Income Tax Information and Distributions to Shareholders - continued
The tax character of distributions paid was as follows:
| October 31, 2013 | October 31, 2012 |
Ordinary Income | $ 5,697,049 | $ 4,364,384 |
Short-Term Trading (Redemption) Fees. Shares held by investors in the Fund less than 30 days may have been subject to a redemption fee equal to 1.00% of the net asset value of shares redeemed. All redemption fees, which reduce the proceeds of the shareholder redemption, are retained by the Fund and accounted for as an addition to paid in capital.
Restricted Securities. The Fund may invest in securities that are subject to legal or contractual restrictions on resale. These securities generally may be resold in transactions exempt from registration or to the public if the securities are registered. Disposal of these securities may involve time-consuming negotiations and expense, and prompt sale at an acceptable price may be difficult. Information regarding restricted securities is included at the end of the Fund's Schedule of Investments.
4. Purchases and Sales of Investments.
Purchases and sales of securities, other than short-term securities, aggregated $311,798,862 and $462,703,874, respectively.
5. Fees and Other Transactions with Affiliates.
Management Fee. FMR and its affiliates provide the Fund with investment management related services for which the Fund pays a monthly management fee. The management fee is the sum of an individual fund fee rate that is based on an annual rate of .45% of the Fund's average net assets and an annualized group fee rate that averaged .25% during the period. The group fee rate is based upon the average net assets of all the mutual funds advised by FMR, including any mutual funds previously advised by FMR that are currently advised by Fidelity SelectCo, LLC, an affiliate of FMR. The group fee rate decreases as assets under management increase and increases as assets under management decrease. For the reporting period, the total annual management fee rate was .71% of the Fund's average net assets.
Distribution and Service Plan Fees. In accordance with Rule 12b-1 of the 1940 Act, the Fund has adopted separate Distribution and Service Plans for each class of shares. Certain classes pay Fidelity Distributors Corporation (FDC), an affiliate of FMR, separate Distribution and Service Fees, each of which is based on an annual percentage of each class' average net assets. In addition, FDC may pay financial intermediaries for
Annual Report
Notes to Financial Statements - continued
5. Fees and Other Transactions with Affiliates - continued
Distribution and Service Plan Fees - continued
selling shares of the Fund and providing shareholder support services. For the period, the Distribution and Service Fee rates, total fees and amounts retained by FDC were as follows:
| Distribution
Fee | Service
Fee | Total Fees | Retained
by FDC |
Class A | -% | .25% | $ 208,174 | $ 2,543 |
Class T | .25% | .25% | 69,496 | 436 |
Class B | .75% | .25% | 26,532 | 19,956 |
Class C | .75% | .25% | 269,653 | 34,543 |
| | | $ 573,855 | $ 57,478 |
Sales Load. FDC may receive a front-end sales charge of up to 5.75% for selling Class A shares and 3.50% for selling Class T shares, some of which is paid to financial intermediaries for selling shares of the Fund. Depending on the holding period, FDC may receive contingent deferred sales charges levied on Class A, Class T, Class B, and Class C redemptions. The deferred sales charges range from 5.00% to 1.00% for Class B shares, 1.00% for Class C shares, 1.00% for certain purchases of Class A shares and .25% for certain purchases of Class T shares.
For the period, sales charge amounts retained by FDC were as follows:
| Retained
by FDC |
Class A | $ 27,444 |
Class T | 2,976 |
Class B* | 7,373 |
Class C* | 3,342 |
| $ 41,135 |
* When Class B and Class C shares are initially sold, FDC pays commissions from its own resources to financial intermediaries through which the sales
are made.
Transfer Agent Fees. Fidelity Investments Institutional Operations Company, Inc., (FIIOC), an affiliate of FMR, is the transfer, dividend disbursing and shareholder servicing agent for each class of the Fund. FIIOC receives account fees and asset-based fees that vary according to the account size and type of account of the shareholders of the respective classes of the Fund. FIIOC pays for typesetting, printing and mailing of shareholder reports, except proxy statements.
Annual Report
5. Fees and Other Transactions with Affiliates - continued
Transfer Agent Fees - continued
For the period, transfer agent fees for each class were as follows:
| Amount | % of
Average
Net Assets |
Class A | $ 246,621 | .30 |
Class T | 42,562 | .31 |
Class B | 7,942 | .30 |
Class C | 81,004 | .30 |
Global Commodity Stock | 944,581 | .30 |
Institutional Class | 100,298 | .23 |
| $ 1,423,008 | |
Accounting and Security Lending Fees. Fidelity Service Company, Inc. (FSC), an affiliate of FMR, maintains the Fund's accounting records. The accounting fee is based on the level of average net assets for each month. Under a separate contract, FSC administers the security lending program. The security lending fee is based on the number and duration of lending transactions.
Brokerage Commissions. The Fund placed a portion of its portfolio transactions with brokerage firms which are affiliates of the investment adviser. Brokerage commissions are included in net realized gain (loss) and change in net unrealized appreciation (depreciation) in the Statement of Operations. The commissions paid to these affiliated firms were $19,771 for the period.
Interfund Lending Program. Pursuant to an Exemptive Order issued by the SEC, the Fund, along with other registered investment companies having management contracts with FMR, may participate in an interfund lending program. This program provides an alternative credit facility allowing the funds to borrow from, or lend money to, other participating affiliated funds. At period end, there were no interfund loans outstanding. The Fund's activity in this program during the period for which loans were outstanding was as follows:
Borrower or Lender | Average Loan
Balance | Weighted Average
Interest Rate | Interest
Expense |
Borrower | $ 3,605,577 | .41% | $ 1,065 |
6. Committed Line of Credit.
The Fund participates with other funds managed by FMR or an affiliate in a $4.25 billion credit facility (the "line of credit") to be utilized for temporary or emergency purposes to fund shareholder redemptions or for other short-term liquidity purposes. The Fund has
Annual Report
Notes to Financial Statements - continued
6. Committed Line of Credit - continued
agreed to pay commitment fees on its pro-rata portion of the line of credit, which amounted to $1,125 and is reflected in Miscellaneous expenses on the Statement of Operations. During the period, there were no borrowings on this line of credit.
7. Security Lending.
The Fund lends portfolio securities through a lending agent from time to time in order to earn additional income. For equity securities, a lending agent is used and may loan securities to certain qualified borrowers, including Fidelity Capital Markets (FCM), a broker-dealer affiliated with the Fund. On the settlement date of the loan, the Fund receives collateral (in the form of U.S. Treasury obligations, letters of credit and/or cash) against the loaned securities and maintains collateral in an amount not less than 100% of the market value of the loaned securities during the period of the loan. The market value of the loaned securities is determined at the close of business of the Fund and any additional required collateral is delivered to the Fund on the next business day. If the borrower defaults on its obligation to return the securities loaned because of insolvency or other reasons, the Fund may apply collateral received from the borrower against the obligation. The Fund may experience delays and costs in recovering the securities loaned. Any cash collateral received is invested in the Fidelity Securities Lending Cash Central Fund. The value of loaned securities and cash collateral at period end are disclosed on the Fund's Statement of Assets and Liabilities. At period end, there were no security loans outstanding with FCM. Security lending income represents the income earned on investing cash collateral, less rebates paid to borrowers and any lending agent fees associated with the loan, plus any premium payments received for lending certain types of securities. Security lending income is presented in the Statement of Operations as a component of income from Fidelity Central Funds. Total security lending income during the period amounted to $554,965, including $24,917 from securities loaned to FCM.
8. Bank Borrowings.
The Fund is permitted to have bank borrowings for temporary or emergency purposes to fund shareholder redemptions or for other short-term liquidity requirements. The Fund has established borrowing arrangements with certain banks. The interest rate on the borrowings is the bank's base rate, as revised from time to time. The average loan balance during the period for which loans were outstanding amounted to $1,129,500. The weighted average interest rate was .65%. The interest expense amounted to $41 under the bank borrowing program. At period end, there were no bank borrowings outstanding.
Annual Report
9. Expense Reductions.
Commissions paid to certain brokers with whom FMR, or its affiliates, places trades on behalf of the Fund include an amount in addition to trade execution, which may be rebated back to the Fund to offset certain expenses. This amount totaled $62,291 for the period.
In addition, FMR reimbursed a portion of the Fund's operating expenses during the period in the amount of $7,144.
10. Distributions to Shareholders.
Distributions to shareholders of each class were as follows:
Years ended October 31, | 2013 | 2012 |
From net investment income | | |
Class A | $ 864,701 | $ 437,422 |
Class T | 89,063 | 12,232 |
Class B | 847 | - |
Class C | 32,277 | - |
Global Commodity Stock | 4,073,304 | 2,878,965 |
Institutional Class | 636,857 | 364,302 |
Total | $ 5,697,049 | $ 3,692,921 |
From net realized gain | | |
Class A | $ - | $ 117,768 |
Class T | - | 19,027 |
Global Commodity Stock | - | 479,827 |
Institutional Class | - | 54,841 |
Total | $ - | $ 671,463 |
11. Share Transactions.
Transactions for each class of shares were as follows:
| Shares | Dollars |
Years ended October 31, | 2013 | 2012 | 2013 | 2012 |
Class A | | | | |
Shares sold | 1,201,755 | 1,675,922 | $ 16,769,552 | $ 24,194,276 |
Reinvestment of distributions | 52,559 | 32,805 | 744,754 | 472,060 |
Shares redeemed | (3,054,897) | (3,329,384) | (42,479,556) | (47,357,051) |
Net increase (decrease) | (1,800,583) | (1,620,657) | $ (24,965,250) | $ (22,690,715) |
Class T | | | | |
Shares sold | 130,604 | 189,622 | $ 1,791,142 | $ 2,764,209 |
Reinvestment of distributions | 5,824 | 1,948 | 82,471 | 28,015 |
Shares redeemed | (396,060) | (424,718) | (5,490,961) | (6,023,857) |
Net increase (decrease) | (259,632) | (233,148) | $ (3,617,348) | $ (3,231,633) |
Annual Report
Notes to Financial Statements - continued
11. Share Transactions - continued
| Shares | Dollars |
Years ended October 31, | 2013 | 2012 | 2013 | 2012 |
Class B | | | | |
Shares sold | 7,047 | 7,831 | $ 98,902 | $ 113,787 |
Reinvestment of distributions | 54 | - | 758 | - |
Shares redeemed | (57,569) | (81,206) | (793,852) | (1,157,702) |
Net increase (decrease) | (50,468) | (73,375) | $ (694,192) | $ (1,043,915) |
Class C | | | | |
Shares sold | 368,295 | 492,632 | $ 5,059,285 | $ 7,143,884 |
Reinvestment of distributions | 1,963 | - | 27,576 | - |
Shares redeemed | (880,659) | (761,541) | (12,048,987) | (10,673,957) |
Net increase (decrease) | (510,401) | (268,909) | $ (6,962,126) | $ (3,530,073) |
Global Commodity Stock | | | | |
Shares sold | 5,296,700 | 7,606,851 | $ 74,369,495 | $ 109,989,271 |
Reinvestment of distributions | 264,635 | 210,059 | 3,760,465 | 3,031,159 |
Shares redeemed | (12,764,042) | (16,330,927) | (177,408,171) | (233,733,610) |
Net increase (decrease) | (7,202,707) | (8,514,017) | $ (99,278,211) | $ (120,713,180) |
Institutional Class | | | | |
Shares sold | 1,153,936 | 1,589,148 | $ 16,235,437 | $ 22,944,496 |
Reinvestment of distributions | 25,953 | 18,526 | 368,529 | 267,335 |
Shares redeemed | (2,405,021) | (2,034,602) | (33,510,048) | (28,631,896) |
Net increase (decrease) | (1,225,132) | (426,928) | $ (16,906,082) | $ (5,420,065) |
12. Other.
The Fund's organizational documents provide former and current trustees and officers with a limited indemnification against liabilities arising in connection with the performance of their duties to the Fund. In the normal course of business, the Fund may also enter into contracts that provide general indemnifications. The Fund's maximum exposure under these arrangements is unknown as this would be dependent on future claims that may be made against the Fund. The risk of material loss from such claims is considered remote.
At the end of the period, FMR or its affiliates were the owners of record of 10% of the total outstanding shares of the Fund.
Annual Report
To the Trustees of Fidelity Investment Trust and the Shareholders of Fidelity Global Commodity Stock Fund:
In our opinion, the accompanying statement of assets and liabilities, including the schedule of investments, and the related statements of operations and of changes in net assets and the financial highlights present fairly, in all material respects, the financial position of Fidelity Global Commodity Stock Fund (a fund of Fidelity Investment Trust) at October 31, 2013, the results of its operations for the year then ended, the changes in its net assets for each of the two years in the period then ended and the financial highlights for each of the periods indicated, in conformity with accounting principles generally accepted in the United States of America. These financial statements and financial highlights (hereafter referred to as "financial statements") are the responsibility of the Fidelity Global Commodity Stock Fund's management. Our responsibility is to express an opinion on these financial statements based on our audits. We conducted our audits of these financial statements in accordance with the standards of the Public Company Accounting Oversight Board (United States). Those standards require that we plan and perform the audit to obtain reasonable assurance about whether the financial statements are free of material misstatement. An audit includes examining, on a test basis, evidence supporting the amounts and disclosures in the financial statements, assessing the accounting principles used and significant estimates made by management, and evaluating the overall financial statement presentation. We believe that our audits, which included confirmation of securities at October 31, 2013 by correspondence with the custodian and brokers, provide a reasonable basis for our opinion.
PricewaterhouseCoopers LLP
Boston, Massachusetts
December 13, 2013
Annual Report
The Trustees, Member of the Advisory Board, and executive officers of the trust and fund, as applicable, are listed below. The Board of Trustees governs the fund and is responsible for protecting the interests of shareholders. The Trustees are experienced executives who meet periodically throughout the year to oversee the fund's activities, review contractual arrangements with companies that provide services to the fund, oversee management of the risks associated with such activities and contractual arrangements, and review the fund's performance. Except for James C. Curvey, Ned C. Lautenbach, Ronald P. O'Hanley, and William S. Stavropoulos, each of the Trustees oversees 171 funds. Mr. Curvey oversees 394 funds. Mr. O'Hanley, Mr. Lautenbach, and Mr. Stavropoulos each oversees 245 funds.
The Trustees hold office without limit in time except that (a) any Trustee may resign; (b) any Trustee may be removed by written instrument, signed by at least two-thirds of the number of Trustees prior to such removal; (c) any Trustee who requests to be retired or who has become incapacitated by illness or injury may be retired by written instrument signed by a majority of the other Trustees; and (d) any Trustee may be removed at any special meeting of shareholders by a two-thirds vote of the outstanding voting securities of the trust. Each Trustee who is not an interested person of the trust and the fund (as defined in the 1940 Act) (Independent Trustee), shall retire not later than the last day of the calendar year in which his or her 75th birthday occurs. The Independent Trustees may waive this mandatory retirement age policy with respect to individual Trustees. The executive officers and Advisory Board Member hold office without limit in time, except that any officer and Advisory Board Member may resign or may be removed by a vote of a majority of the Trustees at any regular meeting or any special meeting of the Trustees. Except as indicated, each individual has held the office shown or other offices in the same company for the past five years.
Experience, Skills, Attributes, and Qualifications of the Fund's Trustees. The Governance and Nominating Committee has adopted a statement of policy that describes the experience, qualifications, attributes, and skills that are necessary and desirable for potential Independent Trustee candidates (Statement of Policy). The Board believes that each Trustee satisfied at the time he or she was initially elected or appointed a Trustee, and continues to satisfy, the standards contemplated by the Statement of Policy. The Governance and Nominating Committee also engages professional search firms to help identify potential Independent Trustee candidates who have the experience, qualifications, attributes, and skills consistent with the Statement of Policy. From time to time, additional criteria based on the composition and skills of the current Independent Trustees, as well as experience or skills that may be appropriate in light of future changes to board composition, business conditions, and regulatory or other developments, have also been considered by the professional search firms and the Governance and Nominating Committee. In addition, the Board takes into account the Trustees' commitment and participation in Board and committee meetings, as well as their leadership of standing and ad hoc committees throughout their tenure.
Annual Report
In determining that a particular Trustee was and continues to be qualified to serve as a Trustee, the Board has considered a variety of criteria, none of which, in isolation, was controlling. The Board believes that, collectively, the Trustees have balanced and diverse experience, qualifications, attributes, and skills, which allow the Board to operate effectively in governing the fund and protecting the interests of shareholders. Information about the specific experience, skills, attributes, and qualifications of each Trustee, which in each case led to the Board's conclusion that the Trustee should serve (or continue to serve) as a trustee of the fund, is provided below.
Board Structure and Oversight Function. James C. Curvey is an interested person (as defined in the 1940 Act) and currently serves as Chairman. The Trustees have determined that an interested Chairman is appropriate and benefits shareholders because an interested Chairman has a personal and professional stake in the quality and continuity of services provided to the fund. Independent Trustees exercise their informed business judgment to appoint an individual of their choosing to serve as Chairman, regardless of whether the Trustee happens to be independent or a member of management. The Independent Trustees have determined that they can act independently and effectively without having an Independent Trustee serve as Chairman and that a key structural component for assuring that they are in a position to do so is for the Independent Trustees to constitute a substantial majority for the Board. The Independent Trustees also regularly meet in executive session. Ned C. Lautenbach serves as Chairman of the Independent Trustees and as such (i) acts as a liaison between the Independent Trustees and management with respect to matters important to the Independent Trustees and (ii) with management prepares agendas for Board meetings.
Fidelity funds are overseen by different Boards of Trustees. The fund's Board oversees Fidelity's equity and high income funds and another Board oversees Fidelity's investment-grade bond, money market, and asset allocation funds. The asset allocation funds may invest in Fidelity funds overseen by the fund's Board. The use of separate Boards, each with its own committee structure, allows the Trustees of each group of Fidelity funds to focus on the unique issues of the funds they oversee, including common research, investment, and operational issues. On occasion, the separate Boards establish joint committees to address issues of overlapping consequences for the Fidelity funds overseen by each Board.
The Trustees operate using a system of committees to facilitate the timely and efficient consideration of all matters of importance to the Trustees, the fund, and fund shareholders and to facilitate compliance with legal and regulatory requirements and oversight of the fund's activities and associated risks. The Board, acting through its committees, has charged FMR and its affiliates with (i) identifying events or circumstances the occurrence of which could have demonstrably adverse effects on the fund's business and/or reputation; (ii) implementing processes and controls to lessen the possibility that such events or circumstances occur or to mitigate the effects of such events or circumstances if they do occur; and (iii) creating and maintaining a system designed to evaluate continuously business and market conditions in order to facilitate the identification and implementation processes described in (i) and (ii) above. Because the day-to-day operations and activities of the fund are carried out by or through FMR, its affiliates and other service providers, the fund's exposure to risks is mitigated but not eliminated by the processes overseen by the Trustees. While each of the Board's committees has responsibility for overseeing different aspects of the fund's activities, oversight is exercised primarily through the Operations, Audit, and Compliance Committees. In addition, the Independent Trustees have worked with FMR to enhance the Board's oversight of investment and financial risks, legal and regulatory risks, technology risks, and operational risks, including the development of additional risk reporting to the Board. For example, a working group comprised of Independent Trustees and FMR has worked and continues to work to review the Fidelity funds' valuation-related activities, reporting and risk management. Appropriate personnel, including but not limited to the fund's Chief Compliance Officer (CCO), FMR's internal auditor, the independent accountants, the fund's Treasurer and portfolio management personnel, make periodic reports to the Board's committees, as appropriate, including an annual review of FMR's risk management program for the Fidelity funds. The responsibilities of each standing committee, including their oversight responsibilities, are described further under "Standing Committees of the Fund's Trustees."
Annual Report
Trustees and Officers - continued
The fund's Statement of Additional Information (SAI) includes more information about the Trustees. To request a free copy, call Fidelity at 1-800-544-8544.
Interested Trustees*:
Correspondence intended for each Trustee who is an interested person may be sent to Fidelity Investments, 245 Summer Street, Boston, Massachusetts 02210.
Name, Year of Birth; Principal Occupations and Other Relevant Experience+ |
James C. Curvey (1935) |
Year of Election or Appointment: 2007 Trustee Chairman of the Board of Trustees |
| Mr. Curvey also serves as Trustee of other Fidelity funds. Mr. Curvey is a Director of Fidelity Investments Money Management, Inc. (2009-present), Director of Fidelity Research & Analysis Co. (2009-present) and Director of FMR and FMR Co., Inc. (2007-present). Mr. Curvey is also Vice Chairman (2007-present) and Director of FMR LLC. In addition, Mr. Curvey serves as an Overseer for the Boston Symphony Orchestra and a member of the Trustees of Villanova University. Previously, Mr. Curvey was the Vice Chairman (2006-2007) and Director (2000-2007) of FMR Corp. |
Ronald P. O'Hanley (1957) |
Year of Election or Appointment: 2011 Trustee |
| Mr. O'Hanley also serves as Trustee of other Fidelity funds. He is Director of Fidelity SelectCo, LLC (2013-present), FMR Co., Inc. (2010-present), Director of Fidelity Investments Money Management, Inc. (2010-present), Director of Fidelity Research & Analysis Company (2010-present), President of Fidelity Asset Management and Corporate Services and a Member of Fidelity's Executive Committee (2010-present). Previously, Mr. O'Hanley served as President and Chief Executive Officer of BNY Mellon Asset Management (2007-2010). Mr. O'Hanley also served as Vice Chairman of Bank New York Mellon Corp. and a member of that firm's Executive Committee. Prior to the 2007 merger of The Bank of New York and Mellon Financial Corporation, he was Vice Chairman of Mellon Financial Corporation and President and Chief Executive Officer of Mellon Asset Management. He joined Mellon in February 1997. Mr. O'Hanley currently serves as Chairman of the Boston Public Library Foundation Board of Directors and sits on the Board of Directors of Beth Israel Deaconess Medical Center, the Board of Trustees of the Marine Biological Laboratory and the Advisory Board of the Maxwell School of Citizenship and Public Administration at Syracuse University. Mr. O'Hanley also chairs the Council on Asset Management for the Financial Services Roundtable and is a member of the Board of Directors of Institutional Investor's U.S. Institute. |
* Trustees have been determined to be "Interested Trustees" by virtue of, among other things, their affiliation with the trust or various entities under common control with FMR.
+ The information above includes each Trustee's principal occupation during the last five years and other information relating to the experience, attributes, and skills relevant to each Trustee's qualifications to serve as a Trustee, which led to the conclusion that each Trustee should serve as a Trustee for the fund.
Annual Report
Trustees and Officers - continued
Independent Trustees:
Correspondence intended for each Independent Trustee (that is, the Trustees other than the Interested Trustees) may be sent to Fidelity Investments, P.O. Box 55235, Boston, Massachusetts 02205-5235.
Name, Year of Birth; Principal Occupations and Other Relevant Experience+ |
Dennis J. Dirks (1948) |
Year of Election or Appointment: 2005 Trustee |
| Mr. Dirks also serves as Trustee of other Fidelity funds. Prior to his retirement in May 2003, Mr. Dirks was Chief Operating Officer and a member of the Board of The Depository Trust & Clearing Corporation (DTCC). He also served as President, Chief Operating Officer, and Board member of The Depository Trust Company (DTC) and President and Board member of the National Securities Clearing Corporation (NSCC). In addition, Mr. Dirks served as Chief Executive Officer and Board member of the Government Securities Clearing Corporation, Chief Executive Officer and Board member of the Mortgage-Backed Securities Clearing Corporation, as a Trustee and a member of the Finance Committee of Manhattan College (2005-2008), and as a Trustee and a member of the Finance Committee of AHRC of Nassau County (2006-2008). Mr. Dirks is a member of the Independent Directors Council (IDC) Governing Council (2010-present) and Board of Directors for The Brookville Center for Children's Services, Inc. (2009-present). |
Alan J. Lacy (1953) |
Year of Election or Appointment: 2008 Trustee |
| Mr. Lacy also serves as Trustee of other Fidelity funds. Mr. Lacy serves as Senior Adviser (2007-present) of Oak Hill Capital Partners, L.P. (private equity). Mr. Lacy also served as Chief Executive Officer (2000-2005) and Vice Chairman (2005-2006) of Sears Holdings Corporation and Sears, Roebuck and Co. (retail). In addition, Mr. Lacy serves as a member of the Board of Directors of Dave & Buster's Entertainment, Inc. (restaurant and entertainment complexes, 2010-present), Earth Fare, Inc. (retail grocery, 2012-present), The Hillman Companies, Inc. (hardware wholesalers, 2010-present), and Bristol-Myers Squibb Company (global pharmaceuticals, 2008-present). Mr. Lacy is a member of the Board of Trustees of The National Parks Conservation Association (2006-present). Previously, Mr. Lacy served as Chairman of the Board of Trustees of the National Parks Conservation Association (2008-2011) and as a member of the Board of Directors for the Western Union Company (global money transfer, 2006-2011). |
Ned C. Lautenbach (1944) |
Year of Election or Appointment: 2000 Trustee Chairman of the Independent Trustees |
| Mr. Lautenbach also serves as Trustee of other Fidelity funds. Mr. Lautenbach currently serves as the Lead Director of the Eaton Corporation Board of Directors (diversified industrial, 1997-present). Mr. Lautenbach is Chairman of the Board of Directors of the Philharmonic Center for the Arts in Naples, Florida (2012-present) and a member of the Council on Foreign Relations (1994-present). Previously, Mr. Lautenbach was a Partner/Advisory Partner at Clayton, Dubilier & Rice, LLC (private equity investment, 1998-2010), as well as a Director of Sony Corporation (2006-2007). |
Joseph Mauriello (1944) |
Year of Election or Appointment: 2008 Trustee |
| Mr. Mauriello also serves as Trustee of other Fidelity funds. Prior to his retirement in January 2006, Mr. Mauriello served in numerous senior management positions including Deputy Chairman and Chief Operating Officer (2004-2005), and Vice Chairman of Financial Services (2002-2004) of KPMG LLP US (professional services, 1965-2005). Mr. Mauriello currently serves as a member of the Board of Directors of XL Group plc. (global insurance and re-insurance, 2006-present). Previously, Mr. Mauriello served as a Director of the Hamilton Funds of the Bank of New York (2006-2007) and of Arcadia Resources Inc. (health care services and products, 2007-2012). |
Robert W. Selander (1950) |
Year of Election or Appointment: 2011 Trustee |
| Mr. Selander also serves as Trustee of other Fidelity funds. Previously, Mr. Selander served as a Member of the Advisory Board of other Fidelity funds (2011), and Executive Vice Chairman (2010), Chief Executive Officer (2009-2010), and President and Chief Executive Officer (1997-2009) of Mastercard, Inc. |
Cornelia M. Small (1944) |
Year of Election or Appointment: 2005 Trustee |
| Ms. Small also serves as Trustee of other Fidelity funds. Ms. Small is a member of the Board of Directors (2009-present) and Chair of the Investment Committee (2010-present) of the Teagle Foundation. Ms. Small also serves on the Investment Committee of the Berkshire Taconic Community Foundation (2008-present). Previously, Ms. Small served as Chairperson (2002-2008) and a member of the Investment Committee and Chairperson (2008-2012) and a member of the Board of Trustees of Smith College. In addition, Ms. Small served as Chief Investment Officer, Director of Global Equity Investments, and a member of the Board of Directors of Scudder, Stevens & Clark and Scudder Kemper Investments. |
William S. Stavropoulos (1939) |
Year of Election or Appointment: 2001 Trustee Vice Chairman of the Independent Trustees |
| Mr. Stavropoulos also serves as Trustee of other Fidelity funds. Mr. Stavropoulos serves as President and Founder of the Michigan Baseball Foundation, the Great Lakes Loons (2007-present). Mr. Stavropoulos is Chairman Emeritus of the Board of Directors of The Dow Chemical Company, where he previously served in numerous senior management positions, including President, CEO (1995-2000; 2002-2004), Chairman of the Executive Committee (2000-2006), and as a member of the Board of Directors (1990-2006). Currently, Mr. Stavropoulos is Chairman of the Board of Directors of Univar Inc. (global distributor of commodity and specialty chemicals), a Director of Teradata Corporation (data warehousing and technology solutions), and Maersk Inc. (industrial conglomerate), and a member of the Advisory Board for Metalmark Capital LLC (private equity investment, 2005-present). Mr. Stavropoulos is an operating advisor to Clayton, Dubilier & Rice, LLC (private equity investment). In addition, Mr. Stavropoulos is a member of the University of Notre Dame Advisory Council for the College of Science, a Trustee of the Rollin L. Gerstacker Foundation, and a Director of the Naples Philharmonic Center for the Arts. Previously, Mr. Stavropoulos served as a Director of Chemical Financial Corporation (bank holding company, 1993-2012) and Tyco International, Ltd. (multinational manufacturing and services, 2007-2012). |
David M. Thomas (1949) |
Year of Election or Appointment: 2008 Trustee |
| Mr. Thomas also serves as Trustee of other Fidelity funds. Mr. Thomas serves as Non-Executive Chairman of the Board of Directors of Fortune Brands Home and Security (home and security products, 2011-present), and as a member of the Board of Directors of Interpublic Group of Companies, Inc. (marketing communication, 2004-present). Previously, Mr. Thomas served as Executive Chairman (2005-2006) and Chairman and Chief Executive Officer (2000-2005) of IMS Health, Inc. (pharmaceutical and healthcare information solutions), and a Director of Fortune Brands, Inc. (consumer products, 2000-2011). |
+ The information above includes each Trustee's principal occupation during the last five years and other information relating to the experience, attributes, and skills relevant to each Trustee's qualifications to serve as a Trustee, which led to the conclusion that each Trustee should serve as a Trustee for the fund.
Advisory Board Member and Executive Officers:
Correspondence intended for each executive officer and Peter S. Lynch may be sent to Fidelity Investments, 245 Summer Street, Boston, Massachusetts 02210. Executive officers appear below in alphabetical order.
Name, Year of Birth; Principal Occupation |
Peter S. Lynch (1944) |
Year of Election or Appointment: 2003 Member of the Advisory Board |
| Mr. Lynch also serves as Member of the Advisory Board of other Fidelity funds. Mr. Lynch is Vice Chairman and a Director of FMR and FMR Co., Inc. In addition, Mr. Lynch serves as a Trustee of Boston College and as the Chairman of the Inner-City Scholarship Fund. Previously, Mr. Lynch served on the Special Olympics International Board of Directors (1997-2006). |
Elizabeth Paige Baumann (1968) |
Year of Election or Appointment: 2012 Anti-Money Laundering (AML) Officer |
| Ms. Baumann also serves as AML Officer of other funds. She is Chief AML Officer of FMR LLC (2012-present) and is an employee of Fidelity Investments. Previously, Ms. Baumann served as Vice President and Deputy Anti-Money Laundering Officer (2007-2012). |
William C. Coffey (1969) |
Year of Election or Appointment: 2009 Assistant Secretary |
| Mr. Coffey also serves as Assistant Secretary of other funds. He is Senior Vice President and Deputy General Counsel of FMR LLC (2010-present), and is an employee of Fidelity Investments. Previously, Mr. Coffey served as Vice President and Associate General Counsel of FMR LLC (2005-2009). |
Jonathan Davis (1968) |
Year of Election or Appointment: 2010 Assistant Treasurer |
| Mr. Davis also serves as Assistant Treasurer of other funds. Mr. Davis is an employee of Fidelity Investments. Previously, Mr. Davis served as Vice President and Associate General Counsel of FMR LLC (2003-2010). |
Adrien E. Deberghes (1967) |
Year of Election or Appointment: 2008 Deputy Treasurer |
| Mr. Deberghes also serves as an officer of other funds. He is an employee of Fidelity Investments (2008-present). Prior to joining Fidelity Investments, Mr. Deberghes was Senior Vice President of Mutual Fund Administration at State Street Corporation (2007-2008), Senior Director of Mutual Fund Administration at Investors Bank & Trust (2005-2007), and Director of Finance for Dunkin' Brands (2000-2005). |
Stephanie J. Dorsey (1969) |
Year of Election or Appointment: 2010 Assistant Treasurer |
| Ms. Dorsey also serves as an officer of other funds. She is an employee of Fidelity Investments (2008-present) and has served in other fund officer roles. Prior to joining Fidelity Investments, Ms. Dorsey served as Treasurer (2004-2008) of the JPMorgan Mutual Funds and Vice President (2004-2008) of JPMorgan Chase Bank. |
Scott C. Goebel (1968) |
Year of Election or Appointment: 2008 Secretary and Chief Legal Officer (CLO) |
| Mr. Goebel serves as Secretary and CLO of other funds. Mr. Goebel also serves as Secretary of Fidelity Investments Money Management, Inc. (FIMM) (2010-present) and Fidelity Research and Analysis Company (FRAC) (2010-present); General Counsel, Secretary, and Senior Vice President of FMR (2008-present) and FMR Co., Inc. (2008-present); Chief Legal Officer of Fidelity Management & Research (Hong Kong) Limited (2008-present) and Assistant Secretary of Fidelity Management & Research (Japan) Inc. (2008-present), and Fidelity Management & Research (U.K.) Inc. (2008-present). Previously, Mr. Goebel served as Secretary and CLO of other Fidelity funds (2008-2013), Assistant Secretary of FIMM (2008-2010), FRAC (2008-2010), and certain funds (2007-2008); and as Vice President and Secretary of Fidelity Distributors Corporation (FDC) (2005-2007). Mr. Goebel has been employed by FMR LLC or an affiliate since 2001. |
Joseph A. Hanlon (1968) |
Year of Election or Appointment: 2012 Chief Compliance Officer |
| Mr. Hanlon also serves as Chief Compliance Officer of other funds. Mr. Hanlon serves as Compliance Officer of FMR, FMR Co., Inc., Fidelity Investments Money Management, Inc. (FIMM), Fidelity Research and Analysis Company (FRAC), and Fidelity Management & Research (Hong Kong) (2009-present), as Senior Vice President of the Fidelity Asset Management Division (2009-present), and is an employee of Fidelity Investments. Previously, Mr. Hanlon served as Compliance Officer of Fidelity Management & Research (Japan) Inc. (2009-2013), Strategic Advisers, Inc. (2009-2013), and Fidelity Management & Research (U.K.) Inc. (2009-2013). |
Bruce T. Herring (1965) |
Year of Election or Appointment: 2006 Vice President of certain Equity Funds |
| Mr. Herring also serves as Vice President of other funds. He serves as Chief Investment Officer of Fidelity Global Asset Allocation (GAA) (2013-present), Chief Investment Officer and Director of Fidelity Management & Research (U.K.) Inc. (2010-present), Group Chief Investment Officer of FMR, and President of Fidelity Research & Analysis Company (2010-present). Previously, Mr. Herring served as Vice President (2005-2006) and Senior Vice President (2006-2007) of Fidelity Management & Research Company, Vice President of FMR Co., Inc. (2001-2007), and as a portfolio manager for Fidelity U.S. Equity Funds. |
Brian B. Hogan (1964) |
Year of Election or Appointment: 2009 Vice President |
| Mr. Hogan also serves as Vice President of other funds. Mr. Hogan serves as President of FMR's Equity Division (2009-present). Previously, Mr. Hogan served as Senior Vice President, Equity Research of FMR (2006-2009) and as a portfolio manager. |
Chris Maher (1972) |
Year of Election or Appointment: 2013 Assistant Treasurer |
| Mr. Maher serves as Assistant Treasurer of other funds. Mr. Maher is Vice President of Valuation Oversight and is an employee of Fidelity Investments. Previously, Mr. Maher served as Vice President of Asset Management Compliance (2013), Vice President of FMR's Program Management Group (2010-2013), and Vice President of Valuation Oversight (2008-2010). |
Christine Reynolds (1958) |
Year of Election or Appointment: 2008 Chief Financial Officer |
| Ms. Reynolds also serves as Chief Financial Officer of other funds. Ms. Reynolds became President of Fidelity Pricing and Cash Management Services (FPCMS) in August 2008. Ms. Reynolds served as Chief Operating Officer of FPCMS (2007-2008). Previously, Ms. Reynolds served as President, Treasurer, and Anti-Money Laundering officer of the Fidelity funds (2004-2007). |
Kenneth B. Robins (1969) |
Year of Election or Appointment: 2008 President and Treasurer |
| Mr. Robins also serves as an officer of other funds. Mr. Robins serves as Executive Vice President of Fidelity Investments Money Management, Inc. (FIMM) (2013-present) and is an employee of Fidelity Investments (2004-present). Previously, Mr. Robins served in other fund officer roles. |
Gary W. Ryan (1958) |
Year of Election or Appointment: 2005 Assistant Treasurer |
| Mr. Ryan also serves as Assistant Treasurer of other funds. Mr. Ryan is an employee of Fidelity Investments and has served in other fund officer roles. Previously, Mr. Ryan served as Vice President of Fund Reporting in Fidelity Pricing and Cash Management Services (FPCMS) (1999-2005). |
Stephen Sadoski (1971) |
Year of Election or Appointment: 2012 Deputy Treasurer |
| Mr. Sadoski also serves as Deputy Treasurer of other funds. He is an employee of Fidelity Investments (2012-present) and has served in another fund officer role. Prior to joining Fidelity Investments, Mr. Sadoski served as an assistant chief accountant in the Division of Investment Management of the Securities and Exchange Commission (SEC) (2009-2012) and as a senior manager at Deloitte & Touche LLP (1997-2009). |
Stacie M. Smith (1974) |
Year of Election or Appointment: 2013 Deputy Treasurer |
| Ms. Smith also serves as an officer of other funds. She is an employee of Fidelity Investments (2009-present) and has served in other fund officer roles. Prior to joining Fidelity Investments, Ms. Smith served as Senior Audit Manager of Ernst & Young LLP (1996-2009). |
Renee Stagnone (1975) |
Year of Election or Appointment: 2013 Deputy Treasurer |
| Ms. Stagnone also serves as Deputy Treasurer of other funds. Ms. Stagnone is an employee of Fidelity Investments. |
Joseph F. Zambello (1957) |
Year of Election or Appointment: 2011 Deputy Treasurer |
| Mr. Zambello also serves as Deputy Treasurer of other funds. Mr. Zambello is an employee of Fidelity Investments. Previously, Mr. Zambello served as Vice President of FMR's Program Management Group (2009-2011) and Vice President of the Transfer Agent Oversight Group (2005-2009). |
Annual Report
The Board of Trustees of Fidelity Global Commodity Stock Fund voted to pay to shareholders of record at the opening of business on record date, the following distributions per share derived from capital gains realized from sales of portfolio securities, and dividends derived from net investment income:
| Pay Date | Record Date | Dividends | Capital Gains |
Fidelity Global Commodity Stock Fund | 12/09/13 | 12/06/13 | $0.188 | $0.013 |
The fund designates 58% of the dividend distributed during the fiscal year as qualifying for the dividends-received deduction for corporate shareholders.
The fund designates 100%of the dividend distributed during the fiscal year as amounts which may be taken into account as a dividend for the purposes of the maximum rate under section 1(h)(11) of the Internal Revenue Code.
The amounts per share which represent income derived from sources within, and taxes paid to, foreign countries or possessions of the United States are as follows:
| Pay Date | Income | Taxes |
Fidelity Global Commodity Stock Fund | 12/10/12 | $0.171 | $0.0105 |
The fund will notify shareholders in January 2014 of amounts for use in preparing 2013 income tax returns.
Annual Report
Board Approval of Investment Advisory Contracts and Management Fees
Fidelity Global Commodity Stock Fund
Each year, the Board of Trustees, including the Independent Trustees (together, the Board), votes on the renewal of the management contract and sub-advisory agreements (together, the Advisory Contracts) for the fund. The Board, assisted by the advice of fund counsel and Independent Trustees' counsel, requests and considers a broad range of information relevant to the renewal of the Advisory Contracts throughout the year.
The Board meets regularly and, at each of its meetings, covers an extensive agenda of topics and materials and considers factors that are relevant to its annual consideration of the renewal of the fund's Advisory Contracts, including the services and support provided to the fund and its shareholders. The Board has established various standing committees, each composed of and chaired by Independent Trustees with varying backgrounds, to which the Board has assigned specific subject matter responsibilities in order to enhance effective decision-making by the Board. The Board, acting directly and through its Committees, requests and receives information concerning the annual consideration of the renewal of the fund's Advisory Contracts. The Board also meets as needed to consider matters specifically related to the Board's annual consideration of the renewal of Advisory Contracts. Members of the Board may also meet with trustees of other Fidelity funds through ad hoc joint committees to discuss certain matters relevant to the Fidelity funds.
At its July 2013 meeting, the Board, including the Independent Trustees, unanimously determined to renew the fund's Advisory Contracts. In reaching its determination, the Board considered all factors it believed relevant, including (i) the nature, extent, and quality of the services to be provided to the fund and its shareholders (including the investment performance of the fund); (ii) the competitiveness of the fund's management fee and total expense ratio relative to peer funds; (iii) the total costs of the services to be provided by and the profits to be realized by Fidelity from its relationship with the fund; (iv) the extent to which economies of scale exist and would be realized as the fund grows; and (v) whether fee levels reflect these economies of scale, if any, for the benefit of fund shareholders.
In considering whether to renew the Advisory Contracts for the fund, the Board reached a determination, with the assistance of fund counsel and Independent Trustees' counsel and through the exercise of its business judgment, that the renewal of the Advisory Contracts was in the best interests of the fund and its shareholders and that the compensation payable under the Advisory Contracts was fair and reasonable. The Board's decision to renew the Advisory Contracts was not based on any single factor, but rather was based on a comprehensive consideration of all the information provided to the Board at its meetings throughout the year. The Board, in reaching its determination to renew the Advisory Contracts, was aware that shareholders in the fund have a broad range of investment choices available to them, including a wide choice among mutual funds offered by Fidelity's competitors, and that the fund's shareholders, who have the opportunity to review and weigh the disclosure provided by the fund in its prospectus and other public disclosures, have chosen to invest in this fund, which is a part of the Fidelity family of funds.
Annual Report
Board Approval of Investment Advisory Contracts and
Management Fees - continued
Nature, Extent, and Quality of Services Provided. The Board considered the staffing within the investment adviser, Fidelity Management & Research Company (FMR), and the sub-advisers (together, the Investment Advisers) as it relates to the fund, including the backgrounds of the fund's investment personnel, and also considered the fund's investment objective, strategies, and related investment philosophy. The Independent Trustees also had discussions with senior management of Fidelity's investment operations and investment groups. The Board considered the structure of the portfolio manager compensation program and whether this structure provides appropriate incentives to act in the best interests of the fund.
Resources Dedicated to Investment Management and Support Services. The Board and the Fund Oversight and Research Committees reviewed the general qualifications and capabilities of the Investment Advisers' investment staff, including its size, education, experience, and resources, as well as the Investment Advisers' approach to recruiting, training, managing, and compensating investment personnel. The Board noted that FMR has continued to increase the resources devoted to non-U.S. offices, including expansion of Fidelity's global investment organization. The Board also noted that Fidelity's analysts have extensive resources, tools and capabilities that allow them to conduct sophisticated quantitative and fundamental analysis, as well as credit analysis of issuers, counterparties and guarantors. Further, the Board believes that Fidelity's investment professionals have sufficient access to global information and data so as to provide competitive investment results over time, and that those professionals also have access to sophisticated tools that permit them to assess portfolio construction and risk and performance attribution characteristics continuously, as well as to transmit new information and research conclusions rapidly around the world. Additionally, in its deliberations, the Board considered the Investment Advisers' trading and risk management capabilities and resources, which are an integral part of the investment management process.
Shareholder and Administrative Services. The Board considered (i) the nature, extent, quality, and cost of advisory, administrative, and shareholder services performed by the Investment Advisers and their affiliates under the Advisory Contracts and under separate agreements covering transfer agency, pricing and bookkeeping, and securities lending services for the fund; (ii) the nature and extent of the supervision of third party service providers, principally custodians and subcustodians; and (iii) the resources devoted to, and the record of compliance with, the fund's compliance policies and procedures. The Board also reviewed the allocation of fund brokerage, including allocations to brokers affiliated with the Investment Advisers, the use of brokerage commissions to pay fund expenses, and the use of "soft" commission dollars to pay for research services.
Annual Report
The Board noted that the growth of fund assets over time across the complex allows Fidelity to reinvest in the development of services designed to enhance the value or convenience of the Fidelity funds as investment vehicles. These services include 24-hour access to account information and market information through telephone representatives and over the Internet, investor education materials and asset allocation tools, and the expanded availability of Fidelity Investor Centers.
Investment in a Large Fund Family. The Board considered the benefits to shareholders of investing in a Fidelity fund, including the benefits of investing in a fund that is part of a large family of funds offering a variety of investment disciplines and providing a large variety of mutual fund investor services. The Board noted that Fidelity had taken, or had made recommendations that resulted in the Fidelity funds taking, a number of actions over the previous year that benefited particular funds, including (i) continuing to dedicate additional resources to investment research and to the support of the senior management team that oversees asset management; (ii) persisting in efforts to enhance Fidelity's global research capabilities; (iii) launching new funds and making other enhancements to meet client needs for global and income-oriented solutions; (iv) continuing to launch dedicated lower cost underlying funds to meet portfolio construction needs related to expanding underlying fund options for Fidelity funds of funds, specifically for the Freedom Fund product lines; (v) rationalizing product lines and gaining increased efficiencies through the mergers of several funds into other funds; (vi) strengthening Fidelity's index fund offerings by reducing investment minimums and adopting or lowering existing expense caps for certain funds and classes; (vii) enhancing Global Asset Allocation product offerings by launching new funds and strategies, including "open architecture" target date funds that utilize affiliated and unaffiliated sub-advisers; (viii) modifying the eligibility criteria for Institutional Class shares of Advisor funds to increase their marketability to a portion of the defined contribution plan market; (ix) creating a new low-cost retirement share class for certain Advisor funds to appeal to large retirement plans; (x) transitioning the management of certain Fidelity commodity funds to Geode Capital Management LLC, a registered commodity pool operator, while retaining administrative responsibilities for the funds; (xi) reorganizing a number of funds; and (xii) taking steps toward establishing a new Fidelity adviser to manage sector-based funds and products.
Investment Performance. The Board considered whether the fund has operated in accordance with its investment objective, as well as its record of compliance with its investment restrictions and its performance history.
The Board took into account discussions with the Investment Advisers about fund investment performance that occur at Board meetings throughout the year. In this regard the Board noted that as part of regularly scheduled fund reviews and other reports to the Board on fund performance, the Board periodically considers annualized return information for the fund, for different time periods, measured against a securities market index ("benchmark index") and a peer group of mutual funds with similar objectives ("peer group"). In its evaluation of fund investment performance, the Board gave particular attention to information indicating changes in performance of certain Fidelity funds for specific time periods and the Investment Advisers' explanations for any overperformance or underperformance.
Annual Report
Board Approval of Investment Advisory Contracts and
Management Fees - continued
In addition to reviewing absolute and relative fund performance, the Independent Trustees periodically consider the appropriateness of fund performance metrics in evaluating the results achieved. In general, the Independent Trustees believe that fund performance should be evaluated based on net performance (after fees and expenses) of both the highest performing and lowest performing classes, where applicable, compared to appropriate benchmark indices, over appropriate time periods which may include full market cycles, and compared to peer groups, as applicable, over the same periods, taking into account relevant factors including the following: general market conditions; issuer-specific information; tactical opportunities for investment; and fund cash flows and other factors.
The Independent Trustees recognize that shareholders evaluate performance on a net basis over their own holding periods, for which one-, three-, and five-year periods are used as a proxy. For this reason, the performance information reviewed by the Board also included net cumulative calendar year total return information for the fund and an appropriate benchmark index for the most recent one- and three-year periods, as shown below. A peer group comparison is not shown below.
Annual Report
Fidelity Global Commodity Stock Fund
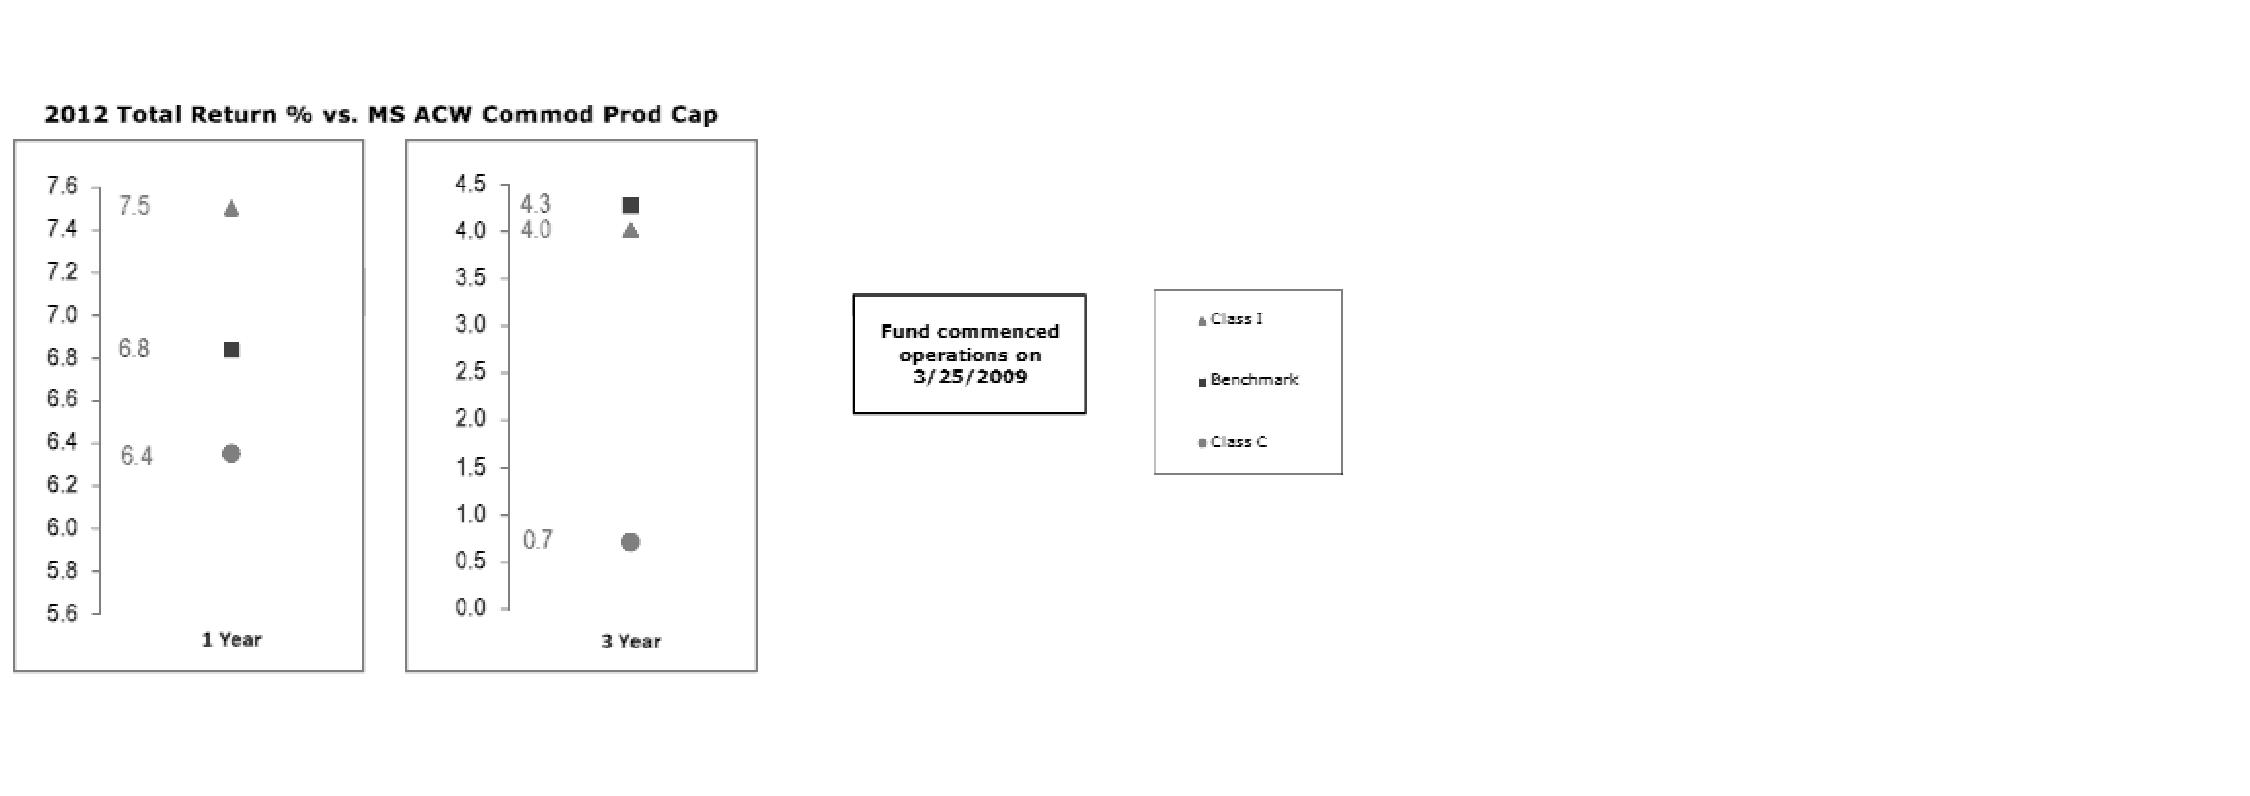
Based on its review, the Board concluded that the nature, extent, and quality of services provided to the fund under the Advisory Contracts should benefit the fund's shareholders.
Competitiveness of Management Fee and Total Expense Ratio. The Board considered the fund's management fee and total expense ratio compared to "mapped groups" of competitive funds and classes. Fidelity creates "mapped groups" by combining similar Lipper investment objective categories that have comparable management fee characteristics. Combining Lipper investment objective categories aids the Board's management fee and total expense ratio comparisons by broadening the competitive group used for comparison and by reducing the number of universes to which various Fidelity funds are compared.
Management Fee. The Board considered two proprietary management fee comparisons for the 12-month (or shorter) periods shown in the chart below. The group of Lipper funds used by the Board for management fee comparisons is referred to below as the "Total Mapped Group." The Total Mapped Group comparison focuses on a fund's standing in terms of gross management fees before expense reimbursements or caps relative to the total universe of funds with comparable investment mandates, regardless of whether their management fee structures also are comparable. Funds with comparable investment mandates offer exposure to similar types of securities. Funds with comparable management fee structures have similar management fee contractual arrangements (e.g., flat rate charged for advisory services, all-inclusive fee rate, etc.). "TMG %" represents the percentage of funds in the Total Mapped Group that had management fees that were lower than the fund's. For example, a TMG % of 31% means that 69% of the funds in the Total Mapped Group had higher management fees than the fund. The "Asset-Size Peer Group" (ASPG) comparison focuses on a fund's standing relative to a subset of non-Fidelity funds within the Total Mapped Group that are similar in size and management fee structure. The ASPG represents at least 15% of the funds in the Total Mapped Group with comparable asset size and management fee structures, subject to a minimum of 50 funds (or all funds in the Total Mapped Group if fewer than 50). Additional information, such as the ASPG quartile in which the fund's management fee ranked, is also included in the chart and considered by the Board.
Annual Report
Board Approval of Investment Advisory Contracts and
Management Fees - continued
Fidelity Global Commodity Stock Fund

The Board noted that the fund's management fee ranked below the median of its Total Mapped Group and below the median of its ASPG for 2012.
Based on its review, the Board concluded that the fund's management fee is fair and reasonable in light of the services that the fund receives and the other factors considered.
Total Expense Ratio. In its review of each class's total expense ratio, the Board considered the fund's management fee as well as other fund or class expenses, as applicable, such as transfer agent fees, pricing and bookkeeping fees, fund-paid 12b-1 fees, and custodial, legal, and audit fees. The Board also noted the effects of any waivers and reimbursements on fees and expenses. As part of its review, the Board also considered the current and historical total expense ratios of each class of the fund compared to competitive fund median expenses. Each class of the fund is compared to those funds and classes in the Total Mapped Group (used by the Board for management fee comparisons) that have a similar sales load structure.
Annual Report
The Board noted that the total expense ratio of each of Class A, Class C, Institutional Class, and the retail class ranked below its competitive median for 2012, the total expense ratio of Class B ranked equal to its competitive median for 2012, and the total expense ratio of Class T ranked above its competitive median for 2012. The Board considered that, in general, various factors can affect total expense ratios. The Board noted that the total expense ratio of Class T was above the competitive median primarily because of higher 12b-1 fees on Class T. Class T has a higher 12b-1 fee, but a lower front-end sales charge, than traditionally priced front-end sales charge classes. The Board considered that Class T is primarily sold load-waived in the retirement plan market where its 0.50% 12b-1 fee is comparable to competing no-load, higher 12b-1 fee classes designed specifically for retirement plans. The Board noted that the fund offers multiple classes, each of which has a different sales load and 12b-1 fee structure, and that the multiple structures are intended to offer a range of pricing options for the intermediary market. The Board also noted that the total expense ratios of the classes vary primarily by the level of their 12b-1 fees, although differences in transfer agent fees may also cause expenses to vary from class to class.
Fees Charged to Other Fidelity Clients. The Board also considered Fidelity fee structures and other information with respect to clients of FMR and its affiliates, such as other mutual funds advised or subadvised by FMR or its affiliates, pension plan clients, and other institutional clients. The Board noted the findings of the 2013 ad hoc joint committee (created with the board of other Fidelity funds), which reviewed and compared Fidelity's institutional investment advisory business with its business of providing services to the Fidelity funds, including the differences in services provided, fees charged, and costs incurred, as well as competition in their respective marketplaces.
Based on its review of total expense ratios and fees charged to other Fidelity clients, the Board concluded that the total expense ratio of each class of the fund was reasonable, although Class T was above the median of the universe presented for comparison, in light of the services that the fund and its shareholders receive and the other factors considered.
Costs of the Services and Profitability. The Board considered the revenues earned and the expenses incurred by Fidelity in conducting the business of developing, marketing, distributing, managing, administering and servicing the fund and servicing the fund's shareholders. The Board also considered the level of Fidelity's profits in respect of all the Fidelity funds.
On an annual basis, FMR presents to the Board Fidelity's profitability for the fund. Fidelity calculates the profitability for each fund, as well as aggregate profitability for groups of Fidelity funds and all Fidelity funds, using a series of detailed revenue and cost allocation methodologies which originate with the books and records of Fidelity on which Fidelity's audited financial statements are based. The Audit Committee of the Board reviews any significant changes from the prior year's methodologies.
Annual Report
Board Approval of Investment Advisory Contracts and
Management Fees - continued
PricewaterhouseCoopers LLP (PwC), independent registered public accounting firm and auditor to Fidelity and certain Fidelity funds, has been engaged annually by the Board as part of the Board's assessment of Fidelity's profitability analysis. PwC's engagement includes the review and assessment of the methodologies used by Fidelity in determining the revenues and expenses attributable to Fidelity's mutual fund business, and completion of agreed-upon procedures surrounding the mathematical accuracy of fund profitability and its conformity to allocation methodologies. After considering PwC's reports issued under the engagement and information provided by Fidelity, the Board concluded that while other allocation methods may also be reasonable, Fidelity's profitability methodologies are reasonable in all material respects.
The Board also reviewed Fidelity's non-fund businesses and fall-out benefits related to the mutual fund business as well as cases where Fidelity's affiliates may benefit from or be related to the fund's business.
The Board considered the costs of the services provided by and the profits realized by Fidelity in connection with the operation of the fund and was satisfied that the profitability was not excessive in the circumstances.
Economies of Scale. The Board considered whether there have been economies of scale in respect of the management of the Fidelity funds, whether the Fidelity funds (including the fund) have appropriately benefited from any such economies of scale, and whether there is potential for realization of any further economies of scale. The Board considered the extent to which the fund will benefit from economies of scale through increased services to the fund, through waivers or reimbursements, or through fee or expense reductions. The Board also noted that in 2009, it and the board of other Fidelity funds created an ad hoc committee (the Economies of Scale Committee) to analyze whether FMR attains economies of scale in respect of the management and servicing of the Fidelity funds, whether the Fidelity funds have appropriately benefited from such economies of scale, and whether there is potential for realization of any further economies of scale.
The Board recognized that the fund's management contract incorporates a "group fee" structure, which provides for lower group fee rates as total fund assets under FMR's management increase, and for higher group fee rates as total fund assets under FMR's management decrease. FMR calculates the group fee rates based on a tiered asset "breakpoint" schedule that varies based on asset class. The Board considered that the group fee is designed to deliver the benefits of economies of scale to fund shareholders when total Fidelity fund assets increase, even if assets of any particular fund are unchanged or have declined, because some portion of Fidelity's costs are attributable to services provided to all Fidelity funds, and all funds benefit if those costs can be allocated among more assets. The Board concluded that, given the group fee structure, fund shareholders will benefit from lower management fees as assets under FMR's management increase at the fund complex level, regardless of whether Fidelity achieves any such economies of scale.
Annual Report
The Board concluded, taking into account the analysis of the Economies of Scale Committee, that economies of scale, if any, are being appropriately shared between fund shareholders and Fidelity.
Amendment to Description of Group Fee Rate. At its July 2013 meeting, the Board voted to approve an amendment to the fund's management contract to modify the description of the "group fee rate" effective August 1, 2013. The Board noted that under the prior description in the contract, the group fee rate was based on the average net assets of all registered investment companies with which FMR has management contracts. Under the contract's tiered asset breakpoint schedule, the group fee rate is lower as total fund assets under FMR's management increase, and higher as total fund assets under FMR's management decrease. The Board considered that the prior description would have excluded the assets of 64 Fidelity sector funds from the group fee rate calculation once Fidelity SelectCo, LLC, an affiliate of FMR, assumed management responsibilities for those funds. The Board noted that modifying the description of the group fee rate to continue to include the assets of those 64 funds for purposes of determining group fee rate breakpoints would avoid an immediate adverse impact on the group fee rate for any fund.
Additional Information Requested by the Board. In order to develop fully the factual basis for consideration of the Fidelity funds' Advisory Contracts, the Board requested and received additional information on certain topics, including: (i) fund performance trends and Fidelity's long-term strategies for certain funds; (ii) the potential to further rationalize the Fidelity fund lineup with the possibility of achieving savings for the funds and Fidelity; (iii) the methodology with respect to competitive fund data and peer group classifications; (iv) the arrangements with, and performance of, certain sub-advisers on behalf of the Fidelity funds, as well as certain proposed participating affiliate arrangements; (v) the realization of fall-out benefits in certain Fidelity business units; (vi) Fidelity's group fee structures, including the rationale for the individual fee rates of certain categories of funds and the definition of group assets; (vii) trends regarding industry use of performance fee structures and the performance adjustment methodologies applicable to the Fidelity funds; (viii) additional competitive analysis regarding the total expenses for certain classes; and (ix) fund profitability methodology, including Fidelity's cost allocation methodology, and the impact of certain factors on fund profitability results.
Annual Report
Board Approval of Investment Advisory Contracts and
Management Fees - continued
Based on its evaluation of all of the conclusions noted above, and after considering all factors it believed relevant, the Board ultimately concluded that the advisory fee structures are fair and reasonable, and that the fund's Advisory Contracts should be renewed.
Annual Report
Investment Adviser
Fidelity Management & Research Company
Boston, MA
Investment Sub-Advisers
FMR Co., Inc.
Fidelity Management &
Research (U.K.) Inc.
FIL Investments (Japan) Limited
FIL Investment Advisors
FIL Investment Advisors
(U.K.) Limited
Fidelity Management & Research
(Hong Kong) Limited
Fidelity Management & Research
(Japan) Inc.
General Distributor
Fidelity Distributors Corporation
Smithfield, RI
Transfer and Service Agents
Fidelity Investments Institutional
Operations Company, Inc.
Boston, MA
Fidelity Service Company, Inc.
Boston, MA
Custodian
State Street Bank and Trust Company
Quincy, MA
The Fidelity Telephone Connection
Mutual Fund 24-Hour Service
Exchanges/Redemptions
and Account Assistance 1-800-544-6666
Product Information 1-800-544-6666
Retirement Accounts 1-800-544-4774
(8 a.m. - 9 p.m.)
TDD Service 1-800-544-0118
for the deaf and hearing impaired
(9 a.m. - 9 p.m. Eastern time)
Fidelity Automated Service
Telephone (FAST®)
1-800-544-5555
Automated line for quickest service
(Fidelity Investment logo)(registered trademark)
Corporate Headquarters
245 Summer St., Boston, MA 02210
www.fidelity.com
GCS-UANN-1213
1.879379.104
(Fidelity Investment logo)(registered trademark)
Fidelity Advisor®
Global Commodity Stock
Fund - Class A, Class T, Class B
and Class C
Annual Report
October 31, 2013
(Fidelity Cover Art)
Class A, Class T, Class B,
and Class C are classes
of Fidelity® Global Commodity
Stock Fund
Contents
Performance | (Click Here) | How the fund has done over time. |
Management's Discussion of Fund Performance | (Click Here) | The Portfolio Manager's review of fund performance and strategy. |
Shareholder Expense Example | (Click Here) | An example of shareholder expenses. |
Investment Changes | (Click Here) | A summary of major shifts in the fund's investments over the past six months. |
Investments | (Click Here) | A complete list of the fund's investments with their market values. |
Financial Statements | (Click Here) | Statements of assets and liabilities, operations, and changes in net assets, as well as financial highlights. |
Notes | (Click Here) | Notes to the financial statements. |
Report of Independent Registered Public Accounting Firm | (Click Here) | |
Trustees and Officers | (Click Here) | |
Distributions | (Click Here) | |
Board Approval of Investment Advisory Contracts and Management Fees | (Click Here) | |
To view a fund's proxy voting guidelines and proxy voting record for the 12-month period ended June 30, visit http://www.fidelity.com/proxyvotingresults or visit the Securities and Exchange Commission's (SEC) web site at http://www.sec.gov. You may also call 1-877-208-0098 to request a free copy of the proxy voting guidelines.
Standard & Poor's, S&P and S&P 500 are registered service marks of The McGraw-Hill Companies, Inc. and have been licensed for use by Fidelity Distributors Corporation.
Other third-party marks appearing herein are the property of their respective owners.
All other marks appearing herein are registered or unregistered trademarks or service marks of FMR LLC or an affiliated company. © 2013 FMR LLC. All rights reserved.
Annual Report
This report and the financial statements contained herein are submitted for the general information of the shareholders of the fund. This report is not authorized for distribution to prospective investors in the fund unless preceded or accompanied by an effective prospectus.
A fund files its complete schedule of portfolio holdings with the SEC for the first and third quarters of each fiscal year on Form N-Q. Forms N-Q are available on the SEC's web site at http://www.sec.gov. A fund's Forms N-Q may be reviewed and copied at the SEC's Public Reference Room in Washington, DC. Information regarding the operation of the SEC's Public Reference Room may be obtained by calling 1-800-SEC-0330. For a complete list of a fund's portfolio holdings, view the most recent holdings listing, semiannual report, or annual report on Fidelity's web site at http://www.fidelity.com, http://www.advisor.fidelity.com, or http://www.401k.com, as applicable.
NOT FDIC INSURED • MAY LOSE VALUE • NO BANK GUARANTEE
Neither the fund nor Fidelity Distributors Corporation is a bank.
Annual Report
Average annual total return reflects the change in the value of an investment, assuming reinvestment of the class' distributions from dividend income and capital gains (the profits earned upon the sale of securities that have grown in value, if any) and assuming a constant rate of performance each year. The $10,000 table and the fund's returns do not reflect the deduction of taxes that a shareholder would pay on fund distributions or the redemption of fund shares. During periods of reimbursement by Fidelity, a fund's total return will be greater than it would be had the reimbursement not occurred. How a fund did yesterday is no guarantee of how it will do tomorrow.
Average Annual Total Returns
Periods ended October 31, 2013 | Past 1
year | Life of
fund A |
Class A (incl. 5.75% sales charge) | -7.64% | 7.20% |
Class T (incl. 3.50% sales charge) | -5.68% | 7.47% |
Class B (incl. contingent deferred sales charge) B | -7.61% | 7.41% |
Class C (incl. contingent deferred sales charge) C | -3.72% | 7.76% |
A From March 25, 2009.
B Class B shares' contingent deferred sales charges included in the past one year and life of fund total return figures are 5% and 3%, respectively.
C Class C shares' contingent deferred sales charges included in the past one year and life of fund total return figures are 1% and 0%, respectively.
Annual Report
$10,000 Over Life of Fund
Let's say hypothetically that $10,000 was invested in Fidelity Advisor® Global Commodity Stock Fund - Class A on March 25, 2009, when the fund started, and the current 5.75% sales charge was paid. The chart shows how the value of your investment would have changed, and also shows how the MSCI® ACWI® (All Country World Index) Index performed over the same period.
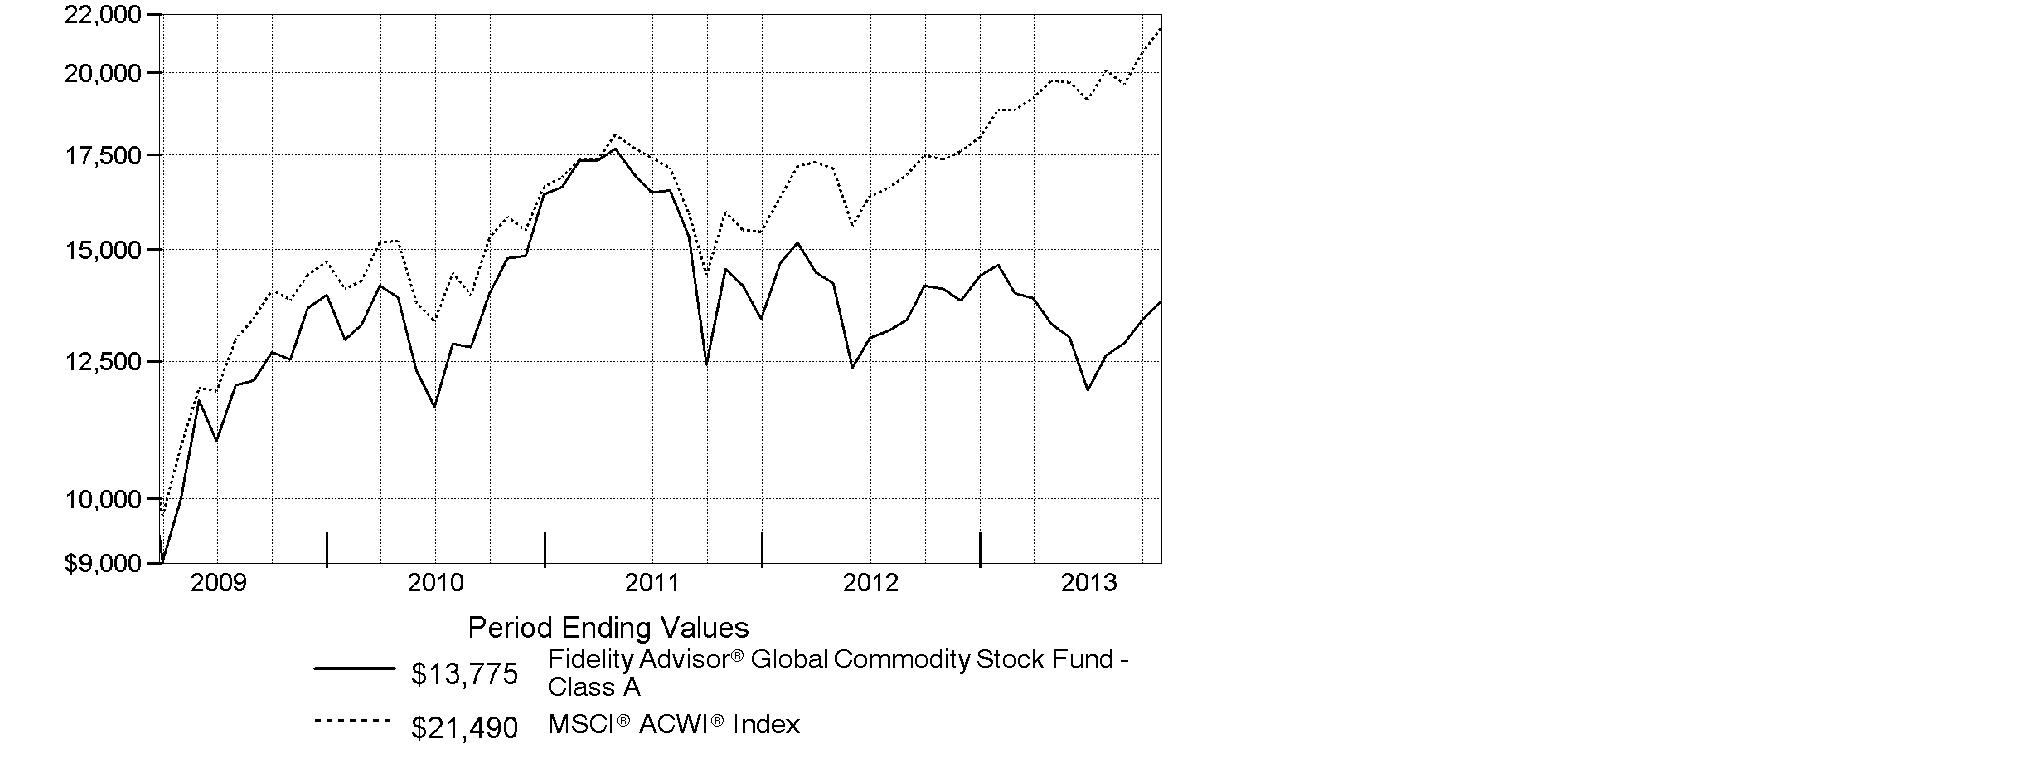
Annual Report
Market Recap: On balance, global equity markets remained upbeat for the 12-month period ending October 31, 2013. The MSCI® ACWI® (All Country World Index) Index gained 23.75% for the period, amid investor preference for higher-risk assets. The period was not without turbulence, however. In the spring and summer, central banks worldwide, especially in the U.S. and China, made clear their intentions to maintain accommodative monetary policies. That stance, combined with modest cyclical improvements around the globe and generally low valuations, underpinned the broad rally in equities. Europe (+32%) shone brightly, with most markets in the region - large and small - registering solid, index-beating gains. Another bright spot was Japan, which, despite a struggling yen and taking a second-half breather, posted a 34% result for the full year. The U.S. - by far the index's biggest constituent - also outperformed the global market with a roughly 28% advance. Meanwhile, Asia-Pacific ex Japan (+14%) lagged, hurt in part by a slowdown in Australia's mining industry as well as currency headwinds. Foreign-exchange and commodity weakness also curbed results in resource-heavy Canada and emerging markets (EM), both of which were up 7%. Country-level EM performance diverged meaningfully for the period, as evidenced by performance in Brazil (-1%), Russia (+12%), India (+1%) and China (+8%).
Comments from S. Joseph Wickwire II, Portfolio Manager of Fidelity Advisor® Global Commodity Stock Fund: For the year, the fund's Class A, Class T, Class B and Class C shares returned - 2.00%, -2.26%, -2.75% and -2.75%, respectively (excluding sales charges), lagging the broad market MSCI ACWI index and the MSCI® ACWI® (All Country World Index) Commodity Producers Sector Capped Index, which returned 0.57%. Relative to the sector benchmark, the fund was hurt by a sizable overweighting in gold stocks. The market was unfavorable to gold and gold stocks for much of the period, as the price of the precious metal price fell by 23% by period end. The gold stocks owned by the fund were hit particularly hard, including Barrick Gold, the fund's largest individual detractor. Conversely, positioning in fertilizers & agricultural chemicals helped, due in part to good timing with potash-related fertilizing companies such as Potash Corporation of Saskatchewan, along with underweightings in K&S and Uralkali, both of which I sold from the fund by period end. Overweighting oil & gas exploration & production also contributed, with investments in Petrominerales, Anadarko Petroleum and a non-index stake in C&C Energia among the fund's top relative performers. I sold Petrominerales and C&C Energia by period end to take profits, but remained overweighted in Anadarko.
The views expressed above reflect those of the portfolio manager(s) only through the end of the period as stated on the cover of this report and do not necessarily represent the views of Fidelity or any other person in the Fidelity organization. Any such views are subject to change at any time based upon market or other conditions and Fidelity disclaims any responsibility to update such views. These views may not be relied on as investment advice and, because investment decisions for a Fidelity fund are based on numerous factors, may not be relied on as an indication of trading intent on behalf of any Fidelity fund.
Annual Report
Shareholder Expense Example
As a shareholder of the Fund, you incur two types of costs: (1) transaction costs, including sales charges (loads) on purchase payments or redemption proceeds, redemption fees and (2) ongoing costs, including management fees, distribution and/or service (12b-1) fees and other Fund expenses. This Example is intended to help you understand your ongoing costs (in dollars) of investing in the Fund and to compare these costs with the ongoing costs of investing in other mutual funds.
The Example is based on an investment of $1,000 invested at the beginning of the period and held for the entire period (May 1, 2013 to October 31, 2013).
Actual Expenses
The first line of the accompanying table for each class of the Fund provides information about actual account values and actual expenses. You may use the information in this line, together with the amount you invested, to estimate the expenses that you paid over the period. Simply divide your account value by $1,000.00 (for example, an $8,600 account value divided by $1,000.00 = 8.6), then multiply the result by the number in the first line for a class of the Fund under the heading entitled "Expenses Paid During Period" to estimate the expenses you paid on your account during this period. A small balance maintenance fee of $12.00 that is charged once a year may apply for certain accounts with a value of less than $2,000. This fee is not included in the table below. If it was, the estimate of expenses you paid during the period would be higher, and your ending account value lower, by this amount. In addition, the Fund, as a shareholder in the underlying Fidelity Central Funds, will indirectly bear its pro-rata share of the fees and expenses incurred by the underlying Fidelity Central Funds. These fees and expenses are not included in the Fund's annualized expense ratio used to calculate the expense estimate in the table below.
Hypothetical Example for Comparison Purposes
The second line of the accompanying table for each class of the Fund provides information about hypothetical account values and hypothetical expenses based on a Class' actual expense ratio and an assumed rate of return of 5% per year before expenses, which is not the Class' actual return. The hypothetical account values and expenses may not be used to estimate the actual ending account balance or expenses you paid for the period. You may use this information to compare the ongoing costs of investing in the Fund and other funds. To do so, compare this 5% hypothetical example with the 5% hypothetical examples that appear in the shareholder reports of the other funds. A small balance maintenance fee of $12.00 that is charged once a year may apply for certain accounts with a value of less than $2,000. This fee is not included in the table below. If it was, the estimate of expenses you paid during the period would be higher, and your ending account value lower, by this amount. In addition, the Fund, as a shareholder in the underlying Fidelity Central Funds, will indirectly bear its pro-rata share of the fees and expenses incurred by the underlying Fidelity Central Funds. These fees and expenses are not included in the Fund's annualized expense ratio used to calculate the expense estimate in the table below.
Please note that the expenses shown in the table are meant to highlight your ongoing costs only and do not reflect any transaction costs. Therefore, the second line of the table is useful in comparing ongoing costs only, and will not help you determine the relative total costs of owning different funds. In addition, if these transactional costs were included, your costs would have been higher.
Annual Report
| Annualized
Expense Ratio B | Beginning
Account Value
May 1, 2013 | Ending
Account Value
October 31, 2013 | Expenses Paid
During Period*
May 1, 2013
to October 31, 2013 |
Class A | 1.33% | | | |
Actual | | $ 1,000.00 | $ 1,036.60 | $ 6.83 |
HypotheticalA | | $ 1,000.00 | $ 1,018.50 | $ 6.77 |
Class T | 1.59% | | | |
Actual | | $ 1,000.00 | $ 1,035.20 | $ 8.16 |
HypotheticalA | | $ 1,000.00 | $ 1,017.19 | $ 8.08 |
Class B | 2.08% | | | |
Actual | | $ 1,000.00 | $ 1,032.40 | $ 10.66 |
HypotheticalA | | $ 1,000.00 | $ 1,014.72 | $ 10.56 |
Class C | 2.09% | | | |
Actual | | $ 1,000.00 | $ 1,032.50 | $ 10.71 |
HypotheticalA | | $ 1,000.00 | $ 1,014.67 | $ 10.61 |
Global Commodity Stock | 1.08% | | | |
Actual | | $ 1,000.00 | $ 1,037.10 | $ 5.55 |
HypotheticalA | | $ 1,000.00 | $ 1,019.76 | $ 5.50 |
Institutional Class | 1.02% | | | |
Actual | | $ 1,000.00 | $ 1,037.90 | $ 5.24 |
HypotheticalA | | $ 1,000.00 | $ 1,020.06 | $ 5.19 |
A 5% return per year before expenses
B Annualized expense ratio reflects expenses net of applicable fee waivers.
* Expenses are equal to each Class' annualized expense ratio, multiplied by the average account value over the period, multiplied by 184/365 (to reflect the one-half year period).
Annual Report
Investment Changes (Unaudited)
Top Ten Stocks as of October 31, 2013 |
| % of fund's
net assets | % of fund's net assets
6 months ago |
Monsanto Co. | 6.3 | 6.4 |
BHP Billiton PLC | 5.3 | 5.2 |
Syngenta AG (Switzerland) | 4.4 | 4.4 |
Potash Corp. of Saskatchewan, Inc. | 3.4 | 1.6 |
Peabody Energy Corp. | 3.3 | 3.0 |
Rio Tinto PLC | 3.3 | 3.1 |
Chevron Corp. | 3.3 | 0.4 |
Bunge Ltd. | 3.1 | 2.0 |
Archer Daniels Midland Co. | 3.1 | 2.5 |
International Paper Co. | 2.5 | 2.2 |
| 38.0 | |
Top Industries (% of fund's net assets) |
As of October 31, 2013 |
 | Energy 33.6% | |
 | Agriculture 32.5% | |
 | Metals 30.9% | |
 | Other 2.5% | |
 | Short-Term Investments and
Net Other Assets 0.5% | |

As of April 30, 2013 |
| Metals 37.6% | |
| Energy 35.7% | |
| Agriculture 24.9% | |
| Other 1.6% | |
| Short-Term Investments and
Net Other Assets 0.2% | |

Annual Report
Investments October 31, 2013
Showing Percentage of Net Assets
Common Stocks - 99.5% |
| Shares | | Value |
AEROSPACE & DEFENSE - 0.1% |
Aerospace & Defense - 0.1% |
Precision Castparts Corp. | 500 | | $ 126,725 |
Rolls-Royce Group PLC | 6,800 | | 125,386 |
| | 252,111 |
CHEMICALS - 22.2% |
Commodity Chemicals - 0.2% |
Axiall Corp. | 16,400 | | 637,796 |
Cabot Corp. | 2,800 | | 130,508 |
| | 768,304 |
Diversified Chemicals - 0.3% |
Eastman Chemical Co. | 1,700 | | 133,943 |
FMC Corp. | 1,700 | | 123,692 |
Huntsman Corp. | 5,800 | | 134,676 |
Lanxess AG | 10,100 | | 710,896 |
| | 1,103,207 |
Fertilizers & Agricultural Chemicals - 21.7% |
Agrium, Inc. | 86,600 | | 7,392,126 |
CF Industries Holdings, Inc. | 29,872 | | 6,440,403 |
China BlueChemical Ltd. (H Shares) | 906,000 | | 581,953 |
Intrepid Potash, Inc. (d) | 99,700 | | 1,480,545 |
Israel Chemicals Ltd. | 202,400 | | 1,674,876 |
Israel Corp. Ltd. (Class A) (a) | 1,000 | | 504,502 |
Monsanto Co. | 248,400 | | 26,052,190 |
Potash Corp. of Saskatchewan, Inc. | 456,000 | | 14,170,048 |
Sociedad Quimica y Minera de Chile SA (PN-B) sponsored ADR (d) | 102,300 | | 2,824,503 |
Syngenta AG (Switzerland) | 45,287 | | 18,278,589 |
Taiwan Fertilizer Co. Ltd. | 240,000 | | 570,749 |
The Mosaic Co. | 143,359 | | 6,573,010 |
Yara International ASA | 84,800 | | 3,660,913 |
| | 90,204,407 |
TOTAL CHEMICALS | | 92,075,918 |
CONSTRUCTION & ENGINEERING - 0.3% |
Construction & Engineering - 0.3% |
Boart Longyear Ltd. (d) | 2,635,000 | | 1,070,902 |
Chiyoda Corp. | 11,000 | | 139,494 |
| | 1,210,396 |
Common Stocks - continued |
| Shares | | Value |
CONSTRUCTION MATERIALS - 0.1% |
Construction Materials - 0.1% |
Eagle Materials, Inc. | 5,400 | | $ 405,054 |
Vulcan Materials Co. | 3,400 | | 182,070 |
| | 587,124 |
CONTAINERS & PACKAGING - 0.5% |
Paper Packaging - 0.5% |
Rock-Tenn Co. Class A | 20,100 | | 2,150,901 |
ELECTRICAL EQUIPMENT - 0.0% |
Electrical Components & Equipment - 0.0% |
Eaton Corp. PLC | 1,900 | | 134,064 |
ENERGY EQUIPMENT & SERVICES - 1.1% |
Oil & Gas Drilling - 0.8% |
Ensco PLC Class A | 7,500 | | 432,375 |
Noble Corp. | 14,100 | | 531,570 |
Ocean Rig UDW, Inc. (United States) (a) | 63,747 | | 1,117,485 |
Vantage Drilling Co. (a) | 717,582 | | 1,277,296 |
| | 3,358,726 |
Oil & Gas Equipment & Services - 0.3% |
Cameron International Corp. (a) | 11,200 | | 614,432 |
FMC Technologies, Inc. (a) | 400 | | 20,220 |
Halliburton Co. | 200 | | 10,606 |
National Oilwell Varco, Inc. | 4,900 | | 397,782 |
TGS Nopec Geophysical Co. ASA | 4,800 | | 132,073 |
| | 1,175,113 |
TOTAL ENERGY EQUIPMENT & SERVICES | | 4,533,839 |
FOOD PRODUCTS - 6.9% |
Agricultural Products - 6.9% |
Archer Daniels Midland Co. | 311,500 | | 12,740,350 |
Bunge Ltd. | 158,400 | | 13,009,392 |
China Agri-Industries Holdings Ltd. | 1,458,300 | | 684,666 |
Golden Agri-Resources Ltd. | 3,377,000 | | 1,631,138 |
Ingredion, Inc. | 400 | | 26,304 |
Kernel Holding SA (a) | 8,400 | | 113,142 |
PT Charoen Pokphand Indonesia Tbk | 806,500 | | 279,027 |
Wilmar International Ltd. | 78,000 | | 217,260 |
| | 28,701,279 |
Common Stocks - continued |
| Shares | | Value |
MACHINERY - 0.5% |
Construction & Farm Machinery & Heavy Trucks - 0.5% |
Caterpillar, Inc. | 3,000 | | $ 250,080 |
Manitowoc Co., Inc. | 65,300 | | 1,270,738 |
Samsung Heavy Industries Co. Ltd. | 9,190 | | 337,282 |
| | 1,858,100 |
METALS & MINING - 30.9% |
Aluminum - 0.3% |
Alcoa, Inc. | 130,900 | | 1,213,443 |
Diversified Metals & Mining - 16.1% |
Anglo American PLC (United Kingdom) | 217,351 | | 5,175,234 |
BHP Billiton PLC | 716,093 | | 22,097,554 |
Boliden AB | 8,400 | | 119,647 |
Copper Mountain Mining Corp. (a) | 793,131 | | 1,308,383 |
First Quantum Minerals Ltd. | 93,424 | | 1,772,337 |
Freeport-McMoRan Copper & Gold, Inc. | 163,100 | | 5,995,556 |
Glencore Xstrata PLC | 1,649,452 | | 8,992,087 |
Grupo Mexico SA de CV Series B | 755,611 | | 2,386,612 |
Iluka Resources Ltd. | 53,014 | | 516,094 |
Norilsk Nickel OJSC sponsored ADR | 41,300 | | 626,521 |
Rio Tinto PLC | 270,887 | | 13,706,931 |
Sesa Sterlite Ltd. | 13,072 | | 42,849 |
Sumitomo Metal Mining Co. Ltd. | 45,000 | | 623,277 |
Teck Resources Ltd. Class B (sub. vtg.) | 89,100 | | 2,384,204 |
Turquoise Hill Resources Ltd. (a)(d) | 109,214 | | 526,875 |
Walter Energy, Inc. (d) | 26,000 | | 413,140 |
| | 66,687,301 |
Gold - 8.2% |
Agnico Eagle Mines Ltd. (Canada) | 38,000 | | 1,128,356 |
AngloGold Ashanti Ltd. sponsored ADR | 64,700 | | 976,970 |
Argonaut Gold, Inc. (a) | 93,200 | | 518,448 |
B2Gold Corp. (a) | 281,680 | | 697,007 |
Barrick Gold Corp. | 252,500 | | 4,911,236 |
Compania de Minas Buenaventura SA sponsored ADR | 23,600 | | 342,200 |
Detour Gold Corp. (a) | 106,500 | | 870,263 |
Eldorado Gold Corp. | 232,250 | | 1,565,931 |
Franco-Nevada Corp. | 26,746 | | 1,203,333 |
Gold Fields Ltd. sponsored ADR | 145,000 | | 667,000 |
Goldcorp, Inc. | 178,510 | | 4,547,284 |
Harmony Gold Mining Co. Ltd. sponsored ADR | 95,800 | | 325,720 |
Kinross Gold Corp. | 245,005 | | 1,245,410 |
Common Stocks - continued |
| Shares | | Value |
METALS & MINING - CONTINUED |
Gold - continued |
New Gold, Inc. (a) | 467,100 | | $ 2,741,718 |
Newcrest Mining Ltd. | 170,030 | | 1,655,250 |
Newmont Mining Corp. | 85,000 | | 2,317,100 |
Osisko Mining Corp. (a) | 251,528 | | 1,227,907 |
Premier Gold Mines Ltd. (a) | 504,000 | | 1,116,616 |
Pretium Resources, Inc. (a) | 60,300 | | 197,212 |
Randgold Resources Ltd. sponsored ADR | 32,500 | | 2,401,750 |
Romarco Minerals, Inc. (a) | 1,116,500 | | 401,561 |
Royal Gold, Inc. | 25,900 | | 1,244,236 |
Torex Gold Resources, Inc. (a) | 327,400 | | 364,249 |
Yamana Gold, Inc. | 151,100 | | 1,498,464 |
| | 34,165,221 |
Precious Metals & Minerals - 0.9% |
Aquarius Platinum Ltd. (United Kingdom) (a) | 242,800 | | 168,375 |
Fresnillo PLC | 36,200 | | 566,210 |
Impala Platinum Holdings Ltd. | 38,700 | | 470,318 |
Industrias Penoles SA de CV | 11,200 | | 327,701 |
Silver Wheaton Corp. | 64,200 | | 1,456,838 |
Tahoe Resources, Inc. (a) | 27,300 | | 524,189 |
| | 3,513,631 |
Steel - 5.4% |
African Minerals Ltd. (a)(d) | 376,300 | | 1,125,265 |
ArcelorMittal SA Class A unit (d) | 157,000 | | 2,474,320 |
Carpenter Technology Corp. | 800 | | 47,464 |
Eregli Demir ve Celik Fabrikalari T.A.S. | 79,770 | | 110,689 |
Fortescue Metals Group Ltd. | 144,789 | | 712,975 |
Gerdau SA sponsored ADR | 179,500 | | 1,423,435 |
Hyundai Steel Co. | 9,415 | | 776,244 |
JFE Holdings, Inc. | 70,500 | | 1,602,796 |
Jindal Steel & Power Ltd. (a) | 50,655 | | 197,157 |
London Mining PLC (a) | 539,586 | | 1,126,887 |
Nippon Steel & Sumitomo Metal Corp. | 236,000 | | 778,931 |
POSCO | 12,732 | | 3,799,125 |
SunCoke Energy, Inc. (a) | 4,000 | | 80,000 |
Tata Steel Ltd. | 50,717 | | 275,625 |
Thyssenkrupp AG (a) | 39,000 | | 996,826 |
Common Stocks - continued |
| Shares | | Value |
METALS & MINING - CONTINUED |
Steel - continued |
Vale SA (PN-A) sponsored ADR | 453,900 | | $ 6,645,096 |
Voestalpine AG | 8,500 | | 401,449 |
| | 22,574,284 |
TOTAL METALS & MINING | | 128,153,880 |
OIL, GAS & CONSUMABLE FUELS - 32.5% |
Coal & Consumable Fuels - 4.1% |
Alpha Natural Resources, Inc. (a) | 65,037 | | 455,259 |
Cameco Corp. | 47,600 | | 903,471 |
China Shenhua Energy Co. Ltd. (H Shares) | 210,000 | | 639,236 |
Coal India Ltd. | 50,901 | | 237,845 |
CONSOL Energy, Inc. | 20,500 | | 748,250 |
Peabody Energy Corp. | 713,098 | | 13,891,149 |
Whitehaven Coal Ltd. (d) | 58,500 | | 89,572 |
| | 16,964,782 |
Integrated Oil & Gas - 17.6% |
BG Group PLC | 282,650 | | 5,771,515 |
BP PLC | 580,900 | | 4,509,301 |
Cenovus Energy, Inc. | 49,800 | | 1,479,695 |
Chevron Corp. | 113,100 | | 13,567,476 |
China Petroleum & Chemical Corp. (H Shares) | 1,469,000 | | 1,189,167 |
ENI SpA | 77,727 | | 1,973,252 |
Exxon Mobil Corp. | 103,061 | | 9,236,327 |
Gazprom OAO sponsored ADR | 312,000 | | 2,910,960 |
Hess Corp. | 17,200 | | 1,396,640 |
Imperial Oil Ltd. | 5,400 | | 235,805 |
InterOil Corp. (a)(d) | 12,300 | | 854,235 |
LUKOIL Oil Co. sponsored ADR | 29,500 | | 1,931,365 |
Occidental Petroleum Corp. | 41,300 | | 3,968,104 |
Origin Energy Ltd. | 29,218 | | 404,013 |
PetroChina Co. Ltd. (H Shares) | 1,226,000 | | 1,396,146 |
Petroleo Brasileiro SA - Petrobras (PN) sponsored ADR (non-vtg.) | 191,400 | | 3,475,824 |
PTT PCL (For. Reg.) | 42,600 | | 433,870 |
Repsol YPF SA | 34,309 | | 921,413 |
Royal Dutch Shell PLC Class A (United Kingdom) | 178,850 | | 5,956,569 |
Statoil ASA | 66,200 | | 1,566,372 |
Suncor Energy, Inc. | 97,332 | | 3,537,054 |
Common Stocks - continued |
| Shares | | Value |
OIL, GAS & CONSUMABLE FUELS - CONTINUED |
Integrated Oil & Gas - continued |
Surgutneftegaz JSC (Reg.) | 99,200 | | $ 87,320 |
Total SA | 102,700 | | 6,300,951 |
| | 73,103,374 |
Oil & Gas Exploration & Production - 10.7% |
Anadarko Petroleum Corp. | 52,900 | | 5,040,841 |
Apache Corp. | 26,800 | | 2,379,840 |
Baytex Energy Corp. | 4,300 | | 179,481 |
Beach Energy Ltd. | 100,000 | | 135,156 |
Bonanza Creek Energy, Inc. (a) | 200 | | 10,108 |
Cabot Oil & Gas Corp. | 50,600 | | 1,787,192 |
Cairn India Ltd. | 1,100 | | 5,644 |
Canadian Natural Resources Ltd. | 74,000 | | 2,348,497 |
Chesapeake Energy Corp. | 31,800 | | 889,128 |
Cimarex Energy Co. | 5,000 | | 526,750 |
CNOOC Ltd. | 120,000 | | 244,077 |
CNOOC Ltd. sponsored ADR | 8,800 | | 1,780,328 |
Cobalt International Energy, Inc. (a) | 68,900 | | 1,599,169 |
Concho Resources, Inc. (a) | 5,800 | | 641,538 |
ConocoPhillips Co. | 64,000 | | 4,691,200 |
Continental Resources, Inc. (a) | 2,200 | | 250,580 |
Denbury Resources, Inc. (a) | 26,900 | | 510,831 |
Devon Energy Corp. | 22,200 | | 1,403,484 |
Double Eagle Petroleum Co. (a)(d) | 139,905 | | 388,936 |
EOG Resources, Inc. | 15,300 | | 2,729,520 |
EQT Corp. | 9,000 | | 770,490 |
INPEX Corp. | 83,200 | | 961,124 |
Kodiak Oil & Gas Corp. (a) | 700 | | 9,079 |
Kunlun Energy Co. Ltd. | 86,000 | | 140,653 |
Lundin Petroleum AB (a) | 5,900 | | 121,823 |
Marathon Oil Corp. | 53,800 | | 1,896,988 |
Murphy Oil Corp. | 10,700 | | 645,424 |
Noble Energy, Inc. | 26,100 | | 1,955,673 |
Northern Oil & Gas, Inc. (a) | 10,300 | | 169,229 |
NOVATEK OAO GDR (Reg. S) | 2,400 | | 337,200 |
Oil & Natural Gas Corp. Ltd. | 34,000 | | 162,044 |
Oil Search Ltd. ADR | 6,941 | | 55,828 |
Pacific Rubiales Energy Corp. | 25,074 | | 518,723 |
Painted Pony Petroleum Ltd. (a)(e) | 15,000 | | 98,547 |
Painted Pony Petroleum Ltd. (a) | 143,100 | | 940,138 |
PDC Energy, Inc. (a) | 300 | | 20,343 |
Common Stocks - continued |
| Shares | | Value |
OIL, GAS & CONSUMABLE FUELS - CONTINUED |
Oil & Gas Exploration & Production - continued |
Penn West Petroleum Ltd. | 25,800 | | $ 288,028 |
Pioneer Natural Resources Co. | 7,500 | | 1,535,850 |
Platino Energy Corp. (a) | 137,400 | | 79,068 |
PTT Exploration and Production PCL (For. Reg.) | 27,600 | | 149,417 |
QEP Resources, Inc. | 12,300 | | 406,638 |
Rosetta Resources, Inc. (a) | 6,100 | | 365,634 |
Santos Ltd. | 30,700 | | 440,174 |
Southwestern Energy Co. (a) | 21,700 | | 807,674 |
Talisman Energy, Inc. | 77,500 | | 966,288 |
Tullow Oil PLC | 80,400 | | 1,215,008 |
Whiting Petroleum Corp. (a) | 6,500 | | 434,785 |
Woodside Petroleum Ltd. | 36,352 | | 1,333,781 |
| | 44,367,951 |
Oil & Gas Storage & Transport - 0.1% |
Access Midstream Partners LP | 3,400 | | 182,036 |
Phillips 66 Partners LP | 6,400 | | 215,040 |
| | 397,076 |
TOTAL OIL, GAS & CONSUMABLE FUELS | | 134,833,183 |
PAPER & FOREST PRODUCTS - 3.8% |
Forest Products - 0.4% |
Boise Cascade Co. | 13,700 | | 350,857 |
Canfor Corp. (a) | 9,100 | | 188,607 |
West Fraser Timber Co. Ltd. | 11,100 | | 1,017,433 |
| | 1,556,897 |
Paper Products - 3.4% |
Fibria Celulose SA sponsored ADR (a)(d) | 18,600 | | 242,730 |
International Paper Co. | 235,400 | | 10,501,194 |
Nine Dragons Paper (Holdings) Ltd. | 898,000 | | 741,287 |
Stora Enso Oyj (R Shares) | 120,700 | | 1,122,581 |
UPM-Kymmene Corp. | 105,400 | | 1,675,781 |
| | 14,283,573 |
TOTAL PAPER & FOREST PRODUCTS | | 15,840,470 |
Common Stocks - continued |
| Shares | | Value |
REAL ESTATE INVESTMENT TRUSTS - 0.0% |
Specialized REITs - 0.0% |
Rayonier, Inc. | 700 | | $ 32,914 |
Weyerhaeuser Co. | 4,200 | | 127,680 |
| | 160,594 |
SPECIALTY RETAIL - 0.3% |
Specialty Stores - 0.3% |
Tsutsumi Jewelry Co. Ltd. | 52,200 | | 1,271,884 |
TRADING COMPANIES & DISTRIBUTORS - 0.3% |
Trading Companies & Distributors - 0.3% |
Daewoo International Corp. | 31,200 | | 1,150,949 |
TOTAL COMMON STOCKS (Cost $462,108,346) |
412,914,692
|
Nonconvertible Preferred Stocks - 0.0% |
| | | |
PAPER & FOREST PRODUCTS - 0.0% |
Paper Products - 0.0% |
Suzano Papel e Celulose SA
(Cost $108,030) | 28,500 | |
115,516
|
Money Market Funds - 1.8% |
| | | |
Fidelity Cash Central Fund, 0.09% (b) | 1,219,168 | | 1,219,168 |
Fidelity Securities Lending Cash Central Fund, 0.09% (b)(c) | 6,069,934 | | 6,069,934 |
TOTAL MONEY MARKET FUNDS (Cost $7,289,102) |
7,289,102
|
TOTAL INVESTMENT PORTFOLIO - 101.3% (Cost $469,505,478) | | 420,319,310 |
NET OTHER ASSETS (LIABILITIES) - (1.3)% | | (5,252,796) |
NET ASSETS - 100% | $ 415,066,514 |
Legend |
(a) Non-income producing |
(b) Affiliated fund that is generally available only to investment companies and other accounts managed by Fidelity Investments. The rate quoted is the annualized seven-day yield of the fund at period end. A complete unaudited listing of the fund's holdings as of its most recent quarter end is available upon request. In addition, each Fidelity Central Fund's financial statements, which are not covered by the Fund's Report of Independent Registered Public Accounting Firm, are available on the SEC's website or upon request. |
(c) Investment made with cash collateral received from securities on loan. |
(d) Security or a portion of the security is on loan at period end. |
(e) Security exempt from registration under Rule 144A of the Securities Act of 1933. These securities may be resold in transactions exempt from registration, normally to qualified institutional buyers. At the end of the period, the value of these securities amounted to $98,547 or 0.0% of net assets. |
Affiliated Central Funds |
Information regarding fiscal year to date income earned by the Fund from investments in Fidelity Central Funds is as follows: |
Fund | Income earned |
Fidelity Cash Central Fund | $ 2,304 |
Fidelity Securities Lending Cash Central Fund | 554,965 |
Total | $ 557,269 |
Other Information |
The following is a summary of the inputs used, as of October 31, 2013, involving the Fund's assets and liabilities carried at fair value. The inputs or methodology used for valuing securities may not be an indication of the risk associated with investing in those securities. For more information on valuation inputs, and their aggregation into the levels used in the tables below, please refer to the Investment Valuation section in the accompanying Notes to Financial Statements. |
Valuation Inputs at Reporting Date: |
Description | Total | Level 1 | Level 2 | Level 3 |
Investments in Securities: | | | | |
Common Stocks | $ 412,914,692 | $ 326,519,152 | $ 86,395,540 | $ - |
Nonconvertible Preferred Stocks | 115,516 | 115,516 | - | - |
Money Market Funds | 7,289,102 | 7,289,102 | - | - |
Total Investments in Securities: | $ 420,319,310 | $ 333,923,770 | $ 86,395,540 | $ - |
The following is a summary of transfers between Level 1 and Level 2 for the period ended October 31, 2013. Transfers are assumed to have occurred at the beginning of the period, and are primarily attributable to the valuation techniques used for foreign equity securities, as discussed in the accompanying Notes to Financial Statements: |
Transfers | Total |
Level 1 to Level 2 | $ 7,714,186 |
Level 2 to Level 1 | $ 0 |
Distribution of investments by country or territory of incorporation, as a percentage of total net assets, is as follows (Unaudited): |
United States of America | 38.7% |
Canada | 16.3% |
United Kingdom | 14.6% |
Switzerland | 4.5% |
Bermuda | 3.7% |
Bailiwick of Jersey | 2.8% |
Brazil | 2.7% |
Australia | 1.5% |
France | 1.5% |
Korea (South) | 1.5% |
Russia | 1.5% |
Japan | 1.3% |
Norway | 1.3% |
Others (Individually Less Than 1%) | 8.1% |
| 100.0% |
See accompanying notes which are an integral part of the financial statements.
Annual Report
Statement of Assets and Liabilities
| October 31, 2013 |
| | |
Assets | | |
Investment in securities, at value (including securities loaned of $5,895,555) - See accompanying schedule: Unaffiliated issuers (cost $462,216,376) | $ 413,030,208 | |
Fidelity Central Funds (cost $7,289,102) | 7,289,102 | |
Total Investments (cost $469,505,478) | | $ 420,319,310 |
Foreign currency held at value (cost $42,375) | | 42,375 |
Receivable for investments sold | | 10,513,562 |
Receivable for fund shares sold | | 210,272 |
Dividends receivable | | 753,835 |
Distributions receivable from Fidelity Central Funds | | 21,487 |
Prepaid expenses | | 911 |
Other receivables | | 8,785 |
Total assets | | 431,870,537 |
| | |
Liabilities | | |
Payable for investments purchased | $ 9,650,706 | |
Payable for fund shares redeemed | 629,022 | |
Accrued management fee | 242,227 | |
Distribution and service plan fees payable | 41,930 | |
Other affiliated payables | 121,216 | |
Other payables and accrued expenses | 48,988 | |
Collateral on securities loaned, at value | 6,069,934 | |
Total liabilities | | 16,804,023 |
| | |
Net Assets | | $ 415,066,514 |
Net Assets consist of: | | |
Paid in capital | | $ 501,612,128 |
Undistributed net investment income | | 4,309,466 |
Accumulated undistributed net realized gain (loss) on investments and foreign currency transactions | | (41,679,876) |
Net unrealized appreciation (depreciation) on investments and assets and liabilities in foreign currencies | | (49,175,204) |
Net Assets | | $ 415,066,514 |
See accompanying notes which are an integral part of the financial statements.
Annual Report
Statement of Assets and Liabilities - continued
| October 31, 2013 |
| | |
Calculation of Maximum Offering Price Class A:
Net Asset Value and redemption price per share ($71,293,097 ÷ 5,031,565 shares) | | $ 14.17 |
| | |
Maximum offering price per share (100/94.25 of $14.17) | | $ 15.03 |
Class T:
Net Asset Value and redemption price per share ($12,551,178 ÷ 888,204 shares) | | $ 14.13 |
| | |
Maximum offering price per share (100/96.50 of $14.13) | | $ 14.64 |
Class B:
Net Asset Value and offering price per share ($2,303,213 ÷ 164,359 shares)A | | $ 14.01 |
| | |
Class C:
Net Asset Value and offering price per share ($23,829,687 ÷ 1,707,183 shares)A | | $ 13.96 |
| | |
Global Commodity Stock:
Net Asset Value, offering price and redemption price per share ($273,475,891 ÷ 19,204,409 shares) | | $ 14.24 |
| | |
Institutional Class:
Net Asset Value, offering price and redemption price per share ($31,613,448 ÷ 2,220,504 shares) | | $ 14.24 |
A Redemption price per share is equal to net asset value less any applicable contingent deferred sales charge.
See accompanying notes which are an integral part of the financial statements.
Annual Report
Financial Statements - continued
Statement of Operations
| Year ended October 31, 2013 |
| | |
Investment Income | | |
Dividends | | $ 12,264,754 |
Income from Fidelity Central Funds | | 557,269 |
Income before foreign taxes withheld | | 12,822,023 |
Less foreign taxes withheld | | (937,571) |
Total income | | 11,884,452 |
| | |
Expenses | | |
Management fee | $ 3,417,195 | |
Transfer agent fees | 1,423,008 | |
Distribution and service plan fees | 573,855 | |
Accounting and security lending fees | 252,628 | |
Custodian fees and expenses | 70,188 | |
Independent trustees' compensation | 2,944 | |
Registration fees | 93,616 | |
Audit | 54,128 | |
Legal | 1,376 | |
Interest | 1,106 | |
Miscellaneous | 5,026 | |
Total expenses before reductions | 5,895,070 | |
Expense reductions | (69,435) | 5,825,635 |
Net investment income (loss) | | 6,058,817 |
Realized and Unrealized Gain (Loss) Net realized gain (loss) on: | | |
Investment securities: | | |
Unaffiliated issuers | (781,472) | |
Foreign currency transactions | 9,027 | |
Total net realized gain (loss) | | (772,445) |
Change in net unrealized appreciation (depreciation) on: Investment securities | (21,267,158) | |
Assets and liabilities in foreign currencies | 18,814 | |
Total change in net unrealized appreciation (depreciation) | | (21,248,344) |
Net gain (loss) | | (22,020,789) |
Net increase (decrease) in net assets resulting from operations | | $ (15,961,972) |
See accompanying notes which are an integral part of the financial statements.
Annual Report
Statement of Changes in Net Assets
| Year ended
October 31,
2013 | Year ended
October 31,
2012 |
Increase (Decrease) in Net Assets | | |
Operations | | |
Net investment income (loss) | $ 6,058,817 | $ 6,227,231 |
Net realized gain (loss) | (772,445) | (27,607,132) |
Change in net unrealized appreciation (depreciation) | (21,248,344) | (8,995,088) |
Net increase (decrease) in net assets resulting
from operations | (15,961,972) | (30,374,989) |
Distributions to shareholders from net investment income | (5,697,049) | (3,692,921) |
Distributions to shareholders from net realized gain | - | (671,463) |
Total distributions | (5,697,049) | (4,364,384) |
Share transactions - net increase (decrease) | (152,423,209) | (156,629,581) |
Redemption fees | 18,199 | 31,600 |
Total increase (decrease) in net assets | (174,064,031) | (191,337,354) |
| | |
Net Assets | | |
Beginning of period | 589,130,545 | 780,467,899 |
End of period (including undistributed net investment income of $4,309,466 and undistributed net investment income of $4,752,569, respectively) | $ 415,066,514 | $ 589,130,545 |
See accompanying notes which are an integral part of the financial statements.
Annual Report
Financial Highlights - Class A
Years ended October 31, | 2013 | 2012 | 2011 | 2010 | 2009 I |
Selected Per-Share Data | | | | | |
Net asset value, beginning of period | $ 14.59 | $ 15.14 | $ 15.60 | $ 13.29 | $ 10.00 |
Income from Investment Operations | | | | | |
Net investment income (loss) E | .16 | .11 | .12 | .19 H | (.01) |
Net realized and unrealized gain (loss) | (.45) | (.59) | (.38) | 2.20 | 3.29 |
Total from investment operations | (.29) | (.48) | (.26) | 2.39 | 3.28 |
Distributions from net investment income | (.13) | (.05) | (.13) | - K | - |
Distributions from net realized gain | - | (.01) | (.06) | (.08) | - |
Total distributions | (.13) | (.07) M | (.20) L | (.08) | - |
Redemption fees added to paid in capital E | - K | - K | - K | - K | .01 |
Net asset value, end of period | $ 14.17 | $ 14.59 | $ 15.14 | $ 15.60 | $ 13.29 |
Total Return B, C, D | (2.00)% | (3.19)% | (1.80)% | 18.04% | 32.90% |
Ratios to Average Net Assets F, J | | | | | |
Expenses before reductions | 1.36% | 1.34% | 1.32% | 1.37% | 1.65% A |
Expenses net of fee waivers, if any | 1.35% | 1.34% | 1.32% | 1.37% | 1.50% A |
Expenses net of all reductions | 1.34% | 1.33% | 1.31% | 1.36% | 1.48% A |
Net investment income (loss) | 1.12% | .80% | .71% | 1.35% H | (.15)% A |
Supplemental Data | | | | | |
Net assets, end of period (000 omitted) | $ 71,293 | $ 99,694 | $ 127,979 | $ 60,370 | $ 15,705 |
Portfolio turnover rate G | 65% | 91% | 71% | 54% | 25% A |
A Annualized
B Total returns for periods of less than one year are not annualized.
C Total returns would have been lower if certain expenses had not been reduced during the applicable periods shown.
D Total returns do not include the effect of the sales charges.
E Calculated based on average shares outstanding during the period.
F Fees and expenses of any underlying Fidelity Central Funds are not included in the Fund's expense ratio. The Fund indirectly bears its proportionate share of the expenses of any underlying Fidelity Central Funds.
G Amount does not include the portfolio activity of any underlying Fidelity Central Funds.
H Investment income per share reflects a large, non-recurring dividend which amounted to $.13 per share. Excluding this non-recurring dividend, the ratio of net investment income (loss) to average net assets would have been .42%.
I For the period March 25, 2009 (commencement of operations) to October 31, 2009.
J Expense ratios reflect operating expenses of the class. Expenses before reductions do not reflect amounts reimbursed by the investment adviser or reductions from brokerage service arrangements or reductions from other expense offset arrangements and do not represent the amount paid by the class during periods when reimbursements or reductions occur. Expense ratios before reductions for start-up periods may not be representative of longer-term operating periods. Expenses net of fee waivers reflect expenses after reimbursement by the investment adviser but prior to reductions from brokerage service arrangements or other expense offset arrangements. Expenses net of all reductions represent the net expenses paid by the class.
K Amount represents less than $.01 per share.
L Total distributions of $.20 per share is comprised of distributions from net investment income of $.133 and distributions from net realized gain of $.062 per share.
M Total distributions of $.07 per share is comprised of distributions from net investment income of $.052 and distributions from net realized gain of $.014 per share.
See accompanying notes which are an integral part of the financial statements.
Annual Report
Financial Highlights - Class T
Years ended October 31, | 2013 | 2012 | 2011 | 2010 | 2009 I |
Selected Per-Share Data | | | | | |
Net asset value, beginning of period | $ 14.54 | $ 15.08 | $ 15.55 | $ 13.27 | $ 10.00 |
Income from Investment Operations | | | | | |
Net investment income (loss) E | .12 | .08 | .07 | .16 H | (.03) |
Net realized and unrealized gain (loss) | (.45) | (.60) | (.38) | 2.19 | 3.29 |
Total from investment operations | (.33) | (.52) | (.31) | 2.35 | 3.26 |
Distributions from net investment income | (.08) | (.01) | (.10) | - | - |
Distributions from net realized gain | - | (.01) | (.06) | (.07) | - |
Total distributions | (.08) | (.02) | (.16) | (.07) | - |
Redemption fees added to paid in capital E | - K | - K | - K | - K | .01 |
Net asset value, end of period | $ 14.13 | $ 14.54 | $ 15.08 | $ 15.55 | $ 13.27 |
Total Return B, C, D | (2.26)% | (3.43)% | (2.09)% | 17.73% | 32.70% |
Ratios to Average Net Assets F, J | | | | | |
Expenses before reductions | 1.62% | 1.61% | 1.60% | 1.63% | 2.04% A |
Expenses net of fee waivers, if any | 1.61% | 1.61% | 1.60% | 1.63% | 1.75% A |
Expenses net of all reductions | 1.60% | 1.60% | 1.59% | 1.61% | 1.73% A |
Net investment income (loss) | .86% | .53% | .43% | 1.10% H | (.40)% A |
Supplemental Data | | | | | |
Net assets, end of period (000 omitted) | $ 12,551 | $ 16,692 | $ 20,831 | $ 11,762 | $ 4,665 |
Portfolio turnover rate G | 65% | 91% | 71% | 54% | 25% A |
A Annualized
B Total returns for periods of less than one year are not annualized.
C Total returns would have been lower if certain expenses had not been reduced during the applicable periods shown.
D Total returns do not include the effect of the sales charges.
E Calculated based on average shares outstanding during the period.
F Fees and expenses of any underlying Fidelity Central Funds are not included in the Fund's expense ratio. The Fund indirectly bears its proportionate share of the expenses of any underlying Fidelity Central Funds.
G Amount does not include the portfolio activity of any underlying Fidelity Central Funds.
H Investment income per share reflects a large, non-recurring dividend which amounted to $.13 per share. Excluding this non-recurring dividend, the ratio of net investment income (loss) to average net assets would have been .17%.
I For the period March 25, 2009 (commencement of operations) to October 31, 2009.
J Expense ratios reflect operating expenses of the class. Expenses before reductions do not reflect amounts reimbursed by the investment adviser or reductions from brokerage service arrangements or reductions from other expense offset arrangements and do not represent the amount paid by the class during periods when reimbursements or reductions occur. Expense ratios before reductions for start-up periods may not be representative of longer-term operating periods. Expenses net of fee waivers reflect expenses after reimbursement by the investment adviser but prior to reductions from brokerage service arrangements or other expense offset arrangements. Expenses net of all reductions represent the net expenses paid by the class.
K Amount represents less than $.01 per share.
See accompanying notes which are an integral part of the financial statements.
Annual Report
Financial Highlights - Class B
Years ended October 31, | 2013 | 2012 | 2011 | 2010 | 2009 I |
Selected Per-Share Data | | | | | |
Net asset value, beginning of period | $ 14.41 | $ 15.00 | $ 15.46 | $ 13.22 | $ 10.00 |
Income from Investment Operations | | | | | |
Net investment income (loss) E | .05 | - K | (.01) | .08 H | (.07) |
Net realized and unrealized gain (loss) | (.45) | (.59) | (.39) | 2.20 | 3.28 |
Total from investment operations | (.40) | (.59) | (.40) | 2.28 | 3.21 |
Distributions from net investment income | - K | - | - | - | - |
Distributions from net realized gain | - | - | (.06) | (.04) | - |
Total distributions | - K | - | (.06) | (.04) | - |
Redemption fees added to paid in capital E | - K | - K | - K | - K | .01 |
Net asset value, end of period | $ 14.01 | $ 14.41 | $ 15.00 | $ 15.46 | $ 13.22 |
Total Return B, C, D | (2.75)% | (3.93)% | (2.62)% | 17.23% | 32.20% |
Ratios to Average Net Assets F, J | | | | | |
Expenses before reductions | 2.11% | 2.10% | 2.11% | 2.16% | 2.66% A |
Expenses net of fee waivers, if any | 2.11% | 2.10% | 2.11% | 2.16% | 2.25% A |
Expenses net of all reductions | 2.10% | 2.10% | 2.10% | 2.15% | 2.23% A |
Net investment income (loss) | .36% | .03% | (.09)% | .56% H | (.90)% A |
Supplemental Data | | | | | |
Net assets, end of period (000 omitted) | $ 2,303 | $ 3,097 | $ 4,324 | $ 4,348 | $ 2,726 |
Portfolio turnover rate G | 65% | 91% | 71% | 54% | 25% A |
A Annualized
B Total returns for periods of less than one year are not annualized.
C Total returns would have been lower if certain expenses had not been reduced during the applicable periods shown.
D Total returns do not include the effect of the contingent deferred sales charge.
E Calculated based on average shares outstanding during the period.
F Fees and expenses of any underlying Fidelity Central Funds are not included in the Fund's expense ratio. The Fund indirectly bears its proportionate share of the expenses of any underlying Fidelity Central Funds.
G Amount does not include the portfolio activity of any underlying Fidelity Central Funds.
H Investment income per share reflects a large, non-recurring dividend which amounted to $.13 per share. Excluding this non-recurring dividend, the ratio of net investment income (loss) to average net assets would have been (.37)%.
I For the period March 25, 2009 (commencement of operations) to October 31, 2009.
J Expense ratios reflect operating expenses of the class. Expenses before reductions do not reflect amounts reimbursed by the investment adviser or reductions from brokerage service arrangements or reductions from other expense offset arrangements and do not represent the amount paid by the class during periods when reimbursements or reductions occur. Expense ratios before reductions for start-up periods may not be representative of longer-term operating periods. Expenses net of fee waivers reflect expenses after reimbursement by the investment adviser but prior to reductions from brokerage service arrangements or other expense offset arrangements. Expenses net of all reductions represent the net expenses paid by the class.
K Amount represents less than $.01 per share.
See accompanying notes which are an integral part of the financial statements.
Annual Report
Financial Highlights - Class C
Years ended October 31, | 2013 | 2012 | 2011 | 2010 | 2009 I |
Selected Per-Share Data | | | | | |
Net asset value, beginning of period | $ 14.37 | $ 14.95 | $ 15.45 | $ 13.22 | $ 10.00 |
Income from Investment Operations | | | | | |
Net investment income (loss) E | .05 | .01 | (.01) | .08 H | (.07) |
Net realized and unrealized gain (loss) | (.44) | (.59) | (.38) | 2.19 | 3.28 |
Total from investment operations | (.39) | (.58) | (.39) | 2.27 | 3.21 |
Distributions from net investment income | (.02) | - | (.05) | - | - |
Distributions from net realized gain | - | - | (.06) | (.04) | - |
Total distributions | (.02) | - | (.11) | (.04) | - |
Redemption fees added to paid in capital E | - K | - K | - K | - K | .01 |
Net asset value, end of period | $ 13.96 | $ 14.37 | $ 14.95 | $ 15.45 | $ 13.22 |
Total Return B, C, D | (2.75)% | (3.88)% | (2.58)% | 17.21% | 32.20% |
Ratios to Average Net Assets F, J | | | | | |
Expenses before reductions | 2.11% | 2.10% | 2.09% | 2.14% | 2.53% A |
Expenses net of fee waivers, if any | 2.11% | 2.10% | 2.09% | 2.14% | 2.25% A |
Expenses net of all reductions | 2.10% | 2.09% | 2.08% | 2.13% | 2.23% A |
Net investment income (loss) | .36% | .03% | (.07)% | .58% H | (.90)% A |
Supplemental Data | | | | | |
Net assets, end of period (000 omitted) | $ 23,830 | $ 31,865 | $ 37,185 | $ 14,338 | $ 4,798 |
Portfolio turnover rate G | 65% | 91% | 71% | 54% | 25% A |
A Annualized
B Total returns for periods of less than one year are not annualized.
C Total returns would have been lower if certain expenses had not been reduced during the applicable periods shown.
D Total returns do not include the effect of the contingent deferred sales charge.
E Calculated based on average shares outstanding during the period.
F Fees and expenses of any underlying Fidelity Central Funds are not included in the Fund's expense ratio. The Fund indirectly bears its proportionate share of the expenses of any underlying Fidelity Central Funds.
G Amount does not include the portfolio activity of any underlying Fidelity Central Funds.
H Investment income per share reflects a large, non-recurring dividend which amounted to $.13 per share. Excluding this non-recurring dividend, the ratio of net investment income (loss) to average net assets would have been (.34)%.
I For the period March 25, 2009 (commencement of operations) to October 31, 2009.
J Expense ratios reflect operating expenses of the class. Expenses before reductions do not reflect amounts reimbursed by the investment adviser or reductions from brokerage service arrangements or reductions from other expense offset arrangements and do not represent the amount paid by the class during periods when reimbursements or reductions occur. Expense ratios before reductions for start-up periods may not be representative of longer-term operating periods. Expenses net of fee waivers reflect expenses after reimbursement by the investment adviser but prior to reductions from brokerage service arrangements or other expense offset arrangements. Expenses net of all reductions represent the net expenses paid by the class.
K Amount represents less than $.01 per share.
See accompanying notes which are an integral part of the financial statements.
Annual Report
Financial Highlights - Global Commodity Stock
Years ended October 31, | 2013 | 2012 | 2011 | 2010 | 2009 H |
Selected Per-Share Data | | | | | |
Net asset value, beginning of period | $ 14.66 | $ 15.21 | $ 15.66 | $ 13.31 | $ 10.00 |
Income from Investment Operations | | | | | |
Net investment income (loss) D | .19 | .15 | .16 | .23 G | .01 |
Net realized and unrealized gain (loss) | (.45) | (.60) | (.39) | 2.21 | 3.29 |
Total from investment operations | (.26) | (.45) | (.23) | 2.44 | 3.30 |
Distributions from net investment income | (.16) | (.08) | (.16) | (.01) | - |
Distributions from net realized gain | - | (.01) | (.06) | (.08) | - |
Total distributions | (.16) | (.10) K | (.22) | (.09) | - |
Redemption fees added to paid in capital D | - J | - J | - J | - J | .01 |
Net asset value, end of period | $ 14.24 | $ 14.66 | $ 15.21 | $ 15.66 | $ 13.31 |
Total Return B, C | (1.75)% | (2.96)% | (1.59)% | 18.38% | 33.10% |
Ratios to Average Net Assets E, I | | | | | |
Expenses before reductions | 1.11% | 1.10% | 1.08% | 1.10% | 1.42% A |
Expenses net of fee waivers, if any | 1.11% | 1.10% | 1.08% | 1.10% | 1.25% A |
Expenses net of all reductions | 1.09% | 1.09% | 1.07% | 1.09% | 1.23% A |
Net investment income (loss) | 1.37% | 1.04% | .95% | 1.62% G | .10% A |
Supplemental Data | | | | | |
Net assets, end of period (000 omitted) | $ 273,476 | $ 387,242 | $ 531,224 | $ 310,186 | $ 159,439 |
Portfolio turnover rate F | 65% | 91% | 71% | 54% | 25% A |
A Annualized
B Total returns for periods of less than one year are not annualized.
C Total returns would have been lower if certain expenses had not been reduced during the applicable periods shown.
D Calculated based on average shares outstanding during the period.
E Fees and expenses of any underlying Fidelity Central Funds are not included in the Fund's expense ratio. The Fund indirectly bears its proportionate share of the expenses of any underlying Fidelity Central Funds.
F Amount does not include the portfolio activity of any underlying Fidelity Central Funds.
G Investment income per share reflects a large, non-recurring dividend which amounted to $.13 per share. Excluding this non-recurring dividend, the ratio of net investment income (loss) to average net assets would have been .69%.
H For the period March 25, 2009 (commencement of operations) to October 31, 2009.
I Expense ratios reflect operating expenses of the class. Expenses before reductions do not reflect amounts reimbursed by the investment adviser or reductions from brokerage service arrangements or reductions from other expense offset arrangements and do not represent the amount paid by the class during periods when reimbursements or reductions occur. Expense ratios before reductions for start-up periods may not be representative of longer-term operating periods. Expenses net of fee waivers reflect expenses after reimbursement by the investment adviser but prior to reductions from brokerage service arrangements or other expense offset arrangements. Expenses net of all reductions represent the net expenses paid by the class.
J Amount represents less than $.01 per share.
K Total distributions of $.10 per share is comprised of distributions from net investment income of $.084 and distributions from net realized gain of $.014 per share.
See accompanying notes which are an integral part of the financial statements.
Annual Report
Financial Highlights - Institutional Class
Years ended October 31, | 2013 | 2012 | 2011 | 2010 | 2009 H |
Selected Per-Share Data | | | | | |
Net asset value, beginning of period | $ 14.67 | $ 15.22 | $ 15.66 | $ 13.31 | $ 10.00 |
Income from Investment Operations | | | | | |
Net investment income (loss) D | .20 | .16 | .16 | .23 G | .01 |
Net realized and unrealized gain (loss) | (.45) | (.60) | (.38) | 2.21 | 3.29 |
Total from investment operations | (.25) | (.44) | (.22) | 2.44 | 3.30 |
Distributions from net investment income | (.18) | (.09) | (.16) | (.01) | - |
Distributions from net realized gain | - | (.01) | (.06) | (.08) | - |
Total distributions | (.18) | (.11) K | (.22) | (.09) | - |
Redemption fees added to paid in capital D | - J | - J | - J | - J | .01 |
Net asset value, end of period | $ 14.24 | $ 14.67 | $ 15.22 | $ 15.66 | $ 13.31 |
Total Return B, C | (1.71)% | (2.90)% | (1.50)% | 18.39% | 33.10% |
Ratios to Average Net Assets E, I | | | | | |
Expenses before reductions | 1.04% | 1.04% | 1.03% | 1.09% | 1.36% A |
Expenses net of fee waivers, if any | 1.04% | 1.04% | 1.03% | 1.09% | 1.25% A |
Expenses net of all reductions | 1.03% | 1.03% | 1.03% | 1.07% | 1.23% A |
Net investment income (loss) | 1.43% | 1.10% | .99% | 1.64% G | .10% A |
Supplemental Data | | | | | |
Net assets, end of period (000 omitted) | $ 31,613 | $ 50,540 | $ 58,925 | $ 35,739 | $ 9,811 |
Portfolio turnover rate F | 65% | 91% | 71% | 54% | 25% A |
A Annualized
B Total returns for periods of less than one year are not annualized.
C Total returns would have been lower if certain expenses had not been reduced during the applicable periods shown.
D Calculated based on average shares outstanding during the period.
E Fees and expenses of any underlying Fidelity Central Funds are not included in the Fund's expense ratio. The Fund indirectly bears its proportionate share of the expenses of any underlying Fidelity Central Funds.
F Amount does not include the portfolio activity of any underlying Fidelity Central Funds.
G Investment income per share reflects a large, non-recurring dividend which amounted to $.13 per share. Excluding this non-recurring dividend, the ratio of net investment income (loss) to average net assets would have been .71%.
H For the period March 25, 2009 (commencement of operations) to October 31, 2009.
I Expense ratios reflect operating expenses of the class. Expenses before reductions do not reflect amounts reimbursed by the investment adviser or reductions from brokerage service arrangements or reductions from other expense offset arrangements and do not represent the amount paid by the class during periods when reimbursements or reductions occur. Expense ratios before reductions for start-up periods may not be representative of longer-term operating periods. Expenses net of fee waivers reflect expenses after reimbursement by the investment adviser but prior to reductions from brokerage service arrangements or other expense offset arrangements. Expenses net of all reductions represent the net expenses paid by the class.
J Amount represents less than $.01 per share.
K Total distributions of $.11 per share is comprised of distributions from net investment income of $.093 and distributions from net realized gain of $.014 per share.
See accompanying notes which are an integral part of the financial statements.
Annual Report
Notes to Financial Statements
For the period ended October 31, 2013
1. Organization.
Fidelity Global Commodity Stock Fund (the Fund) is a non-diversified fund of Fidelity Investment Trust (the Trust) and is authorized to issue an unlimited number of shares. The Trust is registered under the Investment Company Act of 1940, as amended (the 1940 Act), as an open-end management investment company organized as a Massachusetts business trust. The Fund offers Class A, Class T, Class C, Global Commodity Stock and Institutional Class shares, each of which, along with Class B shares, has equal rights as to assets and voting privileges. Class B shares are closed to new accounts and additional purchases, except for exchanges and reinvestments. Each class has exclusive voting rights with respect to matters that affect that class. Class B shares will automatically convert to Class A shares after a holding period of seven years from the initial date of purchase. The Fund's investments in emerging markets can be subject to social, economic, regulatory, and political uncertainties and can be extremely volatile.
2. Investments in Fidelity Central Funds.
The Fund invests in Fidelity Central Funds, which are open-end investment companies generally available only to other investment companies and accounts managed by Fidelity Management & Research Company (FMR) and its affiliates. The Fund's Schedule of Investments lists each of the Fidelity Central Funds held as of period end, if any, as an investment of the Fund, but does not include the underlying holdings of each Fidelity Central Fund. As an Investing Fund, the Fund indirectly bears its proportionate share of the expenses of the underlying Fidelity Central Funds.
The Money Market Central Funds seek preservation of capital and current income and are managed by Fidelity Investments Money Management, Inc. (FIMM), an affiliate of FMR.
A complete unaudited list of holdings for each Fidelity Central Fund is available upon request or at the Securities and Exchange Commission (the SEC) website at www.sec.gov. In addition, the financial statements of the Fidelity Central Funds, which are not covered by the Fund's Report of Independent Registered Public Accounting Firm, are available on the SEC website or upon request.
3. Significant Accounting Policies.
The financial statements have been prepared in conformity with accounting principles generally accepted in the United States of America (GAAP), which require management to make certain estimates and assumptions at the date of the financial statements. Actual results could differ from those estimates. Subsequent events, if any, through the date that the financial statements were issued have been evaluated in the preparation of
Annual Report
3. Significant Accounting Policies - continued
the financial statements. The following summarizes the significant accounting policies of the Fund:
Investment Valuation. Investments are valued as of 4:00 p.m. Eastern time on the last calendar day of the period. In accordance with valuation policies and procedures approved by the Board of Trustees (the Board), the Fund attempts to obtain prices from one or more third party pricing vendors or brokers to value its investments. When current market prices, quotations or currency exchange rates are not readily available or reliable, investments will be fair valued in good faith by the FMR Fair Value Committee (the Committee), in accordance with procedures adopted by the Board. Factors used in determining fair value vary by investment type and may include market or investment specific events. The frequency with which these procedures are used cannot be predicted and they may be utilized to a significant extent. The Committee oversees the Fund's valuation policies and procedures and is responsible for approving and reporting to the Board all fair value determinations.
The Fund categorizes the inputs to valuation techniques used to value its investments into a disclosure hierarchy consisting of three levels as shown below:
Level 1 - quoted prices in active markets for identical investments
Level 2 - other significant observable inputs (including quoted prices for similar investments, interest rates, prepayment speeds, etc.)
Level 3 - unobservable inputs (including the Fund's own assumptions based on the best information available)
Valuation techniques used to value the Fund's investments by major category are as follows:
Equity securities, including restricted securities, for which market quotations are readily available, are valued at the last reported sale price or official closing price as reported by a third party pricing vendor on the primary market or exchange on which they are traded and are categorized as Level 1 in the hierarchy. In the event there were no sales during the day or closing prices are not available, securities are valued at the last quoted bid price or may be valued using the last available price and are generally categorized as Level 2 in the hierarchy. For foreign equity securities, when market or security specific events arise, comparisons to the valuation of American Depositary Receipts (ADRs), futures contracts, Exchange-Traded Funds (ETFs) and certain indexes as well as quoted prices for similar securities may be used and would be categorized as Level 2 in the hierarchy. Utilizing these techniques may result in transfers between Level 1 and Level 2. For equity securities, including restricted securities, where observable inputs are
Annual Report
Notes to Financial Statements - continued
3. Significant Accounting Policies - continued
Investment Valuation - continued
limited, assumptions about market activity and risk are used and these securities may be categorized as Level 3 in the hierarchy.
Investments in open-end mutual funds, including the Fidelity Central Funds, are valued at their closing net asset value (NAV) each business day and are categorized as Level 1 in the hierarchy.
Changes in valuation techniques may result in transfers in or out of an assigned level within the disclosure hierarchy. The aggregate value of investments by input level, as of October 31, 2013, including information on transfers between Levels 1 and 2, is included at the end of the Fund's Schedule of Investments.
Foreign Currency. The Fund may use foreign currency contracts to facilitate transactions in foreign-denominated securities. Gains and losses from these transactions may arise from changes in the value of the foreign currency or if the counterparties do not perform under the contracts' terms.
Foreign-denominated assets, including investment securities, and liabilities are translated into U.S. dollars at the exchange rates at period end. Purchases and sales of investment securities, income and dividends received and expenses denominated in foreign currencies are translated into U.S. dollars at the exchange rate in effect on the transaction date.
The effects of exchange rate fluctuations on investments are included with the net realized and unrealized gain (loss) on investment securities. Other foreign currency transactions resulting in realized and unrealized gain (loss) are disclosed separately.
Investment Transactions and Income. For financial reporting purposes, the Fund's investment holdings and NAV include trades executed through the end of the last business day of the period. The NAV per share for processing shareholder transactions is calculated as of the close of business of the New York Stock Exchange (NYSE), normally 4:00 p.m. Eastern time and includes trades executed through the end of the prior business day. Gains and losses on securities sold are determined on the basis of identified cost and may include proceeds received from litigation. Dividend income is recorded on the ex-dividend date, except for certain dividends from foreign securities where the ex-dividend date may have passed, which are recorded as soon as the Fund is informed of the ex-dividend date. Non-cash dividends included in dividend income, if any, are recorded at the fair market value of the securities received. Distributions received on securities that represent a return of capital or capital gain are recorded as a reduction of cost of investments and/or as a realized gain. Subsequent to ex-dividend date the Fund determines the components of these distributions, based upon receipt of tax filings or
Annual Report
3. Significant Accounting Policies - continued
Investment Transactions and Income - continued
other correspondence relating to the underlying investment. Interest income and distributions from the Fidelity Central Funds are accrued as earned. Investment income is recorded net of foreign taxes withheld where recovery of such taxes is uncertain.
Class Allocations and Expenses. Investment income, realized and unrealized capital gains and losses, common expenses of the Fund, and certain fund-level expense reductions, if any, are allocated daily on a pro-rata basis to each class based on the relative net assets of each class to the total net assets of the Fund. Each class differs with respect to transfer agent and distribution and service plan fees incurred. Certain expense reductions may also differ by class. For the reporting period, the allocated portion of income and expenses to each class as a percent of its average net assets may vary due to the timing of recording these transactions in relation to fluctuating net assets of the classes. Expenses directly attributable to a fund are charged to that fund. Expenses attributable to more than one fund are allocated among the respective funds on the basis of relative net assets or other appropriate methods. Expense estimates are accrued in the period to which they relate and adjustments are made when actual amounts are known.
Income Tax Information and Distributions to Shareholders. Each year, the Fund intends to qualify as a regulated investment company under Subchapter M of the Internal Revenue Code, including distributing substantially all of its taxable income and realized gains. As a result, no provision for U.S. Federal income taxes is required. As of October 31, 2013, the Fund did not have any unrecognized tax benefits in the financial statements; nor is the Fund aware of any tax positions for which it is reasonably possible that the total amounts of unrecognized tax benefits will significantly change in the next twelve months. The Fund files a U.S. federal tax return, in addition to state and local tax returns as required. The Fund's federal income tax returns are subject to examination by the Internal Revenue Service (IRS) for a period of three fiscal years after they are filed. State and local tax returns may be subject to examination for an additional fiscal year depending on the jurisdiction. Foreign taxes are provided for based on the Fund's understanding of the tax rules and rates that exist in the foreign markets in which it invests.
Distributions are declared and recorded on the ex-dividend date. Income dividends and capital gain distributions are declared separately for each class. Income and capital gain distributions are determined in accordance with income tax regulations, which may differ from GAAP. In addition, the Fund claimed a portion of the payment made to redeeming shareholders as a distribution for income tax purposes.
Annual Report
Notes to Financial Statements - continued
3. Significant Accounting Policies - continued
Income Tax Information and Distributions to Shareholders - continued
Capital accounts within the financial statements are adjusted for permanent book-tax differences. These adjustments have no impact on net assets or the results of operations. Temporary book-tax differences will reverse in a subsequent period.
Book-tax differences are primarily due to foreign currency transactions, passive foreign investment companies (PFIC), partnerships, capital loss carryforwards and losses deferred due to wash sales.
The federal tax cost of investment securities and unrealized appreciation (depreciation) as of period end were as follows:
Gross unrealized appreciation | $ 30,185,400 |
Gross unrealized depreciation | (86,132,208) |
Net unrealized appreciation (depreciation) on securities and other investments | $ (55,946,808) |
| |
Tax Cost | $ 476,266,118 |
The tax-based components of distributable earnings as of period end were as follows:
Undistributed ordinary income | $ 4,627,021 |
Capital loss carryforward | $ (35,236,790) |
Net unrealized appreciation (depreciation) | $ (55,935,844) |
Capital loss carryforwards are only available to offset future capital gains of the Fund to the extent provided by regulations and may be limited. Under the Regulated Investment Company Modernization Act of 2010 (the Act), the Fund is permitted to carry forward capital losses incurred in taxable years beginning after December 22, 2010 for an unlimited period and such capital losses are required to be used prior to any losses that expire. The capital loss carryforward information presented below, including any applicable limitation, is estimated as of fiscal period end and is subject to adjustment.
Fiscal year of expiration | |
2019 | $ (6,952,413) |
No expiration | |
Short-term | (22,719,124) |
Long-term | (5,565,253) |
Total no expiration | (28,284,377) |
Total capital loss carryforward | $ (35,236,790) |
Annual Report
3. Significant Accounting Policies - continued
Income Tax Information and Distributions to Shareholders - continued
The tax character of distributions paid was as follows:
| October 31, 2013 | October 31, 2012 |
Ordinary Income | $ 5,697,049 | $ 4,364,384 |
Short-Term Trading (Redemption) Fees. Shares held by investors in the Fund less than 30 days may have been subject to a redemption fee equal to 1.00% of the net asset value of shares redeemed. All redemption fees, which reduce the proceeds of the shareholder redemption, are retained by the Fund and accounted for as an addition to paid in capital.
Restricted Securities. The Fund may invest in securities that are subject to legal or contractual restrictions on resale. These securities generally may be resold in transactions exempt from registration or to the public if the securities are registered. Disposal of these securities may involve time-consuming negotiations and expense, and prompt sale at an acceptable price may be difficult. Information regarding restricted securities is included at the end of the Fund's Schedule of Investments.
4. Purchases and Sales of Investments.
Purchases and sales of securities, other than short-term securities, aggregated $311,798,862 and $462,703,874, respectively.
5. Fees and Other Transactions with Affiliates.
Management Fee. FMR and its affiliates provide the Fund with investment management related services for which the Fund pays a monthly management fee. The management fee is the sum of an individual fund fee rate that is based on an annual rate of .45% of the Fund's average net assets and an annualized group fee rate that averaged .25% during the period. The group fee rate is based upon the average net assets of all the mutual funds advised by FMR, including any mutual funds previously advised by FMR that are currently advised by Fidelity SelectCo, LLC, an affiliate of FMR. The group fee rate decreases as assets under management increase and increases as assets under management decrease. For the reporting period, the total annual management fee rate was .71% of the Fund's average net assets.
Distribution and Service Plan Fees. In accordance with Rule 12b-1 of the 1940 Act, the Fund has adopted separate Distribution and Service Plans for each class of shares. Certain classes pay Fidelity Distributors Corporation (FDC), an affiliate of FMR, separate Distribution and Service Fees, each of which is based on an annual percentage of each class' average net assets. In addition, FDC may pay financial intermediaries for
Annual Report
Notes to Financial Statements - continued
5. Fees and Other Transactions with Affiliates - continued
Distribution and Service Plan Fees - continued
selling shares of the Fund and providing shareholder support services. For the period, the Distribution and Service Fee rates, total fees and amounts retained by FDC were as follows:
| Distribution
Fee | Service
Fee | Total Fees | Retained
by FDC |
Class A | -% | .25% | $ 208,174 | $ 2,543 |
Class T | .25% | .25% | 69,496 | 436 |
Class B | .75% | .25% | 26,532 | 19,956 |
Class C | .75% | .25% | 269,653 | 34,543 |
| | | $ 573,855 | $ 57,478 |
Sales Load. FDC may receive a front-end sales charge of up to 5.75% for selling Class A shares and 3.50% for selling Class T shares, some of which is paid to financial intermediaries for selling shares of the Fund. Depending on the holding period, FDC may receive contingent deferred sales charges levied on Class A, Class T, Class B, and Class C redemptions. The deferred sales charges range from 5.00% to 1.00% for Class B shares, 1.00% for Class C shares, 1.00% for certain purchases of Class A shares and .25% for certain purchases of Class T shares.
For the period, sales charge amounts retained by FDC were as follows:
| Retained
by FDC |
Class A | $ 27,444 |
Class T | 2,976 |
Class B* | 7,373 |
Class C* | 3,342 |
| $ 41,135 |
* When Class B and Class C shares are initially sold, FDC pays commissions from its own resources to financial intermediaries through which the sales
are made.
Transfer Agent Fees. Fidelity Investments Institutional Operations Company, Inc., (FIIOC), an affiliate of FMR, is the transfer, dividend disbursing and shareholder servicing agent for each class of the Fund. FIIOC receives account fees and asset-based fees that vary according to the account size and type of account of the shareholders of the respective classes of the Fund. FIIOC pays for typesetting, printing and mailing of shareholder reports, except proxy statements.
Annual Report
5. Fees and Other Transactions with Affiliates - continued
Transfer Agent Fees - continued
For the period, transfer agent fees for each class were as follows:
| Amount | % of
Average
Net Assets |
Class A | $ 246,621 | .30 |
Class T | 42,562 | .31 |
Class B | 7,942 | .30 |
Class C | 81,004 | .30 |
Global Commodity Stock | 944,581 | .30 |
Institutional Class | 100,298 | .23 |
| $ 1,423,008 | |
Accounting and Security Lending Fees. Fidelity Service Company, Inc. (FSC), an affiliate of FMR, maintains the Fund's accounting records. The accounting fee is based on the level of average net assets for each month. Under a separate contract, FSC administers the security lending program. The security lending fee is based on the number and duration of lending transactions.
Brokerage Commissions. The Fund placed a portion of its portfolio transactions with brokerage firms which are affiliates of the investment adviser. Brokerage commissions are included in net realized gain (loss) and change in net unrealized appreciation (depreciation) in the Statement of Operations. The commissions paid to these affiliated firms were $19,771 for the period.
Interfund Lending Program. Pursuant to an Exemptive Order issued by the SEC, the Fund, along with other registered investment companies having management contracts with FMR, may participate in an interfund lending program. This program provides an alternative credit facility allowing the funds to borrow from, or lend money to, other participating affiliated funds. At period end, there were no interfund loans outstanding. The Fund's activity in this program during the period for which loans were outstanding was as follows:
Borrower or Lender | Average Loan
Balance | Weighted Average
Interest Rate | Interest
Expense |
Borrower | $ 3,605,577 | .41% | $ 1,065 |
6. Committed Line of Credit.
The Fund participates with other funds managed by FMR or an affiliate in a $4.25 billion credit facility (the "line of credit") to be utilized for temporary or emergency purposes to fund shareholder redemptions or for other short-term liquidity purposes. The Fund has
Annual Report
Notes to Financial Statements - continued
6. Committed Line of Credit - continued
agreed to pay commitment fees on its pro-rata portion of the line of credit, which amounted to $1,125 and is reflected in Miscellaneous expenses on the Statement of Operations. During the period, there were no borrowings on this line of credit.
7. Security Lending.
The Fund lends portfolio securities through a lending agent from time to time in order to earn additional income. For equity securities, a lending agent is used and may loan securities to certain qualified borrowers, including Fidelity Capital Markets (FCM), a broker-dealer affiliated with the Fund. On the settlement date of the loan, the Fund receives collateral (in the form of U.S. Treasury obligations, letters of credit and/or cash) against the loaned securities and maintains collateral in an amount not less than 100% of the market value of the loaned securities during the period of the loan. The market value of the loaned securities is determined at the close of business of the Fund and any additional required collateral is delivered to the Fund on the next business day. If the borrower defaults on its obligation to return the securities loaned because of insolvency or other reasons, the Fund may apply collateral received from the borrower against the obligation. The Fund may experience delays and costs in recovering the securities loaned. Any cash collateral received is invested in the Fidelity Securities Lending Cash Central Fund. The value of loaned securities and cash collateral at period end are disclosed on the Fund's Statement of Assets and Liabilities. At period end, there were no security loans outstanding with FCM. Security lending income represents the income earned on investing cash collateral, less rebates paid to borrowers and any lending agent fees associated with the loan, plus any premium payments received for lending certain types of securities. Security lending income is presented in the Statement of Operations as a component of income from Fidelity Central Funds. Total security lending income during the period amounted to $554,965, including $24,917 from securities loaned to FCM.
8. Bank Borrowings.
The Fund is permitted to have bank borrowings for temporary or emergency purposes to fund shareholder redemptions or for other short-term liquidity requirements. The Fund has established borrowing arrangements with certain banks. The interest rate on the borrowings is the bank's base rate, as revised from time to time. The average loan balance during the period for which loans were outstanding amounted to $1,129,500. The weighted average interest rate was .65%. The interest expense amounted to $41 under the bank borrowing program. At period end, there were no bank borrowings outstanding.
Annual Report
9. Expense Reductions.
Commissions paid to certain brokers with whom FMR, or its affiliates, places trades on behalf of the Fund include an amount in addition to trade execution, which may be rebated back to the Fund to offset certain expenses. This amount totaled $62,291 for the period.
In addition, FMR reimbursed a portion of the Fund's operating expenses during the period in the amount of $7,144.
10. Distributions to Shareholders.
Distributions to shareholders of each class were as follows:
Years ended October 31, | 2013 | 2012 |
From net investment income | | |
Class A | $ 864,701 | $ 437,422 |
Class T | 89,063 | 12,232 |
Class B | 847 | - |
Class C | 32,277 | - |
Global Commodity Stock | 4,073,304 | 2,878,965 |
Institutional Class | 636,857 | 364,302 |
Total | $ 5,697,049 | $ 3,692,921 |
From net realized gain | | |
Class A | $ - | $ 117,768 |
Class T | - | 19,027 |
Global Commodity Stock | - | 479,827 |
Institutional Class | - | 54,841 |
Total | $ - | $ 671,463 |
11. Share Transactions.
Transactions for each class of shares were as follows:
| Shares | Dollars |
Years ended October 31, | 2013 | 2012 | 2013 | 2012 |
Class A | | | | |
Shares sold | 1,201,755 | 1,675,922 | $ 16,769,552 | $ 24,194,276 |
Reinvestment of distributions | 52,559 | 32,805 | 744,754 | 472,060 |
Shares redeemed | (3,054,897) | (3,329,384) | (42,479,556) | (47,357,051) |
Net increase (decrease) | (1,800,583) | (1,620,657) | $ (24,965,250) | $ (22,690,715) |
Class T | | | | |
Shares sold | 130,604 | 189,622 | $ 1,791,142 | $ 2,764,209 |
Reinvestment of distributions | 5,824 | 1,948 | 82,471 | 28,015 |
Shares redeemed | (396,060) | (424,718) | (5,490,961) | (6,023,857) |
Net increase (decrease) | (259,632) | (233,148) | $ (3,617,348) | $ (3,231,633) |
Annual Report
Notes to Financial Statements - continued
11. Share Transactions - continued
| Shares | Dollars |
Years ended October 31, | 2013 | 2012 | 2013 | 2012 |
Class B | | | | |
Shares sold | 7,047 | 7,831 | $ 98,902 | $ 113,787 |
Reinvestment of distributions | 54 | - | 758 | - |
Shares redeemed | (57,569) | (81,206) | (793,852) | (1,157,702) |
Net increase (decrease) | (50,468) | (73,375) | $ (694,192) | $ (1,043,915) |
Class C | | | | |
Shares sold | 368,295 | 492,632 | $ 5,059,285 | $ 7,143,884 |
Reinvestment of distributions | 1,963 | - | 27,576 | - |
Shares redeemed | (880,659) | (761,541) | (12,048,987) | (10,673,957) |
Net increase (decrease) | (510,401) | (268,909) | $ (6,962,126) | $ (3,530,073) |
Global Commodity Stock | | | | |
Shares sold | 5,296,700 | 7,606,851 | $ 74,369,495 | $ 109,989,271 |
Reinvestment of distributions | 264,635 | 210,059 | 3,760,465 | 3,031,159 |
Shares redeemed | (12,764,042) | (16,330,927) | (177,408,171) | (233,733,610) |
Net increase (decrease) | (7,202,707) | (8,514,017) | $ (99,278,211) | $ (120,713,180) |
Institutional Class | | | | |
Shares sold | 1,153,936 | 1,589,148 | $ 16,235,437 | $ 22,944,496 |
Reinvestment of distributions | 25,953 | 18,526 | 368,529 | 267,335 |
Shares redeemed | (2,405,021) | (2,034,602) | (33,510,048) | (28,631,896) |
Net increase (decrease) | (1,225,132) | (426,928) | $ (16,906,082) | $ (5,420,065) |
12. Other.
The Fund's organizational documents provide former and current trustees and officers with a limited indemnification against liabilities arising in connection with the performance of their duties to the Fund. In the normal course of business, the Fund may also enter into contracts that provide general indemnifications. The Fund's maximum exposure under these arrangements is unknown as this would be dependent on future claims that may be made against the Fund. The risk of material loss from such claims is considered remote.
At the end of the period, FMR or its affiliates were the owners of record of 10% of the total outstanding shares of the Fund.
Annual Report
To the Trustees of Fidelity Investment Trust and the Shareholders of Fidelity Global Commodity Stock Fund:
In our opinion, the accompanying statement of assets and liabilities, including the schedule of investments, and the related statements of operations and of changes in net assets and the financial highlights present fairly, in all material respects, the financial position of Fidelity Global Commodity Stock Fund (a fund of Fidelity Investment Trust) at October 31, 2013, the results of its operations for the year then ended, the changes in its net assets for each of the two years in the period then ended and the financial highlights for each of the periods indicated, in conformity with accounting principles generally accepted in the United States of America. These financial statements and financial highlights (hereafter referred to as "financial statements") are the responsibility of the Fidelity Global Commodity Stock Fund's management. Our responsibility is to express an opinion on these financial statements based on our audits. We conducted our audits of these financial statements in accordance with the standards of the Public Company Accounting Oversight Board (United States). Those standards require that we plan and perform the audit to obtain reasonable assurance about whether the financial statements are free of material misstatement. An audit includes examining, on a test basis, evidence supporting the amounts and disclosures in the financial statements, assessing the accounting principles used and significant estimates made by management, and evaluating the overall financial statement presentation. We believe that our audits, which included confirmation of securities at October 31, 2013 by correspondence with the custodian and brokers, provide a reasonable basis for our opinion.
PricewaterhouseCoopers LLP
Boston, Massachusetts
December 13, 2013
Annual Report
The Trustees, Member of the Advisory Board, and executive officers of the trust and fund, as applicable, are listed below. The Board of Trustees governs the fund and is responsible for protecting the interests of shareholders. The Trustees are experienced executives who meet periodically throughout the year to oversee the fund's activities, review contractual arrangements with companies that provide services to the fund, oversee management of the risks associated with such activities and contractual arrangements, and review the fund's performance. Except for James C. Curvey, Ned C. Lautenbach, Ronald P. O'Hanley, and William S. Stavropoulos, each of the Trustees oversees 171 funds. Mr. Curvey oversees 394 funds. Mr. O'Hanley, Mr. Lautenbach, and Mr. Stavropoulos each oversees 245 funds.
The Trustees hold office without limit in time except that (a) any Trustee may resign; (b) any Trustee may be removed by written instrument, signed by at least two-thirds of the number of Trustees prior to such removal; (c) any Trustee who requests to be retired or who has become incapacitated by illness or injury may be retired by written instrument signed by a majority of the other Trustees; and (d) any Trustee may be removed at any special meeting of shareholders by a two-thirds vote of the outstanding voting securities of the trust. Each Trustee who is not an interested person of the trust and the fund (as defined in the 1940 Act) (Independent Trustee), shall retire not later than the last day of the calendar year in which his or her 75th birthday occurs. The Independent Trustees may waive this mandatory retirement age policy with respect to individual Trustees. The executive officers and Advisory Board Member hold office without limit in time, except that any officer and Advisory Board Member may resign or may be removed by a vote of a majority of the Trustees at any regular meeting or any special meeting of the Trustees. Except as indicated, each individual has held the office shown or other offices in the same company for the past five years.
Experience, Skills, Attributes, and Qualifications of the Fund's Trustees. The Governance and Nominating Committee has adopted a statement of policy that describes the experience, qualifications, attributes, and skills that are necessary and desirable for potential Independent Trustee candidates (Statement of Policy). The Board believes that each Trustee satisfied at the time he or she was initially elected or appointed a Trustee, and continues to satisfy, the standards contemplated by the Statement of Policy. The Governance and Nominating Committee also engages professional search firms to help identify potential Independent Trustee candidates who have the experience, qualifications, attributes, and skills consistent with the Statement of Policy. From time to time, additional criteria based on the composition and skills of the current Independent Trustees, as well as experience or skills that may be appropriate in light of future changes to board composition, business conditions, and regulatory or other developments, have also been considered by the professional search firms and the Governance and Nominating Committee. In addition, the Board takes into account the Trustees' commitment and participation in Board and committee meetings, as well as their leadership of standing and ad hoc committees throughout their tenure.
Annual Report
In determining that a particular Trustee was and continues to be qualified to serve as a Trustee, the Board has considered a variety of criteria, none of which, in isolation, was controlling. The Board believes that, collectively, the Trustees have balanced and diverse experience, qualifications, attributes, and skills, which allow the Board to operate effectively in governing the fund and protecting the interests of shareholders. Information about the specific experience, skills, attributes, and qualifications of each Trustee, which in each case led to the Board's conclusion that the Trustee should serve (or continue to serve) as a trustee of the fund, is provided below.
Board Structure and Oversight Function. James C. Curvey is an interested person (as defined in the 1940 Act) and currently serves as Chairman. The Trustees have determined that an interested Chairman is appropriate and benefits shareholders because an interested Chairman has a personal and professional stake in the quality and continuity of services provided to the fund. Independent Trustees exercise their informed business judgment to appoint an individual of their choosing to serve as Chairman, regardless of whether the Trustee happens to be independent or a member of management. The Independent Trustees have determined that they can act independently and effectively without having an Independent Trustee serve as Chairman and that a key structural component for assuring that they are in a position to do so is for the Independent Trustees to constitute a substantial majority for the Board. The Independent Trustees also regularly meet in executive session. Ned C. Lautenbach serves as Chairman of the Independent Trustees and as such (i) acts as a liaison between the Independent Trustees and management with respect to matters important to the Independent Trustees and (ii) with management prepares agendas for Board meetings.
Fidelity funds are overseen by different Boards of Trustees. The fund's Board oversees Fidelity's equity and high income funds and another Board oversees Fidelity's investment-grade bond, money market, and asset allocation funds. The asset allocation funds may invest in Fidelity funds overseen by the fund's Board. The use of separate Boards, each with its own committee structure, allows the Trustees of each group of Fidelity funds to focus on the unique issues of the funds they oversee, including common research, investment, and operational issues. On occasion, the separate Boards establish joint committees to address issues of overlapping consequences for the Fidelity funds overseen by each Board.
The Trustees operate using a system of committees to facilitate the timely and efficient consideration of all matters of importance to the Trustees, the fund, and fund shareholders and to facilitate compliance with legal and regulatory requirements and oversight of the fund's activities and associated risks. The Board, acting through its committees, has charged FMR and its affiliates with (i) identifying events or circumstances the occurrence of which could have demonstrably adverse effects on the fund's business and/or reputation; (ii) implementing processes and controls to lessen the possibility that such events or circumstances occur or to mitigate the effects of such events or circumstances if they do occur; and (iii) creating and maintaining a system designed to evaluate continuously business and market conditions in order to facilitate the identification and implementation processes described in (i) and (ii) above. Because the day-to-day operations and activities of the fund are carried out by or through FMR, its affiliates and other service providers, the fund's exposure to risks is mitigated but not eliminated by the processes overseen by the Trustees. While each of the Board's committees has responsibility for overseeing different aspects of the fund's activities, oversight is exercised primarily through the Operations, Audit, and Compliance Committees. In addition, the Independent Trustees have worked with FMR to enhance the Board's oversight of investment and financial risks, legal and regulatory risks, technology risks, and operational risks, including the development of additional risk reporting to the Board. For example, a working group comprised of Independent Trustees and FMR has worked and continues to work to review the Fidelity funds' valuation-related activities, reporting and risk management. Appropriate personnel, including but not limited to the fund's Chief Compliance Officer (CCO), FMR's internal auditor, the independent accountants, the fund's Treasurer and portfolio management personnel, make periodic reports to the Board's committees, as appropriate, including an annual review of FMR's risk management program for the Fidelity funds. The responsibilities of each standing committee, including their oversight responsibilities, are described further under "Standing Committees of the Fund's Trustees."
Annual Report
Trustees and Officers - continued
The fund's Statement of Additional Information (SAI) includes more information about the Trustees. To request a free copy, call Fidelity at 1-877-208-0098.
Interested Trustees*:
Correspondence intended for each Trustee who is an interested person may be sent to Fidelity Investments, 245 Summer Street, Boston, Massachusetts 02210.
Name, Year of Birth; Principal Occupations and Other Relevant Experience+ |
James C. Curvey (1935) |
Year of Election or Appointment: 2007 Trustee Chairman of the Board of Trustees |
| Mr. Curvey also serves as Trustee of other Fidelity funds. Mr. Curvey is a Director of Fidelity Investments Money Management, Inc. (2009-present), Director of Fidelity Research & Analysis Co. (2009-present) and Director of FMR and FMR Co., Inc. (2007-present). Mr. Curvey is also Vice Chairman (2007-present) and Director of FMR LLC. In addition, Mr. Curvey serves as an Overseer for the Boston Symphony Orchestra and a member of the Trustees of Villanova University. Previously, Mr. Curvey was the Vice Chairman (2006-2007) and Director (2000-2007) of FMR Corp. |
Ronald P. O'Hanley (1957) |
Year of Election or Appointment: 2011 Trustee |
| Mr. O'Hanley also serves as Trustee of other Fidelity funds. He is Director of Fidelity SelectCo, LLC (2013-present), FMR Co., Inc. (2010-present), Director of Fidelity Investments Money Management, Inc. (2010-present), Director of Fidelity Research & Analysis Company (2010-present), President of Fidelity Asset Management and Corporate Services and a Member of Fidelity's Executive Committee (2010-present). Previously, Mr. O'Hanley served as President and Chief Executive Officer of BNY Mellon Asset Management (2007-2010). Mr. O'Hanley also served as Vice Chairman of Bank New York Mellon Corp. and a member of that firm's Executive Committee. Prior to the 2007 merger of The Bank of New York and Mellon Financial Corporation, he was Vice Chairman of Mellon Financial Corporation and President and Chief Executive Officer of Mellon Asset Management. He joined Mellon in February 1997. Mr. O'Hanley currently serves as Chairman of the Boston Public Library Foundation Board of Directors and sits on the Board of Directors of Beth Israel Deaconess Medical Center, the Board of Trustees of the Marine Biological Laboratory and the Advisory Board of the Maxwell School of Citizenship and Public Administration at Syracuse University. Mr. O'Hanley also chairs the Council on Asset Management for the Financial Services Roundtable and is a member of the Board of Directors of Institutional Investor's U.S. Institute. |
* Trustees have been determined to be "Interested Trustees" by virtue of, among other things, their affiliation with the trust or various entities under common control with FMR.
+ The information above includes each Trustee's principal occupation during the last five years and other information relating to the experience, attributes, and skills relevant to each Trustee's qualifications to serve as a Trustee, which led to the conclusion that each Trustee should serve as a Trustee for the fund.
Annual Report
Trustees and Officers - continued
Independent Trustees:
Correspondence intended for each Independent Trustee (that is, the Trustees other than the Interested Trustees) may be sent to Fidelity Investments, P.O. Box 55235, Boston, Massachusetts 02205-5235.
Name, Year of Birth; Principal Occupations and Other Relevant Experience+ |
Dennis J. Dirks (1948) |
Year of Election or Appointment: 2005 Trustee |
| Mr. Dirks also serves as Trustee of other Fidelity funds. Prior to his retirement in May 2003, Mr. Dirks was Chief Operating Officer and a member of the Board of The Depository Trust & Clearing Corporation (DTCC). He also served as President, Chief Operating Officer, and Board member of The Depository Trust Company (DTC) and President and Board member of the National Securities Clearing Corporation (NSCC). In addition, Mr. Dirks served as Chief Executive Officer and Board member of the Government Securities Clearing Corporation, Chief Executive Officer and Board member of the Mortgage-Backed Securities Clearing Corporation, as a Trustee and a member of the Finance Committee of Manhattan College (2005-2008), and as a Trustee and a member of the Finance Committee of AHRC of Nassau County (2006-2008). Mr. Dirks is a member of the Independent Directors Council (IDC) Governing Council (2010-present) and Board of Directors for The Brookville Center for Children's Services, Inc. (2009-present). |
Alan J. Lacy (1953) |
Year of Election or Appointment: 2008 Trustee |
| Mr. Lacy also serves as Trustee of other Fidelity funds. Mr. Lacy serves as Senior Adviser (2007-present) of Oak Hill Capital Partners, L.P. (private equity). Mr. Lacy also served as Chief Executive Officer (2000-2005) and Vice Chairman (2005-2006) of Sears Holdings Corporation and Sears, Roebuck and Co. (retail). In addition, Mr. Lacy serves as a member of the Board of Directors of Dave & Buster's Entertainment, Inc. (restaurant and entertainment complexes, 2010-present), Earth Fare, Inc. (retail grocery, 2012-present), The Hillman Companies, Inc. (hardware wholesalers, 2010-present), and Bristol-Myers Squibb Company (global pharmaceuticals, 2008-present). Mr. Lacy is a member of the Board of Trustees of The National Parks Conservation Association (2006-present). Previously, Mr. Lacy served as Chairman of the Board of Trustees of the National Parks Conservation Association (2008-2011) and as a member of the Board of Directors for the Western Union Company (global money transfer, 2006-2011). |
Ned C. Lautenbach (1944) |
Year of Election or Appointment: 2000 Trustee Chairman of the Independent Trustees |
| Mr. Lautenbach also serves as Trustee of other Fidelity funds. Mr. Lautenbach currently serves as the Lead Director of the Eaton Corporation Board of Directors (diversified industrial, 1997-present). Mr. Lautenbach is Chairman of the Board of Directors of the Philharmonic Center for the Arts in Naples, Florida (2012-present) and a member of the Council on Foreign Relations (1994-present). Previously, Mr. Lautenbach was a Partner/Advisory Partner at Clayton, Dubilier & Rice, LLC (private equity investment, 1998-2010), as well as a Director of Sony Corporation (2006-2007). |
Joseph Mauriello (1944) |
Year of Election or Appointment: 2008 Trustee |
| Mr. Mauriello also serves as Trustee of other Fidelity funds. Prior to his retirement in January 2006, Mr. Mauriello served in numerous senior management positions including Deputy Chairman and Chief Operating Officer (2004-2005), and Vice Chairman of Financial Services (2002-2004) of KPMG LLP US (professional services, 1965-2005). Mr. Mauriello currently serves as a member of the Board of Directors of XL Group plc. (global insurance and re-insurance, 2006-present). Previously, Mr. Mauriello served as a Director of the Hamilton Funds of the Bank of New York (2006-2007) and of Arcadia Resources Inc. (health care services and products, 2007-2012). |
Robert W. Selander (1950) |
Year of Election or Appointment: 2011 Trustee |
| Mr. Selander also serves as Trustee of other Fidelity funds. Previously, Mr. Selander served as a Member of the Advisory Board of other Fidelity funds (2011), and Executive Vice Chairman (2010), Chief Executive Officer (2009-2010), and President and Chief Executive Officer (1997-2009) of Mastercard, Inc. |
Cornelia M. Small (1944) |
Year of Election or Appointment: 2005 Trustee |
| Ms. Small also serves as Trustee of other Fidelity funds. Ms. Small is a member of the Board of Directors (2009-present) and Chair of the Investment Committee (2010-present) of the Teagle Foundation. Ms. Small also serves on the Investment Committee of the Berkshire Taconic Community Foundation (2008-present). Previously, Ms. Small served as Chairperson (2002-2008) and a member of the Investment Committee and Chairperson (2008-2012) and a member of the Board of Trustees of Smith College. In addition, Ms. Small served as Chief Investment Officer, Director of Global Equity Investments, and a member of the Board of Directors of Scudder, Stevens & Clark and Scudder Kemper Investments. |
William S. Stavropoulos (1939) |
Year of Election or Appointment: 2001 Trustee Vice Chairman of the Independent Trustees |
| Mr. Stavropoulos also serves as Trustee of other Fidelity funds. Mr. Stavropoulos serves as President and Founder of the Michigan Baseball Foundation, the Great Lakes Loons (2007-present). Mr. Stavropoulos is Chairman Emeritus of the Board of Directors of The Dow Chemical Company, where he previously served in numerous senior management positions, including President, CEO (1995-2000; 2002-2004), Chairman of the Executive Committee (2000-2006), and as a member of the Board of Directors (1990-2006). Currently, Mr. Stavropoulos is Chairman of the Board of Directors of Univar Inc. (global distributor of commodity and specialty chemicals), a Director of Teradata Corporation (data warehousing and technology solutions), and Maersk Inc. (industrial conglomerate), and a member of the Advisory Board for Metalmark Capital LLC (private equity investment, 2005-present). Mr. Stavropoulos is an operating advisor to Clayton, Dubilier & Rice, LLC (private equity investment). In addition, Mr. Stavropoulos is a member of the University of Notre Dame Advisory Council for the College of Science, a Trustee of the Rollin L. Gerstacker Foundation, and a Director of the Naples Philharmonic Center for the Arts. Previously, Mr. Stavropoulos served as a Director of Chemical Financial Corporation (bank holding company, 1993-2012) and Tyco International, Ltd. (multinational manufacturing and services, 2007-2012). |
David M. Thomas (1949) |
Year of Election or Appointment: 2008 Trustee |
| Mr. Thomas also serves as Trustee of other Fidelity funds. Mr. Thomas serves as Non-Executive Chairman of the Board of Directors of Fortune Brands Home and Security (home and security products, 2011-present), and as a member of the Board of Directors of Interpublic Group of Companies, Inc. (marketing communication, 2004-present). Previously, Mr. Thomas served as Executive Chairman (2005-2006) and Chairman and Chief Executive Officer (2000-2005) of IMS Health, Inc. (pharmaceutical and healthcare information solutions), and a Director of Fortune Brands, Inc. (consumer products, 2000-2011). |
+ The information above includes each Trustee's principal occupation during the last five years and other information relating to the experience, attributes, and skills relevant to each Trustee's qualifications to serve as a Trustee, which led to the conclusion that each Trustee should serve as a Trustee for the fund.
Advisory Board Member and Executive Officers:
Correspondence intended for each executive officer and Peter S. Lynch may be sent to Fidelity Investments, 245 Summer Street, Boston, Massachusetts 02210. Executive officers appear below in alphabetical order.
Name, Year of Birth; Principal Occupation |
Peter S. Lynch (1944) |
Year of Election or Appointment: 2003 Member of the Advisory Board |
| Mr. Lynch also serves as Member of the Advisory Board of other Fidelity funds. Mr. Lynch is Vice Chairman and a Director of FMR and FMR Co., Inc. In addition, Mr. Lynch serves as a Trustee of Boston College and as the Chairman of the Inner-City Scholarship Fund. Previously, Mr. Lynch served on the Special Olympics International Board of Directors (1997-2006). |
Elizabeth Paige Baumann (1968) |
Year of Election or Appointment: 2012 Anti-Money Laundering (AML) Officer |
| Ms. Baumann also serves as AML Officer of other funds. She is Chief AML Officer of FMR LLC (2012-present) and is an employee of Fidelity Investments. Previously, Ms. Baumann served as Vice President and Deputy Anti-Money Laundering Officer (2007-2012). |
William C. Coffey (1969) |
Year of Election or Appointment: 2009 Assistant Secretary |
| Mr. Coffey also serves as Assistant Secretary of other funds. He is Senior Vice President and Deputy General Counsel of FMR LLC (2010-present), and is an employee of Fidelity Investments. Previously, Mr. Coffey served as Vice President and Associate General Counsel of FMR LLC (2005-2009). |
Jonathan Davis (1968) |
Year of Election or Appointment: 2010 Assistant Treasurer |
| Mr. Davis also serves as Assistant Treasurer of other funds. Mr. Davis is an employee of Fidelity Investments. Previously, Mr. Davis served as Vice President and Associate General Counsel of FMR LLC (2003-2010). |
Adrien E. Deberghes (1967) |
Year of Election or Appointment: 2008 Deputy Treasurer |
| Mr. Deberghes also serves as an officer of other funds. He is an employee of Fidelity Investments (2008-present). Prior to joining Fidelity Investments, Mr. Deberghes was Senior Vice President of Mutual Fund Administration at State Street Corporation (2007-2008), Senior Director of Mutual Fund Administration at Investors Bank & Trust (2005-2007), and Director of Finance for Dunkin' Brands (2000-2005). |
Stephanie J. Dorsey (1969) |
Year of Election or Appointment: 2010 Assistant Treasurer |
| Ms. Dorsey also serves as an officer of other funds. She is an employee of Fidelity Investments (2008-present) and has served in other fund officer roles. Prior to joining Fidelity Investments, Ms. Dorsey served as Treasurer (2004-2008) of the JPMorgan Mutual Funds and Vice President (2004-2008) of JPMorgan Chase Bank. |
Scott C. Goebel (1968) |
Year of Election or Appointment: 2008 Secretary and Chief Legal Officer (CLO) |
| Mr. Goebel serves as Secretary and CLO of other funds. Mr. Goebel also serves as Secretary of Fidelity Investments Money Management, Inc. (FIMM) (2010-present) and Fidelity Research and Analysis Company (FRAC) (2010-present); General Counsel, Secretary, and Senior Vice President of FMR (2008-present) and FMR Co., Inc. (2008-present); Chief Legal Officer of Fidelity Management & Research (Hong Kong) Limited (2008-present) and Assistant Secretary of Fidelity Management & Research (Japan) Inc. (2008-present), and Fidelity Management & Research (U.K.) Inc. (2008-present). Previously, Mr. Goebel served as Secretary and CLO of other Fidelity funds (2008-2013), Assistant Secretary of FIMM (2008-2010), FRAC (2008-2010), and certain funds (2007-2008); and as Vice President and Secretary of Fidelity Distributors Corporation (FDC) (2005-2007). Mr. Goebel has been employed by FMR LLC or an affiliate since 2001. |
Joseph A. Hanlon (1968) |
Year of Election or Appointment: 2012 Chief Compliance Officer |
| Mr. Hanlon also serves as Chief Compliance Officer of other funds. Mr. Hanlon serves as Compliance Officer of FMR, FMR Co., Inc., Fidelity Investments Money Management, Inc. (FIMM), Fidelity Research and Analysis Company (FRAC), and Fidelity Management & Research (Hong Kong) (2009-present), as Senior Vice President of the Fidelity Asset Management Division (2009-present), and is an employee of Fidelity Investments. Previously, Mr. Hanlon served as Compliance Officer of Fidelity Management & Research (Japan) Inc. (2009-2013), Strategic Advisers, Inc. (2009-2013), and Fidelity Management & Research (U.K.) Inc. (2009-2013). |
Bruce T. Herring (1965) |
Year of Election or Appointment: 2006 Vice President of certain Equity Funds |
| Mr. Herring also serves as Vice President of other funds. He serves as Chief Investment Officer of Fidelity Global Asset Allocation (GAA) (2013-present), Chief Investment Officer and Director of Fidelity Management & Research (U.K.) Inc. (2010-present), Group Chief Investment Officer of FMR, and President of Fidelity Research & Analysis Company (2010-present). Previously, Mr. Herring served as Vice President (2005-2006) and Senior Vice President (2006-2007) of Fidelity Management & Research Company, Vice President of FMR Co., Inc. (2001-2007), and as a portfolio manager for Fidelity U.S. Equity Funds. |
Brian B. Hogan (1964) |
Year of Election or Appointment: 2009 Vice President |
| Mr. Hogan also serves as Vice President of other funds. Mr. Hogan serves as President of FMR's Equity Division (2009-present). Previously, Mr. Hogan served as Senior Vice President, Equity Research of FMR (2006-2009) and as a portfolio manager. |
Chris Maher (1972) |
Year of Election or Appointment: 2013 Assistant Treasurer |
| Mr. Maher serves as Assistant Treasurer of other funds. Mr. Maher is Vice President of Valuation Oversight and is an employee of Fidelity Investments. Previously, Mr. Maher served as Vice President of Asset Management Compliance (2013), Vice President of FMR's Program Management Group (2010-2013), and Vice President of Valuation Oversight (2008-2010). |
Christine Reynolds (1958) |
Year of Election or Appointment: 2008 Chief Financial Officer |
| Ms. Reynolds also serves as Chief Financial Officer of other funds. Ms. Reynolds became President of Fidelity Pricing and Cash Management Services (FPCMS) in August 2008. Ms. Reynolds served as Chief Operating Officer of FPCMS (2007-2008). Previously, Ms. Reynolds served as President, Treasurer, and Anti-Money Laundering officer of the Fidelity funds (2004-2007). |
Kenneth B. Robins (1969) |
Year of Election or Appointment: 2008 President and Treasurer |
| Mr. Robins also serves as an officer of other funds. Mr. Robins serves as Executive Vice President of Fidelity Investments Money Management, Inc. (FIMM) (2013-present) and is an employee of Fidelity Investments (2004-present). Previously, Mr. Robins served in other fund officer roles. |
Gary W. Ryan (1958) |
Year of Election or Appointment: 2005 Assistant Treasurer |
| Mr. Ryan also serves as Assistant Treasurer of other funds. Mr. Ryan is an employee of Fidelity Investments and has served in other fund officer roles. Previously, Mr. Ryan served as Vice President of Fund Reporting in Fidelity Pricing and Cash Management Services (FPCMS) (1999-2005). |
Stephen Sadoski (1971) |
Year of Election or Appointment: 2012 Deputy Treasurer |
| Mr. Sadoski also serves as Deputy Treasurer of other funds. He is an employee of Fidelity Investments (2012-present) and has served in another fund officer role. Prior to joining Fidelity Investments, Mr. Sadoski served as an assistant chief accountant in the Division of Investment Management of the Securities and Exchange Commission (SEC) (2009-2012) and as a senior manager at Deloitte & Touche LLP (1997-2009). |
Stacie M. Smith (1974) |
Year of Election or Appointment: 2013 Deputy Treasurer |
| Ms. Smith also serves as an officer of other funds. She is an employee of Fidelity Investments (2009-present) and has served in other fund officer roles. Prior to joining Fidelity Investments, Ms. Smith served as Senior Audit Manager of Ernst & Young LLP (1996-2009). |
Renee Stagnone (1975) |
Year of Election or Appointment: 2013 Deputy Treasurer |
| Ms. Stagnone also serves as Deputy Treasurer of other funds. Ms. Stagnone is an employee of Fidelity Investments. |
Joseph F. Zambello (1957) |
Year of Election or Appointment: 2011 Deputy Treasurer |
| Mr. Zambello also serves as Deputy Treasurer of other funds. Mr. Zambello is an employee of Fidelity Investments. Previously, Mr. Zambello served as Vice President of FMR's Program Management Group (2009-2011) and Vice President of the Transfer Agent Oversight Group (2005-2009). |
Annual Report
The Board of Trustees of Fidelity Global Commodity Stock Fund voted to pay to shareholders of record at the opening of business on record date, the following distributions per share derived from capital gains realized from sales of portfolio securities, and dividends derived from net investment income:
| Pay Date | Record Date | Dividends | Capital Gains |
Class A | 12/09/13 | 12/06/13 | $0.146 | $0.013 |
Class T | 12/09/13 | 12/06/13 | $0.113 | $0.013 |
Class B | 12/09/13 | 12/06/13 | $0.029 | $0.013 |
Class C | 12/09/13 | 12/06/13 | $0.033 | $0.013 |
Class A designates 72%, Class T designates 100%, Class B designates 100%, and Class C designates 100% of the dividend distributed during the fiscal year as qualifying for the dividends-received deduction for corporate shareholders.
Class A, T, B, and C designate 100% of the dividend distributed during the fiscal year as amounts which may be taken into account as a dividend for purposes of the maximum rate under section 1(h)(11) of the Internal Revenue Code.
The amounts per share which represent income derived from sources within, and taxes paid to, foreign countries or possessions of the United States are as follows:
| Pay Date | Income | Taxes |
Class A | 12/10/12 | $0.137 | $0.0105 |
Class T | 12/10/12 | $0.090 | $0.0105 |
Class B | 12/10/12 | $0.014 | $0.0105 |
Class C | 12/10/12 | $0.025 | $0.0105 |
The fund will notify shareholders in January 2014 of amounts for use in preparing 2013 income tax returns.
Annual Report
Board Approval of Investment Advisory Contracts and Management Fees
Fidelity Global Commodity Stock Fund
Each year, the Board of Trustees, including the Independent Trustees (together, the Board), votes on the renewal of the management contract and sub-advisory agreements (together, the Advisory Contracts) for the fund. The Board, assisted by the advice of fund counsel and Independent Trustees' counsel, requests and considers a broad range of information relevant to the renewal of the Advisory Contracts throughout the year.
The Board meets regularly and, at each of its meetings, covers an extensive agenda of topics and materials and considers factors that are relevant to its annual consideration of the renewal of the fund's Advisory Contracts, including the services and support provided to the fund and its shareholders. The Board has established various standing committees, each composed of and chaired by Independent Trustees with varying backgrounds, to which the Board has assigned specific subject matter responsibilities in order to enhance effective decision-making by the Board. The Board, acting directly and through its Committees, requests and receives information concerning the annual consideration of the renewal of the fund's Advisory Contracts. The Board also meets as needed to consider matters specifically related to the Board's annual consideration of the renewal of Advisory Contracts. Members of the Board may also meet with trustees of other Fidelity funds through ad hoc joint committees to discuss certain matters relevant to the Fidelity funds.
At its July 2013 meeting, the Board, including the Independent Trustees, unanimously determined to renew the fund's Advisory Contracts. In reaching its determination, the Board considered all factors it believed relevant, including (i) the nature, extent, and quality of the services to be provided to the fund and its shareholders (including the investment performance of the fund); (ii) the competitiveness of the fund's management fee and total expense ratio relative to peer funds; (iii) the total costs of the services to be provided by and the profits to be realized by Fidelity from its relationship with the fund; (iv) the extent to which economies of scale exist and would be realized as the fund grows; and (v) whether fee levels reflect these economies of scale, if any, for the benefit of fund shareholders.
In considering whether to renew the Advisory Contracts for the fund, the Board reached a determination, with the assistance of fund counsel and Independent Trustees' counsel and through the exercise of its business judgment, that the renewal of the Advisory Contracts was in the best interests of the fund and its shareholders and that the compensation payable under the Advisory Contracts was fair and reasonable. The Board's decision to renew the Advisory Contracts was not based on any single factor, but rather was based on a comprehensive consideration of all the information provided to the Board at its meetings throughout the year. The Board, in reaching its determination to renew the Advisory Contracts, was aware that shareholders in the fund have a broad range of investment choices available to them, including a wide choice among mutual funds offered by Fidelity's competitors, and that the fund's shareholders, who have the opportunity to review and weigh the disclosure provided by the fund in its prospectus and other public disclosures, have chosen to invest in this fund, which is a part of the Fidelity family of funds.
Annual Report
Board Approval of Investment Advisory Contracts and
Management Fees - continued
Nature, Extent, and Quality of Services Provided. The Board considered the staffing within the investment adviser, Fidelity Management & Research Company (FMR), and the sub-advisers (together, the Investment Advisers) as it relates to the fund, including the backgrounds of the fund's investment personnel, and also considered the fund's investment objective, strategies, and related investment philosophy. The Independent Trustees also had discussions with senior management of Fidelity's investment operations and investment groups. The Board considered the structure of the portfolio manager compensation program and whether this structure provides appropriate incentives to act in the best interests of the fund.
Resources Dedicated to Investment Management and Support Services. The Board and the Fund Oversight and Research Committees reviewed the general qualifications and capabilities of the Investment Advisers' investment staff, including its size, education, experience, and resources, as well as the Investment Advisers' approach to recruiting, training, managing, and compensating investment personnel. The Board noted that FMR has continued to increase the resources devoted to non-U.S. offices, including expansion of Fidelity's global investment organization. The Board also noted that Fidelity's analysts have extensive resources, tools and capabilities that allow them to conduct sophisticated quantitative and fundamental analysis, as well as credit analysis of issuers, counterparties and guarantors. Further, the Board believes that Fidelity's investment professionals have sufficient access to global information and data so as to provide competitive investment results over time, and that those professionals also have access to sophisticated tools that permit them to assess portfolio construction and risk and performance attribution characteristics continuously, as well as to transmit new information and research conclusions rapidly around the world. Additionally, in its deliberations, the Board considered the Investment Advisers' trading and risk management capabilities and resources, which are an integral part of the investment management process.
Shareholder and Administrative Services. The Board considered (i) the nature, extent, quality, and cost of advisory, administrative, and shareholder services performed by the Investment Advisers and their affiliates under the Advisory Contracts and under separate agreements covering transfer agency, pricing and bookkeeping, and securities lending services for the fund; (ii) the nature and extent of the supervision of third party service providers, principally custodians and subcustodians; and (iii) the resources devoted to, and the record of compliance with, the fund's compliance policies and procedures. The Board also reviewed the allocation of fund brokerage, including allocations to brokers affiliated with the Investment Advisers, the use of brokerage commissions to pay fund expenses, and the use of "soft" commission dollars to pay for research services.
Annual Report
The Board noted that the growth of fund assets over time across the complex allows Fidelity to reinvest in the development of services designed to enhance the value or convenience of the Fidelity funds as investment vehicles. These services include 24-hour access to account information and market information through telephone representatives and over the Internet, investor education materials and asset allocation tools, and the expanded availability of Fidelity Investor Centers.
Investment in a Large Fund Family. The Board considered the benefits to shareholders of investing in a Fidelity fund, including the benefits of investing in a fund that is part of a large family of funds offering a variety of investment disciplines and providing a large variety of mutual fund investor services. The Board noted that Fidelity had taken, or had made recommendations that resulted in the Fidelity funds taking, a number of actions over the previous year that benefited particular funds, including (i) continuing to dedicate additional resources to investment research and to the support of the senior management team that oversees asset management; (ii) persisting in efforts to enhance Fidelity's global research capabilities; (iii) launching new funds and making other enhancements to meet client needs for global and income-oriented solutions; (iv) continuing to launch dedicated lower cost underlying funds to meet portfolio construction needs related to expanding underlying fund options for Fidelity funds of funds, specifically for the Freedom Fund product lines; (v) rationalizing product lines and gaining increased efficiencies through the mergers of several funds into other funds; (vi) strengthening Fidelity's index fund offerings by reducing investment minimums and adopting or lowering existing expense caps for certain funds and classes; (vii) enhancing Global Asset Allocation product offerings by launching new funds and strategies, including "open architecture" target date funds that utilize affiliated and unaffiliated sub-advisers; (viii) modifying the eligibility criteria for Institutional Class shares of Advisor funds to increase their marketability to a portion of the defined contribution plan market; (ix) creating a new low-cost retirement share class for certain Advisor funds to appeal to large retirement plans; (x) transitioning the management of certain Fidelity commodity funds to Geode Capital Management LLC, a registered commodity pool operator, while retaining administrative responsibilities for the funds; (xi) reorganizing a number of funds; and (xii) taking steps toward establishing a new Fidelity adviser to manage sector-based funds and products.
Investment Performance. The Board considered whether the fund has operated in accordance with its investment objective, as well as its record of compliance with its investment restrictions and its performance history.
The Board took into account discussions with the Investment Advisers about fund investment performance that occur at Board meetings throughout the year. In this regard the Board noted that as part of regularly scheduled fund reviews and other reports to the Board on fund performance, the Board periodically considers annualized return information for the fund, for different time periods, measured against a securities market index ("benchmark index") and a peer group of mutual funds with similar objectives ("peer group"). In its evaluation of fund investment performance, the Board gave particular attention to information indicating changes in performance of certain Fidelity funds for specific time periods and the Investment Advisers' explanations for any overperformance or underperformance.
Annual Report
Board Approval of Investment Advisory Contracts and
Management Fees - continued
In addition to reviewing absolute and relative fund performance, the Independent Trustees periodically consider the appropriateness of fund performance metrics in evaluating the results achieved. In general, the Independent Trustees believe that fund performance should be evaluated based on net performance (after fees and expenses) of both the highest performing and lowest performing classes, where applicable, compared to appropriate benchmark indices, over appropriate time periods which may include full market cycles, and compared to peer groups, as applicable, over the same periods, taking into account relevant factors including the following: general market conditions; issuer-specific information; tactical opportunities for investment; and fund cash flows and other factors.
The Independent Trustees recognize that shareholders evaluate performance on a net basis over their own holding periods, for which one-, three-, and five-year periods are used as a proxy. For this reason, the performance information reviewed by the Board also included net cumulative calendar year total return information for the fund and an appropriate benchmark index for the most recent one- and three-year periods, as shown below. A peer group comparison is not shown below.
Annual Report
Fidelity Global Commodity Stock Fund

Based on its review, the Board concluded that the nature, extent, and quality of services provided to the fund under the Advisory Contracts should benefit the fund's shareholders.
Competitiveness of Management Fee and Total Expense Ratio. The Board considered the fund's management fee and total expense ratio compared to "mapped groups" of competitive funds and classes. Fidelity creates "mapped groups" by combining similar Lipper investment objective categories that have comparable management fee characteristics. Combining Lipper investment objective categories aids the Board's management fee and total expense ratio comparisons by broadening the competitive group used for comparison and by reducing the number of universes to which various Fidelity funds are compared.
Management Fee. The Board considered two proprietary management fee comparisons for the 12-month (or shorter) periods shown in the chart below. The group of Lipper funds used by the Board for management fee comparisons is referred to below as the "Total Mapped Group." The Total Mapped Group comparison focuses on a fund's standing in terms of gross management fees before expense reimbursements or caps relative to the total universe of funds with comparable investment mandates, regardless of whether their management fee structures also are comparable. Funds with comparable investment mandates offer exposure to similar types of securities. Funds with comparable management fee structures have similar management fee contractual arrangements (e.g., flat rate charged for advisory services, all-inclusive fee rate, etc.). "TMG %" represents the percentage of funds in the Total Mapped Group that had management fees that were lower than the fund's. For example, a TMG % of 31% means that 69% of the funds in the Total Mapped Group had higher management fees than the fund. The "Asset-Size Peer Group" (ASPG) comparison focuses on a fund's standing relative to a subset of non-Fidelity funds within the Total Mapped Group that are similar in size and management fee structure. The ASPG represents at least 15% of the funds in the Total Mapped Group with comparable asset size and management fee structures, subject to a minimum of 50 funds (or all funds in the Total Mapped Group if fewer than 50). Additional information, such as the ASPG quartile in which the fund's management fee ranked, is also included in the chart and considered by the Board.
Annual Report
Board Approval of Investment Advisory Contracts and
Management Fees - continued
Fidelity Global Commodity Stock Fund
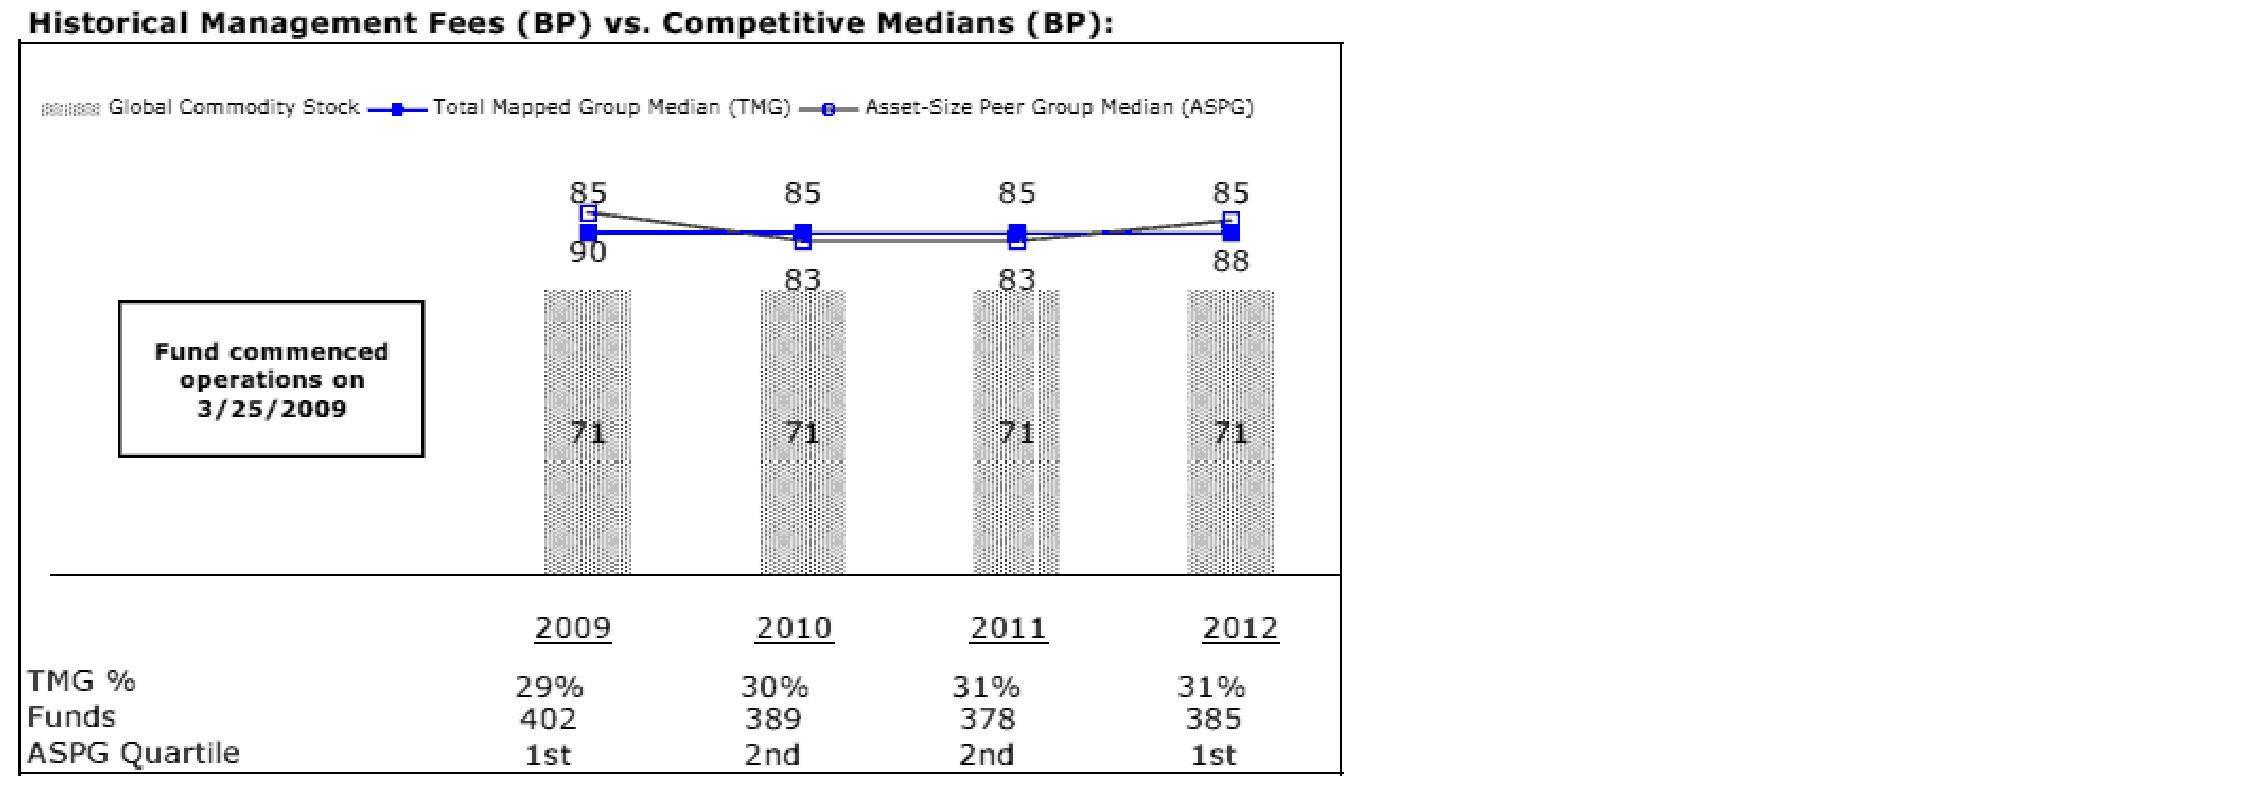
The Board noted that the fund's management fee ranked below the median of its Total Mapped Group and below the median of its ASPG for 2012.
Based on its review, the Board concluded that the fund's management fee is fair and reasonable in light of the services that the fund receives and the other factors considered.
Total Expense Ratio. In its review of each class's total expense ratio, the Board considered the fund's management fee as well as other fund or class expenses, as applicable, such as transfer agent fees, pricing and bookkeeping fees, fund-paid 12b-1 fees, and custodial, legal, and audit fees. The Board also noted the effects of any waivers and reimbursements on fees and expenses. As part of its review, the Board also considered the current and historical total expense ratios of each class of the fund compared to competitive fund median expenses. Each class of the fund is compared to those funds and classes in the Total Mapped Group (used by the Board for management fee comparisons) that have a similar sales load structure.
Annual Report
The Board noted that the total expense ratio of each of Class A, Class C, Institutional Class, and the retail class ranked below its competitive median for 2012, the total expense ratio of Class B ranked equal to its competitive median for 2012, and the total expense ratio of Class T ranked above its competitive median for 2012. The Board considered that, in general, various factors can affect total expense ratios. The Board noted that the total expense ratio of Class T was above the competitive median primarily because of higher 12b-1 fees on Class T. Class T has a higher 12b-1 fee, but a lower front-end sales charge, than traditionally priced front-end sales charge classes. The Board considered that Class T is primarily sold load-waived in the retirement plan market where its 0.50% 12b-1 fee is comparable to competing no-load, higher 12b-1 fee classes designed specifically for retirement plans. The Board noted that the fund offers multiple classes, each of which has a different sales load and 12b-1 fee structure, and that the multiple structures are intended to offer a range of pricing options for the intermediary market. The Board also noted that the total expense ratios of the classes vary primarily by the level of their 12b-1 fees, although differences in transfer agent fees may also cause expenses to vary from class to class.
Fees Charged to Other Fidelity Clients. The Board also considered Fidelity fee structures and other information with respect to clients of FMR and its affiliates, such as other mutual funds advised or subadvised by FMR or its affiliates, pension plan clients, and other institutional clients. The Board noted the findings of the 2013 ad hoc joint committee (created with the board of other Fidelity funds), which reviewed and compared Fidelity's institutional investment advisory business with its business of providing services to the Fidelity funds, including the differences in services provided, fees charged, and costs incurred, as well as competition in their respective marketplaces.
Based on its review of total expense ratios and fees charged to other Fidelity clients, the Board concluded that the total expense ratio of each class of the fund was reasonable, although Class T was above the median of the universe presented for comparison, in light of the services that the fund and its shareholders receive and the other factors considered.
Costs of the Services and Profitability. The Board considered the revenues earned and the expenses incurred by Fidelity in conducting the business of developing, marketing, distributing, managing, administering and servicing the fund and servicing the fund's shareholders. The Board also considered the level of Fidelity's profits in respect of all the Fidelity funds.
On an annual basis, FMR presents to the Board Fidelity's profitability for the fund. Fidelity calculates the profitability for each fund, as well as aggregate profitability for groups of Fidelity funds and all Fidelity funds, using a series of detailed revenue and cost allocation methodologies which originate with the books and records of Fidelity on which Fidelity's audited financial statements are based. The Audit Committee of the Board reviews any significant changes from the prior year's methodologies.
Annual Report
Board Approval of Investment Advisory Contracts and
Management Fees - continued
PricewaterhouseCoopers LLP (PwC), independent registered public accounting firm and auditor to Fidelity and certain Fidelity funds, has been engaged annually by the Board as part of the Board's assessment of Fidelity's profitability analysis. PwC's engagement includes the review and assessment of the methodologies used by Fidelity in determining the revenues and expenses attributable to Fidelity's mutual fund business, and completion of agreed-upon procedures surrounding the mathematical accuracy of fund profitability and its conformity to allocation methodologies. After considering PwC's reports issued under the engagement and information provided by Fidelity, the Board concluded that while other allocation methods may also be reasonable, Fidelity's profitability methodologies are reasonable in all material respects.
The Board also reviewed Fidelity's non-fund businesses and fall-out benefits related to the mutual fund business as well as cases where Fidelity's affiliates may benefit from or be related to the fund's business.
The Board considered the costs of the services provided by and the profits realized by Fidelity in connection with the operation of the fund and was satisfied that the profitability was not excessive in the circumstances.
Economies of Scale. The Board considered whether there have been economies of scale in respect of the management of the Fidelity funds, whether the Fidelity funds (including the fund) have appropriately benefited from any such economies of scale, and whether there is potential for realization of any further economies of scale. The Board considered the extent to which the fund will benefit from economies of scale through increased services to the fund, through waivers or reimbursements, or through fee or expense reductions. The Board also noted that in 2009, it and the board of other Fidelity funds created an ad hoc committee (the Economies of Scale Committee) to analyze whether FMR attains economies of scale in respect of the management and servicing of the Fidelity funds, whether the Fidelity funds have appropriately benefited from such economies of scale, and whether there is potential for realization of any further economies of scale.
The Board recognized that the fund's management contract incorporates a "group fee" structure, which provides for lower group fee rates as total fund assets under FMR's management increase, and for higher group fee rates as total fund assets under FMR's management decrease. FMR calculates the group fee rates based on a tiered asset "breakpoint" schedule that varies based on asset class. The Board considered that the group fee is designed to deliver the benefits of economies of scale to fund shareholders when total Fidelity fund assets increase, even if assets of any particular fund are unchanged or have declined, because some portion of Fidelity's costs are attributable to services provided to all Fidelity funds, and all funds benefit if those costs can be allocated among more assets. The Board concluded that, given the group fee structure, fund shareholders will benefit from lower management fees as assets under FMR's management increase at the fund complex level, regardless of whether Fidelity achieves any such economies of scale.
Annual Report
The Board concluded, taking into account the analysis of the Economies of Scale Committee, that economies of scale, if any, are being appropriately shared between fund shareholders and Fidelity.
Amendment to Description of Group Fee Rate. At its July 2013 meeting, the Board voted to approve an amendment to the fund's management contract to modify the description of the "group fee rate" effective August 1, 2013. The Board noted that under the prior description in the contract, the group fee rate was based on the average net assets of all registered investment companies with which FMR has management contracts. Under the contract's tiered asset breakpoint schedule, the group fee rate is lower as total fund assets under FMR's management increase, and higher as total fund assets under FMR's management decrease. The Board considered that the prior description would have excluded the assets of 64 Fidelity sector funds from the group fee rate calculation once Fidelity SelectCo, LLC, an affiliate of FMR, assumed management responsibilities for those funds. The Board noted that modifying the description of the group fee rate to continue to include the assets of those 64 funds for purposes of determining group fee rate breakpoints would avoid an immediate adverse impact on the group fee rate for any fund.
Additional Information Requested by the Board. In order to develop fully the factual basis for consideration of the Fidelity funds' Advisory Contracts, the Board requested and received additional information on certain topics, including: (i) fund performance trends and Fidelity's long-term strategies for certain funds; (ii) the potential to further rationalize the Fidelity fund lineup with the possibility of achieving savings for the funds and Fidelity; (iii) the methodology with respect to competitive fund data and peer group classifications; (iv) the arrangements with, and performance of, certain sub-advisers on behalf of the Fidelity funds, as well as certain proposed participating affiliate arrangements; (v) the realization of fall-out benefits in certain Fidelity business units; (vi) Fidelity's group fee structures, including the rationale for the individual fee rates of certain categories of funds and the definition of group assets; (vii) trends regarding industry use of performance fee structures and the performance adjustment methodologies applicable to the Fidelity funds; (viii) additional competitive analysis regarding the total expenses for certain classes; and (ix) fund profitability methodology, including Fidelity's cost allocation methodology, and the impact of certain factors on fund profitability results.
Annual Report
Board Approval of Investment Advisory Contracts and
Management Fees - continued
Based on its evaluation of all of the conclusions noted above, and after considering all factors it believed relevant, the Board ultimately concluded that the advisory fee structures are fair and reasonable, and that the fund's Advisory Contracts should be renewed.
Annual Report
Investment Adviser
Fidelity Management & Research Company
Boston, MA
Investment Sub-Advisers
FMR Co., Inc.
Fidelity Management & Research
(U.K.) Inc.
FIL Investment Advisors
FIL Investments (Japan) Limited
FIL Investment Advisors (U.K.) Limited
Fidelity Management & Research
(Hong Kong) Limited
Fidelity Management & Research
(Japan) Inc.
General Distributor
Fidelity Distributors Corporation
Smithfield, RI
Transfer and Service Agents
Fidelity Investments Institutional
Operations Company, Inc.
Boston, MA
Fidelity Service Company, Inc.
Boston, MA
Custodian
State Street Bank and Trust Company
Quincy, MA
(Fidelity Investment logo)(registered trademark)
AGCS-UANN-1213
1.879395.104
(Fidelity Investment logo)(registered trademark)
Fidelity Advisor®
Global Commodity Stock
Fund - Institutional Class
Annual Report
October 31, 2013
(Fidelity Cover Art)
Institutional Class is a
class of Fidelity® Global
Commodity Stock Fund
Contents
Performance | (Click Here) | How the fund has done over time. |
Management's Discussion of Fund Performance | (Click Here) | The Portfolio Manager's review of fund performance and strategy. |
Shareholder Expense Example | (Click Here) | An example of shareholder expenses. |
Investment Changes | (Click Here) | A summary of major shifts in the fund's investments over the past six months. |
Investments | (Click Here) | A complete list of the fund's investments with their market values. |
Financial Statements | (Click Here) | Statements of assets and liabilities, operations, and changes in net assets, as well as financial highlights. |
Notes | (Click Here) | Notes to the financial statements. |
Report of Independent Registered Public Accounting Firm | (Click Here) | |
Trustees and Officers | (Click Here) | |
Distributions | (Click Here) | |
Board Approval of Investment Advisory Contracts and Management Fees | (Click Here) | |
To view a fund's proxy voting guidelines and proxy voting record for the 12-month period ended June 30, visit http://www.fidelity.com/proxyvotingresults or visit the Securities and Exchange Commission's (SEC) web site at http://www.sec.gov. You may also call 1-877-208-0098 to request a free copy of the proxy voting guidelines.
Standard & Poor's, S&P and S&P 500 are registered service marks of The McGraw-Hill Companies, Inc. and have been licensed for use by Fidelity Distributors Corporation.
Other third-party marks appearing herein are the property of their respective owners.
All other marks appearing herein are registered or unregistered trademarks or service marks of FMR LLC or an affiliated company. © 2013 FMR LLC. All rights reserved.
Annual Report
This report and the financial statements contained herein are submitted for the general information of the shareholders of the fund. This report is not authorized for distribution to prospective investors in the fund unless preceded or accompanied by an effective prospectus.
A fund files its complete schedule of portfolio holdings with the SEC for the first and third quarters of each fiscal year on Form N-Q. Forms N-Q are available on the SEC's web site at http://www.sec.gov. A fund's Forms N-Q may be reviewed and copied at the SEC's Public Reference Room in Washington, DC. Information regarding the operation of the SEC's Public Reference Room may be obtained by calling 1-800-SEC-0330. For a complete list of a fund's portfolio holdings, view the most recent holdings listing, semiannual report, or annual report on Fidelity's web site at http://www.fidelity.com, http://www.advisor.fidelity.com, or http://www.401k.com, as applicable.
NOT FDIC INSURED • MAY LOSE VALUE • NO BANK GUARANTEE
Neither the fund nor Fidelity Distributors Corporation is a bank.
Annual Report
Average annual total return reflects the change in the value of an investment, assuming reinvestment of the class' distributions from dividend income and capital gains (the profits earned upon the sale of securities that have grown in value, if any) and assuming a constant rate of performance each year. The $10,000 table and the fund's returns do not reflect the deduction of taxes that a shareholder would pay on fund distributions or the redemption of fund shares. During periods of reimbursement by Fidelity, a fund's total return will be greater than it would be had the reimbursement not occurred. How a fund did yesterday is no guarantee of how it will do tomorrow.
Average Annual Total Returns
Periods ended October 31, 2013 | Past 1
year | Life of
fund A |
Institutional Class | -1.71% | 8.91% |
A From March 25, 2009.
$10,000 Over Life of Fund
Let's say hypothetically that $10,000 was invested in Fidelity Advisor® Global Commodity Stock Fund - Institutional Class on March 25, 2009, when the fund started. The chart shows how the value of your investment would have changed, and also shows how the MSCI® ACWI® (All Country World Index) Index performed over the same period.
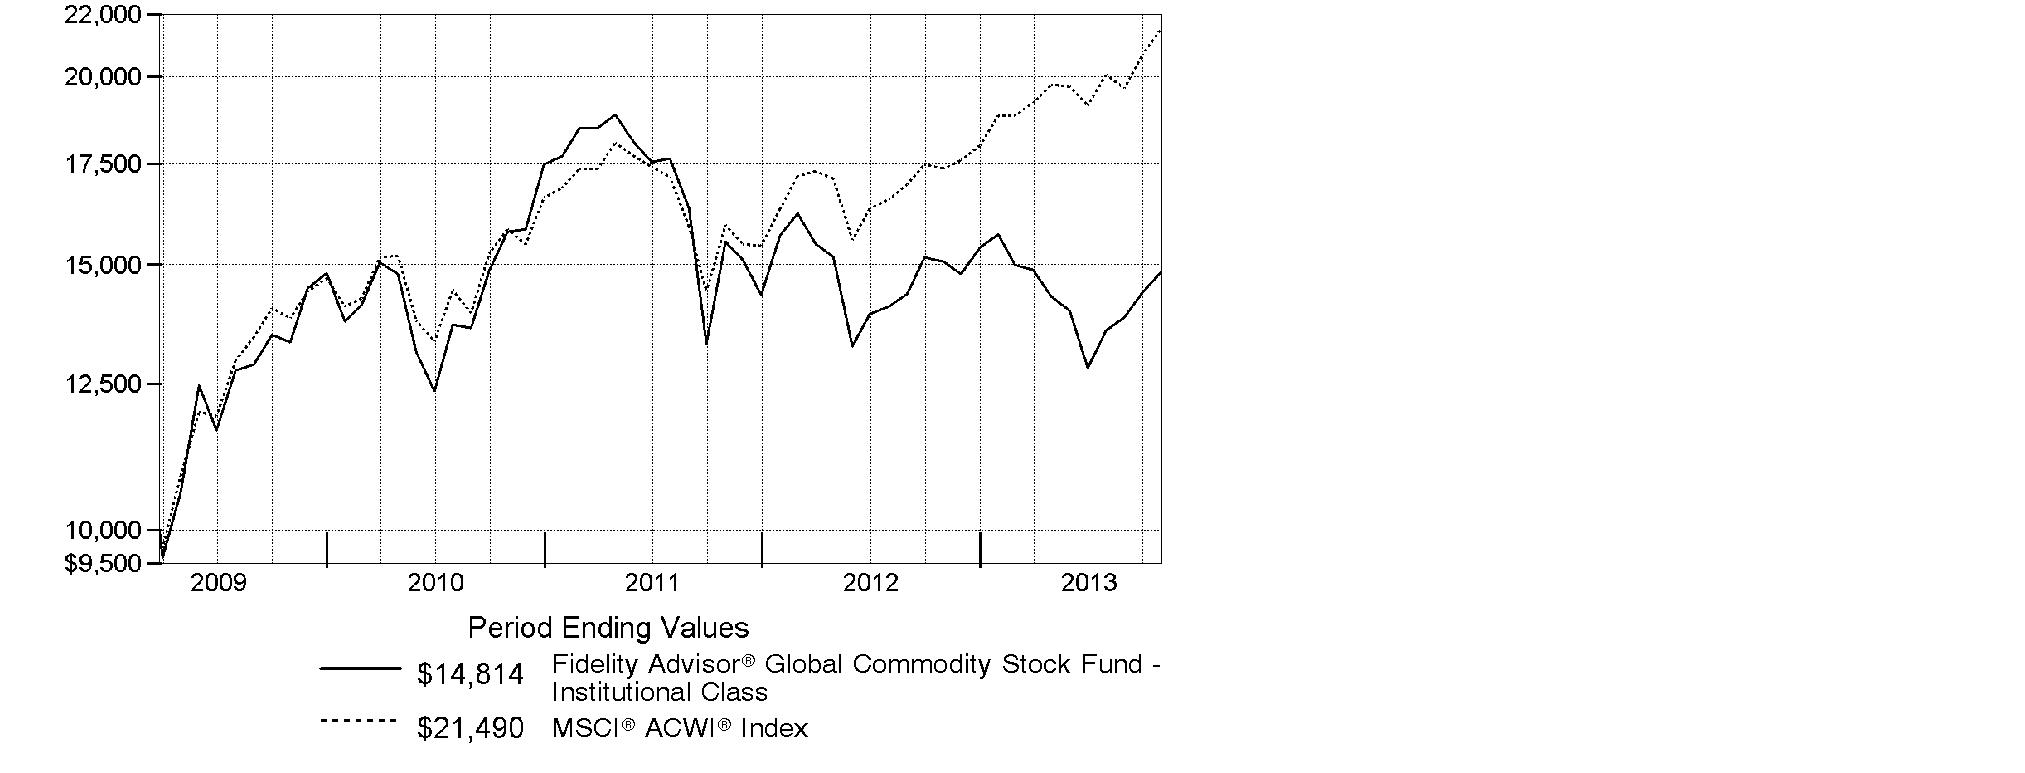
Annual Report
Market Recap: On balance, global equity markets remained upbeat for the 12-month period ending October 31, 2013. The MSCI® ACWI® (All Country World Index) Index gained 23.75% for the period, amid investor preference for higher-risk assets. The period was not without turbulence, however. In the spring and summer, central banks worldwide, especially in the U.S. and China, made clear their intentions to maintain accommodative monetary policies. That stance, combined with modest cyclical improvements around the globe and generally low valuations, underpinned the broad rally in equities. Europe (+32%) shone brightly, with most markets in the region - large and small - registering solid, index-beating gains. Another bright spot was Japan, which, despite a struggling yen and taking a second-half breather, posted a 34% result for the full year. The U.S. - by far the index's biggest constituent - also outperformed the global market with a roughly 28% advance. Meanwhile, Asia-Pacific ex Japan (+14%) lagged, hurt in part by a slowdown in Australia's mining industry as well as currency headwinds. Foreign-exchange and commodity weakness also curbed results in resource-heavy Canada and emerging markets (EM), both of which were up 7%. Country-level EM performance diverged meaningfully for the period, as evidenced by performance in Brazil (-1%), Russia (+12%), India (+1%) and China (+8%).
Comments from S. Joseph Wickwire II, Portfolio Manager of Fidelity Advisor® Global Commodity Stock Fund: For the year, the fund's Institutional Class shares returned -1.71%, lagging the broad market MSCI ACWI index and the MSCI® ACWI® (All Country World Index) Commodity Producers Sector Capped Index, which returned 0.57%. Relative to the sector benchmark, the fund was hurt by a sizable overweighting in gold stocks. The market was unfavorable to gold and gold stocks for much of the period, as the price of the precious metal price fell by 23% by period end. The gold stocks owned by the fund were hit particularly hard, including Barrick Gold, the fund's largest individual detractor. Conversely, positioning in fertilizers & agricultural chemicals helped, due in part to good timing with potash-related fertilizing companies such as Potash Corporation of Saskatchewan, along with underweightings in K&S and Uralkali, both of which I sold from the fund by period end. Overweighting oil & gas exploration & production also contributed, with investments in Petrominerales, Anadarko Petroleum and a non-index stake in C&C Energia among the fund's top relative performers. I sold Petrominerales and C&C Energia by period end to take profits, but remained overweighted in Anadarko.
The views expressed above reflect those of the portfolio manager(s) only through the end of the period as stated on the cover of this report and do not necessarily represent the views of Fidelity or any other person in the Fidelity organization. Any such views are subject to change at any time based upon market or other conditions and Fidelity disclaims any responsibility to update such views. These views may not be relied on as investment advice and, because investment decisions for a Fidelity fund are based on numerous factors, may not be relied on as an indication of trading intent on behalf of any Fidelity fund.
Annual Report
Shareholder Expense Example
As a shareholder of the Fund, you incur two types of costs: (1) transaction costs, including sales charges (loads) on purchase payments or redemption proceeds, redemption fees and (2) ongoing costs, including management fees, distribution and/or service (12b-1) fees and other Fund expenses. This Example is intended to help you understand your ongoing costs (in dollars) of investing in the Fund and to compare these costs with the ongoing costs of investing in other mutual funds.
The Example is based on an investment of $1,000 invested at the beginning of the period and held for the entire period (May 1, 2013 to October 31, 2013).
Actual Expenses
The first line of the accompanying table for each class of the Fund provides information about actual account values and actual expenses. You may use the information in this line, together with the amount you invested, to estimate the expenses that you paid over the period. Simply divide your account value by $1,000.00 (for example, an $8,600 account value divided by $1,000.00 = 8.6), then multiply the result by the number in the first line for a class of the Fund under the heading entitled "Expenses Paid During Period" to estimate the expenses you paid on your account during this period. A small balance maintenance fee of $12.00 that is charged once a year may apply for certain accounts with a value of less than $2,000. This fee is not included in the table below. If it was, the estimate of expenses you paid during the period would be higher, and your ending account value lower, by this amount. In addition, the Fund, as a shareholder in the underlying Fidelity Central Funds, will indirectly bear its pro-rata share of the fees and expenses incurred by the underlying Fidelity Central Funds. These fees and expenses are not included in the Fund's annualized expense ratio used to calculate the expense estimate in the table below.
Hypothetical Example for Comparison Purposes
The second line of the accompanying table for each class of the Fund provides information about hypothetical account values and hypothetical expenses based on a Class' actual expense ratio and an assumed rate of return of 5% per year before expenses, which is not the Class' actual return. The hypothetical account values and expenses may not be used to estimate the actual ending account balance or expenses you paid for the period. You may use this information to compare the ongoing costs of investing in the Fund and other funds. To do so, compare this 5% hypothetical example with the 5% hypothetical examples that appear in the shareholder reports of the other funds. A small balance maintenance fee of $12.00 that is charged once a year may apply for certain accounts with a value of less than $2,000. This fee is not included in the table below. If it was, the estimate of expenses you paid during the period would be higher, and your ending account value lower, by this amount. In addition, the Fund, as a shareholder in the underlying Fidelity Central Funds, will indirectly bear its pro-rata share of the fees and expenses incurred by the underlying Fidelity Central Funds. These fees and expenses are not included in the Fund's annualized expense ratio used to calculate the expense estimate in the table below.
Please note that the expenses shown in the table are meant to highlight your ongoing costs only and do not reflect any transaction costs. Therefore, the second line of the table is useful in comparing ongoing costs only, and will not help you determine the relative total costs of owning different funds. In addition, if these transactional costs were included, your costs would have been higher.
Annual Report
Shareholder Expense Example - continued
| Annualized
Expense Ratio B | Beginning
Account Value
May 1, 2013 | Ending
Account Value
October 31, 2013 | Expenses Paid
During Period*
May 1, 2013
to October 31, 2013 |
Class A | 1.33% | | | |
Actual | | $ 1,000.00 | $ 1,036.60 | $ 6.83 |
HypotheticalA | | $ 1,000.00 | $ 1,018.50 | $ 6.77 |
Class T | 1.59% | | | |
Actual | | $ 1,000.00 | $ 1,035.20 | $ 8.16 |
HypotheticalA | | $ 1,000.00 | $ 1,017.19 | $ 8.08 |
Class B | 2.08% | | | |
Actual | | $ 1,000.00 | $ 1,032.40 | $ 10.66 |
HypotheticalA | | $ 1,000.00 | $ 1,014.72 | $ 10.56 |
Class C | 2.09% | | | |
Actual | | $ 1,000.00 | $ 1,032.50 | $ 10.71 |
HypotheticalA | | $ 1,000.00 | $ 1,014.67 | $ 10.61 |
Global Commodity Stock | 1.08% | | | |
Actual | | $ 1,000.00 | $ 1,037.10 | $ 5.55 |
HypotheticalA | | $ 1,000.00 | $ 1,019.76 | $ 5.50 |
Institutional Class | 1.02% | | | |
Actual | | $ 1,000.00 | $ 1,037.90 | $ 5.24 |
HypotheticalA | | $ 1,000.00 | $ 1,020.06 | $ 5.19 |
A 5% return per year before expenses
B Annualized expense ratio reflects expenses net of applicable fee waivers.
* Expenses are equal to each Class' annualized expense ratio, multiplied by the average account value over the period, multiplied by 184/365 (to reflect the one-half year period).
Annual Report
Investment Changes (Unaudited)
Top Ten Stocks as of October 31, 2013 |
| % of fund's
net assets | % of fund's net assets
6 months ago |
Monsanto Co. | 6.3 | 6.4 |
BHP Billiton PLC | 5.3 | 5.2 |
Syngenta AG (Switzerland) | 4.4 | 4.4 |
Potash Corp. of Saskatchewan, Inc. | 3.4 | 1.6 |
Peabody Energy Corp. | 3.3 | 3.0 |
Rio Tinto PLC | 3.3 | 3.1 |
Chevron Corp. | 3.3 | 0.4 |
Bunge Ltd. | 3.1 | 2.0 |
Archer Daniels Midland Co. | 3.1 | 2.5 |
International Paper Co. | 2.5 | 2.2 |
| 38.0 | |
Top Industries (% of fund's net assets) |
As of October 31, 2013 |
 | Energy 33.6% | |
 | Agriculture 32.5% | |
 | Metals 30.9% | |
 | Other 2.5% | |
 | Short-Term Investments and
Net Other Assets 0.5% | |

As of April 30, 2013 |
| Metals 37.6% | |
| Energy 35.7% | |
| Agriculture 24.9% | |
| Other 1.6% | |
| Short-Term Investments and
Net Other Assets 0.2% | |

Annual Report
Investments October 31, 2013
Showing Percentage of Net Assets
Common Stocks - 99.5% |
| Shares | | Value |
AEROSPACE & DEFENSE - 0.1% |
Aerospace & Defense - 0.1% |
Precision Castparts Corp. | 500 | | $ 126,725 |
Rolls-Royce Group PLC | 6,800 | | 125,386 |
| | 252,111 |
CHEMICALS - 22.2% |
Commodity Chemicals - 0.2% |
Axiall Corp. | 16,400 | | 637,796 |
Cabot Corp. | 2,800 | | 130,508 |
| | 768,304 |
Diversified Chemicals - 0.3% |
Eastman Chemical Co. | 1,700 | | 133,943 |
FMC Corp. | 1,700 | | 123,692 |
Huntsman Corp. | 5,800 | | 134,676 |
Lanxess AG | 10,100 | | 710,896 |
| | 1,103,207 |
Fertilizers & Agricultural Chemicals - 21.7% |
Agrium, Inc. | 86,600 | | 7,392,126 |
CF Industries Holdings, Inc. | 29,872 | | 6,440,403 |
China BlueChemical Ltd. (H Shares) | 906,000 | | 581,953 |
Intrepid Potash, Inc. (d) | 99,700 | | 1,480,545 |
Israel Chemicals Ltd. | 202,400 | | 1,674,876 |
Israel Corp. Ltd. (Class A) (a) | 1,000 | | 504,502 |
Monsanto Co. | 248,400 | | 26,052,190 |
Potash Corp. of Saskatchewan, Inc. | 456,000 | | 14,170,048 |
Sociedad Quimica y Minera de Chile SA (PN-B) sponsored ADR (d) | 102,300 | | 2,824,503 |
Syngenta AG (Switzerland) | 45,287 | | 18,278,589 |
Taiwan Fertilizer Co. Ltd. | 240,000 | | 570,749 |
The Mosaic Co. | 143,359 | | 6,573,010 |
Yara International ASA | 84,800 | | 3,660,913 |
| | 90,204,407 |
TOTAL CHEMICALS | | 92,075,918 |
CONSTRUCTION & ENGINEERING - 0.3% |
Construction & Engineering - 0.3% |
Boart Longyear Ltd. (d) | 2,635,000 | | 1,070,902 |
Chiyoda Corp. | 11,000 | | 139,494 |
| | 1,210,396 |
Common Stocks - continued |
| Shares | | Value |
CONSTRUCTION MATERIALS - 0.1% |
Construction Materials - 0.1% |
Eagle Materials, Inc. | 5,400 | | $ 405,054 |
Vulcan Materials Co. | 3,400 | | 182,070 |
| | 587,124 |
CONTAINERS & PACKAGING - 0.5% |
Paper Packaging - 0.5% |
Rock-Tenn Co. Class A | 20,100 | | 2,150,901 |
ELECTRICAL EQUIPMENT - 0.0% |
Electrical Components & Equipment - 0.0% |
Eaton Corp. PLC | 1,900 | | 134,064 |
ENERGY EQUIPMENT & SERVICES - 1.1% |
Oil & Gas Drilling - 0.8% |
Ensco PLC Class A | 7,500 | | 432,375 |
Noble Corp. | 14,100 | | 531,570 |
Ocean Rig UDW, Inc. (United States) (a) | 63,747 | | 1,117,485 |
Vantage Drilling Co. (a) | 717,582 | | 1,277,296 |
| | 3,358,726 |
Oil & Gas Equipment & Services - 0.3% |
Cameron International Corp. (a) | 11,200 | | 614,432 |
FMC Technologies, Inc. (a) | 400 | | 20,220 |
Halliburton Co. | 200 | | 10,606 |
National Oilwell Varco, Inc. | 4,900 | | 397,782 |
TGS Nopec Geophysical Co. ASA | 4,800 | | 132,073 |
| | 1,175,113 |
TOTAL ENERGY EQUIPMENT & SERVICES | | 4,533,839 |
FOOD PRODUCTS - 6.9% |
Agricultural Products - 6.9% |
Archer Daniels Midland Co. | 311,500 | | 12,740,350 |
Bunge Ltd. | 158,400 | | 13,009,392 |
China Agri-Industries Holdings Ltd. | 1,458,300 | | 684,666 |
Golden Agri-Resources Ltd. | 3,377,000 | | 1,631,138 |
Ingredion, Inc. | 400 | | 26,304 |
Kernel Holding SA (a) | 8,400 | | 113,142 |
PT Charoen Pokphand Indonesia Tbk | 806,500 | | 279,027 |
Wilmar International Ltd. | 78,000 | | 217,260 |
| | 28,701,279 |
Common Stocks - continued |
| Shares | | Value |
MACHINERY - 0.5% |
Construction & Farm Machinery & Heavy Trucks - 0.5% |
Caterpillar, Inc. | 3,000 | | $ 250,080 |
Manitowoc Co., Inc. | 65,300 | | 1,270,738 |
Samsung Heavy Industries Co. Ltd. | 9,190 | | 337,282 |
| | 1,858,100 |
METALS & MINING - 30.9% |
Aluminum - 0.3% |
Alcoa, Inc. | 130,900 | | 1,213,443 |
Diversified Metals & Mining - 16.1% |
Anglo American PLC (United Kingdom) | 217,351 | | 5,175,234 |
BHP Billiton PLC | 716,093 | | 22,097,554 |
Boliden AB | 8,400 | | 119,647 |
Copper Mountain Mining Corp. (a) | 793,131 | | 1,308,383 |
First Quantum Minerals Ltd. | 93,424 | | 1,772,337 |
Freeport-McMoRan Copper & Gold, Inc. | 163,100 | | 5,995,556 |
Glencore Xstrata PLC | 1,649,452 | | 8,992,087 |
Grupo Mexico SA de CV Series B | 755,611 | | 2,386,612 |
Iluka Resources Ltd. | 53,014 | | 516,094 |
Norilsk Nickel OJSC sponsored ADR | 41,300 | | 626,521 |
Rio Tinto PLC | 270,887 | | 13,706,931 |
Sesa Sterlite Ltd. | 13,072 | | 42,849 |
Sumitomo Metal Mining Co. Ltd. | 45,000 | | 623,277 |
Teck Resources Ltd. Class B (sub. vtg.) | 89,100 | | 2,384,204 |
Turquoise Hill Resources Ltd. (a)(d) | 109,214 | | 526,875 |
Walter Energy, Inc. (d) | 26,000 | | 413,140 |
| | 66,687,301 |
Gold - 8.2% |
Agnico Eagle Mines Ltd. (Canada) | 38,000 | | 1,128,356 |
AngloGold Ashanti Ltd. sponsored ADR | 64,700 | | 976,970 |
Argonaut Gold, Inc. (a) | 93,200 | | 518,448 |
B2Gold Corp. (a) | 281,680 | | 697,007 |
Barrick Gold Corp. | 252,500 | | 4,911,236 |
Compania de Minas Buenaventura SA sponsored ADR | 23,600 | | 342,200 |
Detour Gold Corp. (a) | 106,500 | | 870,263 |
Eldorado Gold Corp. | 232,250 | | 1,565,931 |
Franco-Nevada Corp. | 26,746 | | 1,203,333 |
Gold Fields Ltd. sponsored ADR | 145,000 | | 667,000 |
Goldcorp, Inc. | 178,510 | | 4,547,284 |
Harmony Gold Mining Co. Ltd. sponsored ADR | 95,800 | | 325,720 |
Kinross Gold Corp. | 245,005 | | 1,245,410 |
Common Stocks - continued |
| Shares | | Value |
METALS & MINING - CONTINUED |
Gold - continued |
New Gold, Inc. (a) | 467,100 | | $ 2,741,718 |
Newcrest Mining Ltd. | 170,030 | | 1,655,250 |
Newmont Mining Corp. | 85,000 | | 2,317,100 |
Osisko Mining Corp. (a) | 251,528 | | 1,227,907 |
Premier Gold Mines Ltd. (a) | 504,000 | | 1,116,616 |
Pretium Resources, Inc. (a) | 60,300 | | 197,212 |
Randgold Resources Ltd. sponsored ADR | 32,500 | | 2,401,750 |
Romarco Minerals, Inc. (a) | 1,116,500 | | 401,561 |
Royal Gold, Inc. | 25,900 | | 1,244,236 |
Torex Gold Resources, Inc. (a) | 327,400 | | 364,249 |
Yamana Gold, Inc. | 151,100 | | 1,498,464 |
| | 34,165,221 |
Precious Metals & Minerals - 0.9% |
Aquarius Platinum Ltd. (United Kingdom) (a) | 242,800 | | 168,375 |
Fresnillo PLC | 36,200 | | 566,210 |
Impala Platinum Holdings Ltd. | 38,700 | | 470,318 |
Industrias Penoles SA de CV | 11,200 | | 327,701 |
Silver Wheaton Corp. | 64,200 | | 1,456,838 |
Tahoe Resources, Inc. (a) | 27,300 | | 524,189 |
| | 3,513,631 |
Steel - 5.4% |
African Minerals Ltd. (a)(d) | 376,300 | | 1,125,265 |
ArcelorMittal SA Class A unit (d) | 157,000 | | 2,474,320 |
Carpenter Technology Corp. | 800 | | 47,464 |
Eregli Demir ve Celik Fabrikalari T.A.S. | 79,770 | | 110,689 |
Fortescue Metals Group Ltd. | 144,789 | | 712,975 |
Gerdau SA sponsored ADR | 179,500 | | 1,423,435 |
Hyundai Steel Co. | 9,415 | | 776,244 |
JFE Holdings, Inc. | 70,500 | | 1,602,796 |
Jindal Steel & Power Ltd. (a) | 50,655 | | 197,157 |
London Mining PLC (a) | 539,586 | | 1,126,887 |
Nippon Steel & Sumitomo Metal Corp. | 236,000 | | 778,931 |
POSCO | 12,732 | | 3,799,125 |
SunCoke Energy, Inc. (a) | 4,000 | | 80,000 |
Tata Steel Ltd. | 50,717 | | 275,625 |
Thyssenkrupp AG (a) | 39,000 | | 996,826 |
Common Stocks - continued |
| Shares | | Value |
METALS & MINING - CONTINUED |
Steel - continued |
Vale SA (PN-A) sponsored ADR | 453,900 | | $ 6,645,096 |
Voestalpine AG | 8,500 | | 401,449 |
| | 22,574,284 |
TOTAL METALS & MINING | | 128,153,880 |
OIL, GAS & CONSUMABLE FUELS - 32.5% |
Coal & Consumable Fuels - 4.1% |
Alpha Natural Resources, Inc. (a) | 65,037 | | 455,259 |
Cameco Corp. | 47,600 | | 903,471 |
China Shenhua Energy Co. Ltd. (H Shares) | 210,000 | | 639,236 |
Coal India Ltd. | 50,901 | | 237,845 |
CONSOL Energy, Inc. | 20,500 | | 748,250 |
Peabody Energy Corp. | 713,098 | | 13,891,149 |
Whitehaven Coal Ltd. (d) | 58,500 | | 89,572 |
| | 16,964,782 |
Integrated Oil & Gas - 17.6% |
BG Group PLC | 282,650 | | 5,771,515 |
BP PLC | 580,900 | | 4,509,301 |
Cenovus Energy, Inc. | 49,800 | | 1,479,695 |
Chevron Corp. | 113,100 | | 13,567,476 |
China Petroleum & Chemical Corp. (H Shares) | 1,469,000 | | 1,189,167 |
ENI SpA | 77,727 | | 1,973,252 |
Exxon Mobil Corp. | 103,061 | | 9,236,327 |
Gazprom OAO sponsored ADR | 312,000 | | 2,910,960 |
Hess Corp. | 17,200 | | 1,396,640 |
Imperial Oil Ltd. | 5,400 | | 235,805 |
InterOil Corp. (a)(d) | 12,300 | | 854,235 |
LUKOIL Oil Co. sponsored ADR | 29,500 | | 1,931,365 |
Occidental Petroleum Corp. | 41,300 | | 3,968,104 |
Origin Energy Ltd. | 29,218 | | 404,013 |
PetroChina Co. Ltd. (H Shares) | 1,226,000 | | 1,396,146 |
Petroleo Brasileiro SA - Petrobras (PN) sponsored ADR (non-vtg.) | 191,400 | | 3,475,824 |
PTT PCL (For. Reg.) | 42,600 | | 433,870 |
Repsol YPF SA | 34,309 | | 921,413 |
Royal Dutch Shell PLC Class A (United Kingdom) | 178,850 | | 5,956,569 |
Statoil ASA | 66,200 | | 1,566,372 |
Suncor Energy, Inc. | 97,332 | | 3,537,054 |
Common Stocks - continued |
| Shares | | Value |
OIL, GAS & CONSUMABLE FUELS - CONTINUED |
Integrated Oil & Gas - continued |
Surgutneftegaz JSC (Reg.) | 99,200 | | $ 87,320 |
Total SA | 102,700 | | 6,300,951 |
| | 73,103,374 |
Oil & Gas Exploration & Production - 10.7% |
Anadarko Petroleum Corp. | 52,900 | | 5,040,841 |
Apache Corp. | 26,800 | | 2,379,840 |
Baytex Energy Corp. | 4,300 | | 179,481 |
Beach Energy Ltd. | 100,000 | | 135,156 |
Bonanza Creek Energy, Inc. (a) | 200 | | 10,108 |
Cabot Oil & Gas Corp. | 50,600 | | 1,787,192 |
Cairn India Ltd. | 1,100 | | 5,644 |
Canadian Natural Resources Ltd. | 74,000 | | 2,348,497 |
Chesapeake Energy Corp. | 31,800 | | 889,128 |
Cimarex Energy Co. | 5,000 | | 526,750 |
CNOOC Ltd. | 120,000 | | 244,077 |
CNOOC Ltd. sponsored ADR | 8,800 | | 1,780,328 |
Cobalt International Energy, Inc. (a) | 68,900 | | 1,599,169 |
Concho Resources, Inc. (a) | 5,800 | | 641,538 |
ConocoPhillips Co. | 64,000 | | 4,691,200 |
Continental Resources, Inc. (a) | 2,200 | | 250,580 |
Denbury Resources, Inc. (a) | 26,900 | | 510,831 |
Devon Energy Corp. | 22,200 | | 1,403,484 |
Double Eagle Petroleum Co. (a)(d) | 139,905 | | 388,936 |
EOG Resources, Inc. | 15,300 | | 2,729,520 |
EQT Corp. | 9,000 | | 770,490 |
INPEX Corp. | 83,200 | | 961,124 |
Kodiak Oil & Gas Corp. (a) | 700 | | 9,079 |
Kunlun Energy Co. Ltd. | 86,000 | | 140,653 |
Lundin Petroleum AB (a) | 5,900 | | 121,823 |
Marathon Oil Corp. | 53,800 | | 1,896,988 |
Murphy Oil Corp. | 10,700 | | 645,424 |
Noble Energy, Inc. | 26,100 | | 1,955,673 |
Northern Oil & Gas, Inc. (a) | 10,300 | | 169,229 |
NOVATEK OAO GDR (Reg. S) | 2,400 | | 337,200 |
Oil & Natural Gas Corp. Ltd. | 34,000 | | 162,044 |
Oil Search Ltd. ADR | 6,941 | | 55,828 |
Pacific Rubiales Energy Corp. | 25,074 | | 518,723 |
Painted Pony Petroleum Ltd. (a)(e) | 15,000 | | 98,547 |
Painted Pony Petroleum Ltd. (a) | 143,100 | | 940,138 |
PDC Energy, Inc. (a) | 300 | | 20,343 |
Common Stocks - continued |
| Shares | | Value |
OIL, GAS & CONSUMABLE FUELS - CONTINUED |
Oil & Gas Exploration & Production - continued |
Penn West Petroleum Ltd. | 25,800 | | $ 288,028 |
Pioneer Natural Resources Co. | 7,500 | | 1,535,850 |
Platino Energy Corp. (a) | 137,400 | | 79,068 |
PTT Exploration and Production PCL (For. Reg.) | 27,600 | | 149,417 |
QEP Resources, Inc. | 12,300 | | 406,638 |
Rosetta Resources, Inc. (a) | 6,100 | | 365,634 |
Santos Ltd. | 30,700 | | 440,174 |
Southwestern Energy Co. (a) | 21,700 | | 807,674 |
Talisman Energy, Inc. | 77,500 | | 966,288 |
Tullow Oil PLC | 80,400 | | 1,215,008 |
Whiting Petroleum Corp. (a) | 6,500 | | 434,785 |
Woodside Petroleum Ltd. | 36,352 | | 1,333,781 |
| | 44,367,951 |
Oil & Gas Storage & Transport - 0.1% |
Access Midstream Partners LP | 3,400 | | 182,036 |
Phillips 66 Partners LP | 6,400 | | 215,040 |
| | 397,076 |
TOTAL OIL, GAS & CONSUMABLE FUELS | | 134,833,183 |
PAPER & FOREST PRODUCTS - 3.8% |
Forest Products - 0.4% |
Boise Cascade Co. | 13,700 | | 350,857 |
Canfor Corp. (a) | 9,100 | | 188,607 |
West Fraser Timber Co. Ltd. | 11,100 | | 1,017,433 |
| | 1,556,897 |
Paper Products - 3.4% |
Fibria Celulose SA sponsored ADR (a)(d) | 18,600 | | 242,730 |
International Paper Co. | 235,400 | | 10,501,194 |
Nine Dragons Paper (Holdings) Ltd. | 898,000 | | 741,287 |
Stora Enso Oyj (R Shares) | 120,700 | | 1,122,581 |
UPM-Kymmene Corp. | 105,400 | | 1,675,781 |
| | 14,283,573 |
TOTAL PAPER & FOREST PRODUCTS | | 15,840,470 |
Common Stocks - continued |
| Shares | | Value |
REAL ESTATE INVESTMENT TRUSTS - 0.0% |
Specialized REITs - 0.0% |
Rayonier, Inc. | 700 | | $ 32,914 |
Weyerhaeuser Co. | 4,200 | | 127,680 |
| | 160,594 |
SPECIALTY RETAIL - 0.3% |
Specialty Stores - 0.3% |
Tsutsumi Jewelry Co. Ltd. | 52,200 | | 1,271,884 |
TRADING COMPANIES & DISTRIBUTORS - 0.3% |
Trading Companies & Distributors - 0.3% |
Daewoo International Corp. | 31,200 | | 1,150,949 |
TOTAL COMMON STOCKS (Cost $462,108,346) |
412,914,692
|
Nonconvertible Preferred Stocks - 0.0% |
| | | |
PAPER & FOREST PRODUCTS - 0.0% |
Paper Products - 0.0% |
Suzano Papel e Celulose SA
(Cost $108,030) | 28,500 | |
115,516
|
Money Market Funds - 1.8% |
| | | |
Fidelity Cash Central Fund, 0.09% (b) | 1,219,168 | | 1,219,168 |
Fidelity Securities Lending Cash Central Fund, 0.09% (b)(c) | 6,069,934 | | 6,069,934 |
TOTAL MONEY MARKET FUNDS (Cost $7,289,102) |
7,289,102
|
TOTAL INVESTMENT PORTFOLIO - 101.3% (Cost $469,505,478) | | 420,319,310 |
NET OTHER ASSETS (LIABILITIES) - (1.3)% | | (5,252,796) |
NET ASSETS - 100% | $ 415,066,514 |
Legend |
(a) Non-income producing |
(b) Affiliated fund that is generally available only to investment companies and other accounts managed by Fidelity Investments. The rate quoted is the annualized seven-day yield of the fund at period end. A complete unaudited listing of the fund's holdings as of its most recent quarter end is available upon request. In addition, each Fidelity Central Fund's financial statements, which are not covered by the Fund's Report of Independent Registered Public Accounting Firm, are available on the SEC's website or upon request. |
(c) Investment made with cash collateral received from securities on loan. |
(d) Security or a portion of the security is on loan at period end. |
(e) Security exempt from registration under Rule 144A of the Securities Act of 1933. These securities may be resold in transactions exempt from registration, normally to qualified institutional buyers. At the end of the period, the value of these securities amounted to $98,547 or 0.0% of net assets. |
Affiliated Central Funds |
Information regarding fiscal year to date income earned by the Fund from investments in Fidelity Central Funds is as follows: |
Fund | Income earned |
Fidelity Cash Central Fund | $ 2,304 |
Fidelity Securities Lending Cash Central Fund | 554,965 |
Total | $ 557,269 |
Other Information |
The following is a summary of the inputs used, as of October 31, 2013, involving the Fund's assets and liabilities carried at fair value. The inputs or methodology used for valuing securities may not be an indication of the risk associated with investing in those securities. For more information on valuation inputs, and their aggregation into the levels used in the tables below, please refer to the Investment Valuation section in the accompanying Notes to Financial Statements. |
Valuation Inputs at Reporting Date: |
Description | Total | Level 1 | Level 2 | Level 3 |
Investments in Securities: | | | | |
Common Stocks | $ 412,914,692 | $ 326,519,152 | $ 86,395,540 | $ - |
Nonconvertible Preferred Stocks | 115,516 | 115,516 | - | - |
Money Market Funds | 7,289,102 | 7,289,102 | - | - |
Total Investments in Securities: | $ 420,319,310 | $ 333,923,770 | $ 86,395,540 | $ - |
The following is a summary of transfers between Level 1 and Level 2 for the period ended October 31, 2013. Transfers are assumed to have occurred at the beginning of the period, and are primarily attributable to the valuation techniques used for foreign equity securities, as discussed in the accompanying Notes to Financial Statements: |
Transfers | Total |
Level 1 to Level 2 | $ 7,714,186 |
Level 2 to Level 1 | $ 0 |
Distribution of investments by country or territory of incorporation, as a percentage of total net assets, is as follows (Unaudited): |
United States of America | 38.7% |
Canada | 16.3% |
United Kingdom | 14.6% |
Switzerland | 4.5% |
Bermuda | 3.7% |
Bailiwick of Jersey | 2.8% |
Brazil | 2.7% |
Australia | 1.5% |
France | 1.5% |
Korea (South) | 1.5% |
Russia | 1.5% |
Japan | 1.3% |
Norway | 1.3% |
Others (Individually Less Than 1%) | 8.1% |
| 100.0% |
See accompanying notes which are an integral part of the financial statements.
Annual Report
Statement of Assets and Liabilities
| October 31, 2013 |
| | |
Assets | | |
Investment in securities, at value (including securities loaned of $5,895,555) - See accompanying schedule: Unaffiliated issuers (cost $462,216,376) | $ 413,030,208 | |
Fidelity Central Funds (cost $7,289,102) | 7,289,102 | |
Total Investments (cost $469,505,478) | | $ 420,319,310 |
Foreign currency held at value (cost $42,375) | | 42,375 |
Receivable for investments sold | | 10,513,562 |
Receivable for fund shares sold | | 210,272 |
Dividends receivable | | 753,835 |
Distributions receivable from Fidelity Central Funds | | 21,487 |
Prepaid expenses | | 911 |
Other receivables | | 8,785 |
Total assets | | 431,870,537 |
| | |
Liabilities | | |
Payable for investments purchased | $ 9,650,706 | |
Payable for fund shares redeemed | 629,022 | |
Accrued management fee | 242,227 | |
Distribution and service plan fees payable | 41,930 | |
Other affiliated payables | 121,216 | |
Other payables and accrued expenses | 48,988 | |
Collateral on securities loaned, at value | 6,069,934 | |
Total liabilities | | 16,804,023 |
| | |
Net Assets | | $ 415,066,514 |
Net Assets consist of: | | |
Paid in capital | | $ 501,612,128 |
Undistributed net investment income | | 4,309,466 |
Accumulated undistributed net realized gain (loss) on investments and foreign currency transactions | | (41,679,876) |
Net unrealized appreciation (depreciation) on investments and assets and liabilities in foreign currencies | | (49,175,204) |
Net Assets | | $ 415,066,514 |
See accompanying notes which are an integral part of the financial statements.
Annual Report
Financial Statements - continued
Statement of Assets and Liabilities - continued
| October 31, 2013 |
| | |
Calculation of Maximum Offering Price Class A:
Net Asset Value and redemption price per share ($71,293,097 ÷ 5,031,565 shares) | | $ 14.17 |
| | |
Maximum offering price per share (100/94.25 of $14.17) | | $ 15.03 |
Class T:
Net Asset Value and redemption price per share ($12,551,178 ÷ 888,204 shares) | | $ 14.13 |
| | |
Maximum offering price per share (100/96.50 of $14.13) | | $ 14.64 |
Class B:
Net Asset Value and offering price per share ($2,303,213 ÷ 164,359 shares)A | | $ 14.01 |
| | |
Class C:
Net Asset Value and offering price per share ($23,829,687 ÷ 1,707,183 shares)A | | $ 13.96 |
| | |
Global Commodity Stock:
Net Asset Value, offering price and redemption price per share ($273,475,891 ÷ 19,204,409 shares) | | $ 14.24 |
| | |
Institutional Class:
Net Asset Value, offering price and redemption price per share ($31,613,448 ÷ 2,220,504 shares) | | $ 14.24 |
A Redemption price per share is equal to net asset value less any applicable contingent deferred sales charge.
See accompanying notes which are an integral part of the financial statements.
Annual Report
Statement of Operations
| Year ended October 31, 2013 |
| | |
Investment Income | | |
Dividends | | $ 12,264,754 |
Income from Fidelity Central Funds | | 557,269 |
Income before foreign taxes withheld | | 12,822,023 |
Less foreign taxes withheld | | (937,571) |
Total income | | 11,884,452 |
| | |
Expenses | | |
Management fee | $ 3,417,195 | |
Transfer agent fees | 1,423,008 | |
Distribution and service plan fees | 573,855 | |
Accounting and security lending fees | 252,628 | |
Custodian fees and expenses | 70,188 | |
Independent trustees' compensation | 2,944 | |
Registration fees | 93,616 | |
Audit | 54,128 | |
Legal | 1,376 | |
Interest | 1,106 | |
Miscellaneous | 5,026 | |
Total expenses before reductions | 5,895,070 | |
Expense reductions | (69,435) | 5,825,635 |
Net investment income (loss) | | 6,058,817 |
Realized and Unrealized Gain (Loss) Net realized gain (loss) on: | | |
Investment securities: | | |
Unaffiliated issuers | (781,472) | |
Foreign currency transactions | 9,027 | |
Total net realized gain (loss) | | (772,445) |
Change in net unrealized appreciation (depreciation) on: Investment securities | (21,267,158) | |
Assets and liabilities in foreign currencies | 18,814 | |
Total change in net unrealized appreciation (depreciation) | | (21,248,344) |
Net gain (loss) | | (22,020,789) |
Net increase (decrease) in net assets resulting from operations | | $ (15,961,972) |
See accompanying notes which are an integral part of the financial statements.
Annual Report
Financial Statements - continued
Statement of Changes in Net Assets
| Year ended
October 31,
2013 | Year ended
October 31,
2012 |
Increase (Decrease) in Net Assets | | |
Operations | | |
Net investment income (loss) | $ 6,058,817 | $ 6,227,231 |
Net realized gain (loss) | (772,445) | (27,607,132) |
Change in net unrealized appreciation (depreciation) | (21,248,344) | (8,995,088) |
Net increase (decrease) in net assets resulting
from operations | (15,961,972) | (30,374,989) |
Distributions to shareholders from net investment income | (5,697,049) | (3,692,921) |
Distributions to shareholders from net realized gain | - | (671,463) |
Total distributions | (5,697,049) | (4,364,384) |
Share transactions - net increase (decrease) | (152,423,209) | (156,629,581) |
Redemption fees | 18,199 | 31,600 |
Total increase (decrease) in net assets | (174,064,031) | (191,337,354) |
| | |
Net Assets | | |
Beginning of period | 589,130,545 | 780,467,899 |
End of period (including undistributed net investment income of $4,309,466 and undistributed net investment income of $4,752,569, respectively) | $ 415,066,514 | $ 589,130,545 |
See accompanying notes which are an integral part of the financial statements.
Annual Report
Financial Highlights - Class A
Years ended October 31, | 2013 | 2012 | 2011 | 2010 | 2009 I |
Selected Per-Share Data | | | | | |
Net asset value, beginning of period | $ 14.59 | $ 15.14 | $ 15.60 | $ 13.29 | $ 10.00 |
Income from Investment Operations | | | | | |
Net investment income (loss) E | .16 | .11 | .12 | .19 H | (.01) |
Net realized and unrealized gain (loss) | (.45) | (.59) | (.38) | 2.20 | 3.29 |
Total from investment operations | (.29) | (.48) | (.26) | 2.39 | 3.28 |
Distributions from net investment income | (.13) | (.05) | (.13) | - K | - |
Distributions from net realized gain | - | (.01) | (.06) | (.08) | - |
Total distributions | (.13) | (.07) M | (.20) L | (.08) | - |
Redemption fees added to paid in capital E | - K | - K | - K | - K | .01 |
Net asset value, end of period | $ 14.17 | $ 14.59 | $ 15.14 | $ 15.60 | $ 13.29 |
Total Return B, C, D | (2.00)% | (3.19)% | (1.80)% | 18.04% | 32.90% |
Ratios to Average Net Assets F, J | | | | | |
Expenses before reductions | 1.36% | 1.34% | 1.32% | 1.37% | 1.65% A |
Expenses net of fee waivers, if any | 1.35% | 1.34% | 1.32% | 1.37% | 1.50% A |
Expenses net of all reductions | 1.34% | 1.33% | 1.31% | 1.36% | 1.48% A |
Net investment income (loss) | 1.12% | .80% | .71% | 1.35% H | (.15)% A |
Supplemental Data | | | | | |
Net assets, end of period (000 omitted) | $ 71,293 | $ 99,694 | $ 127,979 | $ 60,370 | $ 15,705 |
Portfolio turnover rate G | 65% | 91% | 71% | 54% | 25% A |
A Annualized
B Total returns for periods of less than one year are not annualized.
C Total returns would have been lower if certain expenses had not been reduced during the applicable periods shown.
D Total returns do not include the effect of the sales charges.
E Calculated based on average shares outstanding during the period.
F Fees and expenses of any underlying Fidelity Central Funds are not included in the Fund's expense ratio. The Fund indirectly bears its proportionate share of the expenses of any underlying Fidelity Central Funds.
G Amount does not include the portfolio activity of any underlying Fidelity Central Funds.
H Investment income per share reflects a large, non-recurring dividend which amounted to $.13 per share. Excluding this non-recurring dividend, the ratio of net investment income (loss) to average net assets would have been .42%.
I For the period March 25, 2009 (commencement of operations) to October 31, 2009.
J Expense ratios reflect operating expenses of the class. Expenses before reductions do not reflect amounts reimbursed by the investment adviser or reductions from brokerage service arrangements or reductions from other expense offset arrangements and do not represent the amount paid by the class during periods when reimbursements or reductions occur. Expense ratios before reductions for start-up periods may not be representative of longer-term operating periods. Expenses net of fee waivers reflect expenses after reimbursement by the investment adviser but prior to reductions from brokerage service arrangements or other expense offset arrangements. Expenses net of all reductions represent the net expenses paid by the class.
K Amount represents less than $.01 per share.
L Total distributions of $.20 per share is comprised of distributions from net investment income of $.133 and distributions from net realized gain of $.062 per share.
M Total distributions of $.07 per share is comprised of distributions from net investment income of $.052 and distributions from net realized gain of $.014 per share.
See accompanying notes which are an integral part of the financial statements.
Annual Report
Financial Highlights - Class T
Years ended October 31, | 2013 | 2012 | 2011 | 2010 | 2009 I |
Selected Per-Share Data | | | | | |
Net asset value, beginning of period | $ 14.54 | $ 15.08 | $ 15.55 | $ 13.27 | $ 10.00 |
Income from Investment Operations | | | | | |
Net investment income (loss) E | .12 | .08 | .07 | .16 H | (.03) |
Net realized and unrealized gain (loss) | (.45) | (.60) | (.38) | 2.19 | 3.29 |
Total from investment operations | (.33) | (.52) | (.31) | 2.35 | 3.26 |
Distributions from net investment income | (.08) | (.01) | (.10) | - | - |
Distributions from net realized gain | - | (.01) | (.06) | (.07) | - |
Total distributions | (.08) | (.02) | (.16) | (.07) | - |
Redemption fees added to paid in capital E | - K | - K | - K | - K | .01 |
Net asset value, end of period | $ 14.13 | $ 14.54 | $ 15.08 | $ 15.55 | $ 13.27 |
Total Return B, C, D | (2.26)% | (3.43)% | (2.09)% | 17.73% | 32.70% |
Ratios to Average Net Assets F, J | | | | | |
Expenses before reductions | 1.62% | 1.61% | 1.60% | 1.63% | 2.04% A |
Expenses net of fee waivers, if any | 1.61% | 1.61% | 1.60% | 1.63% | 1.75% A |
Expenses net of all reductions | 1.60% | 1.60% | 1.59% | 1.61% | 1.73% A |
Net investment income (loss) | .86% | .53% | .43% | 1.10% H | (.40)% A |
Supplemental Data | | | | | |
Net assets, end of period (000 omitted) | $ 12,551 | $ 16,692 | $ 20,831 | $ 11,762 | $ 4,665 |
Portfolio turnover rate G | 65% | 91% | 71% | 54% | 25% A |
A Annualized
B Total returns for periods of less than one year are not annualized.
C Total returns would have been lower if certain expenses had not been reduced during the applicable periods shown.
D Total returns do not include the effect of the sales charges.
E Calculated based on average shares outstanding during the period.
F Fees and expenses of any underlying Fidelity Central Funds are not included in the Fund's expense ratio. The Fund indirectly bears its proportionate share of the expenses of any underlying Fidelity Central Funds.
G Amount does not include the portfolio activity of any underlying Fidelity Central Funds.
H Investment income per share reflects a large, non-recurring dividend which amounted to $.13 per share. Excluding this non-recurring dividend, the ratio of net investment income (loss) to average net assets would have been .17%.
I For the period March 25, 2009 (commencement of operations) to October 31, 2009.
J Expense ratios reflect operating expenses of the class. Expenses before reductions do not reflect amounts reimbursed by the investment adviser or reductions from brokerage service arrangements or reductions from other expense offset arrangements and do not represent the amount paid by the class during periods when reimbursements or reductions occur. Expense ratios before reductions for start-up periods may not be representative of longer-term operating periods. Expenses net of fee waivers reflect expenses after reimbursement by the investment adviser but prior to reductions from brokerage service arrangements or other expense offset arrangements. Expenses net of all reductions represent the net expenses paid by the class.
K Amount represents less than $.01 per share.
See accompanying notes which are an integral part of the financial statements.
Annual Report
Financial Highlights - Class B
Years ended October 31, | 2013 | 2012 | 2011 | 2010 | 2009 I |
Selected Per-Share Data | | | | | |
Net asset value, beginning of period | $ 14.41 | $ 15.00 | $ 15.46 | $ 13.22 | $ 10.00 |
Income from Investment Operations | | | | | |
Net investment income (loss) E | .05 | - K | (.01) | .08 H | (.07) |
Net realized and unrealized gain (loss) | (.45) | (.59) | (.39) | 2.20 | 3.28 |
Total from investment operations | (.40) | (.59) | (.40) | 2.28 | 3.21 |
Distributions from net investment income | - K | - | - | - | - |
Distributions from net realized gain | - | - | (.06) | (.04) | - |
Total distributions | - K | - | (.06) | (.04) | - |
Redemption fees added to paid in capital E | - K | - K | - K | - K | .01 |
Net asset value, end of period | $ 14.01 | $ 14.41 | $ 15.00 | $ 15.46 | $ 13.22 |
Total Return B, C, D | (2.75)% | (3.93)% | (2.62)% | 17.23% | 32.20% |
Ratios to Average Net Assets F, J | | | | | |
Expenses before reductions | 2.11% | 2.10% | 2.11% | 2.16% | 2.66% A |
Expenses net of fee waivers, if any | 2.11% | 2.10% | 2.11% | 2.16% | 2.25% A |
Expenses net of all reductions | 2.10% | 2.10% | 2.10% | 2.15% | 2.23% A |
Net investment income (loss) | .36% | .03% | (.09)% | .56% H | (.90)% A |
Supplemental Data | | | | | |
Net assets, end of period (000 omitted) | $ 2,303 | $ 3,097 | $ 4,324 | $ 4,348 | $ 2,726 |
Portfolio turnover rate G | 65% | 91% | 71% | 54% | 25% A |
A Annualized
B Total returns for periods of less than one year are not annualized.
C Total returns would have been lower if certain expenses had not been reduced during the applicable periods shown.
D Total returns do not include the effect of the contingent deferred sales charge.
E Calculated based on average shares outstanding during the period.
F Fees and expenses of any underlying Fidelity Central Funds are not included in the Fund's expense ratio. The Fund indirectly bears its proportionate share of the expenses of any underlying Fidelity Central Funds.
G Amount does not include the portfolio activity of any underlying Fidelity Central Funds.
H Investment income per share reflects a large, non-recurring dividend which amounted to $.13 per share. Excluding this non-recurring dividend, the ratio of net investment income (loss) to average net assets would have been (.37)%.
I For the period March 25, 2009 (commencement of operations) to October 31, 2009.
J Expense ratios reflect operating expenses of the class. Expenses before reductions do not reflect amounts reimbursed by the investment adviser or reductions from brokerage service arrangements or reductions from other expense offset arrangements and do not represent the amount paid by the class during periods when reimbursements or reductions occur. Expense ratios before reductions for start-up periods may not be representative of longer-term operating periods. Expenses net of fee waivers reflect expenses after reimbursement by the investment adviser but prior to reductions from brokerage service arrangements or other expense offset arrangements. Expenses net of all reductions represent the net expenses paid by the class.
K Amount represents less than $.01 per share.
See accompanying notes which are an integral part of the financial statements.
Annual Report
Financial Highlights - Class C
Years ended October 31, | 2013 | 2012 | 2011 | 2010 | 2009 I |
Selected Per-Share Data | | | | | |
Net asset value, beginning of period | $ 14.37 | $ 14.95 | $ 15.45 | $ 13.22 | $ 10.00 |
Income from Investment Operations | | | | | |
Net investment income (loss) E | .05 | .01 | (.01) | .08 H | (.07) |
Net realized and unrealized gain (loss) | (.44) | (.59) | (.38) | 2.19 | 3.28 |
Total from investment operations | (.39) | (.58) | (.39) | 2.27 | 3.21 |
Distributions from net investment income | (.02) | - | (.05) | - | - |
Distributions from net realized gain | - | - | (.06) | (.04) | - |
Total distributions | (.02) | - | (.11) | (.04) | - |
Redemption fees added to paid in capital E | - K | - K | - K | - K | .01 |
Net asset value, end of period | $ 13.96 | $ 14.37 | $ 14.95 | $ 15.45 | $ 13.22 |
Total Return B, C, D | (2.75)% | (3.88)% | (2.58)% | 17.21% | 32.20% |
Ratios to Average Net Assets F, J | | | | | |
Expenses before reductions | 2.11% | 2.10% | 2.09% | 2.14% | 2.53% A |
Expenses net of fee waivers, if any | 2.11% | 2.10% | 2.09% | 2.14% | 2.25% A |
Expenses net of all reductions | 2.10% | 2.09% | 2.08% | 2.13% | 2.23% A |
Net investment income (loss) | .36% | .03% | (.07)% | .58% H | (.90)% A |
Supplemental Data | | | | | |
Net assets, end of period (000 omitted) | $ 23,830 | $ 31,865 | $ 37,185 | $ 14,338 | $ 4,798 |
Portfolio turnover rate G | 65% | 91% | 71% | 54% | 25% A |
A Annualized
B Total returns for periods of less than one year are not annualized.
C Total returns would have been lower if certain expenses had not been reduced during the applicable periods shown.
D Total returns do not include the effect of the contingent deferred sales charge.
E Calculated based on average shares outstanding during the period.
F Fees and expenses of any underlying Fidelity Central Funds are not included in the Fund's expense ratio. The Fund indirectly bears its proportionate share of the expenses of any underlying Fidelity Central Funds.
G Amount does not include the portfolio activity of any underlying Fidelity Central Funds.
H Investment income per share reflects a large, non-recurring dividend which amounted to $.13 per share. Excluding this non-recurring dividend, the ratio of net investment income (loss) to average net assets would have been (.34)%.
I For the period March 25, 2009 (commencement of operations) to October 31, 2009.
J Expense ratios reflect operating expenses of the class. Expenses before reductions do not reflect amounts reimbursed by the investment adviser or reductions from brokerage service arrangements or reductions from other expense offset arrangements and do not represent the amount paid by the class during periods when reimbursements or reductions occur. Expense ratios before reductions for start-up periods may not be representative of longer-term operating periods. Expenses net of fee waivers reflect expenses after reimbursement by the investment adviser but prior to reductions from brokerage service arrangements or other expense offset arrangements. Expenses net of all reductions represent the net expenses paid by the class.
K Amount represents less than $.01 per share.
See accompanying notes which are an integral part of the financial statements.
Annual Report
Financial Highlights - Global Commodity Stock
Years ended October 31, | 2013 | 2012 | 2011 | 2010 | 2009 H |
Selected Per-Share Data | | | | | |
Net asset value, beginning of period | $ 14.66 | $ 15.21 | $ 15.66 | $ 13.31 | $ 10.00 |
Income from Investment Operations | | | | | |
Net investment income (loss) D | .19 | .15 | .16 | .23 G | .01 |
Net realized and unrealized gain (loss) | (.45) | (.60) | (.39) | 2.21 | 3.29 |
Total from investment operations | (.26) | (.45) | (.23) | 2.44 | 3.30 |
Distributions from net investment income | (.16) | (.08) | (.16) | (.01) | - |
Distributions from net realized gain | - | (.01) | (.06) | (.08) | - |
Total distributions | (.16) | (.10) K | (.22) | (.09) | - |
Redemption fees added to paid in capital D | - J | - J | - J | - J | .01 |
Net asset value, end of period | $ 14.24 | $ 14.66 | $ 15.21 | $ 15.66 | $ 13.31 |
Total Return B, C | (1.75)% | (2.96)% | (1.59)% | 18.38% | 33.10% |
Ratios to Average Net Assets E, I | | | | | |
Expenses before reductions | 1.11% | 1.10% | 1.08% | 1.10% | 1.42% A |
Expenses net of fee waivers, if any | 1.11% | 1.10% | 1.08% | 1.10% | 1.25% A |
Expenses net of all reductions | 1.09% | 1.09% | 1.07% | 1.09% | 1.23% A |
Net investment income (loss) | 1.37% | 1.04% | .95% | 1.62% G | .10% A |
Supplemental Data | | | | | |
Net assets, end of period (000 omitted) | $ 273,476 | $ 387,242 | $ 531,224 | $ 310,186 | $ 159,439 |
Portfolio turnover rate F | 65% | 91% | 71% | 54% | 25% A |
A Annualized
B Total returns for periods of less than one year are not annualized.
C Total returns would have been lower if certain expenses had not been reduced during the applicable periods shown.
D Calculated based on average shares outstanding during the period.
E Fees and expenses of any underlying Fidelity Central Funds are not included in the Fund's expense ratio. The Fund indirectly bears its proportionate share of the expenses of any underlying Fidelity Central Funds.
F Amount does not include the portfolio activity of any underlying Fidelity Central Funds.
G Investment income per share reflects a large, non-recurring dividend which amounted to $.13 per share. Excluding this non-recurring dividend, the ratio of net investment income (loss) to average net assets would have been .69%.
H For the period March 25, 2009 (commencement of operations) to October 31, 2009.
I Expense ratios reflect operating expenses of the class. Expenses before reductions do not reflect amounts reimbursed by the investment adviser or reductions from brokerage service arrangements or reductions from other expense offset arrangements and do not represent the amount paid by the class during periods when reimbursements or reductions occur. Expense ratios before reductions for start-up periods may not be representative of longer-term operating periods. Expenses net of fee waivers reflect expenses after reimbursement by the investment adviser but prior to reductions from brokerage service arrangements or other expense offset arrangements. Expenses net of all reductions represent the net expenses paid by the class.
J Amount represents less than $.01 per share.
K Total distributions of $.10 per share is comprised of distributions from net investment income of $.084 and distributions from net realized gain of $.014 per share.
See accompanying notes which are an integral part of the financial statements.
Annual Report
Financial Highlights - Institutional Class
Years ended October 31, | 2013 | 2012 | 2011 | 2010 | 2009 H |
Selected Per-Share Data | | | | | |
Net asset value, beginning of period | $ 14.67 | $ 15.22 | $ 15.66 | $ 13.31 | $ 10.00 |
Income from Investment Operations | | | | | |
Net investment income (loss) D | .20 | .16 | .16 | .23 G | .01 |
Net realized and unrealized gain (loss) | (.45) | (.60) | (.38) | 2.21 | 3.29 |
Total from investment operations | (.25) | (.44) | (.22) | 2.44 | 3.30 |
Distributions from net investment income | (.18) | (.09) | (.16) | (.01) | - |
Distributions from net realized gain | - | (.01) | (.06) | (.08) | - |
Total distributions | (.18) | (.11) K | (.22) | (.09) | - |
Redemption fees added to paid in capital D | - J | - J | - J | - J | .01 |
Net asset value, end of period | $ 14.24 | $ 14.67 | $ 15.22 | $ 15.66 | $ 13.31 |
Total Return B, C | (1.71)% | (2.90)% | (1.50)% | 18.39% | 33.10% |
Ratios to Average Net Assets E, I | | | | | |
Expenses before reductions | 1.04% | 1.04% | 1.03% | 1.09% | 1.36% A |
Expenses net of fee waivers, if any | 1.04% | 1.04% | 1.03% | 1.09% | 1.25% A |
Expenses net of all reductions | 1.03% | 1.03% | 1.03% | 1.07% | 1.23% A |
Net investment income (loss) | 1.43% | 1.10% | .99% | 1.64% G | .10% A |
Supplemental Data | | | | | |
Net assets, end of period (000 omitted) | $ 31,613 | $ 50,540 | $ 58,925 | $ 35,739 | $ 9,811 |
Portfolio turnover rate F | 65% | 91% | 71% | 54% | 25% A |
A Annualized
B Total returns for periods of less than one year are not annualized.
C Total returns would have been lower if certain expenses had not been reduced during the applicable periods shown.
D Calculated based on average shares outstanding during the period.
E Fees and expenses of any underlying Fidelity Central Funds are not included in the Fund's expense ratio. The Fund indirectly bears its proportionate share of the expenses of any underlying Fidelity Central Funds.
F Amount does not include the portfolio activity of any underlying Fidelity Central Funds.
G Investment income per share reflects a large, non-recurring dividend which amounted to $.13 per share. Excluding this non-recurring dividend, the ratio of net investment income (loss) to average net assets would have been .71%.
H For the period March 25, 2009 (commencement of operations) to October 31, 2009.
I Expense ratios reflect operating expenses of the class. Expenses before reductions do not reflect amounts reimbursed by the investment adviser or reductions from brokerage service arrangements or reductions from other expense offset arrangements and do not represent the amount paid by the class during periods when reimbursements or reductions occur. Expense ratios before reductions for start-up periods may not be representative of longer-term operating periods. Expenses net of fee waivers reflect expenses after reimbursement by the investment adviser but prior to reductions from brokerage service arrangements or other expense offset arrangements. Expenses net of all reductions represent the net expenses paid by the class.
J Amount represents less than $.01 per share.
K Total distributions of $.11 per share is comprised of distributions from net investment income of $.093 and distributions from net realized gain of $.014 per share.
See accompanying notes which are an integral part of the financial statements.
Annual Report
Notes to Financial Statements
For the period ended October 31, 2013
1. Organization.
Fidelity Global Commodity Stock Fund (the Fund) is a non-diversified fund of Fidelity Investment Trust (the Trust) and is authorized to issue an unlimited number of shares. The Trust is registered under the Investment Company Act of 1940, as amended (the 1940 Act), as an open-end management investment company organized as a Massachusetts business trust. The Fund offers Class A, Class T, Class C, Global Commodity Stock and Institutional Class shares, each of which, along with Class B shares, has equal rights as to assets and voting privileges. Class B shares are closed to new accounts and additional purchases, except for exchanges and reinvestments. Each class has exclusive voting rights with respect to matters that affect that class. Class B shares will automatically convert to Class A shares after a holding period of seven years from the initial date of purchase. The Fund's investments in emerging markets can be subject to social, economic, regulatory, and political uncertainties and can be extremely volatile.
2. Investments in Fidelity Central Funds.
The Fund invests in Fidelity Central Funds, which are open-end investment companies generally available only to other investment companies and accounts managed by Fidelity Management & Research Company (FMR) and its affiliates. The Fund's Schedule of Investments lists each of the Fidelity Central Funds held as of period end, if any, as an investment of the Fund, but does not include the underlying holdings of each Fidelity Central Fund. As an Investing Fund, the Fund indirectly bears its proportionate share of the expenses of the underlying Fidelity Central Funds.
The Money Market Central Funds seek preservation of capital and current income and are managed by Fidelity Investments Money Management, Inc. (FIMM), an affiliate of FMR.
A complete unaudited list of holdings for each Fidelity Central Fund is available upon request or at the Securities and Exchange Commission (the SEC) website at www.sec.gov. In addition, the financial statements of the Fidelity Central Funds, which are not covered by the Fund's Report of Independent Registered Public Accounting Firm, are available on the SEC website or upon request.
3. Significant Accounting Policies.
The financial statements have been prepared in conformity with accounting principles generally accepted in the United States of America (GAAP), which require management to make certain estimates and assumptions at the date of the financial statements. Actual results could differ from those estimates. Subsequent events, if any, through the date that the financial statements were issued have been evaluated in the preparation of
Annual Report
3. Significant Accounting Policies - continued
the financial statements. The following summarizes the significant accounting policies of the Fund:
Investment Valuation. Investments are valued as of 4:00 p.m. Eastern time on the last calendar day of the period. In accordance with valuation policies and procedures approved by the Board of Trustees (the Board), the Fund attempts to obtain prices from one or more third party pricing vendors or brokers to value its investments. When current market prices, quotations or currency exchange rates are not readily available or reliable, investments will be fair valued in good faith by the FMR Fair Value Committee (the Committee), in accordance with procedures adopted by the Board. Factors used in determining fair value vary by investment type and may include market or investment specific events. The frequency with which these procedures are used cannot be predicted and they may be utilized to a significant extent. The Committee oversees the Fund's valuation policies and procedures and is responsible for approving and reporting to the Board all fair value determinations.
The Fund categorizes the inputs to valuation techniques used to value its investments into a disclosure hierarchy consisting of three levels as shown below:
Level 1 - quoted prices in active markets for identical investments
Level 2 - other significant observable inputs (including quoted prices for similar investments, interest rates, prepayment speeds, etc.)
Level 3 - unobservable inputs (including the Fund's own assumptions based on the best information available)
Valuation techniques used to value the Fund's investments by major category are as follows:
Equity securities, including restricted securities, for which market quotations are readily available, are valued at the last reported sale price or official closing price as reported by a third party pricing vendor on the primary market or exchange on which they are traded and are categorized as Level 1 in the hierarchy. In the event there were no sales during the day or closing prices are not available, securities are valued at the last quoted bid price or may be valued using the last available price and are generally categorized as Level 2 in the hierarchy. For foreign equity securities, when market or security specific events arise, comparisons to the valuation of American Depositary Receipts (ADRs), futures contracts, Exchange-Traded Funds (ETFs) and certain indexes as well as quoted prices for similar securities may be used and would be categorized as Level 2 in the hierarchy. Utilizing these techniques may result in transfers between Level 1 and Level 2. For equity securities, including restricted securities, where observable inputs are
Annual Report
Notes to Financial Statements - continued
3. Significant Accounting Policies - continued
Investment Valuation - continued
limited, assumptions about market activity and risk are used and these securities may be categorized as Level 3 in the hierarchy.
Investments in open-end mutual funds, including the Fidelity Central Funds, are valued at their closing net asset value (NAV) each business day and are categorized as Level 1 in the hierarchy.
Changes in valuation techniques may result in transfers in or out of an assigned level within the disclosure hierarchy. The aggregate value of investments by input level, as of October 31, 2013, including information on transfers between Levels 1 and 2, is included at the end of the Fund's Schedule of Investments.
Foreign Currency. The Fund may use foreign currency contracts to facilitate transactions in foreign-denominated securities. Gains and losses from these transactions may arise from changes in the value of the foreign currency or if the counterparties do not perform under the contracts' terms.
Foreign-denominated assets, including investment securities, and liabilities are translated into U.S. dollars at the exchange rates at period end. Purchases and sales of investment securities, income and dividends received and expenses denominated in foreign currencies are translated into U.S. dollars at the exchange rate in effect on the transaction date.
The effects of exchange rate fluctuations on investments are included with the net realized and unrealized gain (loss) on investment securities. Other foreign currency transactions resulting in realized and unrealized gain (loss) are disclosed separately.
Investment Transactions and Income. For financial reporting purposes, the Fund's investment holdings and NAV include trades executed through the end of the last business day of the period. The NAV per share for processing shareholder transactions is calculated as of the close of business of the New York Stock Exchange (NYSE), normally 4:00 p.m. Eastern time and includes trades executed through the end of the prior business day. Gains and losses on securities sold are determined on the basis of identified cost and may include proceeds received from litigation. Dividend income is recorded on the ex-dividend date, except for certain dividends from foreign securities where the ex-dividend date may have passed, which are recorded as soon as the Fund is informed of the ex-dividend date. Non-cash dividends included in dividend income, if any, are recorded at the fair market value of the securities received. Distributions received on securities that represent a return of capital or capital gain are recorded as a reduction of cost of investments and/or as a realized gain. Subsequent to ex-dividend date the Fund determines the components of these distributions, based upon receipt of tax filings or
Annual Report
3. Significant Accounting Policies - continued
Investment Transactions and Income - continued
other correspondence relating to the underlying investment. Interest income and distributions from the Fidelity Central Funds are accrued as earned. Investment income is recorded net of foreign taxes withheld where recovery of such taxes is uncertain.
Class Allocations and Expenses. Investment income, realized and unrealized capital gains and losses, common expenses of the Fund, and certain fund-level expense reductions, if any, are allocated daily on a pro-rata basis to each class based on the relative net assets of each class to the total net assets of the Fund. Each class differs with respect to transfer agent and distribution and service plan fees incurred. Certain expense reductions may also differ by class. For the reporting period, the allocated portion of income and expenses to each class as a percent of its average net assets may vary due to the timing of recording these transactions in relation to fluctuating net assets of the classes. Expenses directly attributable to a fund are charged to that fund. Expenses attributable to more than one fund are allocated among the respective funds on the basis of relative net assets or other appropriate methods. Expense estimates are accrued in the period to which they relate and adjustments are made when actual amounts are known.
Income Tax Information and Distributions to Shareholders. Each year, the Fund intends to qualify as a regulated investment company under Subchapter M of the Internal Revenue Code, including distributing substantially all of its taxable income and realized gains. As a result, no provision for U.S. Federal income taxes is required. As of October 31, 2013, the Fund did not have any unrecognized tax benefits in the financial statements; nor is the Fund aware of any tax positions for which it is reasonably possible that the total amounts of unrecognized tax benefits will significantly change in the next twelve months. The Fund files a U.S. federal tax return, in addition to state and local tax returns as required. The Fund's federal income tax returns are subject to examination by the Internal Revenue Service (IRS) for a period of three fiscal years after they are filed. State and local tax returns may be subject to examination for an additional fiscal year depending on the jurisdiction. Foreign taxes are provided for based on the Fund's understanding of the tax rules and rates that exist in the foreign markets in which it invests.
Distributions are declared and recorded on the ex-dividend date. Income dividends and capital gain distributions are declared separately for each class. Income and capital gain distributions are determined in accordance with income tax regulations, which may differ from GAAP. In addition, the Fund claimed a portion of the payment made to redeeming shareholders as a distribution for income tax purposes.
Annual Report
Notes to Financial Statements - continued
3. Significant Accounting Policies - continued
Income Tax Information and Distributions to Shareholders - continued
Capital accounts within the financial statements are adjusted for permanent book-tax differences. These adjustments have no impact on net assets or the results of operations. Temporary book-tax differences will reverse in a subsequent period.
Book-tax differences are primarily due to foreign currency transactions, passive foreign investment companies (PFIC), partnerships, capital loss carryforwards and losses deferred due to wash sales.
The federal tax cost of investment securities and unrealized appreciation (depreciation) as of period end were as follows:
Gross unrealized appreciation | $ 30,185,400 |
Gross unrealized depreciation | (86,132,208) |
Net unrealized appreciation (depreciation) on securities and other investments | $ (55,946,808) |
| |
Tax Cost | $ 476,266,118 |
The tax-based components of distributable earnings as of period end were as follows:
Undistributed ordinary income | $ 4,627,021 |
Capital loss carryforward | $ (35,236,790) |
Net unrealized appreciation (depreciation) | $ (55,935,844) |
Capital loss carryforwards are only available to offset future capital gains of the Fund to the extent provided by regulations and may be limited. Under the Regulated Investment Company Modernization Act of 2010 (the Act), the Fund is permitted to carry forward capital losses incurred in taxable years beginning after December 22, 2010 for an unlimited period and such capital losses are required to be used prior to any losses that expire. The capital loss carryforward information presented below, including any applicable limitation, is estimated as of fiscal period end and is subject to adjustment.
Fiscal year of expiration | |
2019 | $ (6,952,413) |
No expiration | |
Short-term | (22,719,124) |
Long-term | (5,565,253) |
Total no expiration | (28,284,377) |
Total capital loss carryforward | $ (35,236,790) |
Annual Report
3. Significant Accounting Policies - continued
Income Tax Information and Distributions to Shareholders - continued
The tax character of distributions paid was as follows:
| October 31, 2013 | October 31, 2012 |
Ordinary Income | $ 5,697,049 | $ 4,364,384 |
Short-Term Trading (Redemption) Fees. Shares held by investors in the Fund less than 30 days may have been subject to a redemption fee equal to 1.00% of the net asset value of shares redeemed. All redemption fees, which reduce the proceeds of the shareholder redemption, are retained by the Fund and accounted for as an addition to paid in capital.
Restricted Securities. The Fund may invest in securities that are subject to legal or contractual restrictions on resale. These securities generally may be resold in transactions exempt from registration or to the public if the securities are registered. Disposal of these securities may involve time-consuming negotiations and expense, and prompt sale at an acceptable price may be difficult. Information regarding restricted securities is included at the end of the Fund's Schedule of Investments.
4. Purchases and Sales of Investments.
Purchases and sales of securities, other than short-term securities, aggregated $311,798,862 and $462,703,874, respectively.
5. Fees and Other Transactions with Affiliates.
Management Fee. FMR and its affiliates provide the Fund with investment management related services for which the Fund pays a monthly management fee. The management fee is the sum of an individual fund fee rate that is based on an annual rate of .45% of the Fund's average net assets and an annualized group fee rate that averaged .25% during the period. The group fee rate is based upon the average net assets of all the mutual funds advised by FMR, including any mutual funds previously advised by FMR that are currently advised by Fidelity SelectCo, LLC, an affiliate of FMR. The group fee rate decreases as assets under management increase and increases as assets under management decrease. For the reporting period, the total annual management fee rate was .71% of the Fund's average net assets.
Distribution and Service Plan Fees. In accordance with Rule 12b-1 of the 1940 Act, the Fund has adopted separate Distribution and Service Plans for each class of shares. Certain classes pay Fidelity Distributors Corporation (FDC), an affiliate of FMR, separate Distribution and Service Fees, each of which is based on an annual percentage of each class' average net assets. In addition, FDC may pay financial intermediaries for
Annual Report
Notes to Financial Statements - continued
5. Fees and Other Transactions with Affiliates - continued
Distribution and Service Plan Fees - continued
selling shares of the Fund and providing shareholder support services. For the period, the Distribution and Service Fee rates, total fees and amounts retained by FDC were as follows:
| Distribution
Fee | Service
Fee | Total Fees | Retained
by FDC |
Class A | -% | .25% | $ 208,174 | $ 2,543 |
Class T | .25% | .25% | 69,496 | 436 |
Class B | .75% | .25% | 26,532 | 19,956 |
Class C | .75% | .25% | 269,653 | 34,543 |
| | | $ 573,855 | $ 57,478 |
Sales Load. FDC may receive a front-end sales charge of up to 5.75% for selling Class A shares and 3.50% for selling Class T shares, some of which is paid to financial intermediaries for selling shares of the Fund. Depending on the holding period, FDC may receive contingent deferred sales charges levied on Class A, Class T, Class B, and Class C redemptions. The deferred sales charges range from 5.00% to 1.00% for Class B shares, 1.00% for Class C shares, 1.00% for certain purchases of Class A shares and .25% for certain purchases of Class T shares.
For the period, sales charge amounts retained by FDC were as follows:
| Retained
by FDC |
Class A | $ 27,444 |
Class T | 2,976 |
Class B* | 7,373 |
Class C* | 3,342 |
| $ 41,135 |
* When Class B and Class C shares are initially sold, FDC pays commissions from its own resources to financial intermediaries through which the sales
are made.
Transfer Agent Fees. Fidelity Investments Institutional Operations Company, Inc., (FIIOC), an affiliate of FMR, is the transfer, dividend disbursing and shareholder servicing agent for each class of the Fund. FIIOC receives account fees and asset-based fees that vary according to the account size and type of account of the shareholders of the respective classes of the Fund. FIIOC pays for typesetting, printing and mailing of shareholder reports, except proxy statements.
Annual Report
5. Fees and Other Transactions with Affiliates - continued
Transfer Agent Fees - continued
For the period, transfer agent fees for each class were as follows:
| Amount | % of
Average
Net Assets |
Class A | $ 246,621 | .30 |
Class T | 42,562 | .31 |
Class B | 7,942 | .30 |
Class C | 81,004 | .30 |
Global Commodity Stock | 944,581 | .30 |
Institutional Class | 100,298 | .23 |
| $ 1,423,008 | |
Accounting and Security Lending Fees. Fidelity Service Company, Inc. (FSC), an affiliate of FMR, maintains the Fund's accounting records. The accounting fee is based on the level of average net assets for each month. Under a separate contract, FSC administers the security lending program. The security lending fee is based on the number and duration of lending transactions.
Brokerage Commissions. The Fund placed a portion of its portfolio transactions with brokerage firms which are affiliates of the investment adviser. Brokerage commissions are included in net realized gain (loss) and change in net unrealized appreciation (depreciation) in the Statement of Operations. The commissions paid to these affiliated firms were $19,771 for the period.
Interfund Lending Program. Pursuant to an Exemptive Order issued by the SEC, the Fund, along with other registered investment companies having management contracts with FMR, may participate in an interfund lending program. This program provides an alternative credit facility allowing the funds to borrow from, or lend money to, other participating affiliated funds. At period end, there were no interfund loans outstanding. The Fund's activity in this program during the period for which loans were outstanding was as follows:
Borrower or Lender | Average Loan
Balance | Weighted Average
Interest Rate | Interest
Expense |
Borrower | $ 3,605,577 | .41% | $ 1,065 |
6. Committed Line of Credit.
The Fund participates with other funds managed by FMR or an affiliate in a $4.25 billion credit facility (the "line of credit") to be utilized for temporary or emergency purposes to fund shareholder redemptions or for other short-term liquidity purposes. The Fund has
Annual Report
Notes to Financial Statements - continued
6. Committed Line of Credit - continued
agreed to pay commitment fees on its pro-rata portion of the line of credit, which amounted to $1,125 and is reflected in Miscellaneous expenses on the Statement of Operations. During the period, there were no borrowings on this line of credit.
7. Security Lending.
The Fund lends portfolio securities through a lending agent from time to time in order to earn additional income. For equity securities, a lending agent is used and may loan securities to certain qualified borrowers, including Fidelity Capital Markets (FCM), a broker-dealer affiliated with the Fund. On the settlement date of the loan, the Fund receives collateral (in the form of U.S. Treasury obligations, letters of credit and/or cash) against the loaned securities and maintains collateral in an amount not less than 100% of the market value of the loaned securities during the period of the loan. The market value of the loaned securities is determined at the close of business of the Fund and any additional required collateral is delivered to the Fund on the next business day. If the borrower defaults on its obligation to return the securities loaned because of insolvency or other reasons, the Fund may apply collateral received from the borrower against the obligation. The Fund may experience delays and costs in recovering the securities loaned. Any cash collateral received is invested in the Fidelity Securities Lending Cash Central Fund. The value of loaned securities and cash collateral at period end are disclosed on the Fund's Statement of Assets and Liabilities. At period end, there were no security loans outstanding with FCM. Security lending income represents the income earned on investing cash collateral, less rebates paid to borrowers and any lending agent fees associated with the loan, plus any premium payments received for lending certain types of securities. Security lending income is presented in the Statement of Operations as a component of income from Fidelity Central Funds. Total security lending income during the period amounted to $554,965, including $24,917 from securities loaned to FCM.
8. Bank Borrowings.
The Fund is permitted to have bank borrowings for temporary or emergency purposes to fund shareholder redemptions or for other short-term liquidity requirements. The Fund has established borrowing arrangements with certain banks. The interest rate on the borrowings is the bank's base rate, as revised from time to time. The average loan balance during the period for which loans were outstanding amounted to $1,129,500. The weighted average interest rate was .65%. The interest expense amounted to $41 under the bank borrowing program. At period end, there were no bank borrowings outstanding.
Annual Report
9. Expense Reductions.
Commissions paid to certain brokers with whom FMR, or its affiliates, places trades on behalf of the Fund include an amount in addition to trade execution, which may be rebated back to the Fund to offset certain expenses. This amount totaled $62,291 for the period.
In addition, FMR reimbursed a portion of the Fund's operating expenses during the period in the amount of $7,144.
10. Distributions to Shareholders.
Distributions to shareholders of each class were as follows:
Years ended October 31, | 2013 | 2012 |
From net investment income | | |
Class A | $ 864,701 | $ 437,422 |
Class T | 89,063 | 12,232 |
Class B | 847 | - |
Class C | 32,277 | - |
Global Commodity Stock | 4,073,304 | 2,878,965 |
Institutional Class | 636,857 | 364,302 |
Total | $ 5,697,049 | $ 3,692,921 |
From net realized gain | | |
Class A | $ - | $ 117,768 |
Class T | - | 19,027 |
Global Commodity Stock | - | 479,827 |
Institutional Class | - | 54,841 |
Total | $ - | $ 671,463 |
11. Share Transactions.
Transactions for each class of shares were as follows:
| Shares | Dollars |
Years ended October 31, | 2013 | 2012 | 2013 | 2012 |
Class A | | | | |
Shares sold | 1,201,755 | 1,675,922 | $ 16,769,552 | $ 24,194,276 |
Reinvestment of distributions | 52,559 | 32,805 | 744,754 | 472,060 |
Shares redeemed | (3,054,897) | (3,329,384) | (42,479,556) | (47,357,051) |
Net increase (decrease) | (1,800,583) | (1,620,657) | $ (24,965,250) | $ (22,690,715) |
Class T | | | | |
Shares sold | 130,604 | 189,622 | $ 1,791,142 | $ 2,764,209 |
Reinvestment of distributions | 5,824 | 1,948 | 82,471 | 28,015 |
Shares redeemed | (396,060) | (424,718) | (5,490,961) | (6,023,857) |
Net increase (decrease) | (259,632) | (233,148) | $ (3,617,348) | $ (3,231,633) |
Annual Report
Notes to Financial Statements - continued
11. Share Transactions - continued
| Shares | Dollars |
Years ended October 31, | 2013 | 2012 | 2013 | 2012 |
Class B | | | | |
Shares sold | 7,047 | 7,831 | $ 98,902 | $ 113,787 |
Reinvestment of distributions | 54 | - | 758 | - |
Shares redeemed | (57,569) | (81,206) | (793,852) | (1,157,702) |
Net increase (decrease) | (50,468) | (73,375) | $ (694,192) | $ (1,043,915) |
Class C | | | | |
Shares sold | 368,295 | 492,632 | $ 5,059,285 | $ 7,143,884 |
Reinvestment of distributions | 1,963 | - | 27,576 | - |
Shares redeemed | (880,659) | (761,541) | (12,048,987) | (10,673,957) |
Net increase (decrease) | (510,401) | (268,909) | $ (6,962,126) | $ (3,530,073) |
Global Commodity Stock | | | | |
Shares sold | 5,296,700 | 7,606,851 | $ 74,369,495 | $ 109,989,271 |
Reinvestment of distributions | 264,635 | 210,059 | 3,760,465 | 3,031,159 |
Shares redeemed | (12,764,042) | (16,330,927) | (177,408,171) | (233,733,610) |
Net increase (decrease) | (7,202,707) | (8,514,017) | $ (99,278,211) | $ (120,713,180) |
Institutional Class | | | | |
Shares sold | 1,153,936 | 1,589,148 | $ 16,235,437 | $ 22,944,496 |
Reinvestment of distributions | 25,953 | 18,526 | 368,529 | 267,335 |
Shares redeemed | (2,405,021) | (2,034,602) | (33,510,048) | (28,631,896) |
Net increase (decrease) | (1,225,132) | (426,928) | $ (16,906,082) | $ (5,420,065) |
12. Other.
The Fund's organizational documents provide former and current trustees and officers with a limited indemnification against liabilities arising in connection with the performance of their duties to the Fund. In the normal course of business, the Fund may also enter into contracts that provide general indemnifications. The Fund's maximum exposure under these arrangements is unknown as this would be dependent on future claims that may be made against the Fund. The risk of material loss from such claims is considered remote.
At the end of the period, FMR or its affiliates were the owners of record of 10% of the total outstanding shares of the Fund.
Annual Report
To the Trustees of Fidelity Investment Trust and the Shareholders of Fidelity Global Commodity Stock Fund:
In our opinion, the accompanying statement of assets and liabilities, including the schedule of investments, and the related statements of operations and of changes in net assets and the financial highlights present fairly, in all material respects, the financial position of Fidelity Global Commodity Stock Fund (a fund of Fidelity Investment Trust) at October 31, 2013, the results of its operations for the year then ended, the changes in its net assets for each of the two years in the period then ended and the financial highlights for each of the periods indicated, in conformity with accounting principles generally accepted in the United States of America. These financial statements and financial highlights (hereafter referred to as "financial statements") are the responsibility of the Fidelity Global Commodity Stock Fund's management. Our responsibility is to express an opinion on these financial statements based on our audits. We conducted our audits of these financial statements in accordance with the standards of the Public Company Accounting Oversight Board (United States). Those standards require that we plan and perform the audit to obtain reasonable assurance about whether the financial statements are free of material misstatement. An audit includes examining, on a test basis, evidence supporting the amounts and disclosures in the financial statements, assessing the accounting principles used and significant estimates made by management, and evaluating the overall financial statement presentation. We believe that our audits, which included confirmation of securities at October 31, 2013 by correspondence with the custodian and brokers, provide a reasonable basis for our opinion.
PricewaterhouseCoopers LLP
Boston, Massachusetts
December 13, 2013
Annual Report
The Trustees, Member of the Advisory Board, and executive officers of the trust and fund, as applicable, are listed below. The Board of Trustees governs the fund and is responsible for protecting the interests of shareholders. The Trustees are experienced executives who meet periodically throughout the year to oversee the fund's activities, review contractual arrangements with companies that provide services to the fund, oversee management of the risks associated with such activities and contractual arrangements, and review the fund's performance. Except for James C. Curvey, Ned C. Lautenbach, Ronald P. O'Hanley, and William S. Stavropoulos, each of the Trustees oversees 171 funds. Mr. Curvey oversees 394 funds. Mr. O'Hanley, Mr. Lautenbach, and Mr. Stavropoulos each oversees 245 funds.
The Trustees hold office without limit in time except that (a) any Trustee may resign; (b) any Trustee may be removed by written instrument, signed by at least two-thirds of the number of Trustees prior to such removal; (c) any Trustee who requests to be retired or who has become incapacitated by illness or injury may be retired by written instrument signed by a majority of the other Trustees; and (d) any Trustee may be removed at any special meeting of shareholders by a two-thirds vote of the outstanding voting securities of the trust. Each Trustee who is not an interested person of the trust and the fund (as defined in the 1940 Act) (Independent Trustee), shall retire not later than the last day of the calendar year in which his or her 75th birthday occurs. The Independent Trustees may waive this mandatory retirement age policy with respect to individual Trustees. The executive officers and Advisory Board Member hold office without limit in time, except that any officer and Advisory Board Member may resign or may be removed by a vote of a majority of the Trustees at any regular meeting or any special meeting of the Trustees. Except as indicated, each individual has held the office shown or other offices in the same company for the past five years.
Experience, Skills, Attributes, and Qualifications of the Fund's Trustees. The Governance and Nominating Committee has adopted a statement of policy that describes the experience, qualifications, attributes, and skills that are necessary and desirable for potential Independent Trustee candidates (Statement of Policy). The Board believes that each Trustee satisfied at the time he or she was initially elected or appointed a Trustee, and continues to satisfy, the standards contemplated by the Statement of Policy. The Governance and Nominating Committee also engages professional search firms to help identify potential Independent Trustee candidates who have the experience, qualifications, attributes, and skills consistent with the Statement of Policy. From time to time, additional criteria based on the composition and skills of the current Independent Trustees, as well as experience or skills that may be appropriate in light of future changes to board composition, business conditions, and regulatory or other developments, have also been considered by the professional search firms and the Governance and Nominating Committee. In addition, the Board takes into account the Trustees' commitment and participation in Board and committee meetings, as well as their leadership of standing and ad hoc committees throughout their tenure.
Annual Report
In determining that a particular Trustee was and continues to be qualified to serve as a Trustee, the Board has considered a variety of criteria, none of which, in isolation, was controlling. The Board believes that, collectively, the Trustees have balanced and diverse experience, qualifications, attributes, and skills, which allow the Board to operate effectively in governing the fund and protecting the interests of shareholders. Information about the specific experience, skills, attributes, and qualifications of each Trustee, which in each case led to the Board's conclusion that the Trustee should serve (or continue to serve) as a trustee of the fund, is provided below.
Board Structure and Oversight Function. James C. Curvey is an interested person (as defined in the 1940 Act) and currently serves as Chairman. The Trustees have determined that an interested Chairman is appropriate and benefits shareholders because an interested Chairman has a personal and professional stake in the quality and continuity of services provided to the fund. Independent Trustees exercise their informed business judgment to appoint an individual of their choosing to serve as Chairman, regardless of whether the Trustee happens to be independent or a member of management. The Independent Trustees have determined that they can act independently and effectively without having an Independent Trustee serve as Chairman and that a key structural component for assuring that they are in a position to do so is for the Independent Trustees to constitute a substantial majority for the Board. The Independent Trustees also regularly meet in executive session. Ned C. Lautenbach serves as Chairman of the Independent Trustees and as such (i) acts as a liaison between the Independent Trustees and management with respect to matters important to the Independent Trustees and (ii) with management prepares agendas for Board meetings.
Fidelity funds are overseen by different Boards of Trustees. The fund's Board oversees Fidelity's equity and high income funds and another Board oversees Fidelity's investment-grade bond, money market, and asset allocation funds. The asset allocation funds may invest in Fidelity funds overseen by the fund's Board. The use of separate Boards, each with its own committee structure, allows the Trustees of each group of Fidelity funds to focus on the unique issues of the funds they oversee, including common research, investment, and operational issues. On occasion, the separate Boards establish joint committees to address issues of overlapping consequences for the Fidelity funds overseen by each Board.
The Trustees operate using a system of committees to facilitate the timely and efficient consideration of all matters of importance to the Trustees, the fund, and fund shareholders and to facilitate compliance with legal and regulatory requirements and oversight of the fund's activities and associated risks. The Board, acting through its committees, has charged FMR and its affiliates with (i) identifying events or circumstances the occurrence of which could have demonstrably adverse effects on the fund's business and/or reputation; (ii) implementing processes and controls to lessen the possibility that such events or circumstances occur or to mitigate the effects of such events or circumstances if they do occur; and (iii) creating and maintaining a system designed to evaluate continuously business and market conditions in order to facilitate the identification and implementation processes described in (i) and (ii) above. Because the day-to-day operations and activities of the fund are carried out by or through FMR, its affiliates and other service providers, the fund's exposure to risks is mitigated but not eliminated by the processes overseen by the Trustees. While each of the Board's committees has responsibility for overseeing different aspects of the fund's activities, oversight is exercised primarily through the Operations, Audit, and Compliance Committees. In addition, the Independent Trustees have worked with FMR to enhance the Board's oversight of investment and financial risks, legal and regulatory risks, technology risks, and operational risks, including the development of additional risk reporting to the Board. For example, a working group comprised of Independent Trustees and FMR has worked and continues to work to review the Fidelity funds' valuation-related activities, reporting and risk management. Appropriate personnel, including but not limited to the fund's Chief Compliance Officer (CCO), FMR's internal auditor, the independent accountants, the fund's Treasurer and portfolio management personnel, make periodic reports to the Board's committees, as appropriate, including an annual review of FMR's risk management program for the Fidelity funds. The responsibilities of each standing committee, including their oversight responsibilities, are described further under "Standing Committees of the Fund's Trustees."
Annual Report
Trustees and Officers - continued
The fund's Statement of Additional Information (SAI) includes more information about the Trustees. To request a free copy, call Fidelity at 1-877-208-0098.
Interested Trustees*:
Correspondence intended for each Trustee who is an interested person may be sent to Fidelity Investments, 245 Summer Street, Boston, Massachusetts 02210.
Name, Year of Birth; Principal Occupations and Other Relevant Experience+ |
James C. Curvey (1935) |
Year of Election or Appointment: 2007 Trustee Chairman of the Board of Trustees |
| Mr. Curvey also serves as Trustee of other Fidelity funds. Mr. Curvey is a Director of Fidelity Investments Money Management, Inc. (2009-present), Director of Fidelity Research & Analysis Co. (2009-present) and Director of FMR and FMR Co., Inc. (2007-present). Mr. Curvey is also Vice Chairman (2007-present) and Director of FMR LLC. In addition, Mr. Curvey serves as an Overseer for the Boston Symphony Orchestra and a member of the Trustees of Villanova University. Previously, Mr. Curvey was the Vice Chairman (2006-2007) and Director (2000-2007) of FMR Corp. |
Ronald P. O'Hanley (1957) |
Year of Election or Appointment: 2011 Trustee |
| Mr. O'Hanley also serves as Trustee of other Fidelity funds. He is Director of Fidelity SelectCo, LLC (2013-present), FMR Co., Inc. (2010-present), Director of Fidelity Investments Money Management, Inc. (2010-present), Director of Fidelity Research & Analysis Company (2010-present), President of Fidelity Asset Management and Corporate Services and a Member of Fidelity's Executive Committee (2010-present). Previously, Mr. O'Hanley served as President and Chief Executive Officer of BNY Mellon Asset Management (2007-2010). Mr. O'Hanley also served as Vice Chairman of Bank New York Mellon Corp. and a member of that firm's Executive Committee. Prior to the 2007 merger of The Bank of New York and Mellon Financial Corporation, he was Vice Chairman of Mellon Financial Corporation and President and Chief Executive Officer of Mellon Asset Management. He joined Mellon in February 1997. Mr. O'Hanley currently serves as Chairman of the Boston Public Library Foundation Board of Directors and sits on the Board of Directors of Beth Israel Deaconess Medical Center, the Board of Trustees of the Marine Biological Laboratory and the Advisory Board of the Maxwell School of Citizenship and Public Administration at Syracuse University. Mr. O'Hanley also chairs the Council on Asset Management for the Financial Services Roundtable and is a member of the Board of Directors of Institutional Investor's U.S. Institute. |
* Trustees have been determined to be "Interested Trustees" by virtue of, among other things, their affiliation with the trust or various entities under common control with FMR.
+ The information above includes each Trustee's principal occupation during the last five years and other information relating to the experience, attributes, and skills relevant to each Trustee's qualifications to serve as a Trustee, which led to the conclusion that each Trustee should serve as a Trustee for the fund.
Annual Report
Trustees and Officers - continued
Independent Trustees:
Correspondence intended for each Independent Trustee (that is, the Trustees other than the Interested Trustees) may be sent to Fidelity Investments, P.O. Box 55235, Boston, Massachusetts 02205-5235.
Name, Year of Birth; Principal Occupations and Other Relevant Experience+ |
Dennis J. Dirks (1948) |
Year of Election or Appointment: 2005 Trustee |
| Mr. Dirks also serves as Trustee of other Fidelity funds. Prior to his retirement in May 2003, Mr. Dirks was Chief Operating Officer and a member of the Board of The Depository Trust & Clearing Corporation (DTCC). He also served as President, Chief Operating Officer, and Board member of The Depository Trust Company (DTC) and President and Board member of the National Securities Clearing Corporation (NSCC). In addition, Mr. Dirks served as Chief Executive Officer and Board member of the Government Securities Clearing Corporation, Chief Executive Officer and Board member of the Mortgage-Backed Securities Clearing Corporation, as a Trustee and a member of the Finance Committee of Manhattan College (2005-2008), and as a Trustee and a member of the Finance Committee of AHRC of Nassau County (2006-2008). Mr. Dirks is a member of the Independent Directors Council (IDC) Governing Council (2010-present) and Board of Directors for The Brookville Center for Children's Services, Inc. (2009-present). |
Alan J. Lacy (1953) |
Year of Election or Appointment: 2008 Trustee |
| Mr. Lacy also serves as Trustee of other Fidelity funds. Mr. Lacy serves as Senior Adviser (2007-present) of Oak Hill Capital Partners, L.P. (private equity). Mr. Lacy also served as Chief Executive Officer (2000-2005) and Vice Chairman (2005-2006) of Sears Holdings Corporation and Sears, Roebuck and Co. (retail). In addition, Mr. Lacy serves as a member of the Board of Directors of Dave & Buster's Entertainment, Inc. (restaurant and entertainment complexes, 2010-present), Earth Fare, Inc. (retail grocery, 2012-present), The Hillman Companies, Inc. (hardware wholesalers, 2010-present), and Bristol-Myers Squibb Company (global pharmaceuticals, 2008-present). Mr. Lacy is a member of the Board of Trustees of The National Parks Conservation Association (2006-present). Previously, Mr. Lacy served as Chairman of the Board of Trustees of the National Parks Conservation Association (2008-2011) and as a member of the Board of Directors for the Western Union Company (global money transfer, 2006-2011). |
Ned C. Lautenbach (1944) |
Year of Election or Appointment: 2000 Trustee Chairman of the Independent Trustees |
| Mr. Lautenbach also serves as Trustee of other Fidelity funds. Mr. Lautenbach currently serves as the Lead Director of the Eaton Corporation Board of Directors (diversified industrial, 1997-present). Mr. Lautenbach is Chairman of the Board of Directors of the Philharmonic Center for the Arts in Naples, Florida (2012-present) and a member of the Council on Foreign Relations (1994-present). Previously, Mr. Lautenbach was a Partner/Advisory Partner at Clayton, Dubilier & Rice, LLC (private equity investment, 1998-2010), as well as a Director of Sony Corporation (2006-2007). |
Joseph Mauriello (1944) |
Year of Election or Appointment: 2008 Trustee |
| Mr. Mauriello also serves as Trustee of other Fidelity funds. Prior to his retirement in January 2006, Mr. Mauriello served in numerous senior management positions including Deputy Chairman and Chief Operating Officer (2004-2005), and Vice Chairman of Financial Services (2002-2004) of KPMG LLP US (professional services, 1965-2005). Mr. Mauriello currently serves as a member of the Board of Directors of XL Group plc. (global insurance and re-insurance, 2006-present). Previously, Mr. Mauriello served as a Director of the Hamilton Funds of the Bank of New York (2006-2007) and of Arcadia Resources Inc. (health care services and products, 2007-2012). |
Robert W. Selander (1950) |
Year of Election or Appointment: 2011 Trustee |
| Mr. Selander also serves as Trustee of other Fidelity funds. Previously, Mr. Selander served as a Member of the Advisory Board of other Fidelity funds (2011), and Executive Vice Chairman (2010), Chief Executive Officer (2009-2010), and President and Chief Executive Officer (1997-2009) of Mastercard, Inc. |
Cornelia M. Small (1944) |
Year of Election or Appointment: 2005 Trustee |
| Ms. Small also serves as Trustee of other Fidelity funds. Ms. Small is a member of the Board of Directors (2009-present) and Chair of the Investment Committee (2010-present) of the Teagle Foundation. Ms. Small also serves on the Investment Committee of the Berkshire Taconic Community Foundation (2008-present). Previously, Ms. Small served as Chairperson (2002-2008) and a member of the Investment Committee and Chairperson (2008-2012) and a member of the Board of Trustees of Smith College. In addition, Ms. Small served as Chief Investment Officer, Director of Global Equity Investments, and a member of the Board of Directors of Scudder, Stevens & Clark and Scudder Kemper Investments. |
William S. Stavropoulos (1939) |
Year of Election or Appointment: 2001 Trustee Vice Chairman of the Independent Trustees |
| Mr. Stavropoulos also serves as Trustee of other Fidelity funds. Mr. Stavropoulos serves as President and Founder of the Michigan Baseball Foundation, the Great Lakes Loons (2007-present). Mr. Stavropoulos is Chairman Emeritus of the Board of Directors of The Dow Chemical Company, where he previously served in numerous senior management positions, including President, CEO (1995-2000; 2002-2004), Chairman of the Executive Committee (2000-2006), and as a member of the Board of Directors (1990-2006). Currently, Mr. Stavropoulos is Chairman of the Board of Directors of Univar Inc. (global distributor of commodity and specialty chemicals), a Director of Teradata Corporation (data warehousing and technology solutions), and Maersk Inc. (industrial conglomerate), and a member of the Advisory Board for Metalmark Capital LLC (private equity investment, 2005-present). Mr. Stavropoulos is an operating advisor to Clayton, Dubilier & Rice, LLC (private equity investment). In addition, Mr. Stavropoulos is a member of the University of Notre Dame Advisory Council for the College of Science, a Trustee of the Rollin L. Gerstacker Foundation, and a Director of the Naples Philharmonic Center for the Arts. Previously, Mr. Stavropoulos served as a Director of Chemical Financial Corporation (bank holding company, 1993-2012) and Tyco International, Ltd. (multinational manufacturing and services, 2007-2012). |
David M. Thomas (1949) |
Year of Election or Appointment: 2008 Trustee |
| Mr. Thomas also serves as Trustee of other Fidelity funds. Mr. Thomas serves as Non-Executive Chairman of the Board of Directors of Fortune Brands Home and Security (home and security products, 2011-present), and as a member of the Board of Directors of Interpublic Group of Companies, Inc. (marketing communication, 2004-present). Previously, Mr. Thomas served as Executive Chairman (2005-2006) and Chairman and Chief Executive Officer (2000-2005) of IMS Health, Inc. (pharmaceutical and healthcare information solutions), and a Director of Fortune Brands, Inc. (consumer products, 2000-2011). |
+ The information above includes each Trustee's principal occupation during the last five years and other information relating to the experience, attributes, and skills relevant to each Trustee's qualifications to serve as a Trustee, which led to the conclusion that each Trustee should serve as a Trustee for the fund.
Advisory Board Member and Executive Officers:
Correspondence intended for each executive officer and Peter S. Lynch may be sent to Fidelity Investments, 245 Summer Street, Boston, Massachusetts 02210. Executive officers appear below in alphabetical order.
Name, Year of Birth; Principal Occupation |
Peter S. Lynch (1944) |
Year of Election or Appointment: 2003 Member of the Advisory Board |
| Mr. Lynch also serves as Member of the Advisory Board of other Fidelity funds. Mr. Lynch is Vice Chairman and a Director of FMR and FMR Co., Inc. In addition, Mr. Lynch serves as a Trustee of Boston College and as the Chairman of the Inner-City Scholarship Fund. Previously, Mr. Lynch served on the Special Olympics International Board of Directors (1997-2006). |
Elizabeth Paige Baumann (1968) |
Year of Election or Appointment: 2012 Anti-Money Laundering (AML) Officer |
| Ms. Baumann also serves as AML Officer of other funds. She is Chief AML Officer of FMR LLC (2012-present) and is an employee of Fidelity Investments. Previously, Ms. Baumann served as Vice President and Deputy Anti-Money Laundering Officer (2007-2012). |
William C. Coffey (1969) |
Year of Election or Appointment: 2009 Assistant Secretary |
| Mr. Coffey also serves as Assistant Secretary of other funds. He is Senior Vice President and Deputy General Counsel of FMR LLC (2010-present), and is an employee of Fidelity Investments. Previously, Mr. Coffey served as Vice President and Associate General Counsel of FMR LLC (2005-2009). |
Jonathan Davis (1968) |
Year of Election or Appointment: 2010 Assistant Treasurer |
| Mr. Davis also serves as Assistant Treasurer of other funds. Mr. Davis is an employee of Fidelity Investments. Previously, Mr. Davis served as Vice President and Associate General Counsel of FMR LLC (2003-2010). |
Adrien E. Deberghes (1967) |
Year of Election or Appointment: 2008 Deputy Treasurer |
| Mr. Deberghes also serves as an officer of other funds. He is an employee of Fidelity Investments (2008-present). Prior to joining Fidelity Investments, Mr. Deberghes was Senior Vice President of Mutual Fund Administration at State Street Corporation (2007-2008), Senior Director of Mutual Fund Administration at Investors Bank & Trust (2005-2007), and Director of Finance for Dunkin' Brands (2000-2005). |
Stephanie J. Dorsey (1969) |
Year of Election or Appointment: 2010 Assistant Treasurer |
| Ms. Dorsey also serves as an officer of other funds. She is an employee of Fidelity Investments (2008-present) and has served in other fund officer roles. Prior to joining Fidelity Investments, Ms. Dorsey served as Treasurer (2004-2008) of the JPMorgan Mutual Funds and Vice President (2004-2008) of JPMorgan Chase Bank. |
Scott C. Goebel (1968) |
Year of Election or Appointment: 2008 Secretary and Chief Legal Officer (CLO) |
| Mr. Goebel serves as Secretary and CLO of other funds. Mr. Goebel also serves as Secretary of Fidelity Investments Money Management, Inc. (FIMM) (2010-present) and Fidelity Research and Analysis Company (FRAC) (2010-present); General Counsel, Secretary, and Senior Vice President of FMR (2008-present) and FMR Co., Inc. (2008-present); Chief Legal Officer of Fidelity Management & Research (Hong Kong) Limited (2008-present) and Assistant Secretary of Fidelity Management & Research (Japan) Inc. (2008-present), and Fidelity Management & Research (U.K.) Inc. (2008-present). Previously, Mr. Goebel served as Secretary and CLO of other Fidelity funds (2008-2013), Assistant Secretary of FIMM (2008-2010), FRAC (2008-2010), and certain funds (2007-2008); and as Vice President and Secretary of Fidelity Distributors Corporation (FDC) (2005-2007). Mr. Goebel has been employed by FMR LLC or an affiliate since 2001. |
Joseph A. Hanlon (1968) |
Year of Election or Appointment: 2012 Chief Compliance Officer |
| Mr. Hanlon also serves as Chief Compliance Officer of other funds. Mr. Hanlon serves as Compliance Officer of FMR, FMR Co., Inc., Fidelity Investments Money Management, Inc. (FIMM), Fidelity Research and Analysis Company (FRAC), and Fidelity Management & Research (Hong Kong) (2009-present), as Senior Vice President of the Fidelity Asset Management Division (2009-present), and is an employee of Fidelity Investments. Previously, Mr. Hanlon served as Compliance Officer of Fidelity Management & Research (Japan) Inc. (2009-2013), Strategic Advisers, Inc. (2009-2013), and Fidelity Management & Research (U.K.) Inc. (2009-2013). |
Bruce T. Herring (1965) |
Year of Election or Appointment: 2006 Vice President of certain Equity Funds |
| Mr. Herring also serves as Vice President of other funds. He serves as Chief Investment Officer of Fidelity Global Asset Allocation (GAA) (2013-present), Chief Investment Officer and Director of Fidelity Management & Research (U.K.) Inc. (2010-present), Group Chief Investment Officer of FMR, and President of Fidelity Research & Analysis Company (2010-present). Previously, Mr. Herring served as Vice President (2005-2006) and Senior Vice President (2006-2007) of Fidelity Management & Research Company, Vice President of FMR Co., Inc. (2001-2007), and as a portfolio manager for Fidelity U.S. Equity Funds. |
Brian B. Hogan (1964) |
Year of Election or Appointment: 2009 Vice President |
| Mr. Hogan also serves as Vice President of other funds. Mr. Hogan serves as President of FMR's Equity Division (2009-present). Previously, Mr. Hogan served as Senior Vice President, Equity Research of FMR (2006-2009) and as a portfolio manager. |
Chris Maher (1972) |
Year of Election or Appointment: 2013 Assistant Treasurer |
| Mr. Maher serves as Assistant Treasurer of other funds. Mr. Maher is Vice President of Valuation Oversight and is an employee of Fidelity Investments. Previously, Mr. Maher served as Vice President of Asset Management Compliance (2013), Vice President of FMR's Program Management Group (2010-2013), and Vice President of Valuation Oversight (2008-2010). |
Christine Reynolds (1958) |
Year of Election or Appointment: 2008 Chief Financial Officer |
| Ms. Reynolds also serves as Chief Financial Officer of other funds. Ms. Reynolds became President of Fidelity Pricing and Cash Management Services (FPCMS) in August 2008. Ms. Reynolds served as Chief Operating Officer of FPCMS (2007-2008). Previously, Ms. Reynolds served as President, Treasurer, and Anti-Money Laundering officer of the Fidelity funds (2004-2007). |
Kenneth B. Robins (1969) |
Year of Election or Appointment: 2008 President and Treasurer |
| Mr. Robins also serves as an officer of other funds. Mr. Robins serves as Executive Vice President of Fidelity Investments Money Management, Inc. (FIMM) (2013-present) and is an employee of Fidelity Investments (2004-present). Previously, Mr. Robins served in other fund officer roles. |
Gary W. Ryan (1958) |
Year of Election or Appointment: 2005 Assistant Treasurer |
| Mr. Ryan also serves as Assistant Treasurer of other funds. Mr. Ryan is an employee of Fidelity Investments and has served in other fund officer roles. Previously, Mr. Ryan served as Vice President of Fund Reporting in Fidelity Pricing and Cash Management Services (FPCMS) (1999-2005). |
Stephen Sadoski (1971) |
Year of Election or Appointment: 2012 Deputy Treasurer |
| Mr. Sadoski also serves as Deputy Treasurer of other funds. He is an employee of Fidelity Investments (2012-present) and has served in another fund officer role. Prior to joining Fidelity Investments, Mr. Sadoski served as an assistant chief accountant in the Division of Investment Management of the Securities and Exchange Commission (SEC) (2009-2012) and as a senior manager at Deloitte & Touche LLP (1997-2009). |
Stacie M. Smith (1974) |
Year of Election or Appointment: 2013 Deputy Treasurer |
| Ms. Smith also serves as an officer of other funds. She is an employee of Fidelity Investments (2009-present) and has served in other fund officer roles. Prior to joining Fidelity Investments, Ms. Smith served as Senior Audit Manager of Ernst & Young LLP (1996-2009). |
Renee Stagnone (1975) |
Year of Election or Appointment: 2013 Deputy Treasurer |
| Ms. Stagnone also serves as Deputy Treasurer of other funds. Ms. Stagnone is an employee of Fidelity Investments. |
Joseph F. Zambello (1957) |
Year of Election or Appointment: 2011 Deputy Treasurer |
| Mr. Zambello also serves as Deputy Treasurer of other funds. Mr. Zambello is an employee of Fidelity Investments. Previously, Mr. Zambello served as Vice President of FMR's Program Management Group (2009-2011) and Vice President of the Transfer Agent Oversight Group (2005-2009). |
Annual Report
The Board of Trustees of Fidelity Global Commodity Stock Fund voted to pay to shareholders of record at the opening of business on record date, the following distributions per share derived from capital gains realized from sales of portfolio securities, and dividends derived from net investment income:
| Pay Date | Record Date | Dividends | Capital Gains |
Institutional Class | 12/09/13 | 12/06/13 | $0.188 | $0.013 |
Institutional Class designates 53% of the dividend distributed during the fiscal year as qualifying for the dividends-received deduction for corporate shareholders.
Institutional Class designates 100% of the dividend distributed during the fiscal year as amounts which may be taken into account as a dividend for the purposes of the maximum rate under section 1(h)(11) of the Internal Revenue Code.
The amounts per share which represent income derived from sources within, and taxes paid to, foreign countries or possessions of the United States are as follows:
| Pay Date | Income | Taxes |
Institutional Class | 12/10/12 | $0.187 | $0.0105 |
The fund will notify shareholders in January 2014 of amounts for use in preparing 2013 income tax returns.
Annual Report
Board Approval of Investment Advisory Contracts and Management Fees
Fidelity Global Commodity Stock Fund
Each year, the Board of Trustees, including the Independent Trustees (together, the Board), votes on the renewal of the management contract and sub-advisory agreements (together, the Advisory Contracts) for the fund. The Board, assisted by the advice of fund counsel and Independent Trustees' counsel, requests and considers a broad range of information relevant to the renewal of the Advisory Contracts throughout the year.
The Board meets regularly and, at each of its meetings, covers an extensive agenda of topics and materials and considers factors that are relevant to its annual consideration of the renewal of the fund's Advisory Contracts, including the services and support provided to the fund and its shareholders. The Board has established various standing committees, each composed of and chaired by Independent Trustees with varying backgrounds, to which the Board has assigned specific subject matter responsibilities in order to enhance effective decision-making by the Board. The Board, acting directly and through its Committees, requests and receives information concerning the annual consideration of the renewal of the fund's Advisory Contracts. The Board also meets as needed to consider matters specifically related to the Board's annual consideration of the renewal of Advisory Contracts. Members of the Board may also meet with trustees of other Fidelity funds through ad hoc joint committees to discuss certain matters relevant to the Fidelity funds.
At its July 2013 meeting, the Board, including the Independent Trustees, unanimously determined to renew the fund's Advisory Contracts. In reaching its determination, the Board considered all factors it believed relevant, including (i) the nature, extent, and quality of the services to be provided to the fund and its shareholders (including the investment performance of the fund); (ii) the competitiveness of the fund's management fee and total expense ratio relative to peer funds; (iii) the total costs of the services to be provided by and the profits to be realized by Fidelity from its relationship with the fund; (iv) the extent to which economies of scale exist and would be realized as the fund grows; and (v) whether fee levels reflect these economies of scale, if any, for the benefit of fund shareholders.
In considering whether to renew the Advisory Contracts for the fund, the Board reached a determination, with the assistance of fund counsel and Independent Trustees' counsel and through the exercise of its business judgment, that the renewal of the Advisory Contracts was in the best interests of the fund and its shareholders and that the compensation payable under the Advisory Contracts was fair and reasonable. The Board's decision to renew the Advisory Contracts was not based on any single factor, but rather was based on a comprehensive consideration of all the information provided to the Board at its meetings throughout the year. The Board, in reaching its determination to renew the Advisory Contracts, was aware that shareholders in the fund have a broad range of investment choices available to them, including a wide choice among mutual funds offered by Fidelity's competitors, and that the fund's shareholders, who have the opportunity to review and weigh the disclosure provided by the fund in its prospectus and other public disclosures, have chosen to invest in this fund, which is a part of the Fidelity family of funds.
Annual Report
Board Approval of Investment Advisory Contracts and
Management Fees - continued
Nature, Extent, and Quality of Services Provided. The Board considered the staffing within the investment adviser, Fidelity Management & Research Company (FMR), and the sub-advisers (together, the Investment Advisers) as it relates to the fund, including the backgrounds of the fund's investment personnel, and also considered the fund's investment objective, strategies, and related investment philosophy. The Independent Trustees also had discussions with senior management of Fidelity's investment operations and investment groups. The Board considered the structure of the portfolio manager compensation program and whether this structure provides appropriate incentives to act in the best interests of the fund.
Resources Dedicated to Investment Management and Support Services. The Board and the Fund Oversight and Research Committees reviewed the general qualifications and capabilities of the Investment Advisers' investment staff, including its size, education, experience, and resources, as well as the Investment Advisers' approach to recruiting, training, managing, and compensating investment personnel. The Board noted that FMR has continued to increase the resources devoted to non-U.S. offices, including expansion of Fidelity's global investment organization. The Board also noted that Fidelity's analysts have extensive resources, tools and capabilities that allow them to conduct sophisticated quantitative and fundamental analysis, as well as credit analysis of issuers, counterparties and guarantors. Further, the Board believes that Fidelity's investment professionals have sufficient access to global information and data so as to provide competitive investment results over time, and that those professionals also have access to sophisticated tools that permit them to assess portfolio construction and risk and performance attribution characteristics continuously, as well as to transmit new information and research conclusions rapidly around the world. Additionally, in its deliberations, the Board considered the Investment Advisers' trading and risk management capabilities and resources, which are an integral part of the investment management process.
Shareholder and Administrative Services. The Board considered (i) the nature, extent, quality, and cost of advisory, administrative, and shareholder services performed by the Investment Advisers and their affiliates under the Advisory Contracts and under separate agreements covering transfer agency, pricing and bookkeeping, and securities lending services for the fund; (ii) the nature and extent of the supervision of third party service providers, principally custodians and subcustodians; and (iii) the resources devoted to, and the record of compliance with, the fund's compliance policies and procedures. The Board also reviewed the allocation of fund brokerage, including allocations to brokers affiliated with the Investment Advisers, the use of brokerage commissions to pay fund expenses, and the use of "soft" commission dollars to pay for research services.
Annual Report
The Board noted that the growth of fund assets over time across the complex allows Fidelity to reinvest in the development of services designed to enhance the value or convenience of the Fidelity funds as investment vehicles. These services include 24-hour access to account information and market information through telephone representatives and over the Internet, investor education materials and asset allocation tools, and the expanded availability of Fidelity Investor Centers.
Investment in a Large Fund Family. The Board considered the benefits to shareholders of investing in a Fidelity fund, including the benefits of investing in a fund that is part of a large family of funds offering a variety of investment disciplines and providing a large variety of mutual fund investor services. The Board noted that Fidelity had taken, or had made recommendations that resulted in the Fidelity funds taking, a number of actions over the previous year that benefited particular funds, including (i) continuing to dedicate additional resources to investment research and to the support of the senior management team that oversees asset management; (ii) persisting in efforts to enhance Fidelity's global research capabilities; (iii) launching new funds and making other enhancements to meet client needs for global and income-oriented solutions; (iv) continuing to launch dedicated lower cost underlying funds to meet portfolio construction needs related to expanding underlying fund options for Fidelity funds of funds, specifically for the Freedom Fund product lines; (v) rationalizing product lines and gaining increased efficiencies through the mergers of several funds into other funds; (vi) strengthening Fidelity's index fund offerings by reducing investment minimums and adopting or lowering existing expense caps for certain funds and classes; (vii) enhancing Global Asset Allocation product offerings by launching new funds and strategies, including "open architecture" target date funds that utilize affiliated and unaffiliated sub-advisers; (viii) modifying the eligibility criteria for Institutional Class shares of Advisor funds to increase their marketability to a portion of the defined contribution plan market; (ix) creating a new low-cost retirement share class for certain Advisor funds to appeal to large retirement plans; (x) transitioning the management of certain Fidelity commodity funds to Geode Capital Management LLC, a registered commodity pool operator, while retaining administrative responsibilities for the funds; (xi) reorganizing a number of funds; and (xii) taking steps toward establishing a new Fidelity adviser to manage sector-based funds and products.
Investment Performance. The Board considered whether the fund has operated in accordance with its investment objective, as well as its record of compliance with its investment restrictions and its performance history.
The Board took into account discussions with the Investment Advisers about fund investment performance that occur at Board meetings throughout the year. In this regard the Board noted that as part of regularly scheduled fund reviews and other reports to the Board on fund performance, the Board periodically considers annualized return information for the fund, for different time periods, measured against a securities market index ("benchmark index") and a peer group of mutual funds with similar objectives ("peer group"). In its evaluation of fund investment performance, the Board gave particular attention to information indicating changes in performance of certain Fidelity funds for specific time periods and the Investment Advisers' explanations for any overperformance or underperformance.
Annual Report
Board Approval of Investment Advisory Contracts and
Management Fees - continued
In addition to reviewing absolute and relative fund performance, the Independent Trustees periodically consider the appropriateness of fund performance metrics in evaluating the results achieved. In general, the Independent Trustees believe that fund performance should be evaluated based on net performance (after fees and expenses) of both the highest performing and lowest performing classes, where applicable, compared to appropriate benchmark indices, over appropriate time periods which may include full market cycles, and compared to peer groups, as applicable, over the same periods, taking into account relevant factors including the following: general market conditions; issuer-specific information; tactical opportunities for investment; and fund cash flows and other factors.
The Independent Trustees recognize that shareholders evaluate performance on a net basis over their own holding periods, for which one-, three-, and five-year periods are used as a proxy. For this reason, the performance information reviewed by the Board also included net cumulative calendar year total return information for the fund and an appropriate benchmark index for the most recent one- and three-year periods, as shown below. A peer group comparison is not shown below.
Annual Report
Fidelity Global Commodity Stock Fund

Based on its review, the Board concluded that the nature, extent, and quality of services provided to the fund under the Advisory Contracts should benefit the fund's shareholders.
Competitiveness of Management Fee and Total Expense Ratio. The Board considered the fund's management fee and total expense ratio compared to "mapped groups" of competitive funds and classes. Fidelity creates "mapped groups" by combining similar Lipper investment objective categories that have comparable management fee characteristics. Combining Lipper investment objective categories aids the Board's management fee and total expense ratio comparisons by broadening the competitive group used for comparison and by reducing the number of universes to which various Fidelity funds are compared.
Management Fee. The Board considered two proprietary management fee comparisons for the 12-month (or shorter) periods shown in the chart below. The group of Lipper funds used by the Board for management fee comparisons is referred to below as the "Total Mapped Group." The Total Mapped Group comparison focuses on a fund's standing in terms of gross management fees before expense reimbursements or caps relative to the total universe of funds with comparable investment mandates, regardless of whether their management fee structures also are comparable. Funds with comparable investment mandates offer exposure to similar types of securities. Funds with comparable management fee structures have similar management fee contractual arrangements (e.g., flat rate charged for advisory services, all-inclusive fee rate, etc.). "TMG %" represents the percentage of funds in the Total Mapped Group that had management fees that were lower than the fund's. For example, a TMG % of 31% means that 69% of the funds in the Total Mapped Group had higher management fees than the fund. The "Asset-Size Peer Group" (ASPG) comparison focuses on a fund's standing relative to a subset of non-Fidelity funds within the Total Mapped Group that are similar in size and management fee structure. The ASPG represents at least 15% of the funds in the Total Mapped Group with comparable asset size and management fee structures, subject to a minimum of 50 funds (or all funds in the Total Mapped Group if fewer than 50). Additional information, such as the ASPG quartile in which the fund's management fee ranked, is also included in the chart and considered by the Board.
Annual Report
Board Approval of Investment Advisory Contracts and
Management Fees - continued
Fidelity Global Commodity Stock Fund

The Board noted that the fund's management fee ranked below the median of its Total Mapped Group and below the median of its ASPG for 2012.
Based on its review, the Board concluded that the fund's management fee is fair and reasonable in light of the services that the fund receives and the other factors considered.
Total Expense Ratio. In its review of each class's total expense ratio, the Board considered the fund's management fee as well as other fund or class expenses, as applicable, such as transfer agent fees, pricing and bookkeeping fees, fund-paid 12b-1 fees, and custodial, legal, and audit fees. The Board also noted the effects of any waivers and reimbursements on fees and expenses. As part of its review, the Board also considered the current and historical total expense ratios of each class of the fund compared to competitive fund median expenses. Each class of the fund is compared to those funds and classes in the Total Mapped Group (used by the Board for management fee comparisons) that have a similar sales load structure.
Annual Report
The Board noted that the total expense ratio of each of Class A, Class C, Institutional Class, and the retail class ranked below its competitive median for 2012, the total expense ratio of Class B ranked equal to its competitive median for 2012, and the total expense ratio of Class T ranked above its competitive median for 2012. The Board considered that, in general, various factors can affect total expense ratios. The Board noted that the total expense ratio of Class T was above the competitive median primarily because of higher 12b-1 fees on Class T. Class T has a higher 12b-1 fee, but a lower front-end sales charge, than traditionally priced front-end sales charge classes. The Board considered that Class T is primarily sold load-waived in the retirement plan market where its 0.50% 12b-1 fee is comparable to competing no-load, higher 12b-1 fee classes designed specifically for retirement plans. The Board noted that the fund offers multiple classes, each of which has a different sales load and 12b-1 fee structure, and that the multiple structures are intended to offer a range of pricing options for the intermediary market. The Board also noted that the total expense ratios of the classes vary primarily by the level of their 12b-1 fees, although differences in transfer agent fees may also cause expenses to vary from class to class.
Fees Charged to Other Fidelity Clients. The Board also considered Fidelity fee structures and other information with respect to clients of FMR and its affiliates, such as other mutual funds advised or subadvised by FMR or its affiliates, pension plan clients, and other institutional clients. The Board noted the findings of the 2013 ad hoc joint committee (created with the board of other Fidelity funds), which reviewed and compared Fidelity's institutional investment advisory business with its business of providing services to the Fidelity funds, including the differences in services provided, fees charged, and costs incurred, as well as competition in their respective marketplaces.
Based on its review of total expense ratios and fees charged to other Fidelity clients, the Board concluded that the total expense ratio of each class of the fund was reasonable, although Class T was above the median of the universe presented for comparison, in light of the services that the fund and its shareholders receive and the other factors considered.
Costs of the Services and Profitability. The Board considered the revenues earned and the expenses incurred by Fidelity in conducting the business of developing, marketing, distributing, managing, administering and servicing the fund and servicing the fund's shareholders. The Board also considered the level of Fidelity's profits in respect of all the Fidelity funds.
On an annual basis, FMR presents to the Board Fidelity's profitability for the fund. Fidelity calculates the profitability for each fund, as well as aggregate profitability for groups of Fidelity funds and all Fidelity funds, using a series of detailed revenue and cost allocation methodologies which originate with the books and records of Fidelity on which Fidelity's audited financial statements are based. The Audit Committee of the Board reviews any significant changes from the prior year's methodologies.
Annual Report
Board Approval of Investment Advisory Contracts and
Management Fees - continued
PricewaterhouseCoopers LLP (PwC), independent registered public accounting firm and auditor to Fidelity and certain Fidelity funds, has been engaged annually by the Board as part of the Board's assessment of Fidelity's profitability analysis. PwC's engagement includes the review and assessment of the methodologies used by Fidelity in determining the revenues and expenses attributable to Fidelity's mutual fund business, and completion of agreed-upon procedures surrounding the mathematical accuracy of fund profitability and its conformity to allocation methodologies. After considering PwC's reports issued under the engagement and information provided by Fidelity, the Board concluded that while other allocation methods may also be reasonable, Fidelity's profitability methodologies are reasonable in all material respects.
The Board also reviewed Fidelity's non-fund businesses and fall-out benefits related to the mutual fund business as well as cases where Fidelity's affiliates may benefit from or be related to the fund's business.
The Board considered the costs of the services provided by and the profits realized by Fidelity in connection with the operation of the fund and was satisfied that the profitability was not excessive in the circumstances.
Economies of Scale. The Board considered whether there have been economies of scale in respect of the management of the Fidelity funds, whether the Fidelity funds (including the fund) have appropriately benefited from any such economies of scale, and whether there is potential for realization of any further economies of scale. The Board considered the extent to which the fund will benefit from economies of scale through increased services to the fund, through waivers or reimbursements, or through fee or expense reductions. The Board also noted that in 2009, it and the board of other Fidelity funds created an ad hoc committee (the Economies of Scale Committee) to analyze whether FMR attains economies of scale in respect of the management and servicing of the Fidelity funds, whether the Fidelity funds have appropriately benefited from such economies of scale, and whether there is potential for realization of any further economies of scale.
The Board recognized that the fund's management contract incorporates a "group fee" structure, which provides for lower group fee rates as total fund assets under FMR's management increase, and for higher group fee rates as total fund assets under FMR's management decrease. FMR calculates the group fee rates based on a tiered asset "breakpoint" schedule that varies based on asset class. The Board considered that the group fee is designed to deliver the benefits of economies of scale to fund shareholders when total Fidelity fund assets increase, even if assets of any particular fund are unchanged or have declined, because some portion of Fidelity's costs are attributable to services provided to all Fidelity funds, and all funds benefit if those costs can be allocated among more assets. The Board concluded that, given the group fee structure, fund shareholders will benefit from lower management fees as assets under FMR's management increase at the fund complex level, regardless of whether Fidelity achieves any such economies of scale.
Annual Report
The Board concluded, taking into account the analysis of the Economies of Scale Committee, that economies of scale, if any, are being appropriately shared between fund shareholders and Fidelity.
Amendment to Description of Group Fee Rate. At its July 2013 meeting, the Board voted to approve an amendment to the fund's management contract to modify the description of the "group fee rate" effective August 1, 2013. The Board noted that under the prior description in the contract, the group fee rate was based on the average net assets of all registered investment companies with which FMR has management contracts. Under the contract's tiered asset breakpoint schedule, the group fee rate is lower as total fund assets under FMR's management increase, and higher as total fund assets under FMR's management decrease. The Board considered that the prior description would have excluded the assets of 64 Fidelity sector funds from the group fee rate calculation once Fidelity SelectCo, LLC, an affiliate of FMR, assumed management responsibilities for those funds. The Board noted that modifying the description of the group fee rate to continue to include the assets of those 64 funds for purposes of determining group fee rate breakpoints would avoid an immediate adverse impact on the group fee rate for any fund.
Additional Information Requested by the Board. In order to develop fully the factual basis for consideration of the Fidelity funds' Advisory Contracts, the Board requested and received additional information on certain topics, including: (i) fund performance trends and Fidelity's long-term strategies for certain funds; (ii) the potential to further rationalize the Fidelity fund lineup with the possibility of achieving savings for the funds and Fidelity; (iii) the methodology with respect to competitive fund data and peer group classifications; (iv) the arrangements with, and performance of, certain sub-advisers on behalf of the Fidelity funds, as well as certain proposed participating affiliate arrangements; (v) the realization of fall-out benefits in certain Fidelity business units; (vi) Fidelity's group fee structures, including the rationale for the individual fee rates of certain categories of funds and the definition of group assets; (vii) trends regarding industry use of performance fee structures and the performance adjustment methodologies applicable to the Fidelity funds; (viii) additional competitive analysis regarding the total expenses for certain classes; and (ix) fund profitability methodology, including Fidelity's cost allocation methodology, and the impact of certain factors on fund profitability results.
Annual Report
Board Approval of Investment Advisory Contracts and
Management Fees - continued
Based on its evaluation of all of the conclusions noted above, and after considering all factors it believed relevant, the Board ultimately concluded that the advisory fee structures are fair and reasonable, and that the fund's Advisory Contracts should be renewed.
Annual Report
Investment Adviser
Fidelity Management & Research Company
Boston, MA
Investment Sub-Advisers
FMR Co., Inc.
Fidelity Management & Research
(U.K.) Inc.
FIL Investment Advisors
FIL Investments (Japan) Limited
FIL Investment Advisors
(U.K.) Limited
Fidelity Management & Research
(Hong Kong) Limited
Fidelity Management & Research
(Japan) Inc.
General Distributor
Fidelity Distributors Corporation
Smithfield, RI
Transfer and Service Agents
Fidelity Investments Institutional
Operations Company, Inc.
Boston, MA
Fidelity Service Company, Inc.
Boston, MA
Custodian
State Street Bank and Trust Company
Quincy, MA
(Fidelity Investment logo)(registered trademark)
AGCSI-UANN-1213
1.879388.104
(Fidelity Investment logo)(registered trademark)
Fidelity Advisor®
Total Emerging Markets
Fund - Class A, Class T,
and Class C
Annual Report
October 31, 2013
(Fidelity Cover Art)
Class A, Class T, and
Class C are classes of
Fidelity® Total Emerging
Markets Fund
Contents
Performance | (Click Here) | How the fund has done over time. |
Management's Discussion of Fund Performance | (Click Here) | The Portfolio Manager's review of fund performance and strategy. |
Shareholder Expense Example | (Click Here) | An example of shareholder expenses. |
Investment Changes | (Click Here) | A summary of major shifts in the fund's investments over the past six months. |
Investments | (Click Here) | A complete list of the fund's investments with their market values. |
Financial Statements | (Click Here) | Statements of assets and liabilities, operations, and changes in net assets, as well as financial highlights. |
Notes | (Click Here) | Notes to the financial statements. |
Report of Independent Registered Public Accounting Firm | (Click Here) | |
Trustees and Officers | (Click Here) | |
Distributions | (Click Here) | |
Board Approval of Investment Advisory Contracts and Management Fees | (Click Here) | |
To view a fund's proxy voting guidelines and proxy voting record for the 12-month period ended June 30, visit http://www.fidelity.com/proxyvotingresults or visit the Securities and Exchange Commission's (SEC) web site at http://www.sec.gov. You may also call 1-877-208-0098 to request a free copy of the proxy voting guidelines.
Standard & Poor's, S&P and S&P 500 are registered service marks of The McGraw-Hill Companies, Inc. and have been licensed for use by Fidelity Distributors Corporation.
Other third-party marks appearing herein are the property of their respective owners.
All other marks appearing herein are registered or unregistered trademarks or service marks of FMR LLC or an affiliated company. © 2013 FMR LLC. All rights reserved.
Annual Report
This report and the financial statements contained herein are submitted for the general information of the shareholders of the fund. This report is not authorized for distribution to prospective investors in the fund unless preceded or accompanied by an effective prospectus.
A fund files its complete schedule of portfolio holdings with the SEC for the first and third quarters of each fiscal year on Form N-Q. Forms N-Q are available on the SEC's web site at http://www.sec.gov. A fund's Forms N-Q may be reviewed and copied at the SEC's Public Reference Room in Washington, DC. Information regarding the operation of the SEC's Public Reference Room may be obtained by calling 1-800-SEC-0330. For a complete list of a fund's portfolio holdings, view the most recent holdings listing, semiannual report, or annual report on Fidelity's web site at http://www.fidelity.com, http://advisor.fidelity.com, or http://www.401k.com, as applicable.
NOT FDIC INSURED • MAY LOSE VALUE • NO BANK GUARANTEE
Neither the fund nor Fidelity Distributors Corporation is a bank.
Annual Report
Average annual total return reflects the change in the value of an investment, assuming reinvestment of the class' distributions from dividend income and capital gains (the profits earned upon the sale of securities that have grown in value, if any) and assuming a constant rate of performance each year. The $10,000 table and the fund's returns do not reflect the deduction of taxes that a shareholder would pay on fund distributions or the redemption of fund shares. During periods of reimbursement by Fidelity, a fund's total return will be greater than it would be had the reimbursement not occurred. How a fund did yesterday is no guarantee of how it will do tomorrow.
Average Annual Total Returns
Periods ended October 31, 2013 | Past 1
year | Life of fund A |
Class A (incl. 5.75% sales charge) | 0.12% | 4.37% |
Class T (incl. 3.50% sales charge) | 2.23% | 5.35% |
Class C (incl. contingent deferred sales charge) B | 4.31% | 6.68% |
A From November 1, 2011.
B Class C shares' contingent deferred sales charges included in the past one year and life of fund total return figures are 1% and 0%, respectively.
$10,000 Over Life of Fund
Let's say hypothetically that $10,000 was invested in Fidelity Advisor® Total Emerging Markets Fund - Class A on November 1, 2011, when the fund started, and the current 5.75% sales charge was paid. The chart shows how the value of your investment would have changed, and also shows how the MSCI® Emerging Markets Index performed over the same period.
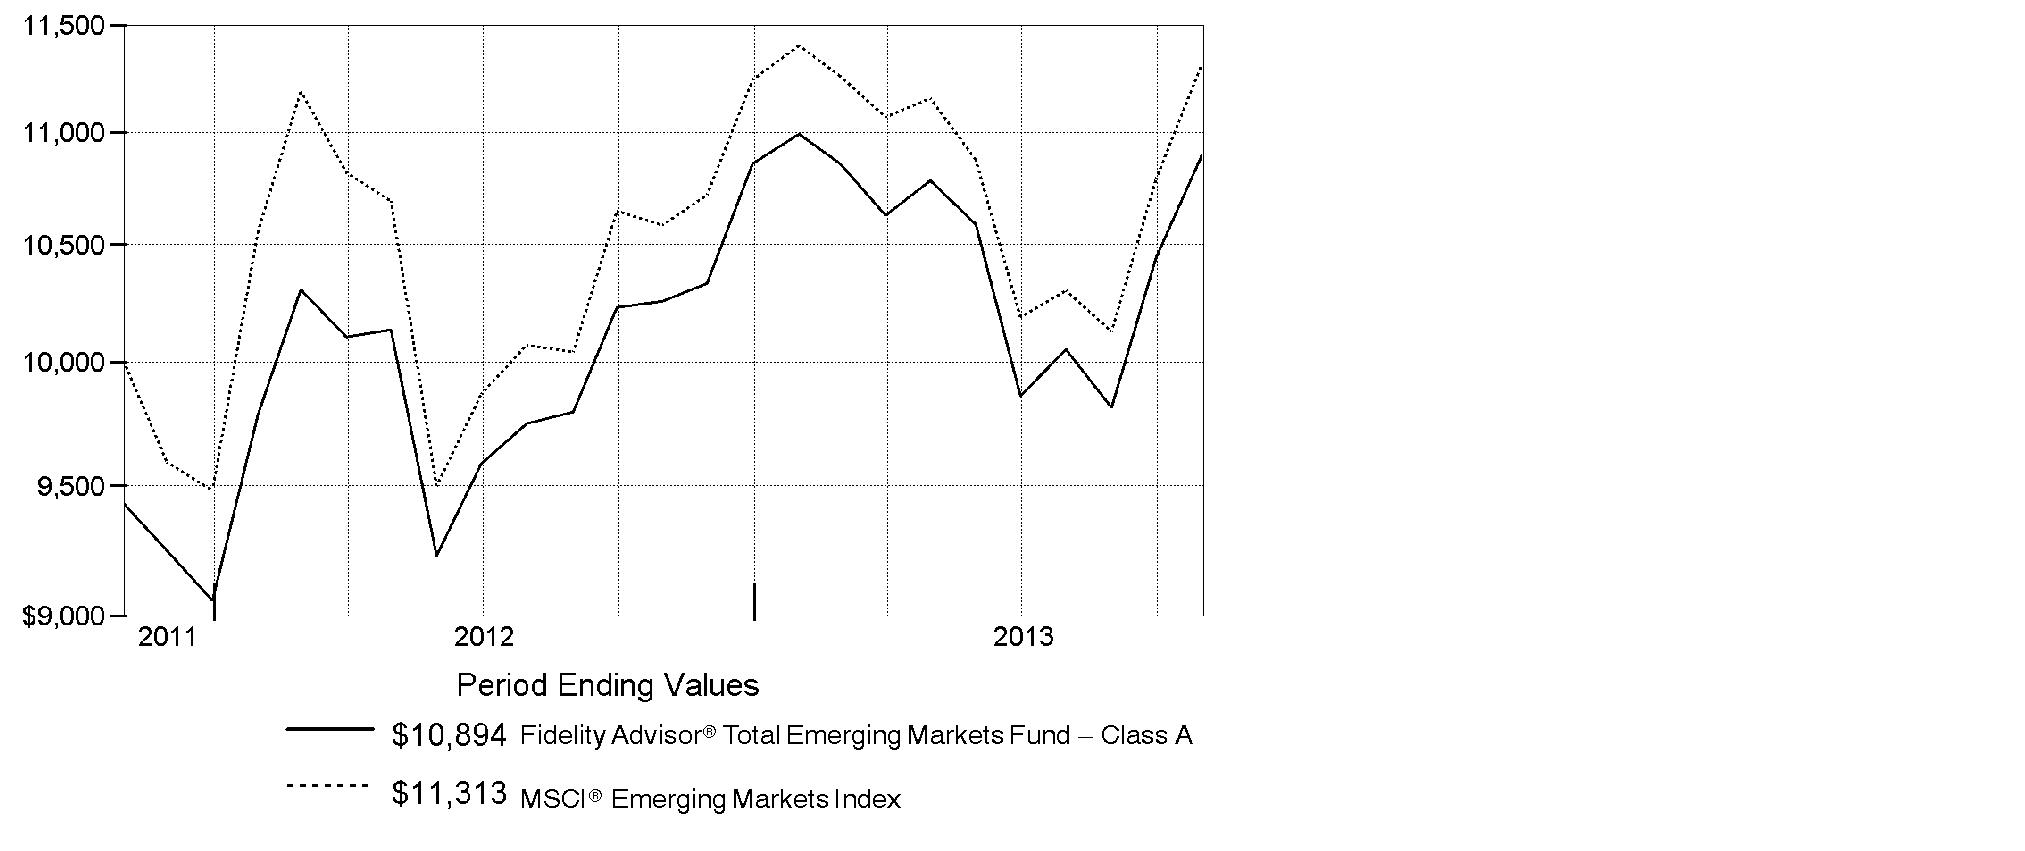
Annual Report
Market Recap: On balance, global equity markets remained upbeat for the 12-month period ending October 31, 2013. The MSCI® ACWI® (All Country World Index) Index gained 23.75% for the period, amid persistent preference for higher-risk assets. The period was not without turbulence, however. In the spring and summer, world central banks, especially in the U.S. and China, made clear their intentions to maintain accommodative monetary policies. That stance, along with modest cyclical improvements around the globe and generally low valuations, underpinned the broad rally in equities. Europe (+32%) shone, with most markets on the Continent notching solid, index-beating gains. Another bright spot, Japan, posted a 34% full-year result, despite a struggling yen and a weak second half. The U.S. - by far the largest index component - also outperformed, up roughly 28%. Meanwhile, Asia-Pacific ex Japan (+14%) lagged, hurt in part by a slowdown in Australia's mining industry as well as currency headwinds. Foreign-exchange and commodity weakness also curbed results in resource-heavy Canada and emerging markets (EM), both of which were up 7%. Country-level EM performance diverged meaningfully for the period, as shown by results in Brazil (-1%), Russia (+12%), India (+1%) and China (+8%). Against a strong tilt toward equities, global bond markets fell flat, with the Barclays® Global Aggregate GDP Weighted Index returning -0.15% for the full period.
Comments from John Carlson, Lead Portfolio Manager of Fidelity Advisor® Total Emerging Markets Fund: For the year, the fund's Class A, Class T and Class C shares gained 6.23%, 5.93% and 5.31%, respectively (excluding sales charges). By comparison, the fund's primary benchmark, the MSCI® Emerging Markets Index, returned 6.90%, while the Fidelity Total Emerging Markets Composite IndexSM advanced 3.07%. Versus the Composite index, the biggest boost came from security selection among equities. Here, the top individual contributor was Taiwan's ECLAT Textile, a supplier of performance fabrics that enjoyed pricing power for its products. We also were helped by Mobile TeleSystems, a Russian wireless telecom provider that was lifted by easing competitive conditions and upward revisions to its earnings forecasts. Conversely, the materials sector was the only notable area of weakness. Turning to emerging-markets (EM) debt, an underweighting here was helpful, as were our picks in Venezuela. Detractors included security selection in Russia and Mexico, as our holdings here were primarily long-duration securities that underperformed. It also hurt to largely avoid Argentina, which rallied significantly.
The views expressed above reflect those of the portfolio manager(s) only through the end of the period as stated on the cover of this report and do not necessarily represent the views of Fidelity or any other person in the Fidelity organization. Any such views are subject to change at any time based upon market or other conditions and Fidelity disclaims any responsibility to update such views. These views may not be relied on as investment advice and, because investment decisions for a Fidelity fund are based on numerous factors, may not be relied on as an indication of trading intent on behalf of any Fidelity fund.
Annual Report
Fidelity Total Emerging Markets Fund
Shareholder Expense Example
As a shareholder of the Fund, you incur two types of costs: (1) transaction costs, including sales charges (loads) on purchase payments or redemption proceeds, redemption fees and (2) ongoing costs, including management fees, distribution and/or service (12b-1) fees and other Fund expenses. This Example is intended to help you understand your ongoing costs (in dollars) of investing in the Fund and to compare these costs with the ongoing costs of investing in other mutual funds.
The Example is based on an investment of $1,000 invested at the beginning of the period and held for the entire period (May 1, 2013 to October 31, 2013).
Actual Expenses
The first line of the accompanying table for each class of the Fund provides information about actual account values and actual expenses. You may use the information in this line, together with the amount you invested, to estimate the expenses that you paid over the period. Simply divide your account value by $1,000.00 (for example, an $8,600 account value divided by $1,000.00 = 8.6), then multiply the result by the number in the first line for a class of the Fund under the heading entitled "Expenses Paid During Period" to estimate the expenses you paid on your account during this period. A small balance maintenance fee of $12.00 that is charged once a year may apply for certain accounts with a value of less than $2,000. This fee is not included in the table below. If it was, the estimate of expenses you paid during the period would be higher, and your ending account value lower, by this amount. In addition, the Fund, as a shareholder in the underlying Fidelity Central Funds, will indirectly bear its pro-rata share of the fees and expenses incurred by the underlying Fidelity Central Funds. These fees and expenses are not included in the Fund's annualized expense ratio used to calculate the expense estimate in the table below.
Hypothetical Example for Comparison Purposes
The second line of the accompanying table for each class of the Fund provides information about hypothetical account values and hypothetical expenses based on a Class' actual expense ratio and an assumed rate of return of 5% per year before expenses, which is not the Class' actual return. The hypothetical account values and expenses may not be used to estimate the actual ending account balance or expenses you paid for the period. You may use this information to compare the ongoing costs of investing in the Fund and other funds. To do so, compare this 5% hypothetical example with the 5% hypothetical examples that appear in the shareholder reports of the other funds. A small balance maintenance fee of $12.00 that is charged once a year may apply for certain accounts with a value of less than $2,000. This fee is not included in the table below. If it was, the estimate of expenses you paid during the period would be higher, and your ending account value lower, by this amount. In addition, the Fund, as a shareholder in the underlying Fidelity Central Funds, will indirectly bear its pro-rata share of the fees and expenses incurred by the underlying Fidelity Central Funds. These fees and expenses are not included in the Fund's annualized expense ratio used to calculate the expense estimate in the table below.
Please note that the expenses shown in the table are meant to highlight your ongoing costs only and do not reflect any transaction costs. Therefore, the second line of the table is useful in comparing ongoing costs only, and will not help you determine the relative total costs of owning different funds. In addition, if these transactional costs were included, your costs would have been higher.
Annual Report
| Annualized
Expense RatioB | Beginning
Account Value
May 1, 2013 | Ending
Account Value
October 31, 2013 | Expenses Paid
During Period*
May 1, 2013
to October 31, 2013 |
Class A | 1.65% | | | |
Actual | | $ 1,000.00 | $ 1,010.70 | $ 8.36 |
HypotheticalA | | $ 1,000.00 | $ 1,016.89 | $ 8.39 |
Class T | 1.90% | | | |
Actual | | $ 1,000.00 | $ 1,008.90 | $ 9.62 |
HypotheticalA | | $ 1,000.00 | $ 1,015.63 | $ 9.65 |
Class C | 2.40% | | | |
Actual | | $ 1,000.00 | $ 1,006.20 | $ 12.14 |
HypotheticalA | | $ 1,000.00 | $ 1,013.11 | $ 12.18 |
Total Emerging Markets | 1.40% | | | |
Actual | | $ 1,000.00 | $ 1,011.50 | $ 7.10 |
HypotheticalA | | $ 1,000.00 | $ 1,018.15 | $ 7.12 |
Institutional Class | 1.40% | | | |
Actual | | $ 1,000.00 | $ 1,011.50 | $ 7.10 |
HypotheticalA | | $ 1,000.00 | $ 1,018.15 | $ 7.12 |
A 5% return per year before expenses
B Annualized expense ratio reflects expenses net of applicable fee waivers.
* Expenses are equal to each Class' annualized expense ratio, multiplied by the average account value over the period, multiplied by 184/365 (to reflect the one-half year period).
Annual Report
Fidelity Total Emerging Markets Fund
Investment Changes (Unaudited)
Top Five Stocks as of October 31, 2013 |
| % of fund's
net assets | % of fund's net assets
6 months ago |
Samsung Electronics Co. Ltd. (Korea (South), Semiconductors & Semiconductor Equipment) | 3.6 | 4.0 |
Taiwan Semiconductor Manufacturing Co. Ltd. (Taiwan, Semiconductors & Semiconductor Equipment) | 2.4 | 2.4 |
Tencent Holdings Ltd. (Cayman Islands, Internet Software & Services) | 1.6 | 0.8 |
Sberbank (Savings Bank of the Russian Federation) (Russia, Commercial Banks) | 1.6 | 1.3 |
Industrial & Commercial Bank of China Ltd. (H Shares) (China, Commercial Banks) | 1.4 | 1.1 |
| 10.6 | |
Top Five Market Sectors as of October 31, 2013 |
| % of fund's
net assets | % of fund's net assets
6 months ago |
Financials | 21.9 | 21.9 |
Information Technology | 12.5 | 10.7 |
Energy | 11.4 | 13.0 |
Materials | 7.8 | 8.1 |
Telecommunication Services | 6.7 | 6.2 |
Top Five Countries as of October 31, 2013 |
(excluding cash equivalents) | % of fund's
net assets | % of fund's net assets
6 months ago |
Korea (South) | 14.1 | 10.9 |
Russia | 7.8 | 8.1 |
Brazil | 7.8 | 10.1 |
Cayman Islands | 6.8 | 5.6 |
Taiwan | 5.5 | 5.9 |
Percentages are adjusted for the effect of open futures contracts, if applicable. |
Asset Allocation (% of fund's net assets) |
As of October 31, 2013 | As of April 30, 2013 |
 | Stocks and
Equity Futures 76.5% | | | Stocks 75.7% | |
 | Bonds 22.2% | | | Bonds 22.3% | |
 | Short-Term
Investments and
Net Other Assets
(Liabilities) 1.3% | | | Short-Term
Investments and
Net Other Assets
(Liabilities) 2.0% | |

Annual Report
Fidelity Total Emerging Markets Fund
Investments October 31, 2013
Showing Percentage of Net Assets
Common Stocks - 72.7% |
| Shares | | Value |
Argentina - 0.1% |
Grupo Financiero Galicia SA sponsored ADR | 13,090 | | $ 126,711 |
Austria - 0.4% |
Erste Group Bank AG | 8,890 | | 313,529 |
Bailiwick of Jersey - 0.3% |
Atrium European Real Estate Ltd. | 45,129 | | 269,973 |
Bermuda - 1.4% |
Aquarius Platinum Ltd. (Australia) (a) | 117,431 | | 77,138 |
BW Offshore Ltd. | 228,373 | | 313,420 |
Cosan Ltd. Class A | 17,863 | | 281,521 |
GP Investments Ltd. Class A (depositary receipt) (a) | 101,622 | | 182,359 |
Shangri-La Asia Ltd. | 110,000 | | 201,470 |
Stolt-Nielsen SA | 7,271 | | 205,804 |
TOTAL BERMUDA | | 1,261,712 |
Brazil - 6.8% |
Anhanguera Educacional Participacoes SA | 34,600 | | 206,964 |
Arezzo Industria e Comercio SA | 9,700 | | 145,054 |
BHG SA (Brazil Hospitality Group) (a) | 13,600 | | 99,563 |
BR Properties SA | 42,820 | | 363,173 |
Companhia de Bebidas das Americas (AmBev) (PN) sponsored ADR | 8,700 | | 323,640 |
Companhia de Saneamento Basico do Estado de Sao Paulo (SABESP) sponsored ADR | 20,630 | | 218,884 |
Companhia Paranaense de Energia-Copel (PN-B) sponsored ADR | 13,665 | | 189,670 |
Estacio Participacoes SA | 24,200 | | 186,885 |
Fibria Celulose SA (a) | 10,000 | | 129,676 |
Gerdau SA sponsored ADR | 44,800 | | 355,264 |
Itau Unibanco Holding SA sponsored ADR | 76,790 | | 1,183,334 |
Petroleo Brasileiro SA - Petrobras: | | | |
(PN) sponsored ADR (non-vtg.) | 11,606 | | 210,765 |
sponsored ADR | 26,526 | | 462,348 |
Smiles SA | 14,300 | | 187,607 |
TIM Participacoes SA sponsored ADR | 3,280 | | 83,378 |
Ultrapar Participacoes SA | 21,700 | | 578,292 |
Vale SA (PN-A) sponsored ADR | 72,200 | | 1,057,008 |
TOTAL BRAZIL | | 5,981,505 |
British Virgin Islands - 0.0% |
Luxoft Holding, Inc. | 1,100 | | 32,142 |
Canada - 0.6% |
First Quantum Minerals Ltd. | 12,500 | | 237,136 |
Common Stocks - continued |
| Shares | | Value |
Canada - continued |
Goldcorp, Inc. | 5,900 | | $ 150,294 |
Pan American Silver Corp. | 9,200 | | 97,612 |
Torex Gold Resources, Inc. (a) | 61,700 | | 68,644 |
TOTAL CANADA | | 553,686 |
Cayman Islands - 6.1% |
21Vianet Group, Inc. ADR (a) | 10,920 | | 196,560 |
58.com, Inc. ADR | 300 | | 7,236 |
Anta Sports Products Ltd. | 149,000 | | 213,708 |
Anton Oilfield Services Group | 356,000 | | 224,997 |
China Liansu Group Holdings Ltd. | 270,000 | | 172,733 |
Cimc Enric Holdings Ltd. | 124,000 | | 174,652 |
Ctrip.com International Ltd. sponsored ADR (a) | 4,400 | | 238,700 |
Eurasia Drilling Co. Ltd. GDR (Reg. S) | 8,934 | | 378,355 |
GCL-Poly Energy Holdings Ltd. (a) | 1,193,000 | | 366,225 |
Greatview Aseptic Pack Co. Ltd. | 398,000 | | 250,515 |
Haitian International Holdings Ltd. | 78,000 | | 187,932 |
Hengan International Group Co. Ltd. | 42,000 | | 514,369 |
Hilong Holding Ltd. | 166,000 | | 110,481 |
Springland International Holdings Ltd. | 300,000 | | 164,452 |
Tencent Holdings Ltd. | 25,800 | | 1,408,301 |
Uni-President China Holdings Ltd. | 272,000 | | 271,895 |
Veripos | 29,165 | | 144,036 |
Xueda Education Group sponsored ADR | 28,100 | | 131,508 |
Yingde Gases Group Co. Ltd. | 188,000 | | 193,020 |
TOTAL CAYMAN ISLANDS | | 5,349,675 |
Chile - 1.2% |
Banco Santander Chile | 5,905,977 | | 362,948 |
Embotelladora Andina SA ADR | 2,300 | | 59,570 |
Empresa Nacional de Electricidad SA | 110,318 | | 168,196 |
Empresa Nacional de Telecomunicaciones SA (ENTEL) | 12,847 | | 197,702 |
Inversiones La Construccion SA | 7,739 | | 116,179 |
Sociedad Quimica y Minera de Chile SA (PN-B) sponsored ADR | 4,200 | | 115,962 |
TOTAL CHILE | | 1,020,557 |
China - 5.3% |
Anhui Conch Cement Co. Ltd. (H Shares) | 73,000 | | 254,695 |
BBMG Corp. (H Shares) | 351,500 | | 252,075 |
China Communications Construction Co. Ltd. (H Shares) | 349,000 | | 284,944 |
China Construction Bank Corp. (H Shares) | 653,000 | | 507,037 |
China Pacific Insurance Group Co. Ltd. (H Shares) | 251,600 | | 908,655 |
Common Stocks - continued |
| Shares | | Value |
China - continued |
China Suntien Green Energy Corp. Ltd. (H Shares) | 247,200 | | $ 86,407 |
China Telecom Corp. Ltd. (H Shares) | 846,157 | | 441,995 |
Industrial & Commercial Bank of China Ltd. (H Shares) | 1,739,000 | | 1,217,950 |
Maanshan Iron & Steel Ltd. (H Shares) (a) | 568,000 | | 145,059 |
PICC Property & Casualty Co. Ltd. (H Shares) | 177,000 | | 271,219 |
Weichai Power Co. Ltd. (H Shares) | 59,400 | | 237,891 |
TOTAL CHINA | | 4,607,927 |
Cyprus - 0.3% |
Globaltrans Investment PLC GDR (Reg. S) | 19,300 | | 293,360 |
Czech Republic - 0.1% |
Ceske Energeticke Zavody A/S | 1,780 | | 51,236 |
Denmark - 0.2% |
Auriga Industries A/S Series B (a) | 5,323 | | 208,821 |
France - 0.2% |
Technip SA | 1,888 | | 197,769 |
Hong Kong - 1.3% |
AIA Group Ltd. | 32,100 | | 162,922 |
CNOOC Ltd. | 24,000 | | 48,815 |
CNOOC Ltd. sponsored ADR | 700 | | 141,617 |
Far East Horizon Ltd. | 343,000 | | 250,846 |
Lenovo Group Ltd. | 418,000 | | 447,491 |
Sinotruk Hong Kong Ltd. | 233,500 | | 122,277 |
TOTAL HONG KONG | | 1,173,968 |
India - 5.3% |
Axis Bank Ltd. | 31,183 | | 618,711 |
Bajaj Auto Ltd. | 6,012 | | 207,792 |
Bharti Airtel Ltd. | 42,507 | | 253,218 |
Bharti Infratel Ltd. | 81,097 | | 216,942 |
Eicher Motors Ltd. | 3,283 | | 210,853 |
Grasim Industries Ltd. | 4,724 | | 222,055 |
Indiabulls Real Estate Ltd. | 167,722 | | 170,514 |
ITC Ltd. | 106,950 | | 581,401 |
JK Cement Ltd. | 21,830 | | 68,493 |
Larsen & Toubro Ltd. | 19,537 | | 308,698 |
Lupin Ltd. | 14,534 | | 215,798 |
Maruti Suzuki India Ltd. | 11,768 | | 312,456 |
Mundra Port and SEZ Ltd. | 107,251 | | 253,230 |
NHPC Ltd. | 481,849 | | 141,527 |
NTPC Ltd. | 107,028 | | 258,956 |
Petronet LNG Ltd. | 78,017 | | 157,303 |
Common Stocks - continued |
| Shares | | Value |
India - continued |
Phoenix Mills Ltd. (a) | 34,705 | | $ 131,895 |
SREI Infrastructure Finance Ltd. | 435,998 | | 144,687 |
Ultratech Cemco Ltd. | 5,561 | | 177,490 |
TOTAL INDIA | | 4,652,019 |
Indonesia - 1.3% |
PT AKR Corporindo Tbk | 247,500 | | 106,486 |
PT Bakrieland Development Tbk (a) | 21,996,000 | | 97,564 |
PT Bank Rakyat Indonesia Tbk | 398,000 | | 278,925 |
PT Bank Tabungan Negara Tbk | 1,280,200 | | 110,161 |
PT Kalbe Farma Tbk | 1,665,500 | | 192,073 |
PT Telkomunikasi Indonesia Tbk sponsored ADR | 7,626 | | 310,836 |
TOTAL INDONESIA | | 1,096,045 |
Isle of Man - 0.0% |
IBS Group Holding Ltd. GDR (Reg. S) | 1,300 | | 35,116 |
Israel - 0.2% |
NICE Systems Ltd. sponsored ADR | 4,500 | | 176,310 |
Kenya - 0.3% |
Equity Bank Ltd. | 576,900 | | 239,953 |
Korea (South) - 13.2% |
AMOREPACIFIC Group, Inc. | 727 | | 256,541 |
Daewoo International Corp. | 17,225 | | 635,420 |
Daou Technology, Inc. | 11,720 | | 160,679 |
E-Mart Co. Ltd. | 2,632 | | 629,926 |
Hana Financial Group, Inc. | 26,070 | | 1,004,695 |
Hankook Shell Oil Co. Ltd. | 265 | | 131,341 |
Hyundai Industrial Development & Construction Co. | 11,590 | | 257,730 |
Hyundai Mobis | 1,115 | | 314,660 |
KB Financial Group, Inc. | 25,480 | | 1,002,989 |
Korea Electric Power Corp. (a) | 9,825 | | 262,255 |
Korea Plant Service & Engineering Co. Ltd. | 370 | | 18,757 |
Korean Reinsurance Co. | 27,060 | | 303,420 |
KT&G Corp. | 3,666 | | 267,710 |
LG Chemical Ltd. | 1,313 | | 370,537 |
LG Corp. | 5,031 | | 297,229 |
Lotte Chemical Corp. | 822 | | 168,462 |
NHN Corp. | 1,129 | | 635,094 |
Oci Co. Ltd. | 1,507 | | 272,637 |
POSCO sponsored ADR | 5,000 | | 372,300 |
Samsung Electronics Co. Ltd. | 2,306 | | 3,183,223 |
Samsung Life Insurance Co. Ltd. | 4,099 | | 403,612 |
Common Stocks - continued |
| Shares | | Value |
Korea (South) - continued |
SK Hynix, Inc. (a) | 8,360 | | $ 251,679 |
SK Telecom Co. Ltd. | 1,502 | | 327,153 |
TOTAL KOREA (SOUTH) | | 11,528,049 |
Luxembourg - 0.3% |
Subsea 7 SA | 12,335 | | 260,871 |
Malaysia - 0.3% |
Petronas Dagangan Bhd | 22,500 | | 218,121 |
Tenaga Nasional Bhd | 10,950 | | 32,713 |
TOTAL MALAYSIA | | 250,834 |
Mexico - 4.0% |
Alpek SA de CV | 42,600 | | 92,434 |
America Movil S.A.B. de CV Series L sponsored ADR | 35,713 | | 764,615 |
CEMEX SA de CV sponsored ADR | 26,435 | | 279,682 |
El Puerto de Liverpool S.A.B. de CV Class C | 20,300 | | 219,240 |
Fomento Economico Mexicano S.A.B. de CV sponsored ADR | 5,450 | | 508,485 |
Gruma S.A.B. de CV Series B (a) | 49,500 | | 339,251 |
Grupo Comercial Chedraui S.A.B. de CV | 70,900 | | 221,711 |
Grupo Financiero Banorte S.A.B. de CV Series O | 65,600 | | 418,722 |
Grupo Televisa SA de CV (CPO) sponsored ADR | 21,000 | | 639,240 |
TOTAL MEXICO | | 3,483,380 |
Netherlands - 0.3% |
Fugro NV (Certificaten Van Aandelen) | 4,347 | | 272,000 |
Nigeria - 1.3% |
Guaranty Trust Bank PLC GDR (Reg. S) | 53,750 | | 419,250 |
Zenith Bank PLC | 5,102,305 | | 692,088 |
TOTAL NIGERIA | | 1,111,338 |
Norway - 0.9% |
ElectroMagnetic GeoServices ASA (a) | 77,389 | | 89,374 |
Spectrum ASA | 12,824 | | 74,320 |
TGS Nopec Geophysical Co. ASA | 21,811 | | 600,136 |
TOTAL NORWAY | | 763,830 |
Panama - 0.3% |
Copa Holdings SA Class A | 2,060 | | 308,052 |
Philippines - 1.1% |
Alliance Global Group, Inc. | 344,300 | | 209,934 |
Common Stocks - continued |
| Shares | | Value |
Philippines - continued |
Metropolitan Bank & Trust Co. | 137,074 | | $ 282,300 |
Robinsons Land Corp. | 915,700 | | 480,999 |
TOTAL PHILIPPINES | | 973,233 |
Poland - 0.4% |
Powszechny Zaklad Ubezpieczen SA | 1,874 | | 285,205 |
Telekomunikacja Polska SA | 24,900 | | 80,673 |
TOTAL POLAND | | 365,878 |
Portugal - 0.4% |
BPI-SGPS SA (a) | 56,385 | | 89,571 |
Jeronimo Martins SGPS SA | 11,900 | | 219,900 |
TOTAL PORTUGAL | | 309,471 |
Russia - 5.3% |
DIXY Group OJSC (a) | 6,505 | | 85,739 |
E.ON Russia JSC | 6,198,200 | | 481,233 |
Gazprom OAO sponsored ADR | 51,032 | | 476,129 |
LUKOIL Oil Co. | 1,100 | | 72,165 |
Magnit OJSC | 1,776 | | 477,914 |
Mobile TeleSystems OJSC | 83,280 | | 876,666 |
Norilsk Nickel OJSC ADR | 15,400 | | 233,156 |
RusHydro JSC sponsored ADR | 25,070 | | 42,218 |
Sberbank (Savings Bank of the Russian Federation) | 433,550 | | 1,389,707 |
Sistema JSFC | 277,400 | | 309,068 |
VTB Bank OJSC sponsored GDR (Reg. S) | 84,600 | | 235,103 |
TOTAL RUSSIA | | 4,679,098 |
Singapore - 1.1% |
Ezion Holdings Ltd. | 263,000 | | 474,255 |
First Resources Ltd. | 160,000 | | 251,167 |
Super Group Ltd. Singapore | 60,000 | | 203,349 |
TOTAL SINGAPORE | | 928,771 |
South Africa - 3.8% |
Aspen Pharmacare Holdings Ltd. | 14,400 | | 400,883 |
Barclays Africa Group Ltd. | 17,591 | | 271,590 |
Blue Label Telecoms Ltd. | 54,600 | | 51,343 |
Impala Platinum Holdings Ltd. | 18,500 | | 224,829 |
JSE Ltd. | 17,210 | | 150,521 |
Life Healthcare Group Holdings Ltd. | 66,300 | | 270,781 |
MTN Group Ltd. | 32,350 | | 643,020 |
Naspers Ltd. Class N | 10,800 | | 1,010,205 |
Common Stocks - continued |
| Shares | | Value |
South Africa - continued |
Reunert Ltd. | 20,200 | | $ 141,860 |
Wilson Bayly Holmes-Ovcon Ltd. | 7,900 | | 138,495 |
TOTAL SOUTH AFRICA | | 3,303,527 |
Sri Lanka - 0.2% |
Dialog Axiata PLC | 2,387,100 | | 165,948 |
Taiwan - 5.5% |
Chipbond Technology Corp. | 74,000 | | 149,332 |
Chroma ATE, Inc. | 43,000 | | 91,449 |
Cleanaway Co. Ltd. | 23,000 | | 143,774 |
E.SUN Financial Holdings Co. Ltd. | 411,700 | | 274,840 |
ECLAT Textile Co. Ltd. | 26,660 | | 293,002 |
Hon Hai Precision Industry Co. Ltd. (Foxconn) | 28,950 | | 73,272 |
King Slide Works Co. Ltd. | 6,000 | | 52,998 |
MediaTek, Inc. | 41,000 | | 559,946 |
Taiwan Fertilizer Co. Ltd. | 156,300 | | 371,700 |
Taiwan Semiconductor Manufacturing Co. Ltd. | 381,000 | | 1,401,553 |
Taiwan Semiconductor Manufacturing Co. Ltd. sponsored ADR | 36,242 | | 667,215 |
Tong Hsing Electronics Industries Ltd. | 26,000 | | 137,354 |
Unified-President Enterprises Corp. | 135,739 | | 258,243 |
Universal Cement Corp. | 79,000 | | 72,465 |
Yuanta Financial Holding Co. Ltd. | 443,500 | | 241,074 |
TOTAL TAIWAN | | 4,788,217 |
Thailand - 0.5% |
Bangkok Bank PCL (For. Reg.) | 61,700 | | 408,360 |
Togo - 0.2% |
Ecobank Transnational, Inc. | 2,409,565 | | 210,609 |
Turkey - 0.9% |
Aygaz A/S | 24,074 | | 110,225 |
Tupras Turkiye Petrol Rafinelleri A/S | 15,400 | | 349,465 |
Turkiye Halk Bankasi A/S | 36,800 | | 297,718 |
TOTAL TURKEY | | 757,408 |
United Kingdom - 0.4% |
John Wood Group PLC | 19,934 | | 259,533 |
Mondi PLC | 6,900 | | 123,247 |
TOTAL UNITED KINGDOM | | 382,780 |
United States of America - 0.9% |
Cognizant Technology Solutions Corp. Class A (a) | 2,400 | | 208,632 |
InvenSense, Inc. (a) | 13,111 | | 221,445 |
Common Stocks - continued |
| Shares | | Value |
United States of America - continued |
Sohu.com, Inc. (a) | 3,700 | | $ 247,752 |
Universal Display Corp. (a) | 2,247 | | 71,679 |
TOTAL UNITED STATES OF AMERICA | | 749,508 |
TOTAL COMMON STOCKS (Cost $54,256,585) |
63,643,176
|
Nonconvertible Preferred Stocks - 3.4% |
| | | |
Brazil - 1.0% |
Alpargatas Sa (PN) | 28,500 | | 197,192 |
Banco do Estado Rio Grande do Sul SA | 25,700 | | 185,276 |
Braskem SA (PN-A) | 20,300 | | 180,146 |
Companhia Paranaense de Energia-Copel (PN-B) | 715 | | 9,971 |
Lojas Americanas SA (PN) | 38,333 | | 283,707 |
TOTAL BRAZIL | | 856,292 |
Chile - 0.2% |
Embotelladora Andina SA Class A | 47,759 | | 202,317 |
Korea (South) - 0.9% |
Hyundai Motor Co. Series 2 | 3,701 | | 418,476 |
Samsung Electronics Co. Ltd. | 374 | | 360,862 |
TOTAL KOREA (SOUTH) | | 779,338 |
Russia - 1.3% |
Sberbank (Savings Bank of the Russian Federation) | 292,600 | | 755,706 |
Surgutneftegas | 476,850 | | 354,618 |
TOTAL RUSSIA | | 1,110,324 |
TOTAL NONCONVERTIBLE PREFERRED STOCKS (Cost $2,357,183) |
2,948,271
|
Nonconvertible Bonds - 7.4% |
| Principal
Amount (c) | | |
Bailiwick of Jersey - 0.2% |
Polyus Gold International Ltd. 5.625% 4/29/20 (e) | | $ 200,000 | | 199,500 |
Canada - 0.5% |
Pacific Rubiales Energy Corp. 7.25% 12/12/21 (e) | | 400,000 | | 441,000 |
Cayman Islands - 0.6% |
Odebrecht Finance Ltd. 7.5% (e)(f) | | 475,000 | | 475,000 |
Nonconvertible Bonds - continued |
| Principal
Amount (c) | | Value |
Costa Rica - 0.2% |
Instituto Costarricense de Electricidad 6.95% 11/10/21 (e) | | $ 200,000 | | $ 211,000 |
Georgia - 0.4% |
Georgia Bank Joint Stock Co. 7.75% 7/5/17 (e) | | 300,000 | | 319,500 |
Indonesia - 0.2% |
PT Pertamina Persero 5.625% 5/20/43 (e) | | 200,000 | | 168,500 |
Israel - 0.3% |
Israel Electric Corp. Ltd. 6.7% 2/10/17 (e) | | 250,000 | | 270,625 |
Kazakhstan - 1.0% |
KazMunaiGaz Finance Sub BV 7% 5/5/20 (e) | | 150,000 | | 171,570 |
KazMunaiGaz National Co. 5.75% 4/30/43 (e) | | 300,000 | | 272,220 |
Zhaikmunai International BV 7.125% 11/13/19 (e) | | 400,000 | | 424,000 |
TOTAL KAZAKHSTAN | | 867,790 |
Luxembourg - 0.7% |
Millicom International Cellular SA 4.75% 5/22/20 (e) | | 200,000 | | 188,000 |
RSHB Capital SA: | | | | |
5.1% 7/25/18 (e) | | 200,000 | | 204,240 |
5.298% 12/27/17 (e) | | 200,000 | | 207,500 |
TOTAL LUXEMBOURG | | 599,740 |
Mexico - 1.2% |
America Movil S.A.B. de CV 6.45% 12/5/22 | MXN | 9,750,000 | | 701,251 |
Petroleos Mexicanos 6.625% (e)(f) | | 300,000 | | 309,000 |
TOTAL MEXICO | | 1,010,251 |
Netherlands - 0.3% |
Indosat Palapa Co. BV 7.375% 7/29/20 (e) | | 100,000 | | 107,625 |
Mozambique Ematum Finance 2020 6.305% 9/11/20 (Reg. S) | | 200,000 | | 188,500 |
TOTAL NETHERLANDS | | 296,125 |
Paraguay - 0.2% |
Telefonica Celular del Paraguay SA 6.75% 12/13/22 (e) | | 200,000 | | 203,000 |
Trinidad & Tobago - 0.2% |
Petroleum Co. of Trinidad & Tobago Ltd. 9.75% 8/14/19 (e) | | 150,000 | | 190,875 |
Turkey - 0.2% |
Arcelik A/S 5% 4/3/23 (e) | | 200,000 | | 180,000 |
Nonconvertible Bonds - continued |
| Principal
Amount (c) | | Value |
Venezuela - 1.2% |
Petroleos de Venezuela SA 8.5% 11/2/17 (e) | | $ 1,200,000 | | $ 1,077,000 |
TOTAL NONCONVERTIBLE BONDS (Cost $6,679,240) |
6,509,906
|
Government Obligations - 14.9% |
|
Armenia - 0.2% |
Republic of Armenia 6% 9/30/20 (e) | | 200,000 | | 196,750 |
Aruba - 0.4% |
Aruba Government 4.625% 9/14/23 (e) | | 400,000 | | 376,000 |
Azerbaijan - 0.4% |
State Oil Co. of Azerbaijan Republic 5.45% 2/9/17 (Reg. S) | | 300,000 | | 321,000 |
Bahrain - 0.2% |
Bahrain Kingdom 6.125% 8/1/23 (e) | | 200,000 | | 207,000 |
Barbados - 0.1% |
Barbados Government 7% 8/4/22 (e) | | 100,000 | | 95,000 |
Belarus - 0.5% |
Belarus Republic: | | | | |
8.75% 8/3/15 (Reg. S) | | 325,000 | | 325,813 |
8.95% 1/26/18 | | 100,000 | | 99,250 |
TOTAL BELARUS | | 425,063 |
Belize - 0.2% |
Belize Government 5% 2/20/38 (d)(e) | | 332,500 | | 204,488 |
Bermuda - 0.1% |
Bermuda Government 5.603% 7/20/20 (e) | | 100,000 | | 106,625 |
Bolivia - 0.2% |
Plurinational State of Bolivia 4.875% 10/29/22 (e) | | 200,000 | | 195,000 |
Cayman Islands - 0.1% |
Cayman Island Government 5.95% 11/24/19 (e) | | 100,000 | | 112,000 |
Congo - 0.3% |
Congo Republic 3.5% 6/30/29 (d) | | 325,883 | | 286,777 |
Dominican Republic - 0.2% |
Dominican Republic 5.875% 4/18/24 (e) | | 150,000 | | 146,250 |
Ecuador - 0.5% |
Ecuador Republic 9.375% 12/15/15 (e) | | 386,000 | | 409,160 |
Government Obligations - continued |
| Principal
Amount (c) | | Value |
El Salvador - 0.2% |
El Salvador Republic 7.625% 2/1/41 (e) | | $ 150,000 | | $ 156,375 |
Guatemala - 0.2% |
Guatemalan Republic 4.875% 2/13/28 (e) | | 200,000 | | 188,000 |
Honduras - 0.2% |
Republic of Honduras 7.5% 3/15/24 (e) | | 200,000 | | 176,000 |
Hungary - 1.2% |
Hungarian Republic: | | | | |
4.75% 2/3/15 | | 140,000 | | 144,200 |
6.375% 3/29/21 | | 508,000 | | 551,815 |
7.625% 3/29/41 | | 350,000 | | 394,188 |
TOTAL HUNGARY | | 1,090,203 |
Iraq - 0.2% |
Republic of Iraq 5.8% 1/15/28 (Reg. S) | | 250,000 | | 216,875 |
Ivory Coast - 0.3% |
Ivory Coast 7.1% 12/31/32 (d) | | 275,000 | | 248,188 |
Jamaica - 0.2% |
Jamaican Government 8% 6/24/19 | | 150,000 | | 146,625 |
Jordan - 0.3% |
Jordanian Kingdom 3.875% 11/12/15 | | 300,000 | | 300,375 |
Lebanon - 0.6% |
Lebanese Republic: | | | | |
6.1% 10/4/22 | | 200,000 | | 195,000 |
11.625% 5/11/16 (Reg. S) | | 250,000 | | 288,750 |
TOTAL LEBANON | | 483,750 |
Mongolia - 0.2% |
Mongolian People's Republic 5.125% 12/5/22 (Reg. S) | | 200,000 | | 176,600 |
Morocco - 0.4% |
Moroccan Kingdom: | | | | |
4.25% 12/11/22 (e) | | 200,000 | | 188,500 |
5.5% 12/11/42 (e) | | 200,000 | | 175,000 |
TOTAL MOROCCO | | 363,500 |
Namibia - 0.2% |
Republic of Namibia 5.5% 11/3/21 (e) | | 200,000 | | 210,500 |
Netherlands - 0.3% |
Republic of Angola 7% 8/16/19 (Issued by Northern Lights III BV for Republic of Angola) (Reg. S) | | 250,000 | | 270,625 |
Government Obligations - continued |
| Principal
Amount (c) | | Value |
Nigeria - 0.4% |
Republic of Nigeria 6.75% 1/28/21 (e) | | $ 350,000 | | $ 383,250 |
Panama - 0.2% |
Panamanian Republic 4.3% 4/29/53 | | 200,000 | | 163,200 |
Peru - 0.5% |
Peruvian Republic: | | | | |
7.35% 7/21/25 | | 100,000 | | 128,250 |
8.75% 11/21/33 | | 200,000 | | 291,500 |
TOTAL PERU | | 419,750 |
Philippines - 0.5% |
Philippine Republic 10.625% 3/16/25 | | 300,000 | | 474,000 |
Romania - 0.3% |
Romanian Republic 6.75% 2/7/22 (e) | | 190,000 | | 219,450 |
Russia - 1.2% |
Russian Federation: | | | | |
5.625% 4/4/42 (e) | | 350,000 | | 364,000 |
7.5% 3/31/30 (Reg. S) | | 250,250 | | 297,798 |
12.75% 6/24/28 (Reg. S) | | 225,000 | | 391,500 |
TOTAL RUSSIA | | 1,053,298 |
Senegal - 0.3% |
Republic of Senegal 8.75% 5/13/21 (e) | | 200,000 | | 219,500 |
Slovenia - 0.5% |
Republic of Slovenia: | | | | |
4.75% 5/10/18 (e) | | 200,000 | | 197,500 |
5.85% 5/10/23 (e) | | 200,000 | | 195,000 |
TOTAL SLOVENIA | | 392,500 |
Sri Lanka - 0.4% |
Democratic Socialist Republic of Sri Lanka 6.25% 10/4/20 (e) | | 300,000 | | 304,500 |
Tanzania - 0.2% |
Tanzania United Republic of 6.3921% 3/8/20 (h) | | 200,000 | | 209,250 |
Turkey - 0.3% |
Turkish Republic 11.875% 1/15/30 | | 165,000 | | 270,188 |
Ukraine - 0.7% |
Ukraine Government: | | | | |
7.5% 4/17/23 (Reg. S) | | 200,000 | | 175,000 |
Government Obligations - continued |
| Principal
Amount (c) | | Value |
Ukraine - continued |
Ukraine Government: - continued | | | | |
7.75% 9/23/20 (e) | | $ 225,000 | | $ 205,583 |
9.25% 7/24/17 (e) | | 200,000 | | 193,500 |
TOTAL UKRAINE | | 574,083 |
United States of America - 0.1% |
U.S. Treasury Bills, yield at date of purchase 0.02% 11/29/13 to 1/2/14 (g) | | 50,000 | | 49,998 |
Venezuela - 0.9% |
Venezuelan Republic 8.5% 10/8/14 | | 815,000 | | 806,035 |
Vietnam - 0.3% |
Vietnamese Socialist Republic 6.75% 1/29/20 (e) | | 200,000 | | 218,750 |
Zambia - 0.2% |
Republic of Zambia 5.375% 9/20/22 (e) | | 200,000 | | 180,500 |
TOTAL GOVERNMENT OBLIGATIONS (Cost $13,106,317) |
13,046,981
|
Money Market Funds - 1.4% |
| Shares | | |
Fidelity Cash Central Fund, 0.09% (b)
(Cost $1,249,619) | 1,249,619 | |
1,249,619
|
TOTAL INVESTMENT PORTFOLIO - 99.8% (Cost $77,648,944) | | 87,397,953 |
NET OTHER ASSETS (LIABILITIES) - 0.2% | | 155,686 |
NET ASSETS - 100% | $ 87,553,639 |
Futures Contracts |
| Expiration
Date | | Underlying
Face Amount
at Value | | Unrealized
Appreciation/
(Depreciation) |
Purchased |
Equity Index Contracts |
6 NYSE E-mini MSCI Emerging Markets Index Contracts (United States) | Dec. 2013 | | $ 307,170 | | $ (9,007) |
|
The face value of futures purchased as a percentage of net assets is 0.4% |
Currency Abbreviations |
MXN | - | Mexican peso |
Legend |
(a) Non-income producing |
(b) Affiliated fund that is generally available only to investment companies and other accounts managed by Fidelity Investments. The rate quoted is the annualized seven-day yield of the fund at period end. A complete unaudited listing of the fund's holdings as of its most recent quarter end is available upon request. In addition, each Fidelity Central Fund's financial statements, which are not covered by the Fund's Report of Independent Registered Public Accounting Firm, are available on the SEC's website or upon request. |
(c) Amount is stated in United States dollars unless otherwise noted. |
(d) Security initially issued at one coupon which converts to a higher coupon at a specified date. The rate shown is the rate at period end. |
(e) Security exempt from registration under Rule 144A of the Securities Act of 1933. These securities may be resold in transactions exempt from registration, normally to qualified institutional buyers. At the end of the period, the value of these securities amounted to $11,444,336 or 13.1% of net assets. |
(f) Security is perpetual in nature with no stated maturity date. |
(g) Security or a portion of the security was pledged to cover margin requirements for futures contracts. At period end, the value of securities pledged amounted to $49,998. |
(h) Coupon rates for floating and adjustable rate securities reflect the rates in effect at period end. |
Affiliated Central Funds |
Information regarding fiscal year to date income earned by the Fund from investments in Fidelity Central Funds is as follows: |
Fund | Income earned |
Fidelity Cash Central Fund | $ 3,903 |
Fidelity Securities Lending Cash Central Fund | 20 |
Total | $ 3,923 |
Other Information |
Categorizations in the Schedule of Investments are based on country or territory of incorporation. |
The following is a summary of the inputs used, as of October 31, 2013, involving the Fund's assets and liabilities carried at fair value. The inputs or methodology used for valuing securities may not be an indication of the risk associated with investing in those securities. For more information on valuation inputs, and their aggregation into the levels used in the table below, please refer to the Investment Valuation section in the accompanying Notes to Financial Statements. |
Valuation Inputs at Reporting Date: |
Description | Total | Level 1 | Level 2 | Level 3 |
Investments in Securities: | | | | |
Equities: | | | | |
Consumer Discretionary | $ 5,671,881 | $ 5,671,881 | $ - | $ - |
Consumer Staples | 5,673,128 | 5,673,128 | - | - |
Energy | 6,824,418 | 6,775,603 | 48,815 | - |
Financials | 17,832,600 | 16,829,611 | 1,002,989 | - |
Health Care | 1,079,535 | 863,737 | 215,798 | - |
Industrials | 4,958,488 | 4,958,488 | - | - |
Information Technology | 11,090,547 | 9,688,994 | 1,401,553 | - |
Materials | 6,822,552 | 6,600,497 | 222,055 | - |
Telecommunication Services | 4,671,214 | 3,902,066 | 769,148 | - |
Utilities | 1,967,084 | 1,704,829 | 262,255 | - |
Corporate Bonds | 6,509,906 | - | 6,509,906 | - |
Government Obligations | 13,046,981 | - | 13,046,981 | - |
Money Market Funds | 1,249,619 | 1,249,619 | - | - |
Total Investments in Securities: | $ 87,397,953 | $ 63,918,453 | $ 23,479,500 | $ - |
Derivative Instruments: | | | | |
Liabilities | | | | |
Futures Contracts | $ (9,007) | $ (9,007) | $ - | $ - |
Value of Derivative Instruments |
The following table is a summary of the Fund's value of derivative instruments by primary risk exposure as of October 31, 2013. For additional information on derivative instruments, please refer to the Derivative Instruments section in the accompanying Notes to Financial Statements. |
Primary Risk Exposure /
Derivative Type | Value |
| Asset | Liability |
Equity Risk | | |
Futures Contracts (a) | $ - | $ (9,007) |
(a) Reflects gross cumulative appreciation (depreciation) on futures contracts as presented in the Schedule of Investments. Only the period end receivable or payable for daily variation margin and net unrealized appreciation (depreciation) are presented in the Statement of Assets and Liabilities. |
Other Information |
The composition of credit quality ratings as a percentage of net assets is as follows (Unaudited): |
AAA,AA,A | 1.0% |
BBB | 6.9% |
BB | 5.5% |
B | 6.0% |
CCC,CC,C | 1.6% |
Not Rated | 1.2% |
Equities | 76.5% |
Short-Term Investments and Net Other Assets | 1.3% |
| 100.0% |
We have used ratings from Moody's Investors Service, Inc. Where Moody's® ratings are not available, we have used S&P® ratings. All ratings are as of the date indicated and do not reflect subsequent changes. Percentages are adjusted for the effect of futures contracts, if applicable. |
See accompanying notes which are an integral part of the financial statements.
Annual Report
Fidelity Total Emerging Markets Fund
Statement of Assets and Liabilities
| October 31, 2013 |
| | |
Assets | | |
Investment in securities, at value - See accompanying schedule: Unaffiliated issuers (cost $76,399,325) | $ 86,148,334 | |
Fidelity Central Funds (cost $1,249,619) | 1,249,619 | |
Total Investments (cost $77,648,944) | | $ 87,397,953 |
Cash | | 42,610 |
Foreign currency held at value (cost $91,066) | | 91,061 |
Receivable for investments sold | | 722,628 |
Receivable for fund shares sold | | 317,152 |
Dividends receivable | | 68,199 |
Interest receivable | | 355,898 |
Distributions receivable from Fidelity Central Funds | | 106 |
Prepaid expenses | | 239 |
Receivable from investment adviser for expense reductions | | 50,718 |
Other receivables | | 6,124 |
Total assets | | 89,052,688 |
| | |
Liabilities | | |
Payable for investments purchased | $ 933,179 | |
Payable for fund shares redeemed | 270,336 | |
Accrued management fee | 57,802 | |
Distribution and service plan fees payable | 12,355 | |
Payable for daily variation margin for derivative instruments | 3,420 | |
Other affiliated payables | 18,570 | |
Custodian fee payable | 140,291 | |
Other payables and accrued expenses | 63,096 | |
Total liabilities | | 1,499,049 |
| | |
Net Assets | | $ 87,553,639 |
Net Assets consist of: | | |
Paid in capital | | $ 80,118,542 |
Undistributed net investment income | | 1,219,736 |
Accumulated undistributed net realized gain (loss) on investments and foreign currency transactions | | (3,516,388) |
Net unrealized appreciation (depreciation) on investments and assets and liabilities in foreign currencies | | 9,731,749 |
Net Assets | | $ 87,553,639 |
See accompanying notes which are an integral part of the financial statements.
Annual Report
Fidelity Total Emerging Markets Fund
Financial Statements - continued
Statement of Assets and Liabilities - continued
| October 31, 2013 |
| | |
Calculation of Maximum Offering Price Class A:
Net Asset Value and redemption price per share ($18,837,427 ÷ 1,657,238 shares) | | $ 11.37 |
| | |
Maximum offering price per share (100/94.25 of $11.37) | | $ 12.06 |
Class T:
Net Asset Value and redemption price per share ($5,967,419 ÷ 526,353 shares) | | $ 11.34 |
| | |
Maximum offering price per share (100/96.50 of $11.34) | | $ 11.75 |
Class C:
Net Asset Value and offering price per share ($7,435,717 ÷ 658,492 shares)A | | $ 11.29 |
| | |
Total Emerging Markets:
Net Asset Value, offering price and redemption price per share ($49,959,436 ÷ 4,383,198 shares) | | $ 11.40 |
| | |
Institutional Class:
Net Asset Value, offering price and redemption price per share ($5,353,640 ÷ 469,800 shares) | | $ 11.40 |
A Redemption price per share is equal to net asset value less any applicable contingent deferred sales charge.
See accompanying notes which are an integral part of the financial statements.
Annual Report
Statement of Operations
| Year ended October 31, 2013 |
| | |
Investment Income | | |
Dividends | | $ 2,210,247 |
Interest | | 1,561,521 |
Income from Fidelity Central Funds | | 3,923 |
Income before foreign taxes withheld | | 3,775,691 |
Less foreign taxes withheld | | (240,765) |
Total income | | 3,534,926 |
| | |
Expenses | | |
Management fee | $ 884,762 | |
Transfer agent fees | 222,603 | |
Distribution and service plan fees | 128,889 | |
Accounting and security lending fees | 56,973 | |
Custodian fees and expenses | 410,719 | |
Independent trustees' compensation | 654 | |
Registration fees | 70,912 | |
Audit | 81,699 | |
Legal | 281 | |
Interest | 253 | |
Miscellaneous | 998 | |
Total expenses before reductions | 1,858,743 | |
Expense reductions | (223,996) | 1,634,747 |
Net investment income (loss) | | 1,900,179 |
Realized and Unrealized Gain (Loss) Net realized gain (loss) on: | | |
Investment securities: | | |
Unaffiliated issuers (net of foreign taxes of $30,003) | (1,717,551) | |
Investment not meeting investment restrictions | 922 | |
Foreign currency transactions | (84,114) | |
Futures contracts | (77,497) | |
Total net realized gain (loss) | | (1,878,240) |
Change in net unrealized appreciation (depreciation) on: Investment securities (net of decrease in deferred foreign taxes of $54,244) | 1,880,839 | |
Assets and liabilities in foreign currencies | 415 | |
Futures contracts | (9,007) | |
Total change in net unrealized appreciation (depreciation) | | 1,872,247 |
Net gain (loss) | | (5,993) |
Net increase (decrease) in net assets resulting from operations | | $ 1,894,186 |
See accompanying notes which are an integral part of the financial statements.
Annual Report
Fidelity Total Emerging Markets Fund
Financial Statements - continued
Statement of Changes in Net Assets
| Year ended
October 31,
2013 | For the period
November 1, 2011
(commencement of
operations) to
October 31, 2012 |
Increase (Decrease) in Net Assets | | |
Operations | | |
Net investment income (loss) | $ 1,900,179 | $ 1,612,877 |
Net realized gain (loss) | (1,878,240) | (1,586,062) |
Change in net unrealized appreciation (depreciation) | 1,872,247 | 7,859,502 |
Net increase (decrease) in net assets resulting
from operations | 1,894,186 | 7,886,317 |
Distributions to shareholders from net investment income | (1,561,667) | (96,645) |
Distributions to shareholders from net realized gain | (137,352) | - |
Total distributions | (1,699,019) | (96,645) |
Share transactions - net increase (decrease) | (15,755,086) | 95,209,478 |
Redemption fees | 87,191 | 27,217 |
Total increase (decrease) in net assets | (15,472,728) | 103,026,367 |
| | |
Net Assets | | |
Beginning of period | 103,026,367 | - |
End of period (including undistributed net investment income of $1,219,736 and undistributed net investment income of $1,406,377, respectively) | $ 87,553,639 | $ 103,026,367 |
See accompanying notes which are an integral part of the financial statements.
Annual Report
Financial Highlights - Class A
Years ended October 31, | 2013 | 2012 G |
Selected Per-Share Data | | |
Net asset value, beginning of period | $ 10.86 | $ 10.00 |
Income from Investment Operations | | |
Net investment income (loss) C | .18 | .20 |
Net realized and unrealized gain (loss) | .48 F | .68 |
Total from investment operations | .66 | .88 |
Distributions from net investment income | (.15) | (.02) |
Distributions from net realized gain | (.01) | - |
Total distributions | (.16) | (.02) |
Redemption fees added to paid in capital C | .01 | - I |
Net asset value, end of period | $ 11.37 | $ 10.86 |
Total Return A, B | 6.23% | 8.80% |
Ratios to Average Net Assets D, H | | |
Expenses before reductions | 1.89% | 1.87% |
Expenses net of fee waivers, if any | 1.65% | 1.65% |
Expenses net of all reductions | 1.62% | 1.62% |
Net investment income (loss) | 1.61% | 1.92% |
Supplemental Data | | |
Net assets, end of period (000 omitted) | $ 18,837 | $ 7,675 |
Portfolio turnover rate E | 120% | 70% |
A Total returns would have been lower if certain expenses had not been reduced during the applicable periods shown.
B Total returns do not include the effect of the sales charges.
C Calculated based on average shares outstanding during the period.
D Fees and expenses of any underlying Fidelity Central Funds are not included in the Fund's expense ratio. The Fund indirectly bears its proportionate share of the expenses of any underlying Fidelity Central Funds.
E Amount does not include the portfolio activity of any underlying Fidelity Central Funds.
F The amount shown for a share outstanding does not correspond with the aggregate net gain (loss) on investments for the period due to the timing of sales and repurchases of shares in relation to fluctuating market values of the investments of the Fund.
G For the period November 1, 2011 (commencement of operations) to October 31, 2012.
H Expense ratios reflect operating expenses of the class. Expenses before reductions do not reflect amounts reimbursed by the investment adviser or reductions from brokerage service arrangements or reductions from other expense offset arrangements and do not represent the amount paid by the class during periods when reimbursements or reductions occur. Expense ratios before reductions for start-up periods may not be representative of longer-term operating periods. Expenses net of fee waivers reflect expenses after reimbursement by the investment adviser but prior to reductions from brokerage service arrangements or other expense offset arrangements. Expenses net of all reductions represent the net expenses paid by the class.
I Amount represents less than $.01 per share.
See accompanying notes which are an integral part of the financial statements.
Annual Report
Financial Highlights - Class T
Years ended October 31, | 2013 | 2012 G |
Selected Per-Share Data | | |
Net asset value, beginning of period | $ 10.84 | $ 10.00 |
Income from Investment Operations | | |
Net investment income (loss) C | .15 | .17 |
Net realized and unrealized gain (loss) | .48 F | .68 |
Total from investment operations | .63 | .85 |
Distributions from net investment income | (.12) | (.01) |
Distributions from net realized gain | (.01) | - |
Total distributions | (.14) J | (.01) |
Redemption fees added to paid in capital C | .01 | - I |
Net asset value, end of period | $ 11.34 | $ 10.84 |
Total Return A, B | 5.93% | 8.56% |
Ratios to Average Net Assets D, H | | |
Expenses before reductions | 2.13% | 2.10% |
Expenses net of fee waivers, if any | 1.90% | 1.90% |
Expenses net of all reductions | 1.88% | 1.87% |
Net investment income (loss) | 1.36% | 1.67% |
Supplemental Data | | |
Net assets, end of period (000 omitted) | $ 5,967 | $ 5,823 |
Portfolio turnover rate E | 120% | 70% |
A Total returns would have been lower if certain expenses had not been reduced during the applicable periods shown.
B Total returns do not include the effect of the sales charges.
C Calculated based on average shares outstanding during the period.
D Fees and expenses of any underlying Fidelity Central Funds are not included in the Fund's expense ratio. The Fund indirectly bears its proportionate share of the expenses of any underlying Fidelity Central Funds.
E Amount does not include the portfolio activity of any underlying Fidelity Central Funds.
F The amount shown for a share outstanding does not correspond with the aggregate net gain (loss) on investments for the period due to the timing of sales and repurchases of shares in relation to fluctuating market values of the investments of the Fund.
G For the period November 1, 2011 (commencement of operations) to October 31, 2012.
H Expense ratios reflect operating expenses of the class. Expenses before reductions do not reflect amounts reimbursed by the investment adviser or reductions from brokerage service arrangements or reductions from other expense offset arrangements and do not represent the amount paid by the class during periods when reimbursements or reductions occur. Expense ratios before reductions for start-up periods may not be representative of longer-term operating periods. Expenses net of fee waivers reflect expenses after reimbursement by the investment adviser but prior to reductions from brokerage service arrangements or other expense offset arrangements. Expenses net of all reductions represent the net expenses paid by the class.
I Amount represents less than $.01 per share.
J Total distributions of $.14 per share is comprised of distributions from net investment income of $.124 and distributions from net realized gain of $.014 per share.
See accompanying notes which are an integral part of the financial statements.
Annual Report
Financial Highlights - Class C
Years ended October 31, | 2013 | 2012 G |
Selected Per-Share Data | | |
Net asset value, beginning of period | $ 10.80 | $ 10.00 |
Income from Investment Operations | | |
Net investment income (loss) C | .09 | .12 |
Net realized and unrealized gain (loss) | .47 F | .69 |
Total from investment operations | .56 | .81 |
Distributions from net investment income | (.07) | (.01) |
Distributions from net realized gain | (.01) | - |
Total distributions | (.08) | (.01) |
Redemption fees added to paid in capital C | .01 | - I |
Net asset value, end of period | $ 11.29 | $ 10.80 |
Total Return A, B | 5.31% | 8.07% |
Ratios to Average Net Assets D, H | | |
Expenses before reductions | 2.65% | 2.63% |
Expenses net of fee waivers, if any | 2.40% | 2.40% |
Expenses net of all reductions | 2.37% | 2.37% |
Net investment income (loss) | .86% | 1.17% |
Supplemental Data | | |
Net assets, end of period (000 omitted) | $ 7,436 | $ 5,824 |
Portfolio turnover rate E | 120% | 70% |
A Total returns would have been lower if certain expenses had not been reduced during the applicable periods shown.
B Total returns do not include the effect of the contingent deferred sales charge.
C Calculated based on average shares outstanding during the period.
D Fees and expenses of any underlying Fidelity Central Funds are not included in the Fund's expense ratio. The Fund indirectly bears its proportionate share of the expenses of any underlying Fidelity Central Funds.
E Amount does not include the portfolio activity of any underlying Fidelity Central Funds.
F The amount shown for a share outstanding does not correspond with the aggregate net gain (loss) on investments for the period due to the timing of sales and repurchases of shares in relation to fluctuating market values of the investments of the Fund.
G For the period November 1, 2011 (commencement of operations) to October 31, 2012.
H Expense ratios reflect operating expenses of the class. Expenses before reductions do not reflect amounts reimbursed by the investment adviser or reductions from brokerage service arrangements or reductions from other expense offset arrangements and do not represent the amount paid by the class during periods when reimbursements or reductions occur. Expense ratios before reductions for start-up periods may not be representative of longer-term operating periods. Expenses net of fee waivers reflect expenses after reimbursement by the investment adviser but prior to reductions from brokerage service arrangements or other expense offset arrangements. Expenses net of all reductions represent the net expenses paid by the class.
I Amount represents less than $.01 per share.
See accompanying notes which are an integral part of the financial statements.
Annual Report
Financial Highlights - Total Emerging Markets
Years ended October 31, | 2013 | 2012 F |
Selected Per-Share Data | | |
Net asset value, beginning of period | $ 10.89 | $ 10.00 |
Income from Investment Operations | | |
Net investment income (loss) B | .21 | .22 |
Net realized and unrealized gain (loss) | .47 E | .69 |
Total from investment operations | .68 | .91 |
Distributions from net investment income | (.17) | (.02) |
Distributions from net realized gain | (.01) | - |
Total distributions | (.18) | (.02) |
Redemption fees added to paid in capital B | .01 | - H |
Net asset value, end of period | $ 11.40 | $ 10.89 |
Total Return A | 6.44% | 9.15% |
Ratios to Average Net Assets C, G | | |
Expenses before reductions | 1.56% | 1.60% |
Expenses net of fee waivers, if any | 1.40% | 1.40% |
Expenses net of all reductions | 1.38% | 1.38% |
Net investment income (loss) | 1.85% | 2.16% |
Supplemental Data | | |
Net assets, end of period (000 omitted) | $ 49,959 | $ 81,416 |
Portfolio turnover rate D | 120% | 70% |
A Total returns would have been lower if certain expenses had not been reduced during the applicable periods shown.
B Calculated based on average shares outstanding during the period.
C Fees and expenses of any underlying Fidelity Central Funds are not included in the Fund's expense ratio. The Fund indirectly bears its proportionate share of the expenses of any underlying Fidelity Central Funds.
D Amount does not include the portfolio activity of any underlying Fidelity Central Funds.
E The amount shown for a share outstanding does not correspond with the aggregate net gain (loss) on investments for the period due to the timing of sales and repurchases of shares in relation to fluctuating market values of the investments of the Fund.
F For the period November 1, 2011 (commencement of operations) to October 31, 2012.
G Expense ratios reflect operating expenses of the class. Expenses before reductions do not reflect amounts reimbursed by the investment adviser or reductions from brokerage service arrangements or reductions from other expense offset arrangements and do not represent the amount paid by the class during periods when reimbursements or reductions occur. Expense ratios before reductions for start-up periods may not be representative of longer-term operating periods. Expenses net of fee waivers reflect expenses after reimbursement by the investment adviser but prior to reductions from brokerage service arrangements or other expense offset arrangements. Expenses net of all reductions represent the net expenses paid by the class.
H Amount represents less than $.01 per share.
See accompanying notes which are an integral part of the financial statements.
Annual Report
Financial Highlights - Institutional Class
Years ended October 31, | 2013 | 2012 F |
Selected Per-Share Data | | |
Net asset value, beginning of period | $ 10.89 | $ 10.00 |
Income from Investment Operations | | |
Net investment income (loss) B | .20 | .22 |
Net realized and unrealized gain (loss) | .48 E | .69 |
Total from investment operations | .68 | .91 |
Distributions from net investment income | (.17) | (.02) |
Distributions from net realized gain | (.01) | - |
Total distributions | (.18) | (.02) |
Redemption fees added to paid in capital B | .01 | - H |
Net asset value, end of period | $ 11.40 | $ 10.89 |
Total Return A | 6.44% | 9.15% |
Ratios to Average Net Assets C, G | | |
Expenses before reductions | 1.63% | 1.62% |
Expenses net of fee waivers, if any | 1.40% | 1.40% |
Expenses net of all reductions | 1.37% | 1.37% |
Net investment income (loss) | 1.86% | 2.17% |
Supplemental Data | | |
Net assets, end of period (000 omitted) | $ 5,354 | $ 2,287 |
Portfolio turnover rate D | 120% | 70% |
A Total returns would have been lower if certain expenses had not been reduced during the applicable periods shown.
B Calculated based on average shares outstanding during the period.
C Fees and expenses of any underlying Fidelity Central Funds are not included in the Fund's expense ratio. The Fund indirectly bears its proportionate share of the expenses of any underlying Fidelity Central Funds.
D Amount does not include the portfolio activity of any underlying Fidelity Central Funds.
E The amount shown for a share outstanding does not correspond with the aggregate net gain (loss) on investments for the period due to the timing of sales and repurchases of shares in relation to fluctuating market values of the investments of the Fund.
F For the period November 1, 2011 (commencement of operations) to October 31, 2012.
G Expense ratios reflect operating expenses of the class. Expenses before reductions do not reflect amounts reimbursed by the investment adviser or reductions from brokerage service arrangements or reductions from other expense offset arrangements and do not represent the amount paid by the class during periods when reimbursements or reductions occur. Expense ratios before reductions for start-up periods may not be representative of longer-term operating periods. Expenses net of fee waivers reflect expenses after reimbursement by the investment adviser but prior to reductions from brokerage service arrangements or other expense offset arrangements. Expenses net of all reductions represent the net expenses paid by the class.
H Amount represents less than $.01 per share.
See accompanying notes which are an integral part of the financial statements.
Annual Report
Fidelity Total Emerging Markets Fund
Notes to Financial Statements
For the period ended October 31, 2013
1. Organization.
Fidelity Total Emerging Markets Fund (the Fund) is a fund of Fidelity Investment Trust (the Trust) and is authorized to issue an unlimited number of shares. The Trust is registered under the Investment Company Act of 1940, as amended (the 1940 Act), as an open-end management investment company organized as a Massachusetts business trust. The Fund offers Class A, Class T, Class C, Total Emerging Markets and Institutional Class shares, each of which has equal rights as to assets and voting privileges. Each class has exclusive voting rights with respect to matters that affect that class. The Fund's investments in emerging markets can be subject to social, economic, regulatory, and political uncertainties and can be extremely volatile.
2. Investments in Fidelity Central Funds.
The Fund invests in Fidelity Central Funds, which are open-end investment companies generally available only to other investment companies and accounts managed by Fidelity Management & Research Company (FMR) and its affiliates. The Fund's Schedule of Investments lists each of the Fidelity Central Funds held as of period end, if any, as an investment of the Fund, but does not include the underlying holdings of each Fidelity Central Fund. As an Investing Fund, the Fund indirectly bears its proportionate share of the expenses of the underlying Fidelity Central Funds.
The Money Market Central Funds seek preservation of capital and current income and are managed by Fidelity Investments Money Management, Inc. (FIMM), an affiliate of FMR.
A complete unaudited list of holdings for each Fidelity Central Fund is available upon request or at the Securities and Exchange Commission (the SEC) website at www.sec.gov. In addition, the financial statements of the Fidelity Central Funds, which are not covered by the Fund's Report of Independent Registered Public Accounting Firm, are available on the SEC website or upon request.
3. Significant Accounting Policies.
The financial statements have been prepared in conformity with accounting principles generally accepted in the United States of America (GAAP), which require management to make certain estimates and assumptions at the date of the financial statements. Actual results could differ from those estimates. Subsequent events, if any, through the date that the financial statements were issued have been evaluated in the preparation of the financial statements. The following summarizes the significant accounting policies of the Fund:
Investment Valuation. Investments are valued as of 4:00 p.m. Eastern time on the last calendar day of the period. In accordance with valuation policies and procedures
Annual Report
Fidelity Total Emerging Markets Fund
Notes to Financial Statements - continued
3. Significant Accounting Policies - continued
Investment Valuation - continued
approved by the Board of Trustees (the Board), the Fund attempts to obtain prices from one or more third party pricing vendors or brokers to value its investments. When current market prices, quotations or currency exchange rates are not readily available or reliable, investments will be fair valued in good faith by the FMR Fair Value Committee (the Committee), in accordance with procedures adopted by the Board. Factors used in determining fair value vary by investment type and may include market or investment specific events, changes in interest rates and credit quality. The frequency with which these procedures are used cannot be predicted and they may be utilized to a significant extent. The Committee oversees the Fund's valuation policies and procedures and is responsible for approving and reporting to the Board all fair value determinations.
The Fund categorizes the inputs to valuation techniques used to value its investments into a disclosure hierarchy consisting of three levels as shown below:
Level 1 - quoted prices in active markets for identical investments
Level 2 - other significant observable inputs (including quoted prices for similar investments, interest rates, prepayment speeds, etc.)
Level 3 - unobservable inputs (including the Fund's own assumptions based on the best information available)
Valuation techniques used to value the Fund's investments by major category are as follows:
Equity securities, including restricted securities, for which market quotations are readily available, are valued at the last reported sale price or official closing price as reported by a third party pricing vendor on the primary market or exchange on which they are traded and are categorized as Level 1 in the hierarchy. In the event there were no sales during the day or closing prices are not available, securities are valued at the last quoted bid price or may be valued using the last available price and are generally categorized as Level 2 in the hierarchy. For foreign equity securities, when market or security specific events arise, comparisons to the valuation of American Depositary Receipts (ADRs), futures contracts, Exchange-Traded Funds (ETFs) and certain indexes as well as quoted prices for similar securities may be used and would be categorized as Level 2 in the hierarchy. Utilizing these techniques may result in transfers between Level 1 and Level 2. For equity securities, including restricted securities, where observable inputs are limited, assumptions about market activity and risk are used and these securities may be categorized as Level 3 in the hierarchy.
Debt securities, including restricted securities, are valued based on evaluated prices received from third party pricing vendors or from brokers who make markets in such
Annual Report
3. Significant Accounting Policies - continued
Investment Valuation - continued
securities. For corporate bonds and foreign government and government agency obligations, pricing vendors utilize matrix pricing which considers yield or price of bonds of comparable quality, coupon, maturity and type as well as broker-supplied prices. When independent prices are unavailable or unreliable, debt securities may be valued utilizing pricing methodologies which consider similar factors that would be used by third party pricing vendors. Debt securities are generally categorized as Level 2 in the hierarchy but may be Level 3 depending on the circumstances.
Futures contracts are valued at the settlement price or official closing price established each day by the board of trade or exchange on which they are traded and are categorized as Level 1 in the hierarchy. Investments in open-end mutual funds, including the Fidelity Central Funds, are valued at their closing net asset value (NAV) each business day and are categorized as Level 1 in the hierarchy.
Changes in valuation techniques may result in transfers in or out of an assigned level within the disclosure hierarchy. The aggregate value of investments by input level, as of October 31, 2013, is included at the end of the Fund's Schedule of Investments.
Foreign Currency. The Fund may use foreign currency contracts to facilitate transactions in foreign-denominated securities. Gains and losses from these transactions may arise from changes in the value of the foreign currency or if the counterparties do not perform under the contracts' terms.
Foreign-denominated assets, including investment securities, and liabilities are translated into U.S. dollars at the exchange rates at period end. Purchases and sales of investment securities, income and dividends received and expenses denominated in foreign currencies are translated into U.S. dollars at the exchange rate in effect on the transaction date.
The effects of exchange rate fluctuations on investments are included with the net realized and unrealized gain (loss) on investment securities. Other foreign currency transactions resulting in realized and unrealized gain (loss) are disclosed separately.
Investment Transactions and Income. For financial reporting purposes, the Fund's investment holdings and NAV include trades executed through the end of the last business day of the period. The NAV per share for processing shareholder transactions is calculated as of the close of business of the New York Stock Exchange (NYSE), normally 4:00 p.m. Eastern time and includes trades executed through the end of the prior business day. Gains and losses on securities sold are determined on the basis of identified cost. Dividend income is recorded on the ex-dividend date, except for certain dividends from foreign securities where the ex-dividend date may have passed, which are recorded
Annual Report
Fidelity Total Emerging Markets Fund
Notes to Financial Statements - continued
3. Significant Accounting Policies - continued
Investment Transactions and Income - continued
as soon as the Fund is informed of the ex-dividend date. Non-cash dividends included in dividend income, if any, are recorded at the fair market value of the securities received. Distributions received on securities that represent a return of capital or capital gain are recorded as a reduction of cost of investments and/or as a realized gain. Subsequent to ex-dividend date the Fund determines the components of these distributions, based upon receipt of tax filings or other correspondence relating to the underlying investment. Interest income and distributions from the Fidelity Central Funds are accrued as earned. Interest income includes coupon interest and amortization of premium and accretion of discount on debt securities. Investment income is recorded net of foreign taxes withheld where recovery of such taxes is uncertain.
Class Allocations and Expenses. Investment income, realized and unrealized capital gains and losses, common expenses of the Fund, and certain fund-level expense reductions, if any, are allocated daily on a pro-rata basis to each class based on the relative net assets of each class to the total net assets of the Fund. Each class differs with respect to transfer agent and distribution and service plan fees incurred. Certain expense reductions may also differ by class. For the reporting period, the allocated portion of income and expenses to each class as a percent of its average net assets may vary due to the timing of recording these transactions in relation to fluctuating net assets of the classes. Expenses directly attributable to a fund are charged to that fund. Expenses attributable to more than one fund are allocated among the respective funds on the basis of relative net assets or other appropriate methods. Expense estimates are accrued in the period to which they relate and adjustments are made when actual amounts are known.
Income Tax Information and Distributions to Shareholders. Each year, the Fund intends to qualify as a regulated investment company under Subchapter M of the Internal Revenue Code, including distributing substantially all of its taxable income and realized gains. As a result, no provision for U.S. Federal income taxes is required. As of October 31, 2013, the Fund did not have any unrecognized tax benefits in the financial statements; nor is the Fund aware of any tax positions for which it is reasonably possible that the total amounts of unrecognized tax benefits will significantly change in the next twelve months. The Fund files a U.S. federal tax return, in addition to state and local tax returns as required. The Fund's federal income tax returns are subject to examination by the Internal Revenue Service (IRS) for a period of three fiscal years after they are filed. State and local tax returns may be subject to examination for an additional fiscal year depending on the jurisdiction. Foreign taxes are provided for based on the Fund's understanding of the tax rules and rates that exist in the foreign markets in which it invests. The Fund is subject to a tax imposed on capital gains by certain countries in which it invests. An estimated deferred tax liability for net unrealized appreciation on
Annual Report
3. Significant Accounting Policies - continued
Income Tax Information and Distributions to Shareholders - continued
the applicable securities is included in Other payables and accrued expenses on the Statement of Assets & Liabilities.
Distributions are declared and recorded on the ex-dividend date. Income dividends and capital gain distributions are declared separately for each class. Income and capital gain distributions are determined in accordance with income tax regulations, which may differ from GAAP. In addition, the Fund claimed a portion of the payment made to redeeming shareholders as a distribution for income tax purposes.
Capital accounts within the financial statements are adjusted for permanent book-tax differences. These adjustments have no impact on net assets or the results of operations. Temporary book-tax differences will reverse in a subsequent period.
Book-tax differences are primarily due to futures transactions, foreign currency transactions, certain foreign taxes, passive foreign investment companies (PFIC), market discount, capital loss carry forwards and losses deferred due to wash sales.
The federal tax cost of investment securities and unrealized appreciation (depreciation) as of period end were as follows:
Gross unrealized appreciation | $ 12,054,189 |
Gross unrealized depreciation | (2,823,600) |
Net unrealized appreciation (depreciation) on securities and other investments | $ 9,230,589 |
| |
Tax Cost | $ 78,167,364 |
The tax-based components of distributable earnings as of period end were as follows:
Undistributed ordinary income | $ 1,161,940 |
Capital loss carryforward | $ (2,949,184) |
Net unrealized appreciation (depreciation) | $ 9,230,033 |
Capital loss carryforwards are only available to offset future capital gains of the Fund to the extent provided by regulations and may be limited. Under the Regulated Investment Company Modernization Act of 2010 (the Act), the Fund is permitted to carry forward capital losses incurred in taxable years beginning after December 22, 2010 for an unlimited period and such capital losses are required to be used prior to any losses that expire.
Annual Report
Fidelity Total Emerging Markets Fund
Notes to Financial Statements - continued
3. Significant Accounting Policies - continued
Income Tax Information and Distributions to Shareholders - continued
The capital loss carryforward information presented below, including any applicable limitation, is estimated as of fiscal period end and is subject to adjustment.
No expiration | |
Short-term | $ (2,949,184) |
The tax character of distributions paid was as follows:
| October 31, 2013 | October 31, 2012 |
Ordinary Income | $ 1,699,019 | $ 96,645 |
Short-Term Trading (Redemption) Fees. Shares held by investors in the Fund less than 90 days may have been subject to a redemption fee equal to 1.50% of the net asset value of shares redeemed. All redemption fees, which reduce the proceeds of the shareholder redemption, are retained by the Fund and accounted for as an addition to paid in capital.
Restricted Securities. The Fund may invest in securities that are subject to legal or contractual restrictions on resale. These securities generally may be resold in transactions exempt from registration or to the public if the securities are registered. Disposal of these securities may involve time-consuming negotiations and expense, and prompt sale at an acceptable price may be difficult. Information regarding restricted securities is included at the end of the Fund's Schedule of Investments.
New Accounting Pronouncement. The Financial Accounting Standards Board issued in December 2011, Accounting Standard Update No. 2011-11, Disclosures about Offsetting Assets and Liabilities, and in January 2013, Accounting Standards Update No. 2013-1 Clarifying the Scope of Disclosures about Offsetting Assets and Liabilities. These updates create new disclosure requirements requiring entities to disclose both gross and net information for derivatives and other financial instruments that are either offset in the Statement of Assets and Liabilities or subject to an enforceable master netting arrangement or similar agreement. The disclosure requirements are effective for annual reporting periods beginning on or after January 1, 2013, and interim periods within those annual periods. Management expects that the impact of the updates' adoption will be limited to additional financial statement disclosures as applicable.
4. Derivative Instruments.
Risk Exposures and the Use of Derivative Instruments. The Fund's investment objective allows the Fund to enter into various types of derivative contracts, including futures contracts. Derivatives are investments whose value is primarily derived from
Annual Report
4. Derivative Instruments - continued
Risk Exposures and the Use of Derivative Instruments - continued
underlying assets, indices or reference rates and may be transacted on an exchange or over-the-counter (OTC). Derivatives may involve a future commitment to buy or sell a specified asset based on specified terms, to exchange future cash flows at periodic intervals based on a notional principal amount, or for one party to make one or more payments upon the occurrence of specified events in exchange for periodic payments from the other party.
The Fund used derivatives to increase returns and to manage exposure to certain risks as defined below. The success of any strategy involving derivatives depends on analysis of numerous economic factors, and if the strategies for investment do not work as intended, the Fund may not achieve its objectives.
The Fund's use of derivatives increased or decreased its exposure to the following risk:
Equity Risk | Equity risk relates to the fluctuations in the value of financial instruments as a result of changes in market prices (other than those arising from interest rate risk or foreign exchange risk), whether caused by factors specific to an individual investment, its issuer, or all factors affecting all instruments traded in a market or market segment. |
The Fund is also exposed to additional risks from investing in derivatives, such as liquidity risk and counterparty credit risk. Liquidity risk is the risk that the Fund will be unable to close out the derivative in the open market in a timely manner. Counterparty credit risk is the risk that the counterparty will not be able to fulfill its obligation to the Fund. Counterparty credit risk related to exchange-traded futures contracts may be mitigated by the protection provided by the exchange on which they trade.
Investing in derivatives may involve greater risks than investing in the underlying assets directly and, to varying degrees, may involve risk of loss in excess of any initial investment and collateral received and amounts recognized in the Statement of Assets and Liabilities. In addition, there may be the risk that the change in value of the derivative contract does not correspond to the change in value of the underlying instrument.
Futures Contracts. A futures contract is an agreement between two parties to buy or sell a specified underlying instrument for a fixed price at a specified future date. The Fund used futures contracts to manage its exposure to the stock market.
Upon entering into a futures contract, a fund is required to deposit either cash or securities (initial margin) with a clearing broker in an amount equal to a certain percentage of the face value of the contract. Futures contracts are marked-to-market daily and subsequent daily payments (variation margin) are made or received by a fund depending on
Annual Report
Fidelity Total Emerging Markets Fund
Notes to Financial Statements - continued
4. Derivative Instruments - continued
Futures Contracts - continued
the daily fluctuations in the value of the futures contracts and are recorded as unrealized appreciation or (depreciation). This receivable and/or payable, if any, is included in daily variation margin for derivative instruments in the Statement of Assets and Liabilities. Realized gain or (loss) is recorded upon the expiration or closing of a futures contract.
Any open futures contracts at period end are presented in the Schedule of Investments under the caption "Futures Contracts." The underlying face amount at value reflects each contract's exposure to the underlying instrument or index at period end and is representative of activity for the period. Securities deposited to meet initial margin requirements are identified in the Schedule of Investments.
During the period the Fund recognized net realized gain (loss) of $(77,497) and a change in net unrealized appreciation (depreciation) of $(9,007) related to its investment in futures contracts. These amounts are included in the Statement of Operations.
5. Purchases and Sales of Investments.
Purchases and sales of securities, other than short-term securities, aggregated $127,907,727 and $141,712,892, respectively.
The Fund realized a gain on the sale of an investment not meeting the investment restrictions of the Fund.
6. Fees and Other Transactions with Affiliates.
Management Fee. FMR and its affiliates provide the Fund with investment management related services for which the Fund pays a monthly management fee. The management fee is the sum of an individual fund fee rate that is based on an annual rate of .55% of the Fund's average net assets and an annualized group fee rate that averaged .25% during the period. The group fee rate is based upon the average net assets of all the mutual funds advised by FMR, including any mutual funds previously advised by FMR that are currently advised by Fidelity SelectCo, LLC, an affiliate of FMR. The group fee rate decreases as assets under management increase and increases as assets under management decrease. For the reporting period, the total annual management fee rate was .81% of the Fund's average net assets.
Distribution and Service Plan Fees. In accordance with Rule 12b-1 of the 1940 Act, the Fund has adopted separate Distribution and Service Plans for each class of shares. Certain classes pay Fidelity Distributors Corporation (FDC), an affiliate of FMR, separate Distribution and Service Fees, each of which is based on an annual percentage of each class' average net assets. In addition, FDC may pay financial intermediaries for selling shares of the Fund and providing shareholder support services. For the period,
Annual Report
6. Fees and Other Transactions with Affiliates - continued
Distribution and Service Plan Fees - continued
the Distribution and Service Fee rates, total fees and amounts retained by FDC were as follows:
| Distribution
Fee | Service
Fee | Total Fees | Retained
by FDC |
Class A | -% | .25% | $ 35,394 | $ 11,702 |
Class T | .25% | .25% | 31,862 | 11,312 |
Class C | .75% | .25% | 61,633 | 54,524 |
| | | $ 128,889 | $ 77,538 |
Sales Load. FDC may receive a front-end sales charge of up to 5.75% for selling Class A shares and 3.50% for selling Class T shares, some of which is paid to financial intermediaries for selling shares of the Fund. Depending on the holding period, FDC may receive contingent deferred sales charges levied on Class A, Class T, and Class C redemptions. The deferred sales charges range from 1.00% for Class C shares, 1.00% for certain purchases of Class A shares and .25% for certain purchases of Class T shares.
For the period, sales charge amounts retained by FDC were as follows:
| Retained
by FDC |
Class A | $ 13,119 |
Class T | 3,441 |
Class C* | 578 |
| $ 17,138 |
* When Class C shares are initially sold, FDC pays commissions from its own resources to financial intermediaries through which the sales are made.
Transfer Agent Fees. Fidelity Investments Institutional Operations Company, Inc., (FIIOC), an affiliate of FMR, is the transfer, dividend disbursing and shareholder servicing agent for each class of the Fund. FIIOC receives account fees and asset-based fees that vary according to the account size and type of account of the shareholders of the respective classes of the Fund. FIIOC pays for typesetting, printing and mailing of shareholder reports, except proxy statements.
Annual Report
Fidelity Total Emerging Markets Fund
Notes to Financial Statements - continued
6. Fees and Other Transactions with Affiliates - continued
Transfer Agent Fees - continued
For the period, transfer agent fees for each class were as follows:
| Amount | % of
Average
Net Assets |
Class A | $ 31,225 | .22 |
Class T | 15,225 | .24 |
Class C | 15,227 | .25 |
Total Emerging Markets | 153,704 | .19 |
Institutional Class | 7,222 | .19 |
| $ 222,603 | |
Accounting and Security Lending Fees. Fidelity Service Company, Inc. (FSC), an affiliate of FMR, maintains the Fund's accounting records. The accounting fee is based on the level of average net assets for each month. Under a separate contract, FSC administers the security lending program. The security lending fee is based on the number and duration of lending transactions.
Brokerage Commissions. The Fund placed a portion of its portfolio transactions with brokerage firms which are affiliates of the investment adviser. Brokerage commissions are included in net realized gain (loss) and change in net unrealized appreciation (depreciation) in the Statement of Operations. The commissions paid to these affiliated firms were $996 for the period.
Interfund Lending Program. Pursuant to an Exemptive Order issued by the SEC, the Fund, along with other registered investment companies having management contracts with FMR, may participate in an interfund lending program. This program provides an alternative credit facility allowing the funds to borrow from, or lend money to, other participating affiliated funds. At period end, there were no interfund loans outstanding. The Fund's activity in this program during the period for which loans were outstanding was as follows:
Borrower or Lender | Average Loan
Balance | Weighted Average
Interest Rate | Interest
Expense |
Borrower | $ 3,919,500 | .39% | $ 253 |
7. Committed Line of Credit.
The Fund participates with other funds managed by FMR or an affiliate in a $4.25 billion credit facility (the "line of credit") to be utilized for temporary or emergency purposes to fund shareholder redemptions or for other short-term liquidity purposes. The Fund has
Annual Report
7. Committed Line of Credit - continued
agreed to pay commitment fees on its pro-rata portion of the line of credit, which amounted to $248 and is reflected in Miscellaneous expenses on the Statement of Operations. During the period, there were no borrowings on this line of credit.
8. Security Lending.
The Fund lends portfolio securities through a lending agent from time to time in order to earn additional income. For equity securities, a lending agent is used and may loan securities to certain qualified borrowers, including Fidelity Capital Markets (FCM), a broker-dealer affiliated with the Fund. On the settlement date of the loan, the Fund receives collateral (in the form of U.S. Treasury obligations, letters of credit and/or cash) against the loaned securities and maintains collateral in an amount not less than 100% of the market value of the loaned securities during the period of the loan. The market value of the loaned securities is determined at the close of business of the Fund and any additional required collateral is delivered to the Fund on the next business day. If the borrower defaults on its obligation to return the securities loaned because of insolvency or other reasons, the Fund may apply collateral received from the borrower against the obligation. The Fund may experience delays and costs in recovering the securities loaned. Any cash collateral received is invested in the Fidelity Securities Lending Cash Central Fund. At period end, there were no security loans outstanding. Security lending income represents the income earned on investing cash collateral, less rebates paid to borrowers and any lending agent fees associated with the loan, plus any premium payments received for lending certain types of securities. Security lending income is presented in the Statement of Operations as a component of income from Fidelity Central Funds. Total security lending income during the period amounted to $20. During the period, there were no securities loaned to FCM.
9. Expense Reductions.
FMR contractually agreed to reimburse each class to the extent annual operating expenses exceeded certain levels of average net assets as noted in the table below. This reimbursement will remain in place through December 31, 2014. Some expenses, for example interest expense, including commitment fees, are excluded from this reimbursement.
Annual Report
Fidelity Total Emerging Markets Fund
Notes to Financial Statements - continued
9. Expense Reductions - continued
The following classes were in reimbursement during the period:
| Expense
Limitations | Reimbursement |
| | |
Class A | 1.65% | $ 33,991 |
Class T | 1.90% | 14,907 |
Class C | 2.40% | 15,690 |
Total Emerging Markets | 1.40% | 123,344 |
Institutional Class | 1.40% | 8,511 |
| | $ 196,443 |
In addition, FMR reimbursed a portion of the Fund's operating expenses during the period in the amount of $426.
Commissions paid to certain brokers with whom FMR, or its affiliates, places trades on behalf of the Fund include an amount in addition to trade execution, which may be rebated back to the Fund to offset certain expenses. This amount totaled $26,904 for the period. In addition, through arrangements with the Fund's custodian, credits realized as a result of uninvested cash balances were used to reduce the Fund's expenses. During the period, these credits reduced the Fund's custody expenses by $223.
10. Distributions to Shareholders.
Distributions to shareholders of each class were as follows:
Years ended October 31, | 2013 | 2012 A |
From net investment income | | |
Class A | $ 104,565 | $ 9,099 |
Class T | 69,282 | 4,204 |
Class C | 35,970 | 3,000 |
Total Emerging Markets | 1,316,259 | 75,940 |
Institutional Class | 35,591 | 4,402 |
Total | $ 1,561,667 | $ 96,645 |
From net realized gain | | |
Class A | $ 10,027 | $ - |
Class T | 7,822 | - |
Class C | 7,516 | - |
Total Emerging Markets | 109,039 | - |
Institutional Class | 2,948 | - |
Total | $ 137,352 | $ - |
A For the period November 1, 2011 (commencement of operations) to October 31, 2012.
Annual Report
11. Share Transactions.
Transactions for each class of shares were as follows:
| Shares | Dollars |
Years ended October 31, | 2013 | 2012 A | 2013 | 2012 A |
Class A | | | | |
Shares sold | 1,550,621 | 723,537 | $ 17,267,543 | $ 7,311,002 |
Reinvestment of distributions | 9,656 | 949 | 105,541 | 9,099 |
Shares redeemed | (609,546) | (17,979) | (6,666,165) | (179,387) |
Net increase (decrease) | 950,731 | 706,507 | $ 10,706,919 | $ 7,140,714 |
Class T | | | | |
Shares sold | 277,882 | 597,107 | $ 3,114,089 | $ 6,082,522 |
Reinvestment of distributions | 7,041 | 439 | 76,883 | 4,204 |
Shares redeemed | (295,695) | (60,421) | (3,268,261) | (637,924) |
Net increase (decrease) | (10,772) | 537,125 | $ (77,289) | $ 5,448,802 |
Class C | | | | |
Shares sold | 431,831 | 540,321 | $ 4,824,945 | $ 5,429,037 |
Reinvestment of distributions | 3,973 | 314 | 43,420 | 3,000 |
Shares redeemed | (316,804) | (1,143) | (3,521,280) | (12,081) |
Net increase (decrease) | 119,000 | 539,492 | $ 1,347,085 | $ 5,419,956 |
Total Emerging Markets | | | | |
Shares sold | 5,085,608 | 8,901,615 | $ 57,439,168 | $ 89,854,661 |
Reinvestment of distributions | 113,766 | 7,686 | 1,243,462 | 73,759 |
Shares redeemed | (8,294,710) | (1,430,767) | (89,232,029) | (14,834,512) |
Net increase (decrease) | (3,095,336) | 7,478,534 | $ (30,549,399) | $ 75,093,908 |
Institutional Class | | | | |
Shares sold | 491,268 | 209,638 | $ 5,357,985 | $ 2,101,696 |
Reinvestment of distributions | 3,526 | 459 | 38,539 | 4,402 |
Shares redeemed | (235,091) | - | (2,578,926) | - |
Net increase (decrease) | 259,703 | 210,097 | $ 2,817,598 | $ 2,106,098 |
A For the period November 1, 2011 (commencement of operations) to October 31, 2012.
12. Other.
The Fund's organizational documents provide former and current trustees and officers with a limited indemnification against liabilities arising in connection with the performance of their duties to the Fund. In the normal course of business, the Fund may also enter into contracts that provide general indemnifications. The Fund's maximum exposure under these arrangements is unknown as this would be dependent on future
Annual Report
Fidelity Total Emerging Markets Fund
Notes to Financial Statements - continued
12. Other - continued
claims that may be made against the Fund. The risk of material loss from such claims is considered remote.
At the end of the period, FMR or its affiliates were the owners of record of 16% of the total outstanding shares of the Fund.
Annual Report
To the Trustees of Fidelity Investment Trust and the Shareholders of Fidelity Total Emerging Markets Fund:
In our opinion, the accompanying statement of assets and liabilities, including the schedule of investments, and the related statements of operations and of changes in net assets and the financial highlights present fairly, in all material respects, the financial position of Fidelity Total Emerging Markets Fund (a fund of Fidelity Investment Trust) at October 31, 2013, the results of its operations for the year then ended, the changes in its net assets for the period indicated and the financial highlights for each of the periods indicated, in conformity with accounting principles generally accepted in the United States of America. These financial statements and financial highlights (hereafter referred to as "financial statements") are the responsibility of the Fidelity Total Emerging Markets Fund's management. Our responsibility is to express an opinion on these financial statements based on our audits. We conducted our audits of these financial statements in accordance with the standards of the Public Company Accounting Oversight Board (United States). Those standards require that we plan and perform the audit to obtain reasonable assurance about whether the financial statements are free of material misstatement. An audit includes examining, on a test basis, evidence supporting the amounts and disclosures in the financial statements, assessing the accounting principles used and significant estimates made by management, and evaluating the overall financial statement presentation. We believe that our audits, which included confirmation of securities at October 31, 2013 by correspondence with the custodian and brokers, provide a reasonable basis for our opinion.
PricewaterhouseCoopers LLP
Boston, Massachusetts
December 17, 2013
Annual Report
The Trustees, Member of the Advisory Board, and executive officers of the trust and fund, as applicable, are listed below. The Board of Trustees governs the fund and is responsible for protecting the interests of shareholders. The Trustees are experienced executives who meet periodically throughout the year to oversee the fund's activities, review contractual arrangements with companies that provide services to the fund, oversee management of the risks associated with such activities and contractual arrangements, and review the fund's performance. Except for James C. Curvey, Ned C. Lautenbach, Ronald P. O'Hanley, and William S. Stavropoulos, each of the Trustees oversees 171 funds. Mr. Curvey oversees 394 funds. Mr. Lautenbach, Mr. O'Hanley, and Mr. Stavropoulos each oversees 245 funds.
The Trustees hold office without limit in time except that (a) any Trustee may resign; (b) any Trustee may be removed by written instrument, signed by at least two-thirds of the number of Trustees prior to such removal; (c) any Trustee who requests to be retired or who has become incapacitated by illness or injury may be retired by written instrument signed by a majority of the other Trustees; and (d) any Trustee may be removed at any special meeting of shareholders by a two-thirds vote of the outstanding voting securities of the trust. Each Trustee who is not an interested person of the trust and the fund (as defined in the 1940 Act) (Independent Trustee), shall retire not later than the last day of the calendar year in which his or her 75th birthday occurs. The Independent Trustees may waive this mandatory retirement age policy with respect to individual Trustees. The executive officers and Advisory Board Member hold office without limit in time, except that any officer and Advisory Board Member may resign or may be removed by a vote of a majority of the Trustees at any regular meeting or any special meeting of the Trustees. Except as indicated, each individual has held the office shown or other offices in the same company for the past five years.
Experience, Skills, Attributes, and Qualifications of the Fund's Trustees. The Governance and Nominating Committee has adopted a statement of policy that describes the experience, qualifications, attributes, and skills that are necessary and desirable for potential Independent Trustee candidates (Statement of Policy). The Board believes that each Trustee satisfied at the time he or she was initially elected or appointed a Trustee, and continues to satisfy, the standards contemplated by the Statement of Policy. The Governance and Nominating Committee also engages professional search firms to help identify potential Independent Trustee candidates who have the experience, qualifications, attributes, and skills consistent with the Statement of Policy. From time to time, additional criteria based on the composition and skills of the current Independent Trustees, as well as experience or skills that may be appropriate in light of future changes to board composition, business conditions, and regulatory or other developments, have also been considered by the professional search firms and the Governance and Nominating Committee. In addition, the Board takes into account the Trustees' commitment and participation in Board and committee meetings, as well as their leadership of standing and ad hoc committees throughout their tenure.
Annual Report
Trustees and Officers - continued
In determining that a particular Trustee was and continues to be qualified to serve as a Trustee, the Board has considered a variety of criteria, none of which, in isolation, was controlling. The Board believes that, collectively, the Trustees have balanced and diverse experience, qualifications, attributes, and skills, which allow the Board to operate effectively in governing the fund and protecting the interests of shareholders. Information about the specific experience, skills, attributes, and qualifications of each Trustee, which in each case led to the Board's conclusion that the Trustee should serve (or continue to serve) as a trustee of the fund, is provided below.
Board Structure and Oversight Function. James C. Curvey is an interested person (as defined in the 1940 Act) and currently serves as Chairman. The Trustees have determined that an interested Chairman is appropriate and benefits shareholders because an interested Chairman has a personal and professional stake in the quality and continuity of services provided to the fund. Independent Trustees exercise their informed business judgment to appoint an individual of their choosing to serve as Chairman, regardless of whether the Trustee happens to be independent or a member of management. The Independent Trustees have determined that they can act independently and effectively without having an Independent Trustee serve as Chairman and that a key structural component for assuring that they are in a position to do so is for the Independent Trustees to constitute a substantial majority for the Board. The Independent Trustees also regularly meet in executive session. Ned C. Lautenbach serves as Chairman of the Independent Trustees and as such (i) acts as a liaison between the Independent Trustees and management with respect to matters important to the Independent Trustees and (ii) with management prepares agendas for Board meetings.
Fidelity funds are overseen by different Boards of Trustees. The fund's Board oversees Fidelity's equity and high income funds and another Board oversees Fidelity's investment-grade bond, money market, and asset allocation funds. The asset allocation funds may invest in Fidelity funds overseen by the fund's Board. The use of separate Boards, each with its own committee structure, allows the Trustees of each group of Fidelity funds to focus on the unique issues of the funds they oversee, including common research, investment, and operational issues. On occasion, the separate Boards establish joint committees to address issues of overlapping consequences for the Fidelity funds overseen by each Board.
The Trustees operate using a system of committees to facilitate the timely and efficient consideration of all matters of importance to the Trustees, the fund, and fund shareholders and to facilitate compliance with legal and regulatory requirements and oversight of the fund's activities and associated risks. The Board, acting through its committees, has charged FMR and its affiliates with (i) identifying events or circumstances the occurrence of which could have demonstrably adverse effects on the fund's business and/or reputation; (ii) implementing processes and controls to lessen the possibility that such events or circumstances occur or to mitigate the effects of such events or circumstances if they do occur; and (iii) creating and maintaining a system designed to evaluate continuously business and market conditions in order to facilitate the identification and implementation processes described in (i) and (ii) above. Because the day-to-day operations and activities of the fund are carried out by or through FMR, its affiliates and other service providers, the fund's exposure to risks is mitigated but not eliminated by the processes overseen by the Trustees. While each of the Board's committees has responsibility for overseeing different aspects of the fund's activities, oversight is exercised primarily through the Operations, Audit, and Compliance Committees. In addition, the Independent Trustees have worked with FMR to enhance the Board's oversight of investment and financial risks, legal and regulatory risks, technology risks, and operational risks, including the development of additional risk reporting to the Board. For example, a working group comprised of Independent Trustees and FMR has worked and continues to work to review the Fidelity funds' valuation-related activities, reporting and risk management. Appropriate personnel, including but not limited to the fund's Chief Compliance Officer (CCO), FMR's internal auditor, the independent accountants, the fund's Treasurer and portfolio management personnel, make periodic reports to the Board's committees, as appropriate, including an annual review of FMR's risk management program for the Fidelity funds. The responsibilities of each standing committee, including their oversight responsibilities, are described further under "Standing Committees of the Fund's Trustees."
Annual Report
The fund's Statement of Additional Information (SAI) includes more information about the Trustees. To request a free copy, call Fidelity at 1-877-208-0098.
Interested Trustees*:
Correspondence intended for each Trustee who is an interested person may be sent to Fidelity Investments, 245 Summer Street, Boston, Massachusetts 02210.
Name, Year of Birth; Principal Occupations and Other Relevant Experience+ |
James C. Curvey (1935) |
Year of Election or Appointment: 2007 Trustee Chairman of the Board of Trustees |
| Mr. Curvey also serves as Trustee of other Fidelity funds. Mr. Curvey is a Director of Fidelity Investments Money Management, Inc. (2009-present), Director of Fidelity Research & Analysis Co. (2009-present) and Director of FMR and FMR Co., Inc. (2007-present). Mr. Curvey is also Vice Chairman (2007-present) and Director of FMR LLC. In addition, Mr. Curvey serves as an Overseer for the Boston Symphony Orchestra and a member of the Trustees of Villanova University. Previously, Mr. Curvey was the Vice Chairman (2006-2007) and Director (2000-2007) of FMR Corp. |
Ronald P. O'Hanley (1957) |
Year of Election or Appointment: 2011 Trustee |
| Mr. O'Hanley also serves as Trustee of other Fidelity funds. He is Director of Fidelity SelectCo, LLC (2013-present), FMR Co., Inc. (2010-present), Director of Fidelity Investments Money Management, Inc. (2010-present), Director of Fidelity Research & Analysis Company (2010-present), President of Fidelity Asset Management and Corporate Services and a Member of Fidelity's Executive Committee (2010-present). Previously, Mr. O'Hanley served as President and Chief Executive Officer of BNY Mellon Asset Management (2007-2010). Mr. O'Hanley also served as Vice Chairman of Bank New York Mellon Corp. and a member of that firm's Executive Committee. Prior to the 2007 merger of The Bank of New York and Mellon Financial Corporation, he was Vice Chairman of Mellon Financial Corporation and President and Chief Executive Officer of Mellon Asset Management. He joined Mellon in February 1997. Mr. O'Hanley currently serves as Chairman of the Boston Public Library Foundation Board of Directors and sits on the Board of Directors of Beth Israel Deaconess Medical Center, the Board of Trustees of the Marine Biological Laboratory and the Advisory Board of the Maxwell School of Citizenship and Public Administration at Syracuse University. Mr. O'Hanley also chairs the Council on Asset Management for the Financial Services Roundtable and is a member of the Board of Directors of Institutional Investor's U.S. Institute. |
* Trustees have been determined to be "Interested Trustees" by virtue of, among other things, their affiliation with the trust or various entities under common control with FMR.
+ The information above includes each Trustee's principal occupation during the last five years and other information relating to the experience, attributes, and skills relevant to each Trustee's qualifications to serve as a Trustee, which led to the conclusion that each Trustee should serve as a Trustee for the fund.
Annual Report
Independent Trustees:
Correspondence intended for each Independent Trustee (that is, the Trustees other than the Interested Trustees) may be sent to Fidelity Investments, P.O. Box 55235, Boston, Massachusetts 02205-5235.
Name, Year of Birth; Principal Occupations and Other Relevant Experience+ |
Dennis J. Dirks (1948) |
Year of Election or Appointment: 2005 Trustee |
| Mr. Dirks also serves as Trustee of other Fidelity funds. Prior to his retirement in May 2003, Mr. Dirks was Chief Operating Officer and a member of the Board of The Depository Trust & Clearing Corporation (DTCC). He also served as President, Chief Operating Officer, and Board member of The Depository Trust Company (DTC) and President and Board member of the National Securities Clearing Corporation (NSCC). In addition, Mr. Dirks served as Chief Executive Officer and Board member of the Government Securities Clearing Corporation, Chief Executive Officer and Board member of the Mortgage-Backed Securities Clearing Corporation, as a Trustee and a member of the Finance Committee of Manhattan College (2005-2008), and as a Trustee and a member of the Finance Committee of AHRC of Nassau County (2006-2008). Mr. Dirks is a member of the Independent Directors Council (IDC) Governing Council (2010-present) and Board of Directors for The Brookville Center for Children's Services, Inc. (2009-present). |
Alan J. Lacy (1953) |
Year of Election or Appointment: 2008 Trustee |
| Mr. Lacy also serves as Trustee of other Fidelity funds. Mr. Lacy serves as Senior Adviser (2007-present) of Oak Hill Capital Partners, L.P. (private equity). Mr. Lacy also served as Chief Executive Officer (2000-2005) and Vice Chairman (2005-2006) of Sears Holdings Corporation and Sears, Roebuck and Co. (retail). In addition, Mr. Lacy serves as a member of the Board of Directors of Dave & Buster's Entertainment, Inc. (restaurant and entertainment complexes, 2010-present), Earth Fare, Inc. (retail grocery, 2012-present), The Hillman Companies, Inc. (hardware wholesalers, 2010-present), and Bristol-Myers Squibb Company (global pharmaceuticals, 2008-present). Mr. Lacy is a member of the Board of Trustees of The National Parks Conservation Association (2006-present). Previously, Mr. Lacy served as Chairman of the Board of Trustees of the National Parks Conservation Association (2008-2011) and as a member of the Board of Directors for the Western Union Company (global money transfer, 2006-2011). |
Ned C. Lautenbach (1944) |
Year of Election or Appointment: 2000 Trustee Chairman of the Independent Trustees |
| Mr. Lautenbach also serves as Trustee of other Fidelity funds. Mr. Lautenbach currently serves as the Lead Director of the Eaton Corporation Board of Directors (diversified industrial, 1997-present). Mr. Lautenbach is Chairman of the Board of Directors of the Philharmonic Center for the Arts in Naples, Florida (2012-present) and a member of the Council on Foreign Relations (1994-present). Previously, Mr. Lautenbach was a Partner/Advisory Partner at Clayton, Dubilier & Rice, LLC (private equity investment, 1998-2010), as well as a Director of Sony Corporation (2006-2007). |
Joseph Mauriello (1944) |
Year of Election or Appointment: 2008 Trustee |
| Mr. Mauriello also serves as Trustee of other Fidelity funds. Prior to his retirement in January 2006, Mr. Mauriello served in numerous senior management positions including Deputy Chairman and Chief Operating Officer (2004-2005), and Vice Chairman of Financial Services (2002-2004) of KPMG LLP US (professional services, 1965-2005). Mr. Mauriello currently serves as a member of the Board of Directors of XL Group plc. (global insurance and re-insurance, 2006-present). Previously, Mr. Mauriello served as a Director of the Hamilton Funds of the Bank of New York (2006-2007) and of Arcadia Resources Inc. (health care services and products, 2007-2012). |
Robert W. Selander (1950) |
Year of Election or Appointment: 2011 Trustee |
| Mr. Selander also serves as Trustee of other Fidelity funds. Previously, Mr. Selander served as a Member of the Advisory Board of other Fidelity funds (2011), and Executive Vice Chairman (2010), Chief Executive Officer (2009-2010), and President and Chief Executive Officer (1997-2009) of Mastercard, Inc. |
Cornelia M. Small (1944) |
Year of Election or Appointment: 2005 Trustee |
| Ms. Small also serves as Trustee of other Fidelity funds. Ms. Small is a member of the Board of Directors (2009-present) and Chair of the Investment Committee (2010-present) of the Teagle Foundation. Ms. Small also serves on the Investment Committee of the Berkshire Taconic Community Foundation (2008-present). Previously, Ms. Small served as Chairperson (2002-2008) and a member of the Investment Committee and Chairperson (2008-2012) and a member of the Board of Trustees of Smith College. In addition, Ms. Small served as Chief Investment Officer, Director of Global Equity Investments, and a member of the Board of Directors of Scudder, Stevens & Clark and Scudder Kemper Investments. |
William S. Stavropoulos (1939) |
Year of Election or Appointment: 2001 Trustee Vice Chairman of the Independent Trustees |
| Mr. Stavropoulos also serves as Trustee of other Fidelity funds. Mr. Stavropoulos serves as President and Founder of the Michigan Baseball Foundation, the Great Lakes Loons (2007-present). Mr. Stavropoulos is Chairman Emeritus of the Board of Directors of The Dow Chemical Company, where he previously served in numerous senior management positions, including President, CEO (1995-2000; 2002-2004), Chairman of the Executive Committee (2000-2006), and as a member of the Board of Directors (1990-2006). Currently, Mr. Stavropoulos is Chairman of the Board of Directors of Univar Inc. (global distributor of commodity and specialty chemicals), a Director of Teradata Corporation (data warehousing and technology solutions), and Maersk Inc. (industrial conglomerate), and a member of the Advisory Board for Metalmark Capital LLC (private equity investment, 2005-present). Mr. Stavropoulos is an operating advisor to Clayton, Dubilier & Rice, LLC (private equity investment). In addition, Mr. Stavropoulos is a member of the University of Notre Dame Advisory Council for the College of Science, a Trustee of the Rollin L. Gerstacker Foundation, and a Director of the Naples Philharmonic Center for the Arts. Previously, Mr. Stavropoulos served as a Director of Chemical Financial Corporation (bank holding company, 1993-2012) and Tyco International, Ltd. (multinational manufacturing and services, 2007-2012). |
David M. Thomas (1949) |
Year of Election or Appointment: 2008 Trustee |
| Mr. Thomas also serves as Trustee of other Fidelity funds. Mr. Thomas serves as Non-Executive Chairman of the Board of Directors of Fortune Brands Home and Security (home and security products, 2011-present), and as a member of the Board of Directors of Interpublic Group of Companies, Inc. (marketing communication, 2004-present). Previously, Mr. Thomas served as Executive Chairman (2005-2006) and Chairman and Chief Executive Officer (2000-2005) of IMS Health, Inc. (pharmaceutical and healthcare information solutions), and a Director of Fortune Brands, Inc. (consumer products, 2000-2011). |
+ The information above includes each Trustee's principal occupation during the last five years and other information relating to the experience, attributes, and skills relevant to each Trustee's qualifications to serve as a Trustee, which led to the conclusion that each Trustee should serve as a Trustee for the fund.
Advisory Board Member and Executive Officers:
Correspondence intended for each executive officer and Peter S. Lynch may be sent to Fidelity Investments, 245 Summer Street, Boston, Massachusetts 02210. Executive officers appear below in alphabetical order.
Name, Year of Birth; Principal Occupation |
Peter S. Lynch (1944) |
Year of Election or Appointment: 2003 Member of the Advisory Board |
| Mr. Lynch also serves as Member of the Advisory Board of other Fidelity funds. Mr. Lynch is Vice Chairman and a Director of FMR and FMR Co., Inc. In addition, Mr. Lynch serves as a Trustee of Boston College and as the Chairman of the Inner-City Scholarship Fund. Previously, Mr. Lynch served on the Special Olympics International Board of Directors (1997-2006). |
Elizabeth Paige Baumann (1968) |
Year of Election or Appointment: 2012 Anti-Money Laundering (AML) Officer |
| Ms. Baumann also serves as AML Officer of other funds. She is Chief AML Officer of FMR LLC (2012-present) and is an employee of Fidelity Investments. Previously, Ms. Baumann served as Vice President and Deputy Anti-Money Laundering Officer (2007-2012). |
William C. Coffey (1969) |
Year of Election or Appointment: 2009 Assistant Secretary |
| Mr. Coffey also serves as Assistant Secretary of other funds. He is Senior Vice President and Deputy General Counsel of FMR LLC (2010-present), and is an employee of Fidelity Investments. Previously, Mr. Coffey served as Vice President and Associate General Counsel of FMR LLC (2005-2009). |
Jonathan Davis (1968) |
Year of Election or Appointment: 2010 Assistant Treasurer |
| Mr. Davis also serves as Assistant Treasurer of other funds. Mr. Davis is an employee of Fidelity Investments. Previously, Mr. Davis served as Vice President and Associate General Counsel of FMR LLC (2003-2010). |
Adrien E. Deberghes (1967) |
Year of Election or Appointment: 2008 Deputy Treasurer |
| Mr. Deberghes also serves as an officer of other funds. He is an employee of Fidelity Investments (2008-present). Prior to joining Fidelity Investments, Mr. Deberghes was Senior Vice President of Mutual Fund Administration at State Street Corporation (2007-2008), Senior Director of Mutual Fund Administration at Investors Bank & Trust (2005-2007), and Director of Finance for Dunkin' Brands (2000-2005). |
Stephanie J. Dorsey (1969) |
Year of Election or Appointment: 2010 Assistant Treasurer |
| Ms. Dorsey also serves as an officer of other funds. She is an employee of Fidelity Investments (2008-present) and has served in other fund officer roles. Prior to joining Fidelity Investments, Ms. Dorsey served as Treasurer (2004-2008) of the JPMorgan Mutual Funds and Vice President (2004-2008) of JPMorgan Chase Bank. |
Scott C. Goebel (1968) |
Year of Election or Appointment: 2008 Secretary and Chief Legal Officer (CLO) |
| Mr. Goebel serves as Secretary and CLO of other funds. Mr. Goebel also serves as Secretary of Fidelity Investments Money Management, Inc. (FIMM) (2010-present) and Fidelity Research and Analysis Company (FRAC) (2010-present); General Counsel, Secretary, and Senior Vice President of FMR (2008-present) and FMR Co., Inc. (2008-present); Chief Legal Officer of Fidelity Management & Research (Hong Kong) Limited (2008-present) and Assistant Secretary of Fidelity Management & Research (Japan) Inc. (2008-present), and Fidelity Management & Research (U.K.) Inc. (2008-present). Previously, Mr. Goebel served as Secretary and CLO of other Fidelity funds (2008-2013), Assistant Secretary of FIMM (2008-2010), FRAC (2008-2010), and certain funds (2007-2008); and as Vice President and Secretary of Fidelity Distributors Corporation (FDC) (2005-2007). Mr. Goebel has been employed by FMR LLC or an affiliate since 2001. |
Joseph A. Hanlon (1968) |
Year of Election or Appointment: 2012 Chief Compliance Officer |
| Mr. Hanlon also serves as Chief Compliance Officer of other funds. Mr. Hanlon serves as Compliance Officer of FMR, FMR Co., Inc., Fidelity Investments Money Management, Inc. (FIMM), Fidelity Research and Analysis Company (FRAC), and Fidelity Management & Research (Hong Kong) (2009-present), as Senior Vice President of the Fidelity Asset Management Division (2009-present), and is an employee of Fidelity Investments. Previously, Mr. Hanlon served as Compliance Officer of Fidelity Management & Research (Japan) Inc. (2009-2013), Strategic Advisers, Inc. (2009-2013), and Fidelity Management & Research (U.K.) Inc. (2009-2013). |
Bruce T. Herring (1965) |
Year of Election or Appointment: 2006 Vice President of certain Equity Funds |
| Mr. Herring also serves as Vice President of other funds. He serves as Chief Investment Officer of Fidelity Global Asset Allocation (GAA) (2013-present), Chief Investment Officer and Director of Fidelity Management & Research (U.K.) Inc. (2010-present), Group Chief Investment Officer of FMR, and President of Fidelity Research & Analysis Company (2010-present). Previously, Mr. Herring served as Vice President (2005-2006) and Senior Vice President (2006-2007) of Fidelity Management & Research Company, Vice President of FMR Co., Inc. (2001-2007), and as a portfolio manager for Fidelity U.S. Equity Funds. |
Brian B. Hogan (1964) |
Year of Election or Appointment: 2009 Vice President |
| Mr. Hogan also serves as Vice President of other funds. Mr. Hogan serves as President of FMR's Equity Division (2009-present). Previously, Mr. Hogan served as Senior Vice President, Equity Research of FMR (2006-2009) and as a portfolio manager. |
Chris Maher (1972) |
Year of Election or Appointment: 2013 Assistant Treasurer |
| Mr. Maher serves as Assistant Treasurer of other funds. Mr. Maher is Vice President of Valuation Oversight and is an employee of Fidelity Investments. Previously, Mr. Maher served as Vice President of Asset Management Compliance (2013), Vice President of FMR's Program Management Group (2010-2013), and Vice President of Valuation Oversight (2008-2010). |
Christine Reynolds (1958) |
Year of Election or Appointment: 2008 Chief Financial Officer |
| Ms. Reynolds also serves as Chief Financial Officer of other funds. Ms. Reynolds became President of Fidelity Pricing and Cash Management Services (FPCMS) in August 2008. Ms. Reynolds served as Chief Operating Officer of FPCMS (2007-2008). Previously, Ms. Reynolds served as President, Treasurer, and Anti-Money Laundering officer of the Fidelity funds (2004-2007). |
Kenneth B. Robins (1969) |
Year of Election or Appointment: 2008 President and Treasurer |
| Mr. Robins also serves as an officer of other funds. Mr. Robins serves as Executive Vice President of Fidelity Investments Money Management, Inc. (FIMM) (2013-present) and is an employee of Fidelity Investments (2004-present). Previously, Mr. Robins served in other fund officer roles. |
Gary W. Ryan (1958) |
Year of Election or Appointment: 2005 Assistant Treasurer |
| Mr. Ryan also serves as Assistant Treasurer of other funds. Mr. Ryan is an employee of Fidelity Investments and has served in other fund officer roles. Previously, Mr. Ryan served as Vice President of Fund Reporting in Fidelity Pricing and Cash Management Services (FPCMS) (1999-2005). |
Stephen Sadoski (1971) |
Year of Election or Appointment: 2012 Deputy Treasurer |
| Mr. Sadoski also serves as Deputy Treasurer of other funds. He is an employee of Fidelity Investments (2012-present) and has served in another fund officer role. Prior to joining Fidelity Investments, Mr. Sadoski served as an assistant chief accountant in the Division of Investment Management of the Securities and Exchange Commission (SEC) (2009-2012) and as a senior manager at Deloitte & Touche LLP (1997-2009). |
Stacie M. Smith (1974) |
Year of Election or Appointment: 2013 Deputy Treasurer |
| Ms. Smith also serves as an officer of other funds. She is an employee of Fidelity Investments (2009-present) and has served in other fund officer roles. Prior to joining Fidelity Investments, Ms. Smith served as Senior Audit Manager of Ernst & Young LLP (1996-2009). |
Renee Stagnone (1975) |
Year of Election or Appointment: 2013 Deputy Treasurer |
| Ms. Stagnone also serves as Deputy Treasurer of other funds. Ms. Stagnone is an employee of Fidelity Investments. |
Joseph F. Zambello (1957) |
Year of Election or Appointment: 2011 Deputy Treasurer |
| Mr. Zambello also serves as Deputy Treasurer of other funds. Mr. Zambello is an employee of Fidelity Investments. Previously, Mr. Zambello served as Vice President of FMR's Program Management Group (2009-2011) and Vice President of the Transfer Agent Oversight Group (2005-2009). |
Annual Report
Class A designates 71%; Class T designates 82%; and Class C designates 100% of the dividends distributed during the fiscal year as amounts which may be taken into account as a dividend for purposes of the maximum rate under section 1(h)(11) of the Internal Revenue Code.
The amounts per share which represent income derived from sources within, and taxes paid to, foreign countries or possessions of the United States are as follows:
| Pay Date | Income | Taxes |
Class A | 12/10/12 | $0.155 | $0.0157 |
Class T | 12/10/12 | $0.135 | $0.0157 |
Class C | 12/10/12 | $0.085 | $0.0157 |
The fund will notify shareholders in January 2014 of amounts for use in preparing 2013 income tax returns.
Annual Report
Board Approval of Investment Advisory Contracts and Management Fees
Fidelity Total Emerging Markets Fund
Each year, the Board of Trustees, including the Independent Trustees (together, the Board), votes on the renewal of the management contract and sub-advisory agreements (together, the Advisory Contracts) for the fund. The Board, assisted by the advice of fund counsel and Independent Trustees' counsel, requests and considers a broad range of information relevant to the renewal of the Advisory Contracts throughout the year.
The Board meets regularly and, at each of its meetings, covers an extensive agenda of topics and materials and considers factors that are relevant to its annual consideration of the renewal of the fund's Advisory Contracts, including the services and support provided to the fund and its shareholders. The Board has established various standing committees, each composed of and chaired by Independent Trustees with varying backgrounds, to which the Board has assigned specific subject matter responsibilities in order to enhance effective decision-making by the Board. The Board, acting directly and through its Committees, requests and receives information concerning the annual consideration of the renewal of the fund's Advisory Contracts. The Board also meets as needed to consider matters specifically related to the Board's annual consideration of the renewal of Advisory Contracts. Members of the Board may also meet with trustees of other Fidelity funds through ad hoc joint committees to discuss certain matters relevant to the Fidelity funds.
At its July 2013 meeting, the Board, including the Independent Trustees, unanimously determined to renew the fund's Advisory Contracts. In reaching its determination, the Board considered all factors it believed relevant, including (i) the nature, extent, and quality of the services to be provided to the fund and its shareholders (including the investment performance of the fund); (ii) the competitiveness of the fund's management fee and total expense ratio relative to peer funds; (iii) the total costs of the services to be provided by and the profits to be realized by Fidelity from its relationship with the fund; (iv) the extent to which economies of scale exist and would be realized as the fund grows; and (v) whether fee levels reflect these economies of scale, if any, for the benefit of fund shareholders.
In considering whether to renew the Advisory Contracts for the fund, the Board reached a determination, with the assistance of fund counsel and Independent Trustees' counsel and through the exercise of its business judgment, that the renewal of the Advisory Contracts was in the best interests of the fund and its shareholders and that the compensation payable under the Advisory Contracts was fair and reasonable. The Board's decision to renew the Advisory Contracts was not based on any single factor, but rather was based on a comprehensive consideration of all the information provided to the Board at its meetings throughout the year. The Board, in reaching its determination to renew the Advisory Contracts, was aware that shareholders in the fund have a broad range of investment choices available to them, including a wide choice among mutual funds offered by Fidelity's competitors, and that the fund's shareholders, who have the opportunity to review and weigh the disclosure provided by the fund in its prospectus and other public disclosures, have chosen to invest in this fund, which is a part of the Fidelity family of funds.
Annual Report
Nature, Extent, and Quality of Services Provided. The Board considered the staffing within the investment adviser, Fidelity Management & Research Company (FMR), and the sub-advisers (together, the Investment Advisers) as it relates to the fund, including the backgrounds of the fund's investment personnel, and also considered the fund's investment objective, strategies, and related investment philosophy. The Independent Trustees also had discussions with senior management of Fidelity's investment operations and investment groups. The Board considered the structure of the portfolio manager compensation program and whether this structure provides appropriate incentives to act in the best interests of the fund.
Resources Dedicated to Investment Management and Support Services. The Board and the Fund Oversight and Research Committees reviewed the general qualifications and capabilities of the Investment Advisers' investment staff, including its size, education, experience, and resources, as well as the Investment Advisers' approach to recruiting, training, managing, and compensating investment personnel. The Board noted that FMR has continued to increase the resources devoted to non-U.S. offices, including expansion of Fidelity's global investment organization. The Board also noted that Fidelity's analysts have extensive resources, tools and capabilities that allow them to conduct sophisticated quantitative and fundamental analysis, as well as credit analysis of issuers, counterparties and guarantors. Further, the Board believes that Fidelity's investment professionals have sufficient access to global information and data so as to provide competitive investment results over time, and that those professionals also have access to sophisticated tools that permit them to assess portfolio construction and risk and performance attribution characteristics continuously, as well as to transmit new information and research conclusions rapidly around the world. Additionally, in its deliberations, the Board considered the Investment Advisers' trading and risk management capabilities and resources, which are an integral part of the investment management process.
Shareholder and Administrative Services. The Board considered (i) the nature, extent, quality, and cost of advisory, administrative, and shareholder services performed by the Investment Advisers and their affiliates under the Advisory Contracts and under separate agreements covering transfer agency, pricing and bookkeeping, and securities lending services for the fund; (ii) the nature and extent of the supervision of third party service providers, principally custodians and subcustodians; and (iii) the resources devoted to, and the record of compliance with, the fund's compliance policies and procedures. The Board also reviewed the allocation of fund brokerage, including allocations to brokers affiliated with the Investment Advisers, the use of brokerage commissions to pay fund expenses, and the use of "soft" commission dollars to pay for research services.
Annual Report
Board Approval of Investment Advisory Contracts and
Management Fees - continued
The Board noted that the growth of fund assets over time across the complex allows Fidelity to reinvest in the development of services designed to enhance the value or convenience of the Fidelity funds as investment vehicles. These services include 24-hour access to account information and market information through telephone representatives and over the Internet, investor education materials and asset allocation tools, and the expanded availability of Fidelity Investor Centers.
Investment in a Large Fund Family. The Board considered the benefits to shareholders of investing in a Fidelity fund, including the benefits of investing in a fund that is part of a large family of funds offering a variety of investment disciplines and providing a large variety of mutual fund investor services. The Board noted that Fidelity had taken, or had made recommendations that resulted in the Fidelity funds taking, a number of actions over the previous year that benefited particular funds, including (i) continuing to dedicate additional resources to investment research and to the support of the senior management team that oversees asset management; (ii) persisting in efforts to enhance Fidelity's global research capabilities; (iii) launching new funds and making other enhancements to meet client needs for global and income-oriented solutions; (iv) continuing to launch dedicated lower cost underlying funds to meet portfolio construction needs related to expanding underlying fund options for Fidelity funds of funds, specifically for the Freedom Fund product lines; (v) rationalizing product lines and gaining increased efficiencies through the mergers of several funds into other funds; (vi) strengthening Fidelity's index fund offerings by reducing investment minimums and adopting or lowering existing expense caps for certain funds and classes; (vii) enhancing Global Asset Allocation product offerings by launching new funds and strategies, including "open architecture" target date funds that utilize affiliated and unaffiliated sub-advisers; (viii) modifying the eligibility criteria for Institutional Class shares of Advisor funds to increase their marketability to a portion of the defined contribution plan market; (ix) creating a new low-cost retirement share class for certain Advisor funds to appeal to large retirement plans; (x) transitioning the management of certain Fidelity commodity funds to Geode Capital Management LLC, a registered commodity pool operator, while retaining administrative responsibilities for the funds; (xi) reorganizing a number of funds; and (xii) taking steps toward establishing a new Fidelity adviser to manage sector-based funds and products.
Investment Performance. The Board considered whether the fund has operated in accordance with its investment objective, as well as its record of compliance with its investment restrictions and its performance history.
The Board took into account discussions with the Investment Advisers about fund investment performance that occur at Board meetings throughout the year. In this regard the Board noted that as part of regularly scheduled fund reviews and other reports to the Board on fund performance, the Board periodically considers annualized return information for the fund, for different time periods, measured against a securities market index ("benchmark index") and a peer group of mutual funds with similar objectives ("peer group"). In its evaluation of fund investment performance, the Board gave particular attention to information indicating changes in performance of certain Fidelity funds for specific time periods and the Investment Advisers' explanations for any overperformance or underperformance.
Annual Report
In addition to reviewing absolute and relative fund performance, the Independent Trustees periodically consider the appropriateness of fund performance metrics in evaluating the results achieved. In general, the Independent Trustees believe that fund performance should be evaluated based on net performance (after fees and expenses) of both the highest performing and lowest performing classes, where applicable, compared to appropriate benchmark indices, over appropriate time periods which may include full market cycles, and compared to peer groups, as applicable, over the same periods, taking into account relevant factors including the following: general market conditions; issuer-specific information; tactical opportunities for investment; and fund cash flows and other factors.
The Independent Trustees recognize that shareholders evaluate performance on a net basis over their own holding periods, for which one-, three-, and five-year periods are used as a proxy. For this reason, the performance information reviewed by the Board also included net cumulative calendar year total return information for the fund and an appropriate benchmark index for the most recent one-year period, as shown below. A peer group comparison is not shown below.
Annual Report
Board Approval of Investment Advisory Contracts and
Management Fees - continued
Fidelity Total Emerging Markets Fund

Based on its review, the Board concluded that the nature, extent, and quality of services provided to the fund under the Advisory Contracts should benefit the fund's shareholders.
Competitiveness of Management Fee and Total Expense Ratio. The Board considered the fund's management fee and total expense ratio compared to "mapped groups" of competitive funds and classes. Fidelity creates "mapped groups" by combining similar Lipper investment objective categories that have comparable management fee characteristics. Combining Lipper investment objective categories aids the Board's management fee and total expense ratio comparisons by broadening the competitive group used for comparison and by reducing the number of universes to which various Fidelity funds are compared.
Management Fee. The Board considered two proprietary management fee comparisons for the 12-month (or shorter) periods shown in the chart below. The group of Lipper funds used by the Board for management fee comparisons is referred to below as the "Total Mapped Group." The Total Mapped Group comparison focuses on a fund's standing in terms of gross management fees before expense reimbursements or caps relative to the total universe of funds with comparable investment mandates, regardless of whether their management fee structures also are comparable. Funds with comparable investment mandates offer exposure to similar types of securities. Funds with comparable management fee structures have similar management fee contractual arrangements (e.g., flat rate charged for advisory services, all-inclusive fee rate, etc.). "TMG %" represents the percentage of funds in the Total Mapped Group that had management fees that were lower than the fund's. For example, a TMG % of 13% means that 87% of the funds in the Total Mapped Group had higher management fees than the fund. The "Asset-Size Peer Group" (ASPG) comparison focuses on a fund's standing relative to a subset of non-Fidelity funds within the Total Mapped Group that are similar in size and management fee structure. The ASPG represents at least 15% of the funds in the Total Mapped Group with comparable asset size and management fee structures, subject to a minimum of 50 funds (or all funds in the Total Mapped Group if fewer than 50). Additional information, such as the ASPG quartile in which the fund's management fee ranked, is also included in the chart and considered by the Board.
Annual Report
Fidelity Total Emerging Markets Fund
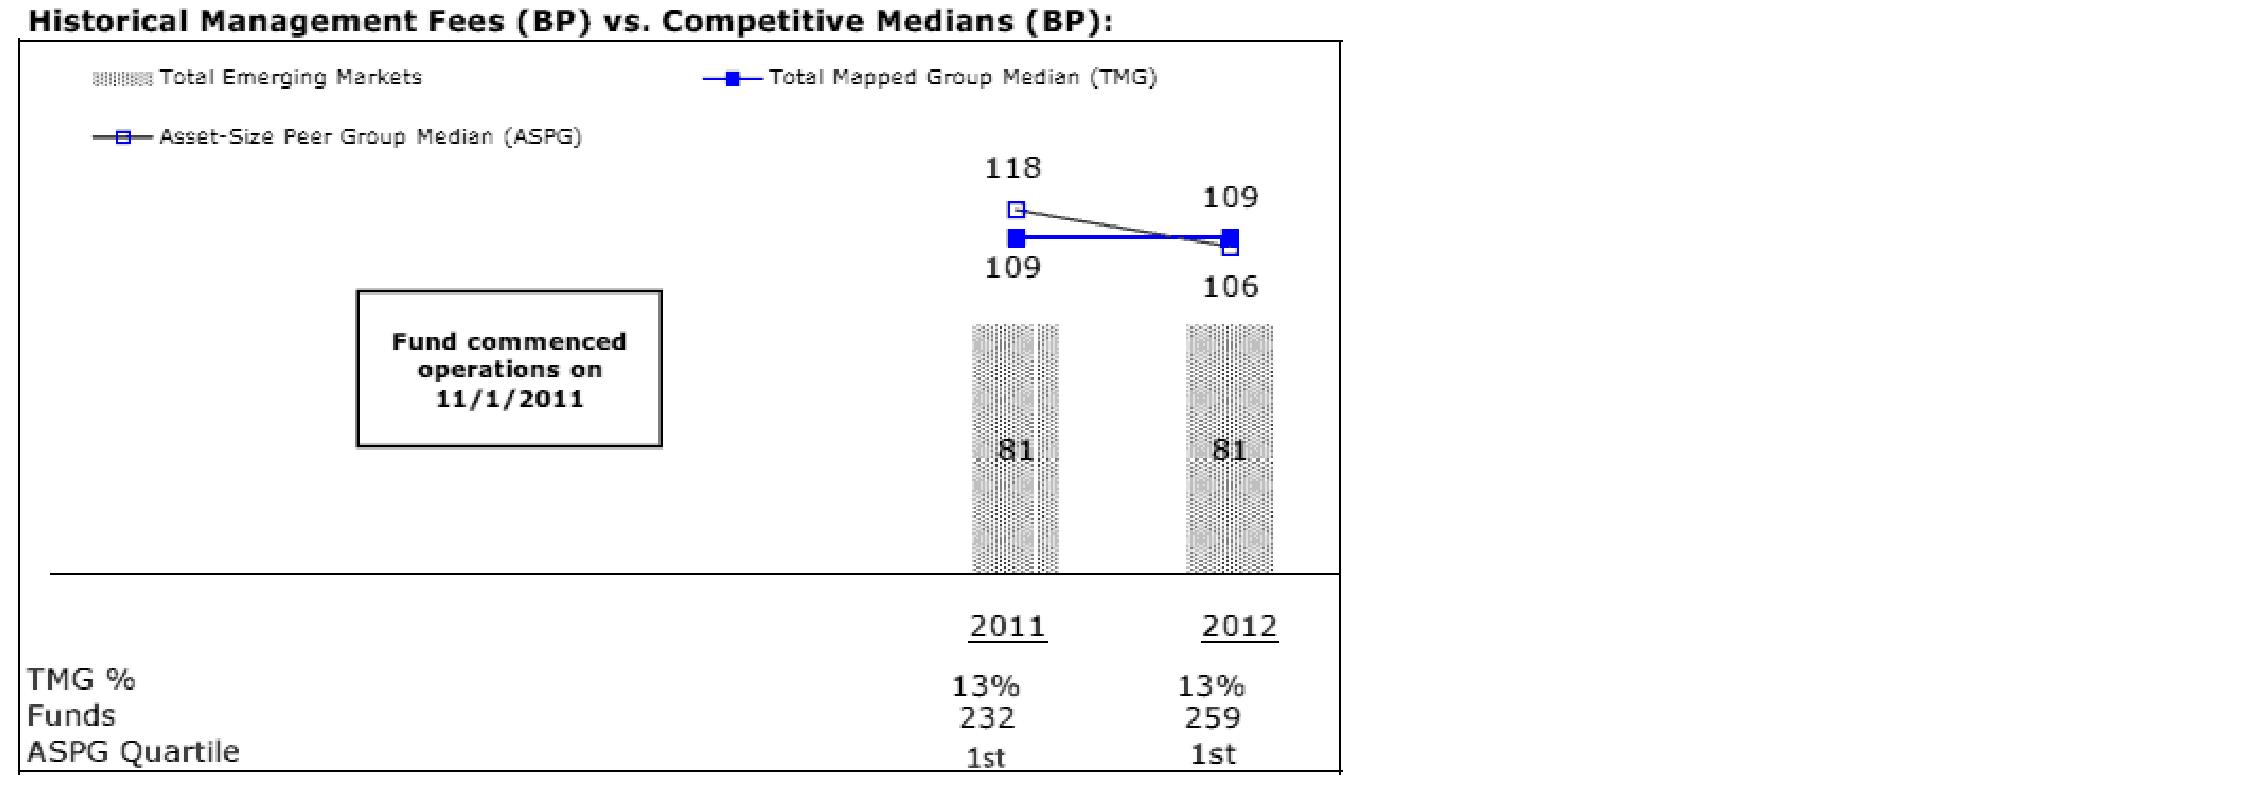
The Board noted that the fund's management fee ranked below the median of its Total Mapped Group and below the median of its ASPG for 2012.
Based on its review, the Board concluded that the fund's management fee is fair and reasonable in light of the services that the fund receives and the other factors considered.
Total Expense Ratio. In its review of each class's total expense ratio, the Board considered the fund's management fee as well as other fund or class expenses, as applicable, such as transfer agent fees, pricing and bookkeeping fees, fund-paid 12b-1 fees, and custodial, legal, and audit fees. The Board also noted the effects of any waivers and reimbursements on fees and expenses. As part of its review, the Board also considered the current and historical total expense ratios of each class of the fund compared to competitive fund median expenses. Each class of the fund is compared to those funds and classes in the Total Mapped Group (used by the Board for management fee comparisons) that have a similar sales load structure.
Annual Report
Board Approval of Investment Advisory Contracts and
Management Fees - continued
The Board noted that the total expense ratio of each of Class A and the retail class ranked below its competitive median for 2012 and the total expense ratio of each of Class T, Class C, and Institutional Class ranked above its competitive median for 2012. The Board considered that, in general, various factors can affect total expense ratios. The Board noted that the total expense ratio of Class T was above the competitive median primarily because of higher 12b-1 fees on Class T. Class T has a higher 12b-1 fee, but a lower front-end sales charge, than traditionally priced front-end sales charge classes. The Board considered that Class T is primarily sold load-waived in the retirement plan market where its 0.50% 12b-1 fee is comparable to competing no-load, higher 12b-1 fee classes designed specifically for retirement plans. The Board noted that the fund offers multiple classes, each of which has a different sales load and 12b-1 fee structure, and that the multiple structures are intended to offer a range of pricing options for the intermediary market. The Board also noted that the total expense ratios of the classes vary primarily by the level of their 12b-1 fees, although differences in transfer agent fees may also cause expenses to vary from class to class.
The Board further considered that FMR contractually agreed to reimburse Class A, Class T, Class C, Institutional Class, and the retail class of the fund to the extent that total operating expenses (excluding interest, taxes, certain securities lending costs, brokerage commissions, extraordinary expenses, and acquired fund fees and expenses, if any), as a percentage of their respective average net assets, exceed 1.65%, 1.90%, 2.40%, 1.40%, and 1.40% through December 31, 2013.
Fees Charged to Other Fidelity Clients. The Board also considered Fidelity fee structures and other information with respect to clients of FMR and its affiliates, such as other mutual funds advised or subadvised by FMR or its affiliates, pension plan clients, and other institutional clients. The Board noted the findings of the 2013 ad hoc joint committee (created with the board of other Fidelity funds), which reviewed and compared Fidelity's institutional investment advisory business with its business of providing services to the Fidelity funds, including the differences in services provided, fees charged, and costs incurred, as well as competition in their respective marketplaces.
Based on its review of total expense ratios and fees charged to other Fidelity clients, the Board concluded that the total expense ratio of each class of the fund was reasonable, although in some cases above the median of the universe presented for comparison, in light of the services that the fund and its shareholders receive and the other factors considered.
Costs of the Services and Profitability. The Board considered the revenues earned and the expenses incurred by Fidelity in conducting the business of developing, marketing, distributing, managing, administering and servicing the fund and servicing the fund's shareholders. The Board also considered the level of Fidelity's profits in respect of all the Fidelity funds.
Annual Report
On an annual basis, FMR presents to the Board Fidelity's profitability for the fund. Fidelity calculates the profitability for each fund, as well as aggregate profitability for groups of Fidelity funds and all Fidelity funds, using a series of detailed revenue and cost allocation methodologies which originate with the books and records of Fidelity on which Fidelity's audited financial statements are based. The Audit Committee of the Board reviews any significant changes from the prior year's methodologies.
PricewaterhouseCoopers LLP (PwC), independent registered public accounting firm and auditor to Fidelity and certain Fidelity funds, has been engaged annually by the Board as part of the Board's assessment of Fidelity's profitability analysis. PwC's engagement includes the review and assessment of the methodologies used by Fidelity in determining the revenues and expenses attributable to Fidelity's mutual fund business, and completion of agreed-upon procedures surrounding the mathematical accuracy of fund profitability and its conformity to allocation methodologies. After considering PwC's reports issued under the engagement and information provided by Fidelity, the Board concluded that while other allocation methods may also be reasonable, Fidelity's profitability methodologies are reasonable in all material respects.
The Board also reviewed Fidelity's non-fund businesses and fall-out benefits related to the mutual fund business as well as cases where Fidelity's affiliates may benefit from or be related to the fund's business.
The Board considered the costs of the services provided by and the profits realized by Fidelity in connection with the operation of the fund and was satisfied that the profitability was not excessive in the circumstances.
Economies of Scale. The Board considered whether there have been economies of scale in respect of the management of the Fidelity funds, whether the Fidelity funds (including the fund) have appropriately benefited from any such economies of scale, and whether there is potential for realization of any further economies of scale. The Board considered the extent to which the fund will benefit from economies of scale through increased services to the fund, through waivers or reimbursements, or through fee or expense reductions. The Board also noted that in 2009, it and the board of other Fidelity funds created an ad hoc committee (the Economies of Scale Committee) to analyze whether FMR attains economies of scale in respect of the management and servicing of the Fidelity funds, whether the Fidelity funds have appropriately benefited from such economies of scale, and whether there is potential for realization of any further economies of scale.
The Board recognized that the fund's management contract incorporates a "group fee" structure, which provides for lower group fee rates as total fund assets under FMR's management increase, and for higher group fee rates as total fund assets under FMR's management decrease. FMR calculates the group fee rates based on a tiered asset "breakpoint" schedule that varies based on asset class. The Board considered that the group fee is designed to deliver the benefits of economies of scale to fund shareholders when total Fidelity fund assets increase, even if assets of any particular fund are unchanged or have declined, because some portion of Fidelity's costs are attributable to services provided to all Fidelity funds, and all funds benefit if those costs can be allocated among more assets. The Board concluded that, given the group fee structure, fund shareholders will benefit from lower management fees as assets under FMR's management increase at the fund complex level, regardless of whether Fidelity achieves any such economies of scale.
Annual Report
Board Approval of Investment Advisory Contracts and
Management Fees - continued
The Board concluded, taking into account the analysis of the Economies of Scale Committee, that economies of scale, if any, are being appropriately shared between fund shareholders and Fidelity.
Amendment to Description of Group Fee Rate. At its July 2013 meeting, the Board voted to approve an amendment to the fund's management contract to modify the description of the "group fee rate" effective August 1, 2013. The Board noted that under the prior description in the contract, the group fee rate was based on the average net assets of all registered investment companies with which FMR has management contracts. Under the contract's tiered asset breakpoint schedule, the group fee rate is lower as total fund assets under FMR's management increase, and higher as total fund assets under FMR's management decrease. The Board considered that the prior description would have excluded the assets of 64 Fidelity sector funds from the group fee rate calculation once Fidelity SelectCo, LLC, an affiliate of FMR, assumed management responsibilities for those funds. The Board noted that modifying the description of the group fee rate to continue to include the assets of those 64 funds for purposes of determining group fee rate breakpoints would avoid an immediate adverse impact on the group fee rate for any fund.
Additional Information Requested by the Board. In order to develop fully the factual basis for consideration of the Fidelity funds' Advisory Contracts, the Board requested and received additional information on certain topics, including: (i) fund performance trends and Fidelity's long-term strategies for certain funds; (ii) the potential to further rationalize the Fidelity fund lineup with the possibility of achieving savings for the funds and Fidelity; (iii) the methodology with respect to competitive fund data and peer group classifications; (iv) the arrangements with, and performance of, certain sub-advisers on behalf of the Fidelity funds, as well as certain proposed participating affiliate arrangements; (v) the realization of fall-out benefits in certain Fidelity business units; (vi) Fidelity's group fee structures, including the rationale for the individual fee rates of certain categories of funds and the definition of group assets; (vii) trends regarding industry use of performance fee structures and the performance adjustment methodologies applicable to the Fidelity funds; (viii) additional competitive analysis regarding the total expenses for certain classes; and (ix) fund profitability methodology, including Fidelity's cost allocation methodology, and the impact of certain factors on fund profitability results.
Annual Report
Based on its evaluation of all of the conclusions noted above, and after considering all factors it believed relevant, the Board ultimately concluded that the advisory fee structures are fair and reasonable, and that the fund's Advisory Contracts should be renewed.
Annual Report
Investment Adviser
Fidelity Management & Research Company
Boston, MA
Investment Sub-Advisers
FMR Co., Inc.
Fidelity Management & Research
(U.K.) Inc.
Fidelity Management & Research
(Hong Kong) Limited
Fidelity Management & Research
(Japan) Inc.
FIL Investment Advisors
FIL Investment Advisors (UK) Limited
FIL Investments (Japan) Limited
General Distributor
Fidelity Distributors Corporation
Smithfield, RI
Transfer and Service Agents
Fidelity Investments Institutional Operations Company, Inc.
Boston, MA
Fidelity Service Company, Inc.
Boston, MA
Custodian
The Northern Trust Company
Chicago, IL
(Fidelity Investment logo)(registered trademark)
ATEK-UANN-1213
1.931267.101
(Fidelity Investment logo)(registered trademark)
Fidelity Advisor®
Total Emerging Markets
Fund - Institutional Class
Annual Report
October 31, 2013
(Fidelity Cover Art)
Institutional Class is a
class of Fidelity® Total
Emerging Markets Fund
Contents
Performance | (Click Here) | How the fund has done over time. |
Management's Discussion of Fund Performance | (Click Here) | The Portfolio Manager's review of fund performance and strategy. |
Shareholder Expense Example | (Click Here) | An example of shareholder expenses. |
Investment Changes | (Click Here) | A summary of major shifts in the fund's investments over the past six months. |
Investments | (Click Here) | A complete list of the fund's investments with their market values. |
Financial Statements | (Click Here) | Statements of assets and liabilities, operations, and changes in net assets, as well as financial highlights. |
Notes | (Click Here) | Notes to the financial statements. |
Report of Independent Registered Public Accounting Firm | (Click Here) | |
Trustees and Officers | (Click Here) | |
Distributions | (Click Here) | |
Board Approval of Investment Advisory Contracts and Management Fees | (Click Here) | |
To view a fund's proxy voting guidelines and proxy voting record for the 12-month period ended June 30, visit http://www.fidelity.com/proxyvotingresults or visit the Securities and Exchange Commission's (SEC) web site at http://www.sec.gov. You may also call 1-877-208-0098 to request a free copy of the proxy voting guidelines.
Standard & Poor's, S&P and S&P 500 are registered service marks of The McGraw-Hill Companies, Inc. and have been licensed for use by Fidelity Distributors Corporation.
Other third-party marks appearing herein are the property of their respective owners.
All other marks appearing herein are registered or unregistered trademarks or service marks of FMR LLC or an affiliated company. © 2013 FMR LLC. All rights reserved.
Annual Report
This report and the financial statements contained herein are submitted for the general information of the shareholders of the fund. This report is not authorized for distribution to prospective investors in the fund unless preceded or accompanied by an effective prospectus.
A fund files its complete schedule of portfolio holdings with the SEC for the first and third quarters of each fiscal year on Form N-Q. Forms N-Q are available on the SEC's web site at http://www.sec.gov. A fund's Forms N-Q may be reviewed and copied at the SEC's Public Reference Room in Washington, DC. Information regarding the operation of the SEC's Public Reference Room may be obtained by calling 1-800-SEC-0330. For a complete list of a fund's portfolio holdings, view the most recent holdings listing, semiannual report, or annual report on Fidelity's web site at http://www.fidelity.com, http://www.advisor.fidelity.com, or http://www.401k.com, as applicable.
NOT FDIC INSURED • MAY LOSE VALUE • NO BANK GUARANTEE
Neither the fund nor Fidelity Distributors Corporation is a bank.
Annual Report
Average annual total return reflects the change in the value of an investment, assuming reinvestment of the class' distributions from dividend income and capital gains (the profits earned upon the sale of securities that have grown in value, if any) and assuming a constant rate of performance each year. The $10,000 table and the fund's returns do not reflect the deduction of taxes that a shareholder would pay on fund distributions or the redemption of fund shares. During periods of reimbursement by Fidelity, a fund's total return will be greater than it would be had the reimbursement not occurred. How a fund did yesterday is no guarantee of how it will do tomorrow.
Average Annual Total Returns
Periods ended October 31, 2013 | Past 1
year | Life of
fund A |
Institutional Class | 6.44% | 7.78% |
A From November 1, 2011.
$10,000 Over Life of Fund
Let's say hypothetically that $10,000 was invested in Fidelity Advisor® Total Emerging Markets Fund - Institutional Class on November 1, 2011, when the fund started. The chart shows how the value of your investment would have changed, and also shows how the MSCI® Emerging Markets Index performed over the same period.
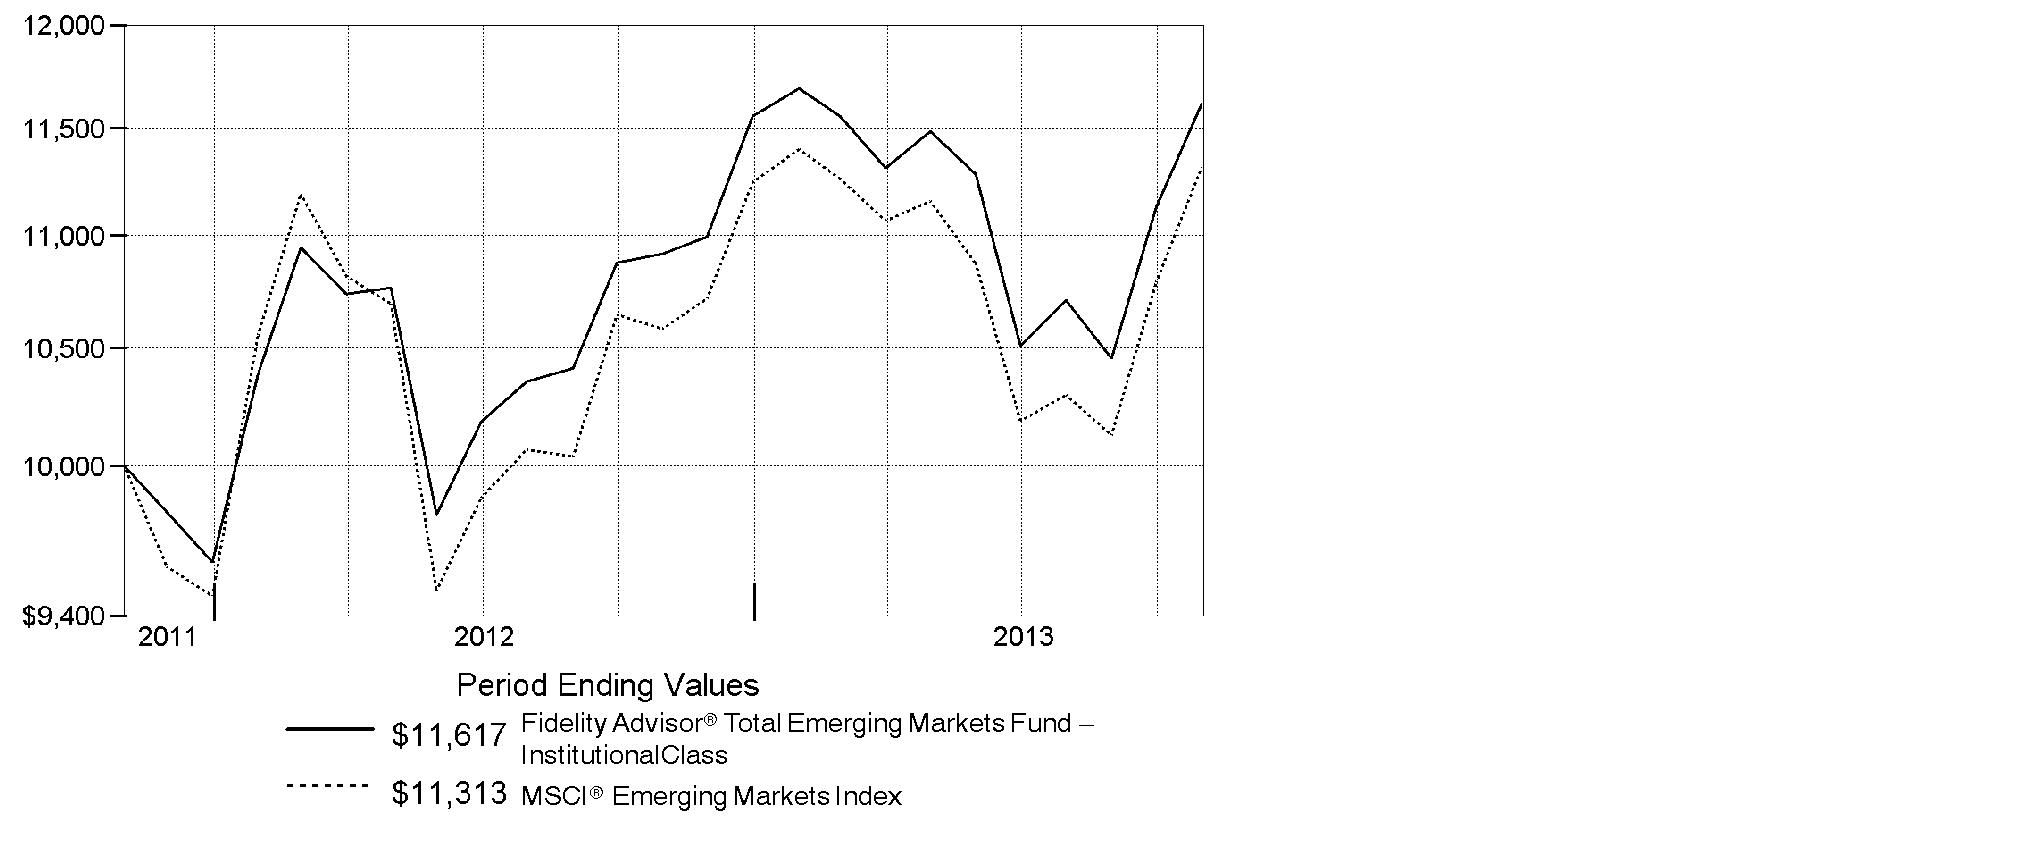
Annual Report
Market Recap: On balance, global equity markets remained upbeat for the 12-month period ending October 31, 2013. The MSCI® ACWI® (All Country World Index) Index gained 23.75% for the period, amid persistent preference for higher-risk assets. The period was not without turbulence, however. In the spring and summer, world central banks, especially in the U.S. and China, made clear their intentions to maintain accommodative monetary policies. That stance, along with modest cyclical improvements around the globe and generally low valuations, underpinned the broad rally in equities. Europe (+32%) shone, with most markets on the Continent notching solid, index-beating gains. Another bright spot, Japan, posted a 34% full-year result, despite a struggling yen and a weak second half. The U.S. - by far the largest index component - also outperformed, up roughly 28%. Meanwhile, Asia-Pacific ex Japan (+14%) lagged, hurt in part by a slowdown in Australia's mining industry as well as currency headwinds. Foreign-exchange and commodity weakness also curbed results in resource-heavy Canada and emerging markets (EM), both of which were up 7%. Country-level EM performance diverged meaningfully for the period, as shown by results in Brazil (-1%), Russia (+12%), India (+1%) and China (+8%). Against a strong tilt toward equities, global bond markets fell flat, with the Barclays® Global Aggregate GDP Weighted Index returning -0.15% for the full period.
Comments from John Carlson, Lead Portfolio Manager of Fidelity Advisor® Total Emerging Markets Fund: For the year, the fund's Institutional Class shares gained 6.44%. By comparison, the fund's primary benchmark, the MSCI® Emerging Markets Index, returned 6.90%, while the Fidelity Total Emerging Markets Composite IndexSM advanced 3.07%. Versus the Composite index, the biggest boost came from security selection among equities. Here, the top individual contributor was Taiwan's ECLAT Textile, a supplier of performance fabrics that enjoyed pricing power for its products. We also were helped by Mobile TeleSystems, a Russian wireless telecom provider that was lifted by easing competitive conditions and upward revisions to its earnings forecasts. Conversely, the materials sector was the only notable area of weakness. Turning to emerging-markets (EM) debt, an underweighting here was helpful, as were our picks in Venezuela. Detractors included security selection in Russia and Mexico, as our holdings here were primarily long-duration securities that underperformed. It also hurt to largely avoid Argentina, which rallied significantly.
The views expressed above reflect those of the portfolio manager(s) only through the end of the period as stated on the cover of this report and do not necessarily represent the views of Fidelity or any other person in the Fidelity organization. Any such views are subject to change at any time based upon market or other conditions and Fidelity disclaims any responsibility to update such views. These views may not be relied on as investment advice and, because investment decisions for a Fidelity fund are based on numerous factors, may not be relied on as an indication of trading intent on behalf of any Fidelity fund.
Annual Report
Fidelity Total Emerging Markets Fund
Shareholder Expense Example
As a shareholder of the Fund, you incur two types of costs: (1) transaction costs, including sales charges (loads) on purchase payments or redemption proceeds, redemption fees and (2) ongoing costs, including management fees, distribution and/or service (12b-1) fees and other Fund expenses. This Example is intended to help you understand your ongoing costs (in dollars) of investing in the Fund and to compare these costs with the ongoing costs of investing in other mutual funds.
The Example is based on an investment of $1,000 invested at the beginning of the period and held for the entire period (May 1, 2013 to October 31, 2013).
Actual Expenses
The first line of the accompanying table for each class of the Fund provides information about actual account values and actual expenses. You may use the information in this line, together with the amount you invested, to estimate the expenses that you paid over the period. Simply divide your account value by $1,000.00 (for example, an $8,600 account value divided by $1,000.00 = 8.6), then multiply the result by the number in the first line for a class of the Fund under the heading entitled "Expenses Paid During Period" to estimate the expenses you paid on your account during this period. A small balance maintenance fee of $12.00 that is charged once a year may apply for certain accounts with a value of less than $2,000. This fee is not included in the table below. If it was, the estimate of expenses you paid during the period would be higher, and your ending account value lower, by this amount. In addition, the Fund, as a shareholder in the underlying Fidelity Central Funds, will indirectly bear its pro-rata share of the fees and expenses incurred by the underlying Fidelity Central Funds. These fees and expenses are not included in the Fund's annualized expense ratio used to calculate the expense estimate in the table below.
Hypothetical Example for Comparison Purposes
The second line of the accompanying table for each class of the Fund provides information about hypothetical account values and hypothetical expenses based on a Class' actual expense ratio and an assumed rate of return of 5% per year before expenses, which is not the Class' actual return. The hypothetical account values and expenses may not be used to estimate the actual ending account balance or expenses you paid for the period. You may use this information to compare the ongoing costs of investing in the Fund and other funds. To do so, compare this 5% hypothetical example with the 5% hypothetical examples that appear in the shareholder reports of the other funds. A small balance maintenance fee of $12.00 that is charged once a year may apply for certain accounts with a value of less than $2,000. This fee is not included in the table below. If it was, the estimate of expenses you paid during the period would be higher, and your ending account value lower, by this amount. In addition, the Fund, as a shareholder in the underlying Fidelity Central Funds, will indirectly bear its pro-rata share of the fees and expenses incurred by the underlying Fidelity Central Funds. These fees and expenses are not included in the Fund's annualized expense ratio used to calculate the expense estimate in the table below.
Please note that the expenses shown in the table are meant to highlight your ongoing costs only and do not reflect any transaction costs. Therefore, the second line of the table is useful in comparing ongoing costs only, and will not help you determine the relative total costs of owning different funds. In addition, if these transactional costs were included, your costs would have been higher.
Annual Report
Fidelity Total Emerging Markets Fund
Shareholder Expense Example - continued
| Annualized
Expense RatioB | Beginning
Account Value
May 1, 2013 | Ending
Account Value
October 31, 2013 | Expenses Paid
During Period*
May 1, 2013
to October 31, 2013 |
Class A | 1.65% | | | |
Actual | | $ 1,000.00 | $ 1,010.70 | $ 8.36 |
HypotheticalA | | $ 1,000.00 | $ 1,016.89 | $ 8.39 |
Class T | 1.90% | | | |
Actual | | $ 1,000.00 | $ 1,008.90 | $ 9.62 |
HypotheticalA | | $ 1,000.00 | $ 1,015.63 | $ 9.65 |
Class C | 2.40% | | | |
Actual | | $ 1,000.00 | $ 1,006.20 | $ 12.14 |
HypotheticalA | | $ 1,000.00 | $ 1,013.11 | $ 12.18 |
Total Emerging Markets | 1.40% | | | |
Actual | | $ 1,000.00 | $ 1,011.50 | $ 7.10 |
HypotheticalA | | $ 1,000.00 | $ 1,018.15 | $ 7.12 |
Institutional Class | 1.40% | | | |
Actual | | $ 1,000.00 | $ 1,011.50 | $ 7.10 |
HypotheticalA | | $ 1,000.00 | $ 1,018.15 | $ 7.12 |
A 5% return per year before expenses
B Annualized expense ratio reflects expenses net of applicable fee waivers.
* Expenses are equal to each Class' annualized expense ratio, multiplied by the average account value over the period, multiplied by 184/365 (to reflect the one-half year period).
Annual Report
Fidelity Total Emerging Markets Fund
Investment Changes (Unaudited)
Top Five Stocks as of October 31, 2013 |
| % of fund's
net assets | % of fund's net assets
6 months ago |
Samsung Electronics Co. Ltd. (Korea (South), Semiconductors & Semiconductor Equipment) | 3.6 | 4.0 |
Taiwan Semiconductor Manufacturing Co. Ltd. (Taiwan, Semiconductors & Semiconductor Equipment) | 2.4 | 2.4 |
Tencent Holdings Ltd. (Cayman Islands, Internet Software & Services) | 1.6 | 0.8 |
Sberbank (Savings Bank of the Russian Federation) (Russia, Commercial Banks) | 1.6 | 1.3 |
Industrial & Commercial Bank of China Ltd. (H Shares) (China, Commercial Banks) | 1.4 | 1.1 |
| 10.6 | |
Top Five Market Sectors as of October 31, 2013 |
| % of fund's
net assets | % of fund's net assets
6 months ago |
Financials | 21.9 | 21.9 |
Information Technology | 12.5 | 10.7 |
Energy | 11.4 | 13.0 |
Materials | 7.8 | 8.1 |
Telecommunication Services | 6.7 | 6.2 |
Top Five Countries as of October 31, 2013 |
(excluding cash equivalents) | % of fund's
net assets | % of fund's net assets
6 months ago |
Korea (South) | 14.1 | 10.9 |
Russia | 7.8 | 8.1 |
Brazil | 7.8 | 10.1 |
Cayman Islands | 6.8 | 5.6 |
Taiwan | 5.5 | 5.9 |
Percentages are adjusted for the effect of open futures contracts, if applicable. |
Asset Allocation (% of fund's net assets) |
As of October 31, 2013 | As of April 30, 2013 |
 | Stocks and
Equity Futures 76.5% | | | Stocks 75.7% | |
 | Bonds 22.2% | | | Bonds 22.3% | |
 | Short-Term
Investments and
Net Other Assets
(Liabilities) 1.3% | | | Short-Term
Investments and
Net Other Assets
(Liabilities) 2.0% | |

Annual Report
Fidelity Total Emerging Markets Fund
Investments October 31, 2013
Showing Percentage of Net Assets
Common Stocks - 72.7% |
| Shares | | Value |
Argentina - 0.1% |
Grupo Financiero Galicia SA sponsored ADR | 13,090 | | $ 126,711 |
Austria - 0.4% |
Erste Group Bank AG | 8,890 | | 313,529 |
Bailiwick of Jersey - 0.3% |
Atrium European Real Estate Ltd. | 45,129 | | 269,973 |
Bermuda - 1.4% |
Aquarius Platinum Ltd. (Australia) (a) | 117,431 | | 77,138 |
BW Offshore Ltd. | 228,373 | | 313,420 |
Cosan Ltd. Class A | 17,863 | | 281,521 |
GP Investments Ltd. Class A (depositary receipt) (a) | 101,622 | | 182,359 |
Shangri-La Asia Ltd. | 110,000 | | 201,470 |
Stolt-Nielsen SA | 7,271 | | 205,804 |
TOTAL BERMUDA | | 1,261,712 |
Brazil - 6.8% |
Anhanguera Educacional Participacoes SA | 34,600 | | 206,964 |
Arezzo Industria e Comercio SA | 9,700 | | 145,054 |
BHG SA (Brazil Hospitality Group) (a) | 13,600 | | 99,563 |
BR Properties SA | 42,820 | | 363,173 |
Companhia de Bebidas das Americas (AmBev) (PN) sponsored ADR | 8,700 | | 323,640 |
Companhia de Saneamento Basico do Estado de Sao Paulo (SABESP) sponsored ADR | 20,630 | | 218,884 |
Companhia Paranaense de Energia-Copel (PN-B) sponsored ADR | 13,665 | | 189,670 |
Estacio Participacoes SA | 24,200 | | 186,885 |
Fibria Celulose SA (a) | 10,000 | | 129,676 |
Gerdau SA sponsored ADR | 44,800 | | 355,264 |
Itau Unibanco Holding SA sponsored ADR | 76,790 | | 1,183,334 |
Petroleo Brasileiro SA - Petrobras: | | | |
(PN) sponsored ADR (non-vtg.) | 11,606 | | 210,765 |
sponsored ADR | 26,526 | | 462,348 |
Smiles SA | 14,300 | | 187,607 |
TIM Participacoes SA sponsored ADR | 3,280 | | 83,378 |
Ultrapar Participacoes SA | 21,700 | | 578,292 |
Vale SA (PN-A) sponsored ADR | 72,200 | | 1,057,008 |
TOTAL BRAZIL | | 5,981,505 |
British Virgin Islands - 0.0% |
Luxoft Holding, Inc. | 1,100 | | 32,142 |
Canada - 0.6% |
First Quantum Minerals Ltd. | 12,500 | | 237,136 |
Common Stocks - continued |
| Shares | | Value |
Canada - continued |
Goldcorp, Inc. | 5,900 | | $ 150,294 |
Pan American Silver Corp. | 9,200 | | 97,612 |
Torex Gold Resources, Inc. (a) | 61,700 | | 68,644 |
TOTAL CANADA | | 553,686 |
Cayman Islands - 6.1% |
21Vianet Group, Inc. ADR (a) | 10,920 | | 196,560 |
58.com, Inc. ADR | 300 | | 7,236 |
Anta Sports Products Ltd. | 149,000 | | 213,708 |
Anton Oilfield Services Group | 356,000 | | 224,997 |
China Liansu Group Holdings Ltd. | 270,000 | | 172,733 |
Cimc Enric Holdings Ltd. | 124,000 | | 174,652 |
Ctrip.com International Ltd. sponsored ADR (a) | 4,400 | | 238,700 |
Eurasia Drilling Co. Ltd. GDR (Reg. S) | 8,934 | | 378,355 |
GCL-Poly Energy Holdings Ltd. (a) | 1,193,000 | | 366,225 |
Greatview Aseptic Pack Co. Ltd. | 398,000 | | 250,515 |
Haitian International Holdings Ltd. | 78,000 | | 187,932 |
Hengan International Group Co. Ltd. | 42,000 | | 514,369 |
Hilong Holding Ltd. | 166,000 | | 110,481 |
Springland International Holdings Ltd. | 300,000 | | 164,452 |
Tencent Holdings Ltd. | 25,800 | | 1,408,301 |
Uni-President China Holdings Ltd. | 272,000 | | 271,895 |
Veripos | 29,165 | | 144,036 |
Xueda Education Group sponsored ADR | 28,100 | | 131,508 |
Yingde Gases Group Co. Ltd. | 188,000 | | 193,020 |
TOTAL CAYMAN ISLANDS | | 5,349,675 |
Chile - 1.2% |
Banco Santander Chile | 5,905,977 | | 362,948 |
Embotelladora Andina SA ADR | 2,300 | | 59,570 |
Empresa Nacional de Electricidad SA | 110,318 | | 168,196 |
Empresa Nacional de Telecomunicaciones SA (ENTEL) | 12,847 | | 197,702 |
Inversiones La Construccion SA | 7,739 | | 116,179 |
Sociedad Quimica y Minera de Chile SA (PN-B) sponsored ADR | 4,200 | | 115,962 |
TOTAL CHILE | | 1,020,557 |
China - 5.3% |
Anhui Conch Cement Co. Ltd. (H Shares) | 73,000 | | 254,695 |
BBMG Corp. (H Shares) | 351,500 | | 252,075 |
China Communications Construction Co. Ltd. (H Shares) | 349,000 | | 284,944 |
China Construction Bank Corp. (H Shares) | 653,000 | | 507,037 |
China Pacific Insurance Group Co. Ltd. (H Shares) | 251,600 | | 908,655 |
Common Stocks - continued |
| Shares | | Value |
China - continued |
China Suntien Green Energy Corp. Ltd. (H Shares) | 247,200 | | $ 86,407 |
China Telecom Corp. Ltd. (H Shares) | 846,157 | | 441,995 |
Industrial & Commercial Bank of China Ltd. (H Shares) | 1,739,000 | | 1,217,950 |
Maanshan Iron & Steel Ltd. (H Shares) (a) | 568,000 | | 145,059 |
PICC Property & Casualty Co. Ltd. (H Shares) | 177,000 | | 271,219 |
Weichai Power Co. Ltd. (H Shares) | 59,400 | | 237,891 |
TOTAL CHINA | | 4,607,927 |
Cyprus - 0.3% |
Globaltrans Investment PLC GDR (Reg. S) | 19,300 | | 293,360 |
Czech Republic - 0.1% |
Ceske Energeticke Zavody A/S | 1,780 | | 51,236 |
Denmark - 0.2% |
Auriga Industries A/S Series B (a) | 5,323 | | 208,821 |
France - 0.2% |
Technip SA | 1,888 | | 197,769 |
Hong Kong - 1.3% |
AIA Group Ltd. | 32,100 | | 162,922 |
CNOOC Ltd. | 24,000 | | 48,815 |
CNOOC Ltd. sponsored ADR | 700 | | 141,617 |
Far East Horizon Ltd. | 343,000 | | 250,846 |
Lenovo Group Ltd. | 418,000 | | 447,491 |
Sinotruk Hong Kong Ltd. | 233,500 | | 122,277 |
TOTAL HONG KONG | | 1,173,968 |
India - 5.3% |
Axis Bank Ltd. | 31,183 | | 618,711 |
Bajaj Auto Ltd. | 6,012 | | 207,792 |
Bharti Airtel Ltd. | 42,507 | | 253,218 |
Bharti Infratel Ltd. | 81,097 | | 216,942 |
Eicher Motors Ltd. | 3,283 | | 210,853 |
Grasim Industries Ltd. | 4,724 | | 222,055 |
Indiabulls Real Estate Ltd. | 167,722 | | 170,514 |
ITC Ltd. | 106,950 | | 581,401 |
JK Cement Ltd. | 21,830 | | 68,493 |
Larsen & Toubro Ltd. | 19,537 | | 308,698 |
Lupin Ltd. | 14,534 | | 215,798 |
Maruti Suzuki India Ltd. | 11,768 | | 312,456 |
Mundra Port and SEZ Ltd. | 107,251 | | 253,230 |
NHPC Ltd. | 481,849 | | 141,527 |
NTPC Ltd. | 107,028 | | 258,956 |
Petronet LNG Ltd. | 78,017 | | 157,303 |
Common Stocks - continued |
| Shares | | Value |
India - continued |
Phoenix Mills Ltd. (a) | 34,705 | | $ 131,895 |
SREI Infrastructure Finance Ltd. | 435,998 | | 144,687 |
Ultratech Cemco Ltd. | 5,561 | | 177,490 |
TOTAL INDIA | | 4,652,019 |
Indonesia - 1.3% |
PT AKR Corporindo Tbk | 247,500 | | 106,486 |
PT Bakrieland Development Tbk (a) | 21,996,000 | | 97,564 |
PT Bank Rakyat Indonesia Tbk | 398,000 | | 278,925 |
PT Bank Tabungan Negara Tbk | 1,280,200 | | 110,161 |
PT Kalbe Farma Tbk | 1,665,500 | | 192,073 |
PT Telkomunikasi Indonesia Tbk sponsored ADR | 7,626 | | 310,836 |
TOTAL INDONESIA | | 1,096,045 |
Isle of Man - 0.0% |
IBS Group Holding Ltd. GDR (Reg. S) | 1,300 | | 35,116 |
Israel - 0.2% |
NICE Systems Ltd. sponsored ADR | 4,500 | | 176,310 |
Kenya - 0.3% |
Equity Bank Ltd. | 576,900 | | 239,953 |
Korea (South) - 13.2% |
AMOREPACIFIC Group, Inc. | 727 | | 256,541 |
Daewoo International Corp. | 17,225 | | 635,420 |
Daou Technology, Inc. | 11,720 | | 160,679 |
E-Mart Co. Ltd. | 2,632 | | 629,926 |
Hana Financial Group, Inc. | 26,070 | | 1,004,695 |
Hankook Shell Oil Co. Ltd. | 265 | | 131,341 |
Hyundai Industrial Development & Construction Co. | 11,590 | | 257,730 |
Hyundai Mobis | 1,115 | | 314,660 |
KB Financial Group, Inc. | 25,480 | | 1,002,989 |
Korea Electric Power Corp. (a) | 9,825 | | 262,255 |
Korea Plant Service & Engineering Co. Ltd. | 370 | | 18,757 |
Korean Reinsurance Co. | 27,060 | | 303,420 |
KT&G Corp. | 3,666 | | 267,710 |
LG Chemical Ltd. | 1,313 | | 370,537 |
LG Corp. | 5,031 | | 297,229 |
Lotte Chemical Corp. | 822 | | 168,462 |
NHN Corp. | 1,129 | | 635,094 |
Oci Co. Ltd. | 1,507 | | 272,637 |
POSCO sponsored ADR | 5,000 | | 372,300 |
Samsung Electronics Co. Ltd. | 2,306 | | 3,183,223 |
Samsung Life Insurance Co. Ltd. | 4,099 | | 403,612 |
Common Stocks - continued |
| Shares | | Value |
Korea (South) - continued |
SK Hynix, Inc. (a) | 8,360 | | $ 251,679 |
SK Telecom Co. Ltd. | 1,502 | | 327,153 |
TOTAL KOREA (SOUTH) | | 11,528,049 |
Luxembourg - 0.3% |
Subsea 7 SA | 12,335 | | 260,871 |
Malaysia - 0.3% |
Petronas Dagangan Bhd | 22,500 | | 218,121 |
Tenaga Nasional Bhd | 10,950 | | 32,713 |
TOTAL MALAYSIA | | 250,834 |
Mexico - 4.0% |
Alpek SA de CV | 42,600 | | 92,434 |
America Movil S.A.B. de CV Series L sponsored ADR | 35,713 | | 764,615 |
CEMEX SA de CV sponsored ADR | 26,435 | | 279,682 |
El Puerto de Liverpool S.A.B. de CV Class C | 20,300 | | 219,240 |
Fomento Economico Mexicano S.A.B. de CV sponsored ADR | 5,450 | | 508,485 |
Gruma S.A.B. de CV Series B (a) | 49,500 | | 339,251 |
Grupo Comercial Chedraui S.A.B. de CV | 70,900 | | 221,711 |
Grupo Financiero Banorte S.A.B. de CV Series O | 65,600 | | 418,722 |
Grupo Televisa SA de CV (CPO) sponsored ADR | 21,000 | | 639,240 |
TOTAL MEXICO | | 3,483,380 |
Netherlands - 0.3% |
Fugro NV (Certificaten Van Aandelen) | 4,347 | | 272,000 |
Nigeria - 1.3% |
Guaranty Trust Bank PLC GDR (Reg. S) | 53,750 | | 419,250 |
Zenith Bank PLC | 5,102,305 | | 692,088 |
TOTAL NIGERIA | | 1,111,338 |
Norway - 0.9% |
ElectroMagnetic GeoServices ASA (a) | 77,389 | | 89,374 |
Spectrum ASA | 12,824 | | 74,320 |
TGS Nopec Geophysical Co. ASA | 21,811 | | 600,136 |
TOTAL NORWAY | | 763,830 |
Panama - 0.3% |
Copa Holdings SA Class A | 2,060 | | 308,052 |
Philippines - 1.1% |
Alliance Global Group, Inc. | 344,300 | | 209,934 |
Common Stocks - continued |
| Shares | | Value |
Philippines - continued |
Metropolitan Bank & Trust Co. | 137,074 | | $ 282,300 |
Robinsons Land Corp. | 915,700 | | 480,999 |
TOTAL PHILIPPINES | | 973,233 |
Poland - 0.4% |
Powszechny Zaklad Ubezpieczen SA | 1,874 | | 285,205 |
Telekomunikacja Polska SA | 24,900 | | 80,673 |
TOTAL POLAND | | 365,878 |
Portugal - 0.4% |
BPI-SGPS SA (a) | 56,385 | | 89,571 |
Jeronimo Martins SGPS SA | 11,900 | | 219,900 |
TOTAL PORTUGAL | | 309,471 |
Russia - 5.3% |
DIXY Group OJSC (a) | 6,505 | | 85,739 |
E.ON Russia JSC | 6,198,200 | | 481,233 |
Gazprom OAO sponsored ADR | 51,032 | | 476,129 |
LUKOIL Oil Co. | 1,100 | | 72,165 |
Magnit OJSC | 1,776 | | 477,914 |
Mobile TeleSystems OJSC | 83,280 | | 876,666 |
Norilsk Nickel OJSC ADR | 15,400 | | 233,156 |
RusHydro JSC sponsored ADR | 25,070 | | 42,218 |
Sberbank (Savings Bank of the Russian Federation) | 433,550 | | 1,389,707 |
Sistema JSFC | 277,400 | | 309,068 |
VTB Bank OJSC sponsored GDR (Reg. S) | 84,600 | | 235,103 |
TOTAL RUSSIA | | 4,679,098 |
Singapore - 1.1% |
Ezion Holdings Ltd. | 263,000 | | 474,255 |
First Resources Ltd. | 160,000 | | 251,167 |
Super Group Ltd. Singapore | 60,000 | | 203,349 |
TOTAL SINGAPORE | | 928,771 |
South Africa - 3.8% |
Aspen Pharmacare Holdings Ltd. | 14,400 | | 400,883 |
Barclays Africa Group Ltd. | 17,591 | | 271,590 |
Blue Label Telecoms Ltd. | 54,600 | | 51,343 |
Impala Platinum Holdings Ltd. | 18,500 | | 224,829 |
JSE Ltd. | 17,210 | | 150,521 |
Life Healthcare Group Holdings Ltd. | 66,300 | | 270,781 |
MTN Group Ltd. | 32,350 | | 643,020 |
Naspers Ltd. Class N | 10,800 | | 1,010,205 |
Common Stocks - continued |
| Shares | | Value |
South Africa - continued |
Reunert Ltd. | 20,200 | | $ 141,860 |
Wilson Bayly Holmes-Ovcon Ltd. | 7,900 | | 138,495 |
TOTAL SOUTH AFRICA | | 3,303,527 |
Sri Lanka - 0.2% |
Dialog Axiata PLC | 2,387,100 | | 165,948 |
Taiwan - 5.5% |
Chipbond Technology Corp. | 74,000 | | 149,332 |
Chroma ATE, Inc. | 43,000 | | 91,449 |
Cleanaway Co. Ltd. | 23,000 | | 143,774 |
E.SUN Financial Holdings Co. Ltd. | 411,700 | | 274,840 |
ECLAT Textile Co. Ltd. | 26,660 | | 293,002 |
Hon Hai Precision Industry Co. Ltd. (Foxconn) | 28,950 | | 73,272 |
King Slide Works Co. Ltd. | 6,000 | | 52,998 |
MediaTek, Inc. | 41,000 | | 559,946 |
Taiwan Fertilizer Co. Ltd. | 156,300 | | 371,700 |
Taiwan Semiconductor Manufacturing Co. Ltd. | 381,000 | | 1,401,553 |
Taiwan Semiconductor Manufacturing Co. Ltd. sponsored ADR | 36,242 | | 667,215 |
Tong Hsing Electronics Industries Ltd. | 26,000 | | 137,354 |
Unified-President Enterprises Corp. | 135,739 | | 258,243 |
Universal Cement Corp. | 79,000 | | 72,465 |
Yuanta Financial Holding Co. Ltd. | 443,500 | | 241,074 |
TOTAL TAIWAN | | 4,788,217 |
Thailand - 0.5% |
Bangkok Bank PCL (For. Reg.) | 61,700 | | 408,360 |
Togo - 0.2% |
Ecobank Transnational, Inc. | 2,409,565 | | 210,609 |
Turkey - 0.9% |
Aygaz A/S | 24,074 | | 110,225 |
Tupras Turkiye Petrol Rafinelleri A/S | 15,400 | | 349,465 |
Turkiye Halk Bankasi A/S | 36,800 | | 297,718 |
TOTAL TURKEY | | 757,408 |
United Kingdom - 0.4% |
John Wood Group PLC | 19,934 | | 259,533 |
Mondi PLC | 6,900 | | 123,247 |
TOTAL UNITED KINGDOM | | 382,780 |
United States of America - 0.9% |
Cognizant Technology Solutions Corp. Class A (a) | 2,400 | | 208,632 |
InvenSense, Inc. (a) | 13,111 | | 221,445 |
Common Stocks - continued |
| Shares | | Value |
United States of America - continued |
Sohu.com, Inc. (a) | 3,700 | | $ 247,752 |
Universal Display Corp. (a) | 2,247 | | 71,679 |
TOTAL UNITED STATES OF AMERICA | | 749,508 |
TOTAL COMMON STOCKS (Cost $54,256,585) |
63,643,176
|
Nonconvertible Preferred Stocks - 3.4% |
| | | |
Brazil - 1.0% |
Alpargatas Sa (PN) | 28,500 | | 197,192 |
Banco do Estado Rio Grande do Sul SA | 25,700 | | 185,276 |
Braskem SA (PN-A) | 20,300 | | 180,146 |
Companhia Paranaense de Energia-Copel (PN-B) | 715 | | 9,971 |
Lojas Americanas SA (PN) | 38,333 | | 283,707 |
TOTAL BRAZIL | | 856,292 |
Chile - 0.2% |
Embotelladora Andina SA Class A | 47,759 | | 202,317 |
Korea (South) - 0.9% |
Hyundai Motor Co. Series 2 | 3,701 | | 418,476 |
Samsung Electronics Co. Ltd. | 374 | | 360,862 |
TOTAL KOREA (SOUTH) | | 779,338 |
Russia - 1.3% |
Sberbank (Savings Bank of the Russian Federation) | 292,600 | | 755,706 |
Surgutneftegas | 476,850 | | 354,618 |
TOTAL RUSSIA | | 1,110,324 |
TOTAL NONCONVERTIBLE PREFERRED STOCKS (Cost $2,357,183) |
2,948,271
|
Nonconvertible Bonds - 7.4% |
| Principal
Amount (c) | | |
Bailiwick of Jersey - 0.2% |
Polyus Gold International Ltd. 5.625% 4/29/20 (e) | | $ 200,000 | | 199,500 |
Canada - 0.5% |
Pacific Rubiales Energy Corp. 7.25% 12/12/21 (e) | | 400,000 | | 441,000 |
Cayman Islands - 0.6% |
Odebrecht Finance Ltd. 7.5% (e)(f) | | 475,000 | | 475,000 |
Nonconvertible Bonds - continued |
| Principal
Amount (c) | | Value |
Costa Rica - 0.2% |
Instituto Costarricense de Electricidad 6.95% 11/10/21 (e) | | $ 200,000 | | $ 211,000 |
Georgia - 0.4% |
Georgia Bank Joint Stock Co. 7.75% 7/5/17 (e) | | 300,000 | | 319,500 |
Indonesia - 0.2% |
PT Pertamina Persero 5.625% 5/20/43 (e) | | 200,000 | | 168,500 |
Israel - 0.3% |
Israel Electric Corp. Ltd. 6.7% 2/10/17 (e) | | 250,000 | | 270,625 |
Kazakhstan - 1.0% |
KazMunaiGaz Finance Sub BV 7% 5/5/20 (e) | | 150,000 | | 171,570 |
KazMunaiGaz National Co. 5.75% 4/30/43 (e) | | 300,000 | | 272,220 |
Zhaikmunai International BV 7.125% 11/13/19 (e) | | 400,000 | | 424,000 |
TOTAL KAZAKHSTAN | | 867,790 |
Luxembourg - 0.7% |
Millicom International Cellular SA 4.75% 5/22/20 (e) | | 200,000 | | 188,000 |
RSHB Capital SA: | | | | |
5.1% 7/25/18 (e) | | 200,000 | | 204,240 |
5.298% 12/27/17 (e) | | 200,000 | | 207,500 |
TOTAL LUXEMBOURG | | 599,740 |
Mexico - 1.2% |
America Movil S.A.B. de CV 6.45% 12/5/22 | MXN | 9,750,000 | | 701,251 |
Petroleos Mexicanos 6.625% (e)(f) | | 300,000 | | 309,000 |
TOTAL MEXICO | | 1,010,251 |
Netherlands - 0.3% |
Indosat Palapa Co. BV 7.375% 7/29/20 (e) | | 100,000 | | 107,625 |
Mozambique Ematum Finance 2020 6.305% 9/11/20 (Reg. S) | | 200,000 | | 188,500 |
TOTAL NETHERLANDS | | 296,125 |
Paraguay - 0.2% |
Telefonica Celular del Paraguay SA 6.75% 12/13/22 (e) | | 200,000 | | 203,000 |
Trinidad & Tobago - 0.2% |
Petroleum Co. of Trinidad & Tobago Ltd. 9.75% 8/14/19 (e) | | 150,000 | | 190,875 |
Turkey - 0.2% |
Arcelik A/S 5% 4/3/23 (e) | | 200,000 | | 180,000 |
Nonconvertible Bonds - continued |
| Principal
Amount (c) | | Value |
Venezuela - 1.2% |
Petroleos de Venezuela SA 8.5% 11/2/17 (e) | | $ 1,200,000 | | $ 1,077,000 |
TOTAL NONCONVERTIBLE BONDS (Cost $6,679,240) |
6,509,906
|
Government Obligations - 14.9% |
|
Armenia - 0.2% |
Republic of Armenia 6% 9/30/20 (e) | | 200,000 | | 196,750 |
Aruba - 0.4% |
Aruba Government 4.625% 9/14/23 (e) | | 400,000 | | 376,000 |
Azerbaijan - 0.4% |
State Oil Co. of Azerbaijan Republic 5.45% 2/9/17 (Reg. S) | | 300,000 | | 321,000 |
Bahrain - 0.2% |
Bahrain Kingdom 6.125% 8/1/23 (e) | | 200,000 | | 207,000 |
Barbados - 0.1% |
Barbados Government 7% 8/4/22 (e) | | 100,000 | | 95,000 |
Belarus - 0.5% |
Belarus Republic: | | | | |
8.75% 8/3/15 (Reg. S) | | 325,000 | | 325,813 |
8.95% 1/26/18 | | 100,000 | | 99,250 |
TOTAL BELARUS | | 425,063 |
Belize - 0.2% |
Belize Government 5% 2/20/38 (d)(e) | | 332,500 | | 204,488 |
Bermuda - 0.1% |
Bermuda Government 5.603% 7/20/20 (e) | | 100,000 | | 106,625 |
Bolivia - 0.2% |
Plurinational State of Bolivia 4.875% 10/29/22 (e) | | 200,000 | | 195,000 |
Cayman Islands - 0.1% |
Cayman Island Government 5.95% 11/24/19 (e) | | 100,000 | | 112,000 |
Congo - 0.3% |
Congo Republic 3.5% 6/30/29 (d) | | 325,883 | | 286,777 |
Dominican Republic - 0.2% |
Dominican Republic 5.875% 4/18/24 (e) | | 150,000 | | 146,250 |
Ecuador - 0.5% |
Ecuador Republic 9.375% 12/15/15 (e) | | 386,000 | | 409,160 |
Government Obligations - continued |
| Principal
Amount (c) | | Value |
El Salvador - 0.2% |
El Salvador Republic 7.625% 2/1/41 (e) | | $ 150,000 | | $ 156,375 |
Guatemala - 0.2% |
Guatemalan Republic 4.875% 2/13/28 (e) | | 200,000 | | 188,000 |
Honduras - 0.2% |
Republic of Honduras 7.5% 3/15/24 (e) | | 200,000 | | 176,000 |
Hungary - 1.2% |
Hungarian Republic: | | | | |
4.75% 2/3/15 | | 140,000 | | 144,200 |
6.375% 3/29/21 | | 508,000 | | 551,815 |
7.625% 3/29/41 | | 350,000 | | 394,188 |
TOTAL HUNGARY | | 1,090,203 |
Iraq - 0.2% |
Republic of Iraq 5.8% 1/15/28 (Reg. S) | | 250,000 | | 216,875 |
Ivory Coast - 0.3% |
Ivory Coast 7.1% 12/31/32 (d) | | 275,000 | | 248,188 |
Jamaica - 0.2% |
Jamaican Government 8% 6/24/19 | | 150,000 | | 146,625 |
Jordan - 0.3% |
Jordanian Kingdom 3.875% 11/12/15 | | 300,000 | | 300,375 |
Lebanon - 0.6% |
Lebanese Republic: | | | | |
6.1% 10/4/22 | | 200,000 | | 195,000 |
11.625% 5/11/16 (Reg. S) | | 250,000 | | 288,750 |
TOTAL LEBANON | | 483,750 |
Mongolia - 0.2% |
Mongolian People's Republic 5.125% 12/5/22 (Reg. S) | | 200,000 | | 176,600 |
Morocco - 0.4% |
Moroccan Kingdom: | | | | |
4.25% 12/11/22 (e) | | 200,000 | | 188,500 |
5.5% 12/11/42 (e) | | 200,000 | | 175,000 |
TOTAL MOROCCO | | 363,500 |
Namibia - 0.2% |
Republic of Namibia 5.5% 11/3/21 (e) | | 200,000 | | 210,500 |
Netherlands - 0.3% |
Republic of Angola 7% 8/16/19 (Issued by Northern Lights III BV for Republic of Angola) (Reg. S) | | 250,000 | | 270,625 |
Government Obligations - continued |
| Principal
Amount (c) | | Value |
Nigeria - 0.4% |
Republic of Nigeria 6.75% 1/28/21 (e) | | $ 350,000 | | $ 383,250 |
Panama - 0.2% |
Panamanian Republic 4.3% 4/29/53 | | 200,000 | | 163,200 |
Peru - 0.5% |
Peruvian Republic: | | | | |
7.35% 7/21/25 | | 100,000 | | 128,250 |
8.75% 11/21/33 | | 200,000 | | 291,500 |
TOTAL PERU | | 419,750 |
Philippines - 0.5% |
Philippine Republic 10.625% 3/16/25 | | 300,000 | | 474,000 |
Romania - 0.3% |
Romanian Republic 6.75% 2/7/22 (e) | | 190,000 | | 219,450 |
Russia - 1.2% |
Russian Federation: | | | | |
5.625% 4/4/42 (e) | | 350,000 | | 364,000 |
7.5% 3/31/30 (Reg. S) | | 250,250 | | 297,798 |
12.75% 6/24/28 (Reg. S) | | 225,000 | | 391,500 |
TOTAL RUSSIA | | 1,053,298 |
Senegal - 0.3% |
Republic of Senegal 8.75% 5/13/21 (e) | | 200,000 | | 219,500 |
Slovenia - 0.5% |
Republic of Slovenia: | | | | |
4.75% 5/10/18 (e) | | 200,000 | | 197,500 |
5.85% 5/10/23 (e) | | 200,000 | | 195,000 |
TOTAL SLOVENIA | | 392,500 |
Sri Lanka - 0.4% |
Democratic Socialist Republic of Sri Lanka 6.25% 10/4/20 (e) | | 300,000 | | 304,500 |
Tanzania - 0.2% |
Tanzania United Republic of 6.3921% 3/8/20 (h) | | 200,000 | | 209,250 |
Turkey - 0.3% |
Turkish Republic 11.875% 1/15/30 | | 165,000 | | 270,188 |
Ukraine - 0.7% |
Ukraine Government: | | | | |
7.5% 4/17/23 (Reg. S) | | 200,000 | | 175,000 |
Government Obligations - continued |
| Principal
Amount (c) | | Value |
Ukraine - continued |
Ukraine Government: - continued | | | | |
7.75% 9/23/20 (e) | | $ 225,000 | | $ 205,583 |
9.25% 7/24/17 (e) | | 200,000 | | 193,500 |
TOTAL UKRAINE | | 574,083 |
United States of America - 0.1% |
U.S. Treasury Bills, yield at date of purchase 0.02% 11/29/13 to 1/2/14 (g) | | 50,000 | | 49,998 |
Venezuela - 0.9% |
Venezuelan Republic 8.5% 10/8/14 | | 815,000 | | 806,035 |
Vietnam - 0.3% |
Vietnamese Socialist Republic 6.75% 1/29/20 (e) | | 200,000 | | 218,750 |
Zambia - 0.2% |
Republic of Zambia 5.375% 9/20/22 (e) | | 200,000 | | 180,500 |
TOTAL GOVERNMENT OBLIGATIONS (Cost $13,106,317) |
13,046,981
|
Money Market Funds - 1.4% |
| Shares | | |
Fidelity Cash Central Fund, 0.09% (b)
(Cost $1,249,619) | 1,249,619 | |
1,249,619
|
TOTAL INVESTMENT PORTFOLIO - 99.8% (Cost $77,648,944) | | 87,397,953 |
NET OTHER ASSETS (LIABILITIES) - 0.2% | | 155,686 |
NET ASSETS - 100% | $ 87,553,639 |
Futures Contracts |
| Expiration
Date | | Underlying
Face Amount
at Value | | Unrealized
Appreciation/
(Depreciation) |
Purchased |
Equity Index Contracts |
6 NYSE E-mini MSCI Emerging Markets Index Contracts (United States) | Dec. 2013 | | $ 307,170 | | $ (9,007) |
|
The face value of futures purchased as a percentage of net assets is 0.4% |
Currency Abbreviations |
MXN | - | Mexican peso |
Legend |
(a) Non-income producing |
(b) Affiliated fund that is generally available only to investment companies and other accounts managed by Fidelity Investments. The rate quoted is the annualized seven-day yield of the fund at period end. A complete unaudited listing of the fund's holdings as of its most recent quarter end is available upon request. In addition, each Fidelity Central Fund's financial statements, which are not covered by the Fund's Report of Independent Registered Public Accounting Firm, are available on the SEC's website or upon request. |
(c) Amount is stated in United States dollars unless otherwise noted. |
(d) Security initially issued at one coupon which converts to a higher coupon at a specified date. The rate shown is the rate at period end. |
(e) Security exempt from registration under Rule 144A of the Securities Act of 1933. These securities may be resold in transactions exempt from registration, normally to qualified institutional buyers. At the end of the period, the value of these securities amounted to $11,444,336 or 13.1% of net assets. |
(f) Security is perpetual in nature with no stated maturity date. |
(g) Security or a portion of the security was pledged to cover margin requirements for futures contracts. At period end, the value of securities pledged amounted to $49,998. |
(h) Coupon rates for floating and adjustable rate securities reflect the rates in effect at period end. |
Affiliated Central Funds |
Information regarding fiscal year to date income earned by the Fund from investments in Fidelity Central Funds is as follows: |
Fund | Income earned |
Fidelity Cash Central Fund | $ 3,903 |
Fidelity Securities Lending Cash Central Fund | 20 |
Total | $ 3,923 |
Other Information |
Categorizations in the Schedule of Investments are based on country or territory of incorporation. |
The following is a summary of the inputs used, as of October 31, 2013, involving the Fund's assets and liabilities carried at fair value. The inputs or methodology used for valuing securities may not be an indication of the risk associated with investing in those securities. For more information on valuation inputs, and their aggregation into the levels used in the table below, please refer to the Investment Valuation section in the accompanying Notes to Financial Statements. |
Valuation Inputs at Reporting Date: |
Description | Total | Level 1 | Level 2 | Level 3 |
Investments in Securities: | | | | |
Equities: | | | | |
Consumer Discretionary | $ 5,671,881 | $ 5,671,881 | $ - | $ - |
Consumer Staples | 5,673,128 | 5,673,128 | - | - |
Energy | 6,824,418 | 6,775,603 | 48,815 | - |
Financials | 17,832,600 | 16,829,611 | 1,002,989 | - |
Health Care | 1,079,535 | 863,737 | 215,798 | - |
Industrials | 4,958,488 | 4,958,488 | - | - |
Information Technology | 11,090,547 | 9,688,994 | 1,401,553 | - |
Materials | 6,822,552 | 6,600,497 | 222,055 | - |
Telecommunication Services | 4,671,214 | 3,902,066 | 769,148 | - |
Utilities | 1,967,084 | 1,704,829 | 262,255 | - |
Corporate Bonds | 6,509,906 | - | 6,509,906 | - |
Government Obligations | 13,046,981 | - | 13,046,981 | - |
Money Market Funds | 1,249,619 | 1,249,619 | - | - |
Total Investments in Securities: | $ 87,397,953 | $ 63,918,453 | $ 23,479,500 | $ - |
Derivative Instruments: | | | | |
Liabilities | | | | |
Futures Contracts | $ (9,007) | $ (9,007) | $ - | $ - |
Value of Derivative Instruments |
The following table is a summary of the Fund's value of derivative instruments by primary risk exposure as of October 31, 2013. For additional information on derivative instruments, please refer to the Derivative Instruments section in the accompanying Notes to Financial Statements. |
Primary Risk Exposure /
Derivative Type | Value |
| Asset | Liability |
Equity Risk | | |
Futures Contracts (a) | $ - | $ (9,007) |
(a) Reflects gross cumulative appreciation (depreciation) on futures contracts as presented in the Schedule of Investments. Only the period end receivable or payable for daily variation margin and net unrealized appreciation (depreciation) are presented in the Statement of Assets and Liabilities. |
Other Information |
The composition of credit quality ratings as a percentage of net assets is as follows (Unaudited): |
AAA,AA,A | 1.0% |
BBB | 6.9% |
BB | 5.5% |
B | 6.0% |
CCC,CC,C | 1.6% |
Not Rated | 1.2% |
Equities | 76.5% |
Short-Term Investments and Net Other Assets | 1.3% |
| 100.0% |
We have used ratings from Moody's Investors Service, Inc. Where Moody's® ratings are not available, we have used S&P® ratings. All ratings are as of the date indicated and do not reflect subsequent changes. Percentages are adjusted for the effect of futures contracts, if applicable. |
See accompanying notes which are an integral part of the financial statements.
Annual Report
Fidelity Total Emerging Markets Fund
Statement of Assets and Liabilities
| October 31, 2013 |
| | |
Assets | | |
Investment in securities, at value - See accompanying schedule: Unaffiliated issuers (cost $76,399,325) | $ 86,148,334 | |
Fidelity Central Funds (cost $1,249,619) | 1,249,619 | |
Total Investments (cost $77,648,944) | | $ 87,397,953 |
Cash | | 42,610 |
Foreign currency held at value (cost $91,066) | | 91,061 |
Receivable for investments sold | | 722,628 |
Receivable for fund shares sold | | 317,152 |
Dividends receivable | | 68,199 |
Interest receivable | | 355,898 |
Distributions receivable from Fidelity Central Funds | | 106 |
Prepaid expenses | | 239 |
Receivable from investment adviser for expense reductions | | 50,718 |
Other receivables | | 6,124 |
Total assets | | 89,052,688 |
| | |
Liabilities | | |
Payable for investments purchased | $ 933,179 | |
Payable for fund shares redeemed | 270,336 | |
Accrued management fee | 57,802 | |
Distribution and service plan fees payable | 12,355 | |
Payable for daily variation margin for derivative instruments | 3,420 | |
Other affiliated payables | 18,570 | |
Custodian fee payable | 140,291 | |
Other payables and accrued expenses | 63,096 | |
Total liabilities | | 1,499,049 |
| | |
Net Assets | | $ 87,553,639 |
Net Assets consist of: | | |
Paid in capital | | $ 80,118,542 |
Undistributed net investment income | | 1,219,736 |
Accumulated undistributed net realized gain (loss) on investments and foreign currency transactions | | (3,516,388) |
Net unrealized appreciation (depreciation) on investments and assets and liabilities in foreign currencies | | 9,731,749 |
Net Assets | | $ 87,553,639 |
See accompanying notes which are an integral part of the financial statements.
Annual Report
Statement of Assets and Liabilities - continued
| October 31, 2013 |
| | |
Calculation of Maximum Offering Price Class A:
Net Asset Value and redemption price per share ($18,837,427 ÷ 1,657,238 shares) | | $ 11.37 |
| | |
Maximum offering price per share (100/94.25 of $11.37) | | $ 12.06 |
Class T:
Net Asset Value and redemption price per share ($5,967,419 ÷ 526,353 shares) | | $ 11.34 |
| | |
Maximum offering price per share (100/96.50 of $11.34) | | $ 11.75 |
Class C:
Net Asset Value and offering price per share ($7,435,717 ÷ 658,492 shares)A | | $ 11.29 |
| | |
Total Emerging Markets:
Net Asset Value, offering price and redemption price per share ($49,959,436 ÷ 4,383,198 shares) | | $ 11.40 |
| | |
Institutional Class:
Net Asset Value, offering price and redemption price per share ($5,353,640 ÷ 469,800 shares) | | $ 11.40 |
A Redemption price per share is equal to net asset value less any applicable contingent deferred sales charge.
See accompanying notes which are an integral part of the financial statements.
Annual Report
Fidelity Total Emerging Markets Fund
Financial Statements - continued
Statement of Operations
| Year ended October 31, 2013 |
| | |
Investment Income | | |
Dividends | | $ 2,210,247 |
Interest | | 1,561,521 |
Income from Fidelity Central Funds | | 3,923 |
Income before foreign taxes withheld | | 3,775,691 |
Less foreign taxes withheld | | (240,765) |
Total income | | 3,534,926 |
| | |
Expenses | | |
Management fee | $ 884,762 | |
Transfer agent fees | 222,603 | |
Distribution and service plan fees | 128,889 | |
Accounting and security lending fees | 56,973 | |
Custodian fees and expenses | 410,719 | |
Independent trustees' compensation | 654 | |
Registration fees | 70,912 | |
Audit | 81,699 | |
Legal | 281 | |
Interest | 253 | |
Miscellaneous | 998 | |
Total expenses before reductions | 1,858,743 | |
Expense reductions | (223,996) | 1,634,747 |
Net investment income (loss) | | 1,900,179 |
Realized and Unrealized Gain (Loss) Net realized gain (loss) on: | | |
Investment securities: | | |
Unaffiliated issuers (net of foreign taxes of $30,003) | (1,717,551) | |
Investment not meeting investment restrictions | 922 | |
Foreign currency transactions | (84,114) | |
Futures contracts | (77,497) | |
Total net realized gain (loss) | | (1,878,240) |
Change in net unrealized appreciation (depreciation) on: Investment securities (net of decrease in deferred foreign taxes of $54,244) | 1,880,839 | |
Assets and liabilities in foreign currencies | 415 | |
Futures contracts | (9,007) | |
Total change in net unrealized appreciation (depreciation) | | 1,872,247 |
Net gain (loss) | | (5,993) |
Net increase (decrease) in net assets resulting from operations | | $ 1,894,186 |
See accompanying notes which are an integral part of the financial statements.
Annual Report
Statement of Changes in Net Assets
| Year ended
October 31,
2013 | For the period
November 1, 2011
(commencement of
operations) to
October 31, 2012 |
Increase (Decrease) in Net Assets | | |
Operations | | |
Net investment income (loss) | $ 1,900,179 | $ 1,612,877 |
Net realized gain (loss) | (1,878,240) | (1,586,062) |
Change in net unrealized appreciation (depreciation) | 1,872,247 | 7,859,502 |
Net increase (decrease) in net assets resulting
from operations | 1,894,186 | 7,886,317 |
Distributions to shareholders from net investment income | (1,561,667) | (96,645) |
Distributions to shareholders from net realized gain | (137,352) | - |
Total distributions | (1,699,019) | (96,645) |
Share transactions - net increase (decrease) | (15,755,086) | 95,209,478 |
Redemption fees | 87,191 | 27,217 |
Total increase (decrease) in net assets | (15,472,728) | 103,026,367 |
| | |
Net Assets | | |
Beginning of period | 103,026,367 | - |
End of period (including undistributed net investment income of $1,219,736 and undistributed net investment income of $1,406,377, respectively) | $ 87,553,639 | $ 103,026,367 |
See accompanying notes which are an integral part of the financial statements.
Annual Report
Financial Highlights - Class A
Years ended October 31, | 2013 | 2012 G |
Selected Per-Share Data | | |
Net asset value, beginning of period | $ 10.86 | $ 10.00 |
Income from Investment Operations | | |
Net investment income (loss) C | .18 | .20 |
Net realized and unrealized gain (loss) | .48 F | .68 |
Total from investment operations | .66 | .88 |
Distributions from net investment income | (.15) | (.02) |
Distributions from net realized gain | (.01) | - |
Total distributions | (.16) | (.02) |
Redemption fees added to paid in capital C | .01 | - I |
Net asset value, end of period | $ 11.37 | $ 10.86 |
Total Return A, B | 6.23% | 8.80% |
Ratios to Average Net Assets D, H | | |
Expenses before reductions | 1.89% | 1.87% |
Expenses net of fee waivers, if any | 1.65% | 1.65% |
Expenses net of all reductions | 1.62% | 1.62% |
Net investment income (loss) | 1.61% | 1.92% |
Supplemental Data | | |
Net assets, end of period (000 omitted) | $ 18,837 | $ 7,675 |
Portfolio turnover rate E | 120% | 70% |
A Total returns would have been lower if certain expenses had not been reduced during the applicable periods shown.
B Total returns do not include the effect of the sales charges.
C Calculated based on average shares outstanding during the period.
D Fees and expenses of any underlying Fidelity Central Funds are not included in the Fund's expense ratio. The Fund indirectly bears its proportionate share of the expenses of any underlying Fidelity Central Funds.
E Amount does not include the portfolio activity of any underlying Fidelity Central Funds.
F The amount shown for a share outstanding does not correspond with the aggregate net gain (loss) on investments for the period due to the timing of sales and repurchases of shares in relation to fluctuating market values of the investments of the Fund.
G For the period November 1, 2011 (commencement of operations) to October 31, 2012.
H Expense ratios reflect operating expenses of the class. Expenses before reductions do not reflect amounts reimbursed by the investment adviser or reductions from brokerage service arrangements or reductions from other expense offset arrangements and do not represent the amount paid by the class during periods when reimbursements or reductions occur. Expense ratios before reductions for start-up periods may not be representative of longer-term operating periods. Expenses net of fee waivers reflect expenses after reimbursement by the investment adviser but prior to reductions from brokerage service arrangements or other expense offset arrangements. Expenses net of all reductions represent the net expenses paid by the class.
I Amount represents less than $.01 per share.
See accompanying notes which are an integral part of the financial statements.
Annual Report
Financial Highlights - Class T
Years ended October 31, | 2013 | 2012 G |
Selected Per-Share Data | | |
Net asset value, beginning of period | $ 10.84 | $ 10.00 |
Income from Investment Operations | | |
Net investment income (loss) C | .15 | .17 |
Net realized and unrealized gain (loss) | .48 F | .68 |
Total from investment operations | .63 | .85 |
Distributions from net investment income | (.12) | (.01) |
Distributions from net realized gain | (.01) | - |
Total distributions | (.14) J | (.01) |
Redemption fees added to paid in capital C | .01 | - I |
Net asset value, end of period | $ 11.34 | $ 10.84 |
Total Return A, B | 5.93% | 8.56% |
Ratios to Average Net Assets D, H | | |
Expenses before reductions | 2.13% | 2.10% |
Expenses net of fee waivers, if any | 1.90% | 1.90% |
Expenses net of all reductions | 1.88% | 1.87% |
Net investment income (loss) | 1.36% | 1.67% |
Supplemental Data | | |
Net assets, end of period (000 omitted) | $ 5,967 | $ 5,823 |
Portfolio turnover rate E | 120% | 70% |
A Total returns would have been lower if certain expenses had not been reduced during the applicable periods shown.
B Total returns do not include the effect of the sales charges.
C Calculated based on average shares outstanding during the period.
D Fees and expenses of any underlying Fidelity Central Funds are not included in the Fund's expense ratio. The Fund indirectly bears its proportionate share of the expenses of any underlying Fidelity Central Funds.
E Amount does not include the portfolio activity of any underlying Fidelity Central Funds.
F The amount shown for a share outstanding does not correspond with the aggregate net gain (loss) on investments for the period due to the timing of sales and repurchases of shares in relation to fluctuating market values of the investments of the Fund.
G For the period November 1, 2011 (commencement of operations) to October 31, 2012.
H Expense ratios reflect operating expenses of the class. Expenses before reductions do not reflect amounts reimbursed by the investment adviser or reductions from brokerage service arrangements or reductions from other expense offset arrangements and do not represent the amount paid by the class during periods when reimbursements or reductions occur. Expense ratios before reductions for start-up periods may not be representative of longer-term operating periods. Expenses net of fee waivers reflect expenses after reimbursement by the investment adviser but prior to reductions from brokerage service arrangements or other expense offset arrangements. Expenses net of all reductions represent the net expenses paid by the class.
I Amount represents less than $.01 per share.
J Total distributions of $.14 per share is comprised of distributions from net investment income of $.124 and distributions from net realized gain of $.014 per share.
See accompanying notes which are an integral part of the financial statements.
Annual Report
Financial Highlights - Class C
Years ended October 31, | 2013 | 2012 G |
Selected Per-Share Data | | |
Net asset value, beginning of period | $ 10.80 | $ 10.00 |
Income from Investment Operations | | |
Net investment income (loss) C | .09 | .12 |
Net realized and unrealized gain (loss) | .47 F | .69 |
Total from investment operations | .56 | .81 |
Distributions from net investment income | (.07) | (.01) |
Distributions from net realized gain | (.01) | - |
Total distributions | (.08) | (.01) |
Redemption fees added to paid in capital C | .01 | - I |
Net asset value, end of period | $ 11.29 | $ 10.80 |
Total Return A, B | 5.31% | 8.07% |
Ratios to Average Net Assets D, H | | |
Expenses before reductions | 2.65% | 2.63% |
Expenses net of fee waivers, if any | 2.40% | 2.40% |
Expenses net of all reductions | 2.37% | 2.37% |
Net investment income (loss) | .86% | 1.17% |
Supplemental Data | | |
Net assets, end of period (000 omitted) | $ 7,436 | $ 5,824 |
Portfolio turnover rate E | 120% | 70% |
A Total returns would have been lower if certain expenses had not been reduced during the applicable periods shown.
B Total returns do not include the effect of the contingent deferred sales charge.
C Calculated based on average shares outstanding during the period.
D Fees and expenses of any underlying Fidelity Central Funds are not included in the Fund's expense ratio. The Fund indirectly bears its proportionate share of the expenses of any underlying Fidelity Central Funds.
E Amount does not include the portfolio activity of any underlying Fidelity Central Funds.
F The amount shown for a share outstanding does not correspond with the aggregate net gain (loss) on investments for the period due to the timing of sales and repurchases of shares in relation to fluctuating market values of the investments of the Fund.
G For the period November 1, 2011 (commencement of operations) to October 31, 2012.
H Expense ratios reflect operating expenses of the class. Expenses before reductions do not reflect amounts reimbursed by the investment adviser or reductions from brokerage service arrangements or reductions from other expense offset arrangements and do not represent the amount paid by the class during periods when reimbursements or reductions occur. Expense ratios before reductions for start-up periods may not be representative of longer-term operating periods. Expenses net of fee waivers reflect expenses after reimbursement by the investment adviser but prior to reductions from brokerage service arrangements or other expense offset arrangements. Expenses net of all reductions represent the net expenses paid by the class.
I Amount represents less than $.01 per share.
See accompanying notes which are an integral part of the financial statements.
Annual Report
Financial Highlights - Total Emerging Markets
Years ended October 31, | 2013 | 2012 F |
Selected Per-Share Data | | |
Net asset value, beginning of period | $ 10.89 | $ 10.00 |
Income from Investment Operations | | |
Net investment income (loss) B | .21 | .22 |
Net realized and unrealized gain (loss) | .47 E | .69 |
Total from investment operations | .68 | .91 |
Distributions from net investment income | (.17) | (.02) |
Distributions from net realized gain | (.01) | - |
Total distributions | (.18) | (.02) |
Redemption fees added to paid in capital B | .01 | - H |
Net asset value, end of period | $ 11.40 | $ 10.89 |
Total Return A | 6.44% | 9.15% |
Ratios to Average Net Assets C, G | | |
Expenses before reductions | 1.56% | 1.60% |
Expenses net of fee waivers, if any | 1.40% | 1.40% |
Expenses net of all reductions | 1.38% | 1.38% |
Net investment income (loss) | 1.85% | 2.16% |
Supplemental Data | | |
Net assets, end of period (000 omitted) | $ 49,959 | $ 81,416 |
Portfolio turnover rate D | 120% | 70% |
A Total returns would have been lower if certain expenses had not been reduced during the applicable periods shown.
B Calculated based on average shares outstanding during the period.
C Fees and expenses of any underlying Fidelity Central Funds are not included in the Fund's expense ratio. The Fund indirectly bears its proportionate share of the expenses of any underlying Fidelity Central Funds.
D Amount does not include the portfolio activity of any underlying Fidelity Central Funds.
E The amount shown for a share outstanding does not correspond with the aggregate net gain (loss) on investments for the period due to the timing of sales and repurchases of shares in relation to fluctuating market values of the investments of the Fund.
F For the period November 1, 2011 (commencement of operations) to October 31, 2012.
G Expense ratios reflect operating expenses of the class. Expenses before reductions do not reflect amounts reimbursed by the investment adviser or reductions from brokerage service arrangements or reductions from other expense offset arrangements and do not represent the amount paid by the class during periods when reimbursements or reductions occur. Expense ratios before reductions for start-up periods may not be representative of longer-term operating periods. Expenses net of fee waivers reflect expenses after reimbursement by the investment adviser but prior to reductions from brokerage service arrangements or other expense offset arrangements. Expenses net of all reductions represent the net expenses paid by the class.
H Amount represents less than $.01 per share.
See accompanying notes which are an integral part of the financial statements.
Annual Report
Financial Highlights - Institutional Class
Years ended October 31, | 2013 | 2012 F |
Selected Per-Share Data | | |
Net asset value, beginning of period | $ 10.89 | $ 10.00 |
Income from Investment Operations | | |
Net investment income (loss) B | .20 | .22 |
Net realized and unrealized gain (loss) | .48 E | .69 |
Total from investment operations | .68 | .91 |
Distributions from net investment income | (.17) | (.02) |
Distributions from net realized gain | (.01) | - |
Total distributions | (.18) | (.02) |
Redemption fees added to paid in capital B | .01 | - H |
Net asset value, end of period | $ 11.40 | $ 10.89 |
Total Return A | 6.44% | 9.15% |
Ratios to Average Net Assets C, G | | |
Expenses before reductions | 1.63% | 1.62% |
Expenses net of fee waivers, if any | 1.40% | 1.40% |
Expenses net of all reductions | 1.37% | 1.37% |
Net investment income (loss) | 1.86% | 2.17% |
Supplemental Data | | |
Net assets, end of period (000 omitted) | $ 5,354 | $ 2,287 |
Portfolio turnover rate D | 120% | 70% |
A Total returns would have been lower if certain expenses had not been reduced during the applicable periods shown.
B Calculated based on average shares outstanding during the period.
C Fees and expenses of any underlying Fidelity Central Funds are not included in the Fund's expense ratio. The Fund indirectly bears its proportionate share of the expenses of any underlying Fidelity Central Funds.
D Amount does not include the portfolio activity of any underlying Fidelity Central Funds.
E The amount shown for a share outstanding does not correspond with the aggregate net gain (loss) on investments for the period due to the timing of sales and repurchases of shares in relation to fluctuating market values of the investments of the Fund.
F For the period November 1, 2011 (commencement of operations) to October 31, 2012.
G Expense ratios reflect operating expenses of the class. Expenses before reductions do not reflect amounts reimbursed by the investment adviser or reductions from brokerage service arrangements or reductions from other expense offset arrangements and do not represent the amount paid by the class during periods when reimbursements or reductions occur. Expense ratios before reductions for start-up periods may not be representative of longer-term operating periods. Expenses net of fee waivers reflect expenses after reimbursement by the investment adviser but prior to reductions from brokerage service arrangements or other expense offset arrangements. Expenses net of all reductions represent the net expenses paid by the class.
H Amount represents less than $.01 per share.
See accompanying notes which are an integral part of the financial statements.
Annual Report
Fidelity Total Emerging Markets Fund
Notes to Financial Statements
For the period ended October 31, 2013
1. Organization.
Fidelity Total Emerging Markets Fund (the Fund) is a fund of Fidelity Investment Trust (the Trust) and is authorized to issue an unlimited number of shares. The Trust is registered under the Investment Company Act of 1940, as amended (the 1940 Act), as an open-end management investment company organized as a Massachusetts business trust. The Fund offers Class A, Class T, Class C, Total Emerging Markets and Institutional Class shares, each of which has equal rights as to assets and voting privileges. Each class has exclusive voting rights with respect to matters that affect that class. The Fund's investments in emerging markets can be subject to social, economic, regulatory, and political uncertainties and can be extremely volatile.
2. Investments in Fidelity Central Funds.
The Fund invests in Fidelity Central Funds, which are open-end investment companies generally available only to other investment companies and accounts managed by Fidelity Management & Research Company (FMR) and its affiliates. The Fund's Schedule of Investments lists each of the Fidelity Central Funds held as of period end, if any, as an investment of the Fund, but does not include the underlying holdings of each Fidelity Central Fund. As an Investing Fund, the Fund indirectly bears its proportionate share of the expenses of the underlying Fidelity Central Funds.
The Money Market Central Funds seek preservation of capital and current income and are managed by Fidelity Investments Money Management, Inc. (FIMM), an affiliate of FMR.
A complete unaudited list of holdings for each Fidelity Central Fund is available upon request or at the Securities and Exchange Commission (the SEC) website at www.sec.gov. In addition, the financial statements of the Fidelity Central Funds, which are not covered by the Fund's Report of Independent Registered Public Accounting Firm, are available on the SEC website or upon request.
3. Significant Accounting Policies.
The financial statements have been prepared in conformity with accounting principles generally accepted in the United States of America (GAAP), which require management to make certain estimates and assumptions at the date of the financial statements. Actual results could differ from those estimates. Subsequent events, if any, through the date that the financial statements were issued have been evaluated in the preparation of the financial statements. The following summarizes the significant accounting policies of the Fund:
Investment Valuation. Investments are valued as of 4:00 p.m. Eastern time on the last calendar day of the period. In accordance with valuation policies and procedures
Annual Report
Fidelity Total Emerging Markets Fund
Notes to Financial Statements - continued
3. Significant Accounting Policies - continued
Investment Valuation - continued
approved by the Board of Trustees (the Board), the Fund attempts to obtain prices from one or more third party pricing vendors or brokers to value its investments. When current market prices, quotations or currency exchange rates are not readily available or reliable, investments will be fair valued in good faith by the FMR Fair Value Committee (the Committee), in accordance with procedures adopted by the Board. Factors used in determining fair value vary by investment type and may include market or investment specific events, changes in interest rates and credit quality. The frequency with which these procedures are used cannot be predicted and they may be utilized to a significant extent. The Committee oversees the Fund's valuation policies and procedures and is responsible for approving and reporting to the Board all fair value determinations.
The Fund categorizes the inputs to valuation techniques used to value its investments into a disclosure hierarchy consisting of three levels as shown below:
Level 1 - quoted prices in active markets for identical investments
Level 2 - other significant observable inputs (including quoted prices for similar investments, interest rates, prepayment speeds, etc.)
Level 3 - unobservable inputs (including the Fund's own assumptions based on the best information available)
Valuation techniques used to value the Fund's investments by major category are as follows:
Equity securities, including restricted securities, for which market quotations are readily available, are valued at the last reported sale price or official closing price as reported by a third party pricing vendor on the primary market or exchange on which they are traded and are categorized as Level 1 in the hierarchy. In the event there were no sales during the day or closing prices are not available, securities are valued at the last quoted bid price or may be valued using the last available price and are generally categorized as Level 2 in the hierarchy. For foreign equity securities, when market or security specific events arise, comparisons to the valuation of American Depositary Receipts (ADRs), futures contracts, Exchange-Traded Funds (ETFs) and certain indexes as well as quoted prices for similar securities may be used and would be categorized as Level 2 in the hierarchy. Utilizing these techniques may result in transfers between Level 1 and Level 2. For equity securities, including restricted securities, where observable inputs are limited, assumptions about market activity and risk are used and these securities may be categorized as Level 3 in the hierarchy.
Debt securities, including restricted securities, are valued based on evaluated prices received from third party pricing vendors or from brokers who make markets in such
Annual Report
3. Significant Accounting Policies - continued
Investment Valuation - continued
securities. For corporate bonds and foreign government and government agency obligations, pricing vendors utilize matrix pricing which considers yield or price of bonds of comparable quality, coupon, maturity and type as well as broker-supplied prices. When independent prices are unavailable or unreliable, debt securities may be valued utilizing pricing methodologies which consider similar factors that would be used by third party pricing vendors. Debt securities are generally categorized as Level 2 in the hierarchy but may be Level 3 depending on the circumstances.
Futures contracts are valued at the settlement price or official closing price established each day by the board of trade or exchange on which they are traded and are categorized as Level 1 in the hierarchy. Investments in open-end mutual funds, including the Fidelity Central Funds, are valued at their closing net asset value (NAV) each business day and are categorized as Level 1 in the hierarchy.
Changes in valuation techniques may result in transfers in or out of an assigned level within the disclosure hierarchy. The aggregate value of investments by input level, as of October 31, 2013, is included at the end of the Fund's Schedule of Investments.
Foreign Currency. The Fund may use foreign currency contracts to facilitate transactions in foreign-denominated securities. Gains and losses from these transactions may arise from changes in the value of the foreign currency or if the counterparties do not perform under the contracts' terms.
Foreign-denominated assets, including investment securities, and liabilities are translated into U.S. dollars at the exchange rates at period end. Purchases and sales of investment securities, income and dividends received and expenses denominated in foreign currencies are translated into U.S. dollars at the exchange rate in effect on the transaction date.
The effects of exchange rate fluctuations on investments are included with the net realized and unrealized gain (loss) on investment securities. Other foreign currency transactions resulting in realized and unrealized gain (loss) are disclosed separately.
Investment Transactions and Income. For financial reporting purposes, the Fund's investment holdings and NAV include trades executed through the end of the last business day of the period. The NAV per share for processing shareholder transactions is calculated as of the close of business of the New York Stock Exchange (NYSE), normally 4:00 p.m. Eastern time and includes trades executed through the end of the prior business day. Gains and losses on securities sold are determined on the basis of identified cost. Dividend income is recorded on the ex-dividend date, except for certain dividends from foreign securities where the ex-dividend date may have passed, which are recorded
Annual Report
Fidelity Total Emerging Markets Fund
Notes to Financial Statements - continued
3. Significant Accounting Policies - continued
Investment Transactions and Income - continued
as soon as the Fund is informed of the ex-dividend date. Non-cash dividends included in dividend income, if any, are recorded at the fair market value of the securities received. Distributions received on securities that represent a return of capital or capital gain are recorded as a reduction of cost of investments and/or as a realized gain. Subsequent to ex-dividend date the Fund determines the components of these distributions, based upon receipt of tax filings or other correspondence relating to the underlying investment. Interest income and distributions from the Fidelity Central Funds are accrued as earned. Interest income includes coupon interest and amortization of premium and accretion of discount on debt securities. Investment income is recorded net of foreign taxes withheld where recovery of such taxes is uncertain.
Class Allocations and Expenses. Investment income, realized and unrealized capital gains and losses, common expenses of the Fund, and certain fund-level expense reductions, if any, are allocated daily on a pro-rata basis to each class based on the relative net assets of each class to the total net assets of the Fund. Each class differs with respect to transfer agent and distribution and service plan fees incurred. Certain expense reductions may also differ by class. For the reporting period, the allocated portion of income and expenses to each class as a percent of its average net assets may vary due to the timing of recording these transactions in relation to fluctuating net assets of the classes. Expenses directly attributable to a fund are charged to that fund. Expenses attributable to more than one fund are allocated among the respective funds on the basis of relative net assets or other appropriate methods. Expense estimates are accrued in the period to which they relate and adjustments are made when actual amounts are known.
Income Tax Information and Distributions to Shareholders. Each year, the Fund intends to qualify as a regulated investment company under Subchapter M of the Internal Revenue Code, including distributing substantially all of its taxable income and realized gains. As a result, no provision for U.S. Federal income taxes is required. As of October 31, 2013, the Fund did not have any unrecognized tax benefits in the financial statements; nor is the Fund aware of any tax positions for which it is reasonably possible that the total amounts of unrecognized tax benefits will significantly change in the next twelve months. The Fund files a U.S. federal tax return, in addition to state and local tax returns as required. The Fund's federal income tax returns are subject to examination by the Internal Revenue Service (IRS) for a period of three fiscal years after they are filed. State and local tax returns may be subject to examination for an additional fiscal year depending on the jurisdiction. Foreign taxes are provided for based on the Fund's understanding of the tax rules and rates that exist in the foreign markets in which it invests. The Fund is subject to a tax imposed on capital gains by certain countries in which it invests. An estimated deferred tax liability for net unrealized appreciation on
Annual Report
3. Significant Accounting Policies - continued
Income Tax Information and Distributions to Shareholders - continued
the applicable securities is included in Other payables and accrued expenses on the Statement of Assets & Liabilities.
Distributions are declared and recorded on the ex-dividend date. Income dividends and capital gain distributions are declared separately for each class. Income and capital gain distributions are determined in accordance with income tax regulations, which may differ from GAAP. In addition, the Fund claimed a portion of the payment made to redeeming shareholders as a distribution for income tax purposes.
Capital accounts within the financial statements are adjusted for permanent book-tax differences. These adjustments have no impact on net assets or the results of operations. Temporary book-tax differences will reverse in a subsequent period.
Book-tax differences are primarily due to futures transactions, foreign currency transactions, certain foreign taxes, passive foreign investment companies (PFIC), market discount, capital loss carry forwards and losses deferred due to wash sales.
The federal tax cost of investment securities and unrealized appreciation (depreciation) as of period end were as follows:
Gross unrealized appreciation | $ 12,054,189 |
Gross unrealized depreciation | (2,823,600) |
Net unrealized appreciation (depreciation) on securities and other investments | $ 9,230,589 |
| |
Tax Cost | $ 78,167,364 |
The tax-based components of distributable earnings as of period end were as follows:
Undistributed ordinary income | $ 1,161,940 |
Capital loss carryforward | $ (2,949,184) |
Net unrealized appreciation (depreciation) | $ 9,230,033 |
Capital loss carryforwards are only available to offset future capital gains of the Fund to the extent provided by regulations and may be limited. Under the Regulated Investment Company Modernization Act of 2010 (the Act), the Fund is permitted to carry forward capital losses incurred in taxable years beginning after December 22, 2010 for an unlimited period and such capital losses are required to be used prior to any losses that expire.
Annual Report
Fidelity Total Emerging Markets Fund
Notes to Financial Statements - continued
3. Significant Accounting Policies - continued
Income Tax Information and Distributions to Shareholders - continued
The capital loss carryforward information presented below, including any applicable limitation, is estimated as of fiscal period end and is subject to adjustment.
No expiration | |
Short-term | $ (2,949,184) |
The tax character of distributions paid was as follows:
| October 31, 2013 | October 31, 2012 |
Ordinary Income | $ 1,699,019 | $ 96,645 |
Short-Term Trading (Redemption) Fees. Shares held by investors in the Fund less than 90 days may have been subject to a redemption fee equal to 1.50% of the net asset value of shares redeemed. All redemption fees, which reduce the proceeds of the shareholder redemption, are retained by the Fund and accounted for as an addition to paid in capital.
Restricted Securities. The Fund may invest in securities that are subject to legal or contractual restrictions on resale. These securities generally may be resold in transactions exempt from registration or to the public if the securities are registered. Disposal of these securities may involve time-consuming negotiations and expense, and prompt sale at an acceptable price may be difficult. Information regarding restricted securities is included at the end of the Fund's Schedule of Investments.
New Accounting Pronouncement. The Financial Accounting Standards Board issued in December 2011, Accounting Standard Update No. 2011-11, Disclosures about Offsetting Assets and Liabilities, and in January 2013, Accounting Standards Update No. 2013-1 Clarifying the Scope of Disclosures about Offsetting Assets and Liabilities. These updates create new disclosure requirements requiring entities to disclose both gross and net information for derivatives and other financial instruments that are either offset in the Statement of Assets and Liabilities or subject to an enforceable master netting arrangement or similar agreement. The disclosure requirements are effective for annual reporting periods beginning on or after January 1, 2013, and interim periods within those annual periods. Management expects that the impact of the updates' adoption will be limited to additional financial statement disclosures as applicable.
4. Derivative Instruments.
Risk Exposures and the Use of Derivative Instruments. The Fund's investment objective allows the Fund to enter into various types of derivative contracts, including futures contracts. Derivatives are investments whose value is primarily derived from
Annual Report
4. Derivative Instruments - continued
Risk Exposures and the Use of Derivative Instruments - continued
underlying assets, indices or reference rates and may be transacted on an exchange or over-the-counter (OTC). Derivatives may involve a future commitment to buy or sell a specified asset based on specified terms, to exchange future cash flows at periodic intervals based on a notional principal amount, or for one party to make one or more payments upon the occurrence of specified events in exchange for periodic payments from the other party.
The Fund used derivatives to increase returns and to manage exposure to certain risks as defined below. The success of any strategy involving derivatives depends on analysis of numerous economic factors, and if the strategies for investment do not work as intended, the Fund may not achieve its objectives.
The Fund's use of derivatives increased or decreased its exposure to the following risk:
Equity Risk | Equity risk relates to the fluctuations in the value of financial instruments as a result of changes in market prices (other than those arising from interest rate risk or foreign exchange risk), whether caused by factors specific to an individual investment, its issuer, or all factors affecting all instruments traded in a market or market segment. |
The Fund is also exposed to additional risks from investing in derivatives, such as liquidity risk and counterparty credit risk. Liquidity risk is the risk that the Fund will be unable to close out the derivative in the open market in a timely manner. Counterparty credit risk is the risk that the counterparty will not be able to fulfill its obligation to the Fund. Counterparty credit risk related to exchange-traded futures contracts may be mitigated by the protection provided by the exchange on which they trade.
Investing in derivatives may involve greater risks than investing in the underlying assets directly and, to varying degrees, may involve risk of loss in excess of any initial investment and collateral received and amounts recognized in the Statement of Assets and Liabilities. In addition, there may be the risk that the change in value of the derivative contract does not correspond to the change in value of the underlying instrument.
Futures Contracts. A futures contract is an agreement between two parties to buy or sell a specified underlying instrument for a fixed price at a specified future date. The Fund used futures contracts to manage its exposure to the stock market.
Upon entering into a futures contract, a fund is required to deposit either cash or securities (initial margin) with a clearing broker in an amount equal to a certain percentage of the face value of the contract. Futures contracts are marked-to-market daily and subsequent daily payments (variation margin) are made or received by a fund depending on
Annual Report
Fidelity Total Emerging Markets Fund
Notes to Financial Statements - continued
4. Derivative Instruments - continued
Futures Contracts - continued
the daily fluctuations in the value of the futures contracts and are recorded as unrealized appreciation or (depreciation). This receivable and/or payable, if any, is included in daily variation margin for derivative instruments in the Statement of Assets and Liabilities. Realized gain or (loss) is recorded upon the expiration or closing of a futures contract.
Any open futures contracts at period end are presented in the Schedule of Investments under the caption "Futures Contracts." The underlying face amount at value reflects each contract's exposure to the underlying instrument or index at period end and is representative of activity for the period. Securities deposited to meet initial margin requirements are identified in the Schedule of Investments.
During the period the Fund recognized net realized gain (loss) of $(77,497) and a change in net unrealized appreciation (depreciation) of $(9,007) related to its investment in futures contracts. These amounts are included in the Statement of Operations.
5. Purchases and Sales of Investments.
Purchases and sales of securities, other than short-term securities, aggregated $127,907,727 and $141,712,892, respectively.
The Fund realized a gain on the sale of an investment not meeting the investment restrictions of the Fund.
6. Fees and Other Transactions with Affiliates.
Management Fee. FMR and its affiliates provide the Fund with investment management related services for which the Fund pays a monthly management fee. The management fee is the sum of an individual fund fee rate that is based on an annual rate of .55% of the Fund's average net assets and an annualized group fee rate that averaged .25% during the period. The group fee rate is based upon the average net assets of all the mutual funds advised by FMR, including any mutual funds previously advised by FMR that are currently advised by Fidelity SelectCo, LLC, an affiliate of FMR. The group fee rate decreases as assets under management increase and increases as assets under management decrease. For the reporting period, the total annual management fee rate was .81% of the Fund's average net assets.
Distribution and Service Plan Fees. In accordance with Rule 12b-1 of the 1940 Act, the Fund has adopted separate Distribution and Service Plans for each class of shares. Certain classes pay Fidelity Distributors Corporation (FDC), an affiliate of FMR, separate Distribution and Service Fees, each of which is based on an annual percentage of each class' average net assets. In addition, FDC may pay financial intermediaries for selling shares of the Fund and providing shareholder support services. For the period,
Annual Report
6. Fees and Other Transactions with Affiliates - continued
Distribution and Service Plan Fees - continued
the Distribution and Service Fee rates, total fees and amounts retained by FDC were as follows:
| Distribution
Fee | Service
Fee | Total Fees | Retained
by FDC |
Class A | -% | .25% | $ 35,394 | $ 11,702 |
Class T | .25% | .25% | 31,862 | 11,312 |
Class C | .75% | .25% | 61,633 | 54,524 |
| | | $ 128,889 | $ 77,538 |
Sales Load. FDC may receive a front-end sales charge of up to 5.75% for selling Class A shares and 3.50% for selling Class T shares, some of which is paid to financial intermediaries for selling shares of the Fund. Depending on the holding period, FDC may receive contingent deferred sales charges levied on Class A, Class T, and Class C redemptions. The deferred sales charges range from 1.00% for Class C shares, 1.00% for certain purchases of Class A shares and .25% for certain purchases of Class T shares.
For the period, sales charge amounts retained by FDC were as follows:
| Retained
by FDC |
Class A | $ 13,119 |
Class T | 3,441 |
Class C* | 578 |
| $ 17,138 |
* When Class C shares are initially sold, FDC pays commissions from its own resources to financial intermediaries through which the sales are made.
Transfer Agent Fees. Fidelity Investments Institutional Operations Company, Inc., (FIIOC), an affiliate of FMR, is the transfer, dividend disbursing and shareholder servicing agent for each class of the Fund. FIIOC receives account fees and asset-based fees that vary according to the account size and type of account of the shareholders of the respective classes of the Fund. FIIOC pays for typesetting, printing and mailing of shareholder reports, except proxy statements.
Annual Report
Fidelity Total Emerging Markets Fund
Notes to Financial Statements - continued
6. Fees and Other Transactions with Affiliates - continued
Transfer Agent Fees - continued
For the period, transfer agent fees for each class were as follows:
| Amount | % of
Average
Net Assets |
Class A | $ 31,225 | .22 |
Class T | 15,225 | .24 |
Class C | 15,227 | .25 |
Total Emerging Markets | 153,704 | .19 |
Institutional Class | 7,222 | .19 |
| $ 222,603 | |
Accounting and Security Lending Fees. Fidelity Service Company, Inc. (FSC), an affiliate of FMR, maintains the Fund's accounting records. The accounting fee is based on the level of average net assets for each month. Under a separate contract, FSC administers the security lending program. The security lending fee is based on the number and duration of lending transactions.
Brokerage Commissions. The Fund placed a portion of its portfolio transactions with brokerage firms which are affiliates of the investment adviser. Brokerage commissions are included in net realized gain (loss) and change in net unrealized appreciation (depreciation) in the Statement of Operations. The commissions paid to these affiliated firms were $996 for the period.
Interfund Lending Program. Pursuant to an Exemptive Order issued by the SEC, the Fund, along with other registered investment companies having management contracts with FMR, may participate in an interfund lending program. This program provides an alternative credit facility allowing the funds to borrow from, or lend money to, other participating affiliated funds. At period end, there were no interfund loans outstanding. The Fund's activity in this program during the period for which loans were outstanding was as follows:
Borrower or Lender | Average Loan
Balance | Weighted Average
Interest Rate | Interest
Expense |
Borrower | $ 3,919,500 | .39% | $ 253 |
7. Committed Line of Credit.
The Fund participates with other funds managed by FMR or an affiliate in a $4.25 billion credit facility (the "line of credit") to be utilized for temporary or emergency purposes to fund shareholder redemptions or for other short-term liquidity purposes. The Fund has
Annual Report
7. Committed Line of Credit - continued
agreed to pay commitment fees on its pro-rata portion of the line of credit, which amounted to $248 and is reflected in Miscellaneous expenses on the Statement of Operations. During the period, there were no borrowings on this line of credit.
8. Security Lending.
The Fund lends portfolio securities through a lending agent from time to time in order to earn additional income. For equity securities, a lending agent is used and may loan securities to certain qualified borrowers, including Fidelity Capital Markets (FCM), a broker-dealer affiliated with the Fund. On the settlement date of the loan, the Fund receives collateral (in the form of U.S. Treasury obligations, letters of credit and/or cash) against the loaned securities and maintains collateral in an amount not less than 100% of the market value of the loaned securities during the period of the loan. The market value of the loaned securities is determined at the close of business of the Fund and any additional required collateral is delivered to the Fund on the next business day. If the borrower defaults on its obligation to return the securities loaned because of insolvency or other reasons, the Fund may apply collateral received from the borrower against the obligation. The Fund may experience delays and costs in recovering the securities loaned. Any cash collateral received is invested in the Fidelity Securities Lending Cash Central Fund. At period end, there were no security loans outstanding. Security lending income represents the income earned on investing cash collateral, less rebates paid to borrowers and any lending agent fees associated with the loan, plus any premium payments received for lending certain types of securities. Security lending income is presented in the Statement of Operations as a component of income from Fidelity Central Funds. Total security lending income during the period amounted to $20. During the period, there were no securities loaned to FCM.
9. Expense Reductions.
FMR contractually agreed to reimburse each class to the extent annual operating expenses exceeded certain levels of average net assets as noted in the table below. This reimbursement will remain in place through December 31, 2014. Some expenses, for example interest expense, including commitment fees, are excluded from this reimbursement.
Annual Report
Fidelity Total Emerging Markets Fund
Notes to Financial Statements - continued
9. Expense Reductions - continued
The following classes were in reimbursement during the period:
| Expense
Limitations | Reimbursement |
| | |
Class A | 1.65% | $ 33,991 |
Class T | 1.90% | 14,907 |
Class C | 2.40% | 15,690 |
Total Emerging Markets | 1.40% | 123,344 |
Institutional Class | 1.40% | 8,511 |
| | $ 196,443 |
In addition, FMR reimbursed a portion of the Fund's operating expenses during the period in the amount of $426.
Commissions paid to certain brokers with whom FMR, or its affiliates, places trades on behalf of the Fund include an amount in addition to trade execution, which may be rebated back to the Fund to offset certain expenses. This amount totaled $26,904 for the period. In addition, through arrangements with the Fund's custodian, credits realized as a result of uninvested cash balances were used to reduce the Fund's expenses. During the period, these credits reduced the Fund's custody expenses by $223.
10. Distributions to Shareholders.
Distributions to shareholders of each class were as follows:
Years ended October 31, | 2013 | 2012 A |
From net investment income | | |
Class A | $ 104,565 | $ 9,099 |
Class T | 69,282 | 4,204 |
Class C | 35,970 | 3,000 |
Total Emerging Markets | 1,316,259 | 75,940 |
Institutional Class | 35,591 | 4,402 |
Total | $ 1,561,667 | $ 96,645 |
From net realized gain | | |
Class A | $ 10,027 | $ - |
Class T | 7,822 | - |
Class C | 7,516 | - |
Total Emerging Markets | 109,039 | - |
Institutional Class | 2,948 | - |
Total | $ 137,352 | $ - |
A For the period November 1, 2011 (commencement of operations) to October 31, 2012.
Annual Report
11. Share Transactions.
Transactions for each class of shares were as follows:
| Shares | Dollars |
Years ended October 31, | 2013 | 2012 A | 2013 | 2012 A |
Class A | | | | |
Shares sold | 1,550,621 | 723,537 | $ 17,267,543 | $ 7,311,002 |
Reinvestment of distributions | 9,656 | 949 | 105,541 | 9,099 |
Shares redeemed | (609,546) | (17,979) | (6,666,165) | (179,387) |
Net increase (decrease) | 950,731 | 706,507 | $ 10,706,919 | $ 7,140,714 |
Class T | | | | |
Shares sold | 277,882 | 597,107 | $ 3,114,089 | $ 6,082,522 |
Reinvestment of distributions | 7,041 | 439 | 76,883 | 4,204 |
Shares redeemed | (295,695) | (60,421) | (3,268,261) | (637,924) |
Net increase (decrease) | (10,772) | 537,125 | $ (77,289) | $ 5,448,802 |
Class C | | | | |
Shares sold | 431,831 | 540,321 | $ 4,824,945 | $ 5,429,037 |
Reinvestment of distributions | 3,973 | 314 | 43,420 | 3,000 |
Shares redeemed | (316,804) | (1,143) | (3,521,280) | (12,081) |
Net increase (decrease) | 119,000 | 539,492 | $ 1,347,085 | $ 5,419,956 |
Total Emerging Markets | | | | |
Shares sold | 5,085,608 | 8,901,615 | $ 57,439,168 | $ 89,854,661 |
Reinvestment of distributions | 113,766 | 7,686 | 1,243,462 | 73,759 |
Shares redeemed | (8,294,710) | (1,430,767) | (89,232,029) | (14,834,512) |
Net increase (decrease) | (3,095,336) | 7,478,534 | $ (30,549,399) | $ 75,093,908 |
Institutional Class | | | | |
Shares sold | 491,268 | 209,638 | $ 5,357,985 | $ 2,101,696 |
Reinvestment of distributions | 3,526 | 459 | 38,539 | 4,402 |
Shares redeemed | (235,091) | - | (2,578,926) | - |
Net increase (decrease) | 259,703 | 210,097 | $ 2,817,598 | $ 2,106,098 |
A For the period November 1, 2011 (commencement of operations) to October 31, 2012.
12. Other.
The Fund's organizational documents provide former and current trustees and officers with a limited indemnification against liabilities arising in connection with the performance of their duties to the Fund. In the normal course of business, the Fund may also enter into contracts that provide general indemnifications. The Fund's maximum exposure under these arrangements is unknown as this would be dependent on future
Annual Report
Fidelity Total Emerging Markets Fund
Notes to Financial Statements - continued
12. Other - continued
claims that may be made against the Fund. The risk of material loss from such claims is considered remote.
At the end of the period, FMR or its affiliates were the owners of record of 16% of the total outstanding shares of the Fund.
Annual Report
To the Trustees of Fidelity Investment Trust and the Shareholders of Fidelity Total Emerging Markets Fund:
In our opinion, the accompanying statement of assets and liabilities, including the schedule of investments, and the related statements of operations and of changes in net assets and the financial highlights present fairly, in all material respects, the financial position of Fidelity Total Emerging Markets Fund (a fund of Fidelity Investment Trust) at October 31, 2013, the results of its operations for the year then ended, the changes in its net assets for the period indicated and the financial highlights for each of the periods indicated, in conformity with accounting principles generally accepted in the United States of America. These financial statements and financial highlights (hereafter referred to as "financial statements") are the responsibility of the Fidelity Total Emerging Markets Fund's management. Our responsibility is to express an opinion on these financial statements based on our audits. We conducted our audits of these financial statements in accordance with the standards of the Public Company Accounting Oversight Board (United States). Those standards require that we plan and perform the audit to obtain reasonable assurance about whether the financial statements are free of material misstatement. An audit includes examining, on a test basis, evidence supporting the amounts and disclosures in the financial statements, assessing the accounting principles used and significant estimates made by management, and evaluating the overall financial statement presentation. We believe that our audits, which included confirmation of securities at October 31, 2013 by correspondence with the custodian and brokers, provide a reasonable basis for our opinion.
PricewaterhouseCoopers LLP
Boston, Massachusetts
December 17, 2013
Annual Report
The Trustees, Member of the Advisory Board, and executive officers of the trust and fund, as applicable, are listed below. The Board of Trustees governs the fund and is responsible for protecting the interests of shareholders. The Trustees are experienced executives who meet periodically throughout the year to oversee the fund's activities, review contractual arrangements with companies that provide services to the fund, oversee management of the risks associated with such activities and contractual arrangements, and review the fund's performance. Except for James C. Curvey, Ned C. Lautenbach, Ronald P. O'Hanley, and William S. Stavropoulos, each of the Trustees oversees 171 funds. Mr. Curvey oversees 394 funds. Mr. Lautenbach, Mr. O'Hanley, and Mr. Stavropoulos each oversees 245 funds.
The Trustees hold office without limit in time except that (a) any Trustee may resign; (b) any Trustee may be removed by written instrument, signed by at least two-thirds of the number of Trustees prior to such removal; (c) any Trustee who requests to be retired or who has become incapacitated by illness or injury may be retired by written instrument signed by a majority of the other Trustees; and (d) any Trustee may be removed at any special meeting of shareholders by a two-thirds vote of the outstanding voting securities of the trust. Each Trustee who is not an interested person of the trust and the fund (as defined in the 1940 Act) (Independent Trustee), shall retire not later than the last day of the calendar year in which his or her 75th birthday occurs. The Independent Trustees may waive this mandatory retirement age policy with respect to individual Trustees. The executive officers and Advisory Board Member hold office without limit in time, except that any officer and Advisory Board Member may resign or may be removed by a vote of a majority of the Trustees at any regular meeting or any special meeting of the Trustees. Except as indicated, each individual has held the office shown or other offices in the same company for the past five years.
Experience, Skills, Attributes, and Qualifications of the Fund's Trustees. The Governance and Nominating Committee has adopted a statement of policy that describes the experience, qualifications, attributes, and skills that are necessary and desirable for potential Independent Trustee candidates (Statement of Policy). The Board believes that each Trustee satisfied at the time he or she was initially elected or appointed a Trustee, and continues to satisfy, the standards contemplated by the Statement of Policy. The Governance and Nominating Committee also engages professional search firms to help identify potential Independent Trustee candidates who have the experience, qualifications, attributes, and skills consistent with the Statement of Policy. From time to time, additional criteria based on the composition and skills of the current Independent Trustees, as well as experience or skills that may be appropriate in light of future changes to board composition, business conditions, and regulatory or other developments, have also been considered by the professional search firms and the Governance and Nominating Committee. In addition, the Board takes into account the Trustees' commitment and participation in Board and committee meetings, as well as their leadership of standing and ad hoc committees throughout their tenure.
Annual Report
Trustees and Officers - continued
In determining that a particular Trustee was and continues to be qualified to serve as a Trustee, the Board has considered a variety of criteria, none of which, in isolation, was controlling. The Board believes that, collectively, the Trustees have balanced and diverse experience, qualifications, attributes, and skills, which allow the Board to operate effectively in governing the fund and protecting the interests of shareholders. Information about the specific experience, skills, attributes, and qualifications of each Trustee, which in each case led to the Board's conclusion that the Trustee should serve (or continue to serve) as a trustee of the fund, is provided below.
Board Structure and Oversight Function. James C. Curvey is an interested person (as defined in the 1940 Act) and currently serves as Chairman. The Trustees have determined that an interested Chairman is appropriate and benefits shareholders because an interested Chairman has a personal and professional stake in the quality and continuity of services provided to the fund. Independent Trustees exercise their informed business judgment to appoint an individual of their choosing to serve as Chairman, regardless of whether the Trustee happens to be independent or a member of management. The Independent Trustees have determined that they can act independently and effectively without having an Independent Trustee serve as Chairman and that a key structural component for assuring that they are in a position to do so is for the Independent Trustees to constitute a substantial majority for the Board. The Independent Trustees also regularly meet in executive session. Ned C. Lautenbach serves as Chairman of the Independent Trustees and as such (i) acts as a liaison between the Independent Trustees and management with respect to matters important to the Independent Trustees and (ii) with management prepares agendas for Board meetings.
Fidelity funds are overseen by different Boards of Trustees. The fund's Board oversees Fidelity's equity and high income funds and another Board oversees Fidelity's investment-grade bond, money market, and asset allocation funds. The asset allocation funds may invest in Fidelity funds overseen by the fund's Board. The use of separate Boards, each with its own committee structure, allows the Trustees of each group of Fidelity funds to focus on the unique issues of the funds they oversee, including common research, investment, and operational issues. On occasion, the separate Boards establish joint committees to address issues of overlapping consequences for the Fidelity funds overseen by each Board.
The Trustees operate using a system of committees to facilitate the timely and efficient consideration of all matters of importance to the Trustees, the fund, and fund shareholders and to facilitate compliance with legal and regulatory requirements and oversight of the fund's activities and associated risks. The Board, acting through its committees, has charged FMR and its affiliates with (i) identifying events or circumstances the occurrence of which could have demonstrably adverse effects on the fund's business and/or reputation; (ii) implementing processes and controls to lessen the possibility that such events or circumstances occur or to mitigate the effects of such events or circumstances if they do occur; and (iii) creating and maintaining a system designed to evaluate continuously business and market conditions in order to facilitate the identification and implementation processes described in (i) and (ii) above. Because the day-to-day operations and activities of the fund are carried out by or through FMR, its affiliates and other service providers, the fund's exposure to risks is mitigated but not eliminated by the processes overseen by the Trustees. While each of the Board's committees has responsibility for overseeing different aspects of the fund's activities, oversight is exercised primarily through the Operations, Audit, and Compliance Committees. In addition, the Independent Trustees have worked with FMR to enhance the Board's oversight of investment and financial risks, legal and regulatory risks, technology risks, and operational risks, including the development of additional risk reporting to the Board. For example, a working group comprised of Independent Trustees and FMR has worked and continues to work to review the Fidelity funds' valuation-related activities, reporting and risk management. Appropriate personnel, including but not limited to the fund's Chief Compliance Officer (CCO), FMR's internal auditor, the independent accountants, the fund's Treasurer and portfolio management personnel, make periodic reports to the Board's committees, as appropriate, including an annual review of FMR's risk management program for the Fidelity funds. The responsibilities of each standing committee, including their oversight responsibilities, are described further under "Standing Committees of the Fund's Trustees."
Annual Report
The fund's Statement of Additional Information (SAI) includes more information about the Trustees. To request a free copy, call Fidelity at 1-877-208-0098.
Interested Trustees*:
Correspondence intended for each Trustee who is an interested person may be sent to Fidelity Investments, 245 Summer Street, Boston, Massachusetts 02210.
Name, Year of Birth; Principal Occupations and Other Relevant Experience+ |
James C. Curvey (1935) |
Year of Election or Appointment: 2007 Trustee Chairman of the Board of Trustees |
| Mr. Curvey also serves as Trustee of other Fidelity funds. Mr. Curvey is a Director of Fidelity Investments Money Management, Inc. (2009-present), Director of Fidelity Research & Analysis Co. (2009-present) and Director of FMR and FMR Co., Inc. (2007-present). Mr. Curvey is also Vice Chairman (2007-present) and Director of FMR LLC. In addition, Mr. Curvey serves as an Overseer for the Boston Symphony Orchestra and a member of the Trustees of Villanova University. Previously, Mr. Curvey was the Vice Chairman (2006-2007) and Director (2000-2007) of FMR Corp. |
Ronald P. O'Hanley (1957) |
Year of Election or Appointment: 2011 Trustee |
| Mr. O'Hanley also serves as Trustee of other Fidelity funds. He is Director of Fidelity SelectCo, LLC (2013-present), FMR Co., Inc. (2010-present), Director of Fidelity Investments Money Management, Inc. (2010-present), Director of Fidelity Research & Analysis Company (2010-present), President of Fidelity Asset Management and Corporate Services and a Member of Fidelity's Executive Committee (2010-present). Previously, Mr. O'Hanley served as President and Chief Executive Officer of BNY Mellon Asset Management (2007-2010). Mr. O'Hanley also served as Vice Chairman of Bank New York Mellon Corp. and a member of that firm's Executive Committee. Prior to the 2007 merger of The Bank of New York and Mellon Financial Corporation, he was Vice Chairman of Mellon Financial Corporation and President and Chief Executive Officer of Mellon Asset Management. He joined Mellon in February 1997. Mr. O'Hanley currently serves as Chairman of the Boston Public Library Foundation Board of Directors and sits on the Board of Directors of Beth Israel Deaconess Medical Center, the Board of Trustees of the Marine Biological Laboratory and the Advisory Board of the Maxwell School of Citizenship and Public Administration at Syracuse University. Mr. O'Hanley also chairs the Council on Asset Management for the Financial Services Roundtable and is a member of the Board of Directors of Institutional Investor's U.S. Institute. |
* Trustees have been determined to be "Interested Trustees" by virtue of, among other things, their affiliation with the trust or various entities under common control with FMR.
+ The information above includes each Trustee's principal occupation during the last five years and other information relating to the experience, attributes, and skills relevant to each Trustee's qualifications to serve as a Trustee, which led to the conclusion that each Trustee should serve as a Trustee for the fund.
Annual Report
Independent Trustees:
Correspondence intended for each Independent Trustee (that is, the Trustees other than the Interested Trustees) may be sent to Fidelity Investments, P.O. Box 55235, Boston, Massachusetts 02205-5235.
Name, Year of Birth; Principal Occupations and Other Relevant Experience+ |
Dennis J. Dirks (1948) |
Year of Election or Appointment: 2005 Trustee |
| Mr. Dirks also serves as Trustee of other Fidelity funds. Prior to his retirement in May 2003, Mr. Dirks was Chief Operating Officer and a member of the Board of The Depository Trust & Clearing Corporation (DTCC). He also served as President, Chief Operating Officer, and Board member of The Depository Trust Company (DTC) and President and Board member of the National Securities Clearing Corporation (NSCC). In addition, Mr. Dirks served as Chief Executive Officer and Board member of the Government Securities Clearing Corporation, Chief Executive Officer and Board member of the Mortgage-Backed Securities Clearing Corporation, as a Trustee and a member of the Finance Committee of Manhattan College (2005-2008), and as a Trustee and a member of the Finance Committee of AHRC of Nassau County (2006-2008). Mr. Dirks is a member of the Independent Directors Council (IDC) Governing Council (2010-present) and Board of Directors for The Brookville Center for Children's Services, Inc. (2009-present). |
Alan J. Lacy (1953) |
Year of Election or Appointment: 2008 Trustee |
| Mr. Lacy also serves as Trustee of other Fidelity funds. Mr. Lacy serves as Senior Adviser (2007-present) of Oak Hill Capital Partners, L.P. (private equity). Mr. Lacy also served as Chief Executive Officer (2000-2005) and Vice Chairman (2005-2006) of Sears Holdings Corporation and Sears, Roebuck and Co. (retail). In addition, Mr. Lacy serves as a member of the Board of Directors of Dave & Buster's Entertainment, Inc. (restaurant and entertainment complexes, 2010-present), Earth Fare, Inc. (retail grocery, 2012-present), The Hillman Companies, Inc. (hardware wholesalers, 2010-present), and Bristol-Myers Squibb Company (global pharmaceuticals, 2008-present). Mr. Lacy is a member of the Board of Trustees of The National Parks Conservation Association (2006-present). Previously, Mr. Lacy served as Chairman of the Board of Trustees of the National Parks Conservation Association (2008-2011) and as a member of the Board of Directors for the Western Union Company (global money transfer, 2006-2011). |
Ned C. Lautenbach (1944) |
Year of Election or Appointment: 2000 Trustee Chairman of the Independent Trustees |
| Mr. Lautenbach also serves as Trustee of other Fidelity funds. Mr. Lautenbach currently serves as the Lead Director of the Eaton Corporation Board of Directors (diversified industrial, 1997-present). Mr. Lautenbach is Chairman of the Board of Directors of the Philharmonic Center for the Arts in Naples, Florida (2012-present) and a member of the Council on Foreign Relations (1994-present). Previously, Mr. Lautenbach was a Partner/Advisory Partner at Clayton, Dubilier & Rice, LLC (private equity investment, 1998-2010), as well as a Director of Sony Corporation (2006-2007). |
Joseph Mauriello (1944) |
Year of Election or Appointment: 2008 Trustee |
| Mr. Mauriello also serves as Trustee of other Fidelity funds. Prior to his retirement in January 2006, Mr. Mauriello served in numerous senior management positions including Deputy Chairman and Chief Operating Officer (2004-2005), and Vice Chairman of Financial Services (2002-2004) of KPMG LLP US (professional services, 1965-2005). Mr. Mauriello currently serves as a member of the Board of Directors of XL Group plc. (global insurance and re-insurance, 2006-present). Previously, Mr. Mauriello served as a Director of the Hamilton Funds of the Bank of New York (2006-2007) and of Arcadia Resources Inc. (health care services and products, 2007-2012). |
Robert W. Selander (1950) |
Year of Election or Appointment: 2011 Trustee |
| Mr. Selander also serves as Trustee of other Fidelity funds. Previously, Mr. Selander served as a Member of the Advisory Board of other Fidelity funds (2011), and Executive Vice Chairman (2010), Chief Executive Officer (2009-2010), and President and Chief Executive Officer (1997-2009) of Mastercard, Inc. |
Cornelia M. Small (1944) |
Year of Election or Appointment: 2005 Trustee |
| Ms. Small also serves as Trustee of other Fidelity funds. Ms. Small is a member of the Board of Directors (2009-present) and Chair of the Investment Committee (2010-present) of the Teagle Foundation. Ms. Small also serves on the Investment Committee of the Berkshire Taconic Community Foundation (2008-present). Previously, Ms. Small served as Chairperson (2002-2008) and a member of the Investment Committee and Chairperson (2008-2012) and a member of the Board of Trustees of Smith College. In addition, Ms. Small served as Chief Investment Officer, Director of Global Equity Investments, and a member of the Board of Directors of Scudder, Stevens & Clark and Scudder Kemper Investments. |
William S. Stavropoulos (1939) |
Year of Election or Appointment: 2001 Trustee Vice Chairman of the Independent Trustees |
| Mr. Stavropoulos also serves as Trustee of other Fidelity funds. Mr. Stavropoulos serves as President and Founder of the Michigan Baseball Foundation, the Great Lakes Loons (2007-present). Mr. Stavropoulos is Chairman Emeritus of the Board of Directors of The Dow Chemical Company, where he previously served in numerous senior management positions, including President, CEO (1995-2000; 2002-2004), Chairman of the Executive Committee (2000-2006), and as a member of the Board of Directors (1990-2006). Currently, Mr. Stavropoulos is Chairman of the Board of Directors of Univar Inc. (global distributor of commodity and specialty chemicals), a Director of Teradata Corporation (data warehousing and technology solutions), and Maersk Inc. (industrial conglomerate), and a member of the Advisory Board for Metalmark Capital LLC (private equity investment, 2005-present). Mr. Stavropoulos is an operating advisor to Clayton, Dubilier & Rice, LLC (private equity investment). In addition, Mr. Stavropoulos is a member of the University of Notre Dame Advisory Council for the College of Science, a Trustee of the Rollin L. Gerstacker Foundation, and a Director of the Naples Philharmonic Center for the Arts. Previously, Mr. Stavropoulos served as a Director of Chemical Financial Corporation (bank holding company, 1993-2012) and Tyco International, Ltd. (multinational manufacturing and services, 2007-2012). |
David M. Thomas (1949) |
Year of Election or Appointment: 2008 Trustee |
| Mr. Thomas also serves as Trustee of other Fidelity funds. Mr. Thomas serves as Non-Executive Chairman of the Board of Directors of Fortune Brands Home and Security (home and security products, 2011-present), and as a member of the Board of Directors of Interpublic Group of Companies, Inc. (marketing communication, 2004-present). Previously, Mr. Thomas served as Executive Chairman (2005-2006) and Chairman and Chief Executive Officer (2000-2005) of IMS Health, Inc. (pharmaceutical and healthcare information solutions), and a Director of Fortune Brands, Inc. (consumer products, 2000-2011). |
+ The information above includes each Trustee's principal occupation during the last five years and other information relating to the experience, attributes, and skills relevant to each Trustee's qualifications to serve as a Trustee, which led to the conclusion that each Trustee should serve as a Trustee for the fund.
Advisory Board Member and Executive Officers:
Correspondence intended for each executive officer and Peter S. Lynch may be sent to Fidelity Investments, 245 Summer Street, Boston, Massachusetts 02210. Executive officers appear below in alphabetical order.
Name, Year of Birth; Principal Occupation |
Peter S. Lynch (1944) |
Year of Election or Appointment: 2003 Member of the Advisory Board |
| Mr. Lynch also serves as Member of the Advisory Board of other Fidelity funds. Mr. Lynch is Vice Chairman and a Director of FMR and FMR Co., Inc. In addition, Mr. Lynch serves as a Trustee of Boston College and as the Chairman of the Inner-City Scholarship Fund. Previously, Mr. Lynch served on the Special Olympics International Board of Directors (1997-2006). |
Elizabeth Paige Baumann (1968) |
Year of Election or Appointment: 2012 Anti-Money Laundering (AML) Officer |
| Ms. Baumann also serves as AML Officer of other funds. She is Chief AML Officer of FMR LLC (2012-present) and is an employee of Fidelity Investments. Previously, Ms. Baumann served as Vice President and Deputy Anti-Money Laundering Officer (2007-2012). |
William C. Coffey (1969) |
Year of Election or Appointment: 2009 Assistant Secretary |
| Mr. Coffey also serves as Assistant Secretary of other funds. He is Senior Vice President and Deputy General Counsel of FMR LLC (2010-present), and is an employee of Fidelity Investments. Previously, Mr. Coffey served as Vice President and Associate General Counsel of FMR LLC (2005-2009). |
Jonathan Davis (1968) |
Year of Election or Appointment: 2010 Assistant Treasurer |
| Mr. Davis also serves as Assistant Treasurer of other funds. Mr. Davis is an employee of Fidelity Investments. Previously, Mr. Davis served as Vice President and Associate General Counsel of FMR LLC (2003-2010). |
Adrien E. Deberghes (1967) |
Year of Election or Appointment: 2008 Deputy Treasurer |
| Mr. Deberghes also serves as an officer of other funds. He is an employee of Fidelity Investments (2008-present). Prior to joining Fidelity Investments, Mr. Deberghes was Senior Vice President of Mutual Fund Administration at State Street Corporation (2007-2008), Senior Director of Mutual Fund Administration at Investors Bank & Trust (2005-2007), and Director of Finance for Dunkin' Brands (2000-2005). |
Stephanie J. Dorsey (1969) |
Year of Election or Appointment: 2010 Assistant Treasurer |
| Ms. Dorsey also serves as an officer of other funds. She is an employee of Fidelity Investments (2008-present) and has served in other fund officer roles. Prior to joining Fidelity Investments, Ms. Dorsey served as Treasurer (2004-2008) of the JPMorgan Mutual Funds and Vice President (2004-2008) of JPMorgan Chase Bank. |
Scott C. Goebel (1968) |
Year of Election or Appointment: 2008 Secretary and Chief Legal Officer (CLO) |
| Mr. Goebel serves as Secretary and CLO of other funds. Mr. Goebel also serves as Secretary of Fidelity Investments Money Management, Inc. (FIMM) (2010-present) and Fidelity Research and Analysis Company (FRAC) (2010-present); General Counsel, Secretary, and Senior Vice President of FMR (2008-present) and FMR Co., Inc. (2008-present); Chief Legal Officer of Fidelity Management & Research (Hong Kong) Limited (2008-present) and Assistant Secretary of Fidelity Management & Research (Japan) Inc. (2008-present), and Fidelity Management & Research (U.K.) Inc. (2008-present). Previously, Mr. Goebel served as Secretary and CLO of other Fidelity funds (2008-2013), Assistant Secretary of FIMM (2008-2010), FRAC (2008-2010), and certain funds (2007-2008); and as Vice President and Secretary of Fidelity Distributors Corporation (FDC) (2005-2007). Mr. Goebel has been employed by FMR LLC or an affiliate since 2001. |
Joseph A. Hanlon (1968) |
Year of Election or Appointment: 2012 Chief Compliance Officer |
| Mr. Hanlon also serves as Chief Compliance Officer of other funds. Mr. Hanlon serves as Compliance Officer of FMR, FMR Co., Inc., Fidelity Investments Money Management, Inc. (FIMM), Fidelity Research and Analysis Company (FRAC), and Fidelity Management & Research (Hong Kong) (2009-present), as Senior Vice President of the Fidelity Asset Management Division (2009-present), and is an employee of Fidelity Investments. Previously, Mr. Hanlon served as Compliance Officer of Fidelity Management & Research (Japan) Inc. (2009-2013), Strategic Advisers, Inc. (2009-2013), and Fidelity Management & Research (U.K.) Inc. (2009-2013). |
Bruce T. Herring (1965) |
Year of Election or Appointment: 2006 Vice President of certain Equity Funds |
| Mr. Herring also serves as Vice President of other funds. He serves as Chief Investment Officer of Fidelity Global Asset Allocation (GAA) (2013-present), Chief Investment Officer and Director of Fidelity Management & Research (U.K.) Inc. (2010-present), Group Chief Investment Officer of FMR, and President of Fidelity Research & Analysis Company (2010-present). Previously, Mr. Herring served as Vice President (2005-2006) and Senior Vice President (2006-2007) of Fidelity Management & Research Company, Vice President of FMR Co., Inc. (2001-2007), and as a portfolio manager for Fidelity U.S. Equity Funds. |
Brian B. Hogan (1964) |
Year of Election or Appointment: 2009 Vice President |
| Mr. Hogan also serves as Vice President of other funds. Mr. Hogan serves as President of FMR's Equity Division (2009-present). Previously, Mr. Hogan served as Senior Vice President, Equity Research of FMR (2006-2009) and as a portfolio manager. |
Chris Maher (1972) |
Year of Election or Appointment: 2013 Assistant Treasurer |
| Mr. Maher serves as Assistant Treasurer of other funds. Mr. Maher is Vice President of Valuation Oversight and is an employee of Fidelity Investments. Previously, Mr. Maher served as Vice President of Asset Management Compliance (2013), Vice President of FMR's Program Management Group (2010-2013), and Vice President of Valuation Oversight (2008-2010). |
Christine Reynolds (1958) |
Year of Election or Appointment: 2008 Chief Financial Officer |
| Ms. Reynolds also serves as Chief Financial Officer of other funds. Ms. Reynolds became President of Fidelity Pricing and Cash Management Services (FPCMS) in August 2008. Ms. Reynolds served as Chief Operating Officer of FPCMS (2007-2008). Previously, Ms. Reynolds served as President, Treasurer, and Anti-Money Laundering officer of the Fidelity funds (2004-2007). |
Kenneth B. Robins (1969) |
Year of Election or Appointment: 2008 President and Treasurer |
| Mr. Robins also serves as an officer of other funds. Mr. Robins serves as Executive Vice President of Fidelity Investments Money Management, Inc. (FIMM) (2013-present) and is an employee of Fidelity Investments (2004-present). Previously, Mr. Robins served in other fund officer roles. |
Gary W. Ryan (1958) |
Year of Election or Appointment: 2005 Assistant Treasurer |
| Mr. Ryan also serves as Assistant Treasurer of other funds. Mr. Ryan is an employee of Fidelity Investments and has served in other fund officer roles. Previously, Mr. Ryan served as Vice President of Fund Reporting in Fidelity Pricing and Cash Management Services (FPCMS) (1999-2005). |
Stephen Sadoski (1971) |
Year of Election or Appointment: 2012 Deputy Treasurer |
| Mr. Sadoski also serves as Deputy Treasurer of other funds. He is an employee of Fidelity Investments (2012-present) and has served in another fund officer role. Prior to joining Fidelity Investments, Mr. Sadoski served as an assistant chief accountant in the Division of Investment Management of the Securities and Exchange Commission (SEC) (2009-2012) and as a senior manager at Deloitte & Touche LLP (1997-2009). |
Stacie M. Smith (1974) |
Year of Election or Appointment: 2013 Deputy Treasurer |
| Ms. Smith also serves as an officer of other funds. She is an employee of Fidelity Investments (2009-present) and has served in other fund officer roles. Prior to joining Fidelity Investments, Ms. Smith served as Senior Audit Manager of Ernst & Young LLP (1996-2009). |
Renee Stagnone (1975) |
Year of Election or Appointment: 2013 Deputy Treasurer |
| Ms. Stagnone also serves as Deputy Treasurer of other funds. Ms. Stagnone is an employee of Fidelity Investments. |
Joseph F. Zambello (1957) |
Year of Election or Appointment: 2011 Deputy Treasurer |
| Mr. Zambello also serves as Deputy Treasurer of other funds. Mr. Zambello is an employee of Fidelity Investments. Previously, Mr. Zambello served as Vice President of FMR's Program Management Group (2009-2011) and Vice President of the Transfer Agent Oversight Group (2005-2009). |
Annual Report
Institutional Class designates 63% of the dividends distributed during the fiscal year as amounts which may be taken into account as a dividend for purposes of the maximum rate under section 1(h)(11) of the Internal Revenue Code.
The amounts per share which represent income derived from sources within, and taxes paid to, foreign countries or possessions of the United States are as follows:
| Pay Date | Income | Taxes |
Institutional Class | 12/10/12 | $0.175 | $0.0157 |
The fund will notify shareholders in January 2014 of amounts for use in preparing 2013 income tax returns.
Annual Report
Board Approval of Investment Advisory Contracts and Management Fees
Fidelity Total Emerging Markets Fund
Each year, the Board of Trustees, including the Independent Trustees (together, the Board), votes on the renewal of the management contract and sub-advisory agreements (together, the Advisory Contracts) for the fund. The Board, assisted by the advice of fund counsel and Independent Trustees' counsel, requests and considers a broad range of information relevant to the renewal of the Advisory Contracts throughout the year.
The Board meets regularly and, at each of its meetings, covers an extensive agenda of topics and materials and considers factors that are relevant to its annual consideration of the renewal of the fund's Advisory Contracts, including the services and support provided to the fund and its shareholders. The Board has established various standing committees, each composed of and chaired by Independent Trustees with varying backgrounds, to which the Board has assigned specific subject matter responsibilities in order to enhance effective decision-making by the Board. The Board, acting directly and through its Committees, requests and receives information concerning the annual consideration of the renewal of the fund's Advisory Contracts. The Board also meets as needed to consider matters specifically related to the Board's annual consideration of the renewal of Advisory Contracts. Members of the Board may also meet with trustees of other Fidelity funds through ad hoc joint committees to discuss certain matters relevant to the Fidelity funds.
At its July 2013 meeting, the Board, including the Independent Trustees, unanimously determined to renew the fund's Advisory Contracts. In reaching its determination, the Board considered all factors it believed relevant, including (i) the nature, extent, and quality of the services to be provided to the fund and its shareholders (including the investment performance of the fund); (ii) the competitiveness of the fund's management fee and total expense ratio relative to peer funds; (iii) the total costs of the services to be provided by and the profits to be realized by Fidelity from its relationship with the fund; (iv) the extent to which economies of scale exist and would be realized as the fund grows; and (v) whether fee levels reflect these economies of scale, if any, for the benefit of fund shareholders.
In considering whether to renew the Advisory Contracts for the fund, the Board reached a determination, with the assistance of fund counsel and Independent Trustees' counsel and through the exercise of its business judgment, that the renewal of the Advisory Contracts was in the best interests of the fund and its shareholders and that the compensation payable under the Advisory Contracts was fair and reasonable. The Board's decision to renew the Advisory Contracts was not based on any single factor, but rather was based on a comprehensive consideration of all the information provided to the Board at its meetings throughout the year. The Board, in reaching its determination to renew the Advisory Contracts, was aware that shareholders in the fund have a broad range of investment choices available to them, including a wide choice among mutual funds offered by Fidelity's competitors, and that the fund's shareholders, who have the opportunity to review and weigh the disclosure provided by the fund in its prospectus and other public disclosures, have chosen to invest in this fund, which is a part of the Fidelity family of funds.
Annual Report
Nature, Extent, and Quality of Services Provided. The Board considered the staffing within the investment adviser, Fidelity Management & Research Company (FMR), and the sub-advisers (together, the Investment Advisers) as it relates to the fund, including the backgrounds of the fund's investment personnel, and also considered the fund's investment objective, strategies, and related investment philosophy. The Independent Trustees also had discussions with senior management of Fidelity's investment operations and investment groups. The Board considered the structure of the portfolio manager compensation program and whether this structure provides appropriate incentives to act in the best interests of the fund.
Resources Dedicated to Investment Management and Support Services. The Board and the Fund Oversight and Research Committees reviewed the general qualifications and capabilities of the Investment Advisers' investment staff, including its size, education, experience, and resources, as well as the Investment Advisers' approach to recruiting, training, managing, and compensating investment personnel. The Board noted that FMR has continued to increase the resources devoted to non-U.S. offices, including expansion of Fidelity's global investment organization. The Board also noted that Fidelity's analysts have extensive resources, tools and capabilities that allow them to conduct sophisticated quantitative and fundamental analysis, as well as credit analysis of issuers, counterparties and guarantors. Further, the Board believes that Fidelity's investment professionals have sufficient access to global information and data so as to provide competitive investment results over time, and that those professionals also have access to sophisticated tools that permit them to assess portfolio construction and risk and performance attribution characteristics continuously, as well as to transmit new information and research conclusions rapidly around the world. Additionally, in its deliberations, the Board considered the Investment Advisers' trading and risk management capabilities and resources, which are an integral part of the investment management process.
Shareholder and Administrative Services. The Board considered (i) the nature, extent, quality, and cost of advisory, administrative, and shareholder services performed by the Investment Advisers and their affiliates under the Advisory Contracts and under separate agreements covering transfer agency, pricing and bookkeeping, and securities lending services for the fund; (ii) the nature and extent of the supervision of third party service providers, principally custodians and subcustodians; and (iii) the resources devoted to, and the record of compliance with, the fund's compliance policies and procedures. The Board also reviewed the allocation of fund brokerage, including allocations to brokers affiliated with the Investment Advisers, the use of brokerage commissions to pay fund expenses, and the use of "soft" commission dollars to pay for research services.
Annual Report
Board Approval of Investment Advisory Contracts and
Management Fees - continued
The Board noted that the growth of fund assets over time across the complex allows Fidelity to reinvest in the development of services designed to enhance the value or convenience of the Fidelity funds as investment vehicles. These services include 24-hour access to account information and market information through telephone representatives and over the Internet, investor education materials and asset allocation tools, and the expanded availability of Fidelity Investor Centers.
Investment in a Large Fund Family. The Board considered the benefits to shareholders of investing in a Fidelity fund, including the benefits of investing in a fund that is part of a large family of funds offering a variety of investment disciplines and providing a large variety of mutual fund investor services. The Board noted that Fidelity had taken, or had made recommendations that resulted in the Fidelity funds taking, a number of actions over the previous year that benefited particular funds, including (i) continuing to dedicate additional resources to investment research and to the support of the senior management team that oversees asset management; (ii) persisting in efforts to enhance Fidelity's global research capabilities; (iii) launching new funds and making other enhancements to meet client needs for global and income-oriented solutions; (iv) continuing to launch dedicated lower cost underlying funds to meet portfolio construction needs related to expanding underlying fund options for Fidelity funds of funds, specifically for the Freedom Fund product lines; (v) rationalizing product lines and gaining increased efficiencies through the mergers of several funds into other funds; (vi) strengthening Fidelity's index fund offerings by reducing investment minimums and adopting or lowering existing expense caps for certain funds and classes; (vii) enhancing Global Asset Allocation product offerings by launching new funds and strategies, including "open architecture" target date funds that utilize affiliated and unaffiliated sub-advisers; (viii) modifying the eligibility criteria for Institutional Class shares of Advisor funds to increase their marketability to a portion of the defined contribution plan market; (ix) creating a new low-cost retirement share class for certain Advisor funds to appeal to large retirement plans; (x) transitioning the management of certain Fidelity commodity funds to Geode Capital Management LLC, a registered commodity pool operator, while retaining administrative responsibilities for the funds; (xi) reorganizing a number of funds; and (xii) taking steps toward establishing a new Fidelity adviser to manage sector-based funds and products.
Investment Performance. The Board considered whether the fund has operated in accordance with its investment objective, as well as its record of compliance with its investment restrictions and its performance history.
The Board took into account discussions with the Investment Advisers about fund investment performance that occur at Board meetings throughout the year. In this regard the Board noted that as part of regularly scheduled fund reviews and other reports to the Board on fund performance, the Board periodically considers annualized return information for the fund, for different time periods, measured against a securities market index ("benchmark index") and a peer group of mutual funds with similar objectives ("peer group"). In its evaluation of fund investment performance, the Board gave particular attention to information indicating changes in performance of certain Fidelity funds for specific time periods and the Investment Advisers' explanations for any overperformance or underperformance.
Annual Report
In addition to reviewing absolute and relative fund performance, the Independent Trustees periodically consider the appropriateness of fund performance metrics in evaluating the results achieved. In general, the Independent Trustees believe that fund performance should be evaluated based on net performance (after fees and expenses) of both the highest performing and lowest performing classes, where applicable, compared to appropriate benchmark indices, over appropriate time periods which may include full market cycles, and compared to peer groups, as applicable, over the same periods, taking into account relevant factors including the following: general market conditions; issuer-specific information; tactical opportunities for investment; and fund cash flows and other factors.
The Independent Trustees recognize that shareholders evaluate performance on a net basis over their own holding periods, for which one-, three-, and five-year periods are used as a proxy. For this reason, the performance information reviewed by the Board also included net cumulative calendar year total return information for the fund and an appropriate benchmark index for the most recent one-year period, as shown below. A peer group comparison is not shown below.
Annual Report
Board Approval of Investment Advisory Contracts and
Management Fees - continued
Fidelity Total Emerging Markets Fund

Based on its review, the Board concluded that the nature, extent, and quality of services provided to the fund under the Advisory Contracts should benefit the fund's shareholders.
Competitiveness of Management Fee and Total Expense Ratio. The Board considered the fund's management fee and total expense ratio compared to "mapped groups" of competitive funds and classes. Fidelity creates "mapped groups" by combining similar Lipper investment objective categories that have comparable management fee characteristics. Combining Lipper investment objective categories aids the Board's management fee and total expense ratio comparisons by broadening the competitive group used for comparison and by reducing the number of universes to which various Fidelity funds are compared.
Management Fee. The Board considered two proprietary management fee comparisons for the 12-month (or shorter) periods shown in the chart below. The group of Lipper funds used by the Board for management fee comparisons is referred to below as the "Total Mapped Group." The Total Mapped Group comparison focuses on a fund's standing in terms of gross management fees before expense reimbursements or caps relative to the total universe of funds with comparable investment mandates, regardless of whether their management fee structures also are comparable. Funds with comparable investment mandates offer exposure to similar types of securities. Funds with comparable management fee structures have similar management fee contractual arrangements (e.g., flat rate charged for advisory services, all-inclusive fee rate, etc.). "TMG %" represents the percentage of funds in the Total Mapped Group that had management fees that were lower than the fund's. For example, a TMG % of 13% means that 87% of the funds in the Total Mapped Group had higher management fees than the fund. The "Asset-Size Peer Group" (ASPG) comparison focuses on a fund's standing relative to a subset of non-Fidelity funds within the Total Mapped Group that are similar in size and management fee structure. The ASPG represents at least 15% of the funds in the Total Mapped Group with comparable asset size and management fee structures, subject to a minimum of 50 funds (or all funds in the Total Mapped Group if fewer than 50). Additional information, such as the ASPG quartile in which the fund's management fee ranked, is also included in the chart and considered by the Board.
Annual Report
Fidelity Total Emerging Markets Fund

The Board noted that the fund's management fee ranked below the median of its Total Mapped Group and below the median of its ASPG for 2012.
Based on its review, the Board concluded that the fund's management fee is fair and reasonable in light of the services that the fund receives and the other factors considered.
Total Expense Ratio. In its review of each class's total expense ratio, the Board considered the fund's management fee as well as other fund or class expenses, as applicable, such as transfer agent fees, pricing and bookkeeping fees, fund-paid 12b-1 fees, and custodial, legal, and audit fees. The Board also noted the effects of any waivers and reimbursements on fees and expenses. As part of its review, the Board also considered the current and historical total expense ratios of each class of the fund compared to competitive fund median expenses. Each class of the fund is compared to those funds and classes in the Total Mapped Group (used by the Board for management fee comparisons) that have a similar sales load structure.
Annual Report
Board Approval of Investment Advisory Contracts and
Management Fees - continued
The Board noted that the total expense ratio of each of Class A and the retail class ranked below its competitive median for 2012 and the total expense ratio of each of Class T, Class C, and Institutional Class ranked above its competitive median for 2012. The Board considered that, in general, various factors can affect total expense ratios. The Board noted that the total expense ratio of Class T was above the competitive median primarily because of higher 12b-1 fees on Class T. Class T has a higher 12b-1 fee, but a lower front-end sales charge, than traditionally priced front-end sales charge classes. The Board considered that Class T is primarily sold load-waived in the retirement plan market where its 0.50% 12b-1 fee is comparable to competing no-load, higher 12b-1 fee classes designed specifically for retirement plans. The Board noted that the fund offers multiple classes, each of which has a different sales load and 12b-1 fee structure, and that the multiple structures are intended to offer a range of pricing options for the intermediary market. The Board also noted that the total expense ratios of the classes vary primarily by the level of their 12b-1 fees, although differences in transfer agent fees may also cause expenses to vary from class to class.
The Board further considered that FMR contractually agreed to reimburse Class A, Class T, Class C, Institutional Class, and the retail class of the fund to the extent that total operating expenses (excluding interest, taxes, certain securities lending costs, brokerage commissions, extraordinary expenses, and acquired fund fees and expenses, if any), as a percentage of their respective average net assets, exceed 1.65%, 1.90%, 2.40%, 1.40%, and 1.40% through December 31, 2013.
Fees Charged to Other Fidelity Clients. The Board also considered Fidelity fee structures and other information with respect to clients of FMR and its affiliates, such as other mutual funds advised or subadvised by FMR or its affiliates, pension plan clients, and other institutional clients. The Board noted the findings of the 2013 ad hoc joint committee (created with the board of other Fidelity funds), which reviewed and compared Fidelity's institutional investment advisory business with its business of providing services to the Fidelity funds, including the differences in services provided, fees charged, and costs incurred, as well as competition in their respective marketplaces.
Based on its review of total expense ratios and fees charged to other Fidelity clients, the Board concluded that the total expense ratio of each class of the fund was reasonable, although in some cases above the median of the universe presented for comparison, in light of the services that the fund and its shareholders receive and the other factors considered.
Costs of the Services and Profitability. The Board considered the revenues earned and the expenses incurred by Fidelity in conducting the business of developing, marketing, distributing, managing, administering and servicing the fund and servicing the fund's shareholders. The Board also considered the level of Fidelity's profits in respect of all the Fidelity funds.
Annual Report
On an annual basis, FMR presents to the Board Fidelity's profitability for the fund. Fidelity calculates the profitability for each fund, as well as aggregate profitability for groups of Fidelity funds and all Fidelity funds, using a series of detailed revenue and cost allocation methodologies which originate with the books and records of Fidelity on which Fidelity's audited financial statements are based. The Audit Committee of the Board reviews any significant changes from the prior year's methodologies.
PricewaterhouseCoopers LLP (PwC), independent registered public accounting firm and auditor to Fidelity and certain Fidelity funds, has been engaged annually by the Board as part of the Board's assessment of Fidelity's profitability analysis. PwC's engagement includes the review and assessment of the methodologies used by Fidelity in determining the revenues and expenses attributable to Fidelity's mutual fund business, and completion of agreed-upon procedures surrounding the mathematical accuracy of fund profitability and its conformity to allocation methodologies. After considering PwC's reports issued under the engagement and information provided by Fidelity, the Board concluded that while other allocation methods may also be reasonable, Fidelity's profitability methodologies are reasonable in all material respects.
The Board also reviewed Fidelity's non-fund businesses and fall-out benefits related to the mutual fund business as well as cases where Fidelity's affiliates may benefit from or be related to the fund's business.
The Board considered the costs of the services provided by and the profits realized by Fidelity in connection with the operation of the fund and was satisfied that the profitability was not excessive in the circumstances.
Economies of Scale. The Board considered whether there have been economies of scale in respect of the management of the Fidelity funds, whether the Fidelity funds (including the fund) have appropriately benefited from any such economies of scale, and whether there is potential for realization of any further economies of scale. The Board considered the extent to which the fund will benefit from economies of scale through increased services to the fund, through waivers or reimbursements, or through fee or expense reductions. The Board also noted that in 2009, it and the board of other Fidelity funds created an ad hoc committee (the Economies of Scale Committee) to analyze whether FMR attains economies of scale in respect of the management and servicing of the Fidelity funds, whether the Fidelity funds have appropriately benefited from such economies of scale, and whether there is potential for realization of any further economies of scale.
The Board recognized that the fund's management contract incorporates a "group fee" structure, which provides for lower group fee rates as total fund assets under FMR's management increase, and for higher group fee rates as total fund assets under FMR's management decrease. FMR calculates the group fee rates based on a tiered asset "breakpoint" schedule that varies based on asset class. The Board considered that the group fee is designed to deliver the benefits of economies of scale to fund shareholders when total Fidelity fund assets increase, even if assets of any particular fund are unchanged or have declined, because some portion of Fidelity's costs are attributable to services provided to all Fidelity funds, and all funds benefit if those costs can be allocated among more assets. The Board concluded that, given the group fee structure, fund shareholders will benefit from lower management fees as assets under FMR's management increase at the fund complex level, regardless of whether Fidelity achieves any such economies of scale.
Annual Report
Board Approval of Investment Advisory Contracts and
Management Fees - continued
The Board concluded, taking into account the analysis of the Economies of Scale Committee, that economies of scale, if any, are being appropriately shared between fund shareholders and Fidelity.
Amendment to Description of Group Fee Rate. At its July 2013 meeting, the Board voted to approve an amendment to the fund's management contract to modify the description of the "group fee rate" effective August 1, 2013. The Board noted that under the prior description in the contract, the group fee rate was based on the average net assets of all registered investment companies with which FMR has management contracts. Under the contract's tiered asset breakpoint schedule, the group fee rate is lower as total fund assets under FMR's management increase, and higher as total fund assets under FMR's management decrease. The Board considered that the prior description would have excluded the assets of 64 Fidelity sector funds from the group fee rate calculation once Fidelity SelectCo, LLC, an affiliate of FMR, assumed management responsibilities for those funds. The Board noted that modifying the description of the group fee rate to continue to include the assets of those 64 funds for purposes of determining group fee rate breakpoints would avoid an immediate adverse impact on the group fee rate for any fund.
Additional Information Requested by the Board. In order to develop fully the factual basis for consideration of the Fidelity funds' Advisory Contracts, the Board requested and received additional information on certain topics, including: (i) fund performance trends and Fidelity's long-term strategies for certain funds; (ii) the potential to further rationalize the Fidelity fund lineup with the possibility of achieving savings for the funds and Fidelity; (iii) the methodology with respect to competitive fund data and peer group classifications; (iv) the arrangements with, and performance of, certain sub-advisers on behalf of the Fidelity funds, as well as certain proposed participating affiliate arrangements; (v) the realization of fall-out benefits in certain Fidelity business units; (vi) Fidelity's group fee structures, including the rationale for the individual fee rates of certain categories of funds and the definition of group assets; (vii) trends regarding industry use of performance fee structures and the performance adjustment methodologies applicable to the Fidelity funds; (viii) additional competitive analysis regarding the total expenses for certain classes; and (ix) fund profitability methodology, including Fidelity's cost allocation methodology, and the impact of certain factors on fund profitability results.
Annual Report
Based on its evaluation of all of the conclusions noted above, and after considering all factors it believed relevant, the Board ultimately concluded that the advisory fee structures are fair and reasonable, and that the fund's Advisory Contracts should be renewed.
Annual Report
Investment Adviser
Fidelity Management & Research Company
Boston, MA
Investment Sub-Advisers
FMR Co., Inc.
Fidelity Management & Research
(U.K.) Inc.
Fidelity Management & Research
(Hong Kong) Limited
Fidelity Management & Research
(Japan) Inc.
FIL Investment Advisors
FIL Investment Advisors (UK) Limited
FIL Investments (Japan) Limited
General Distributor
Fidelity Distributors Corporation
Smithfield, RI
Transfer and Service Agents
Fidelity Investments Institutional Operations Company, Inc.
Boston, MA
Fidelity Service Company, Inc.
Boston, MA
Custodian
The Northern Trust Company
Chicago, IL
(Fidelity Investment logo)(registered trademark)
ATEKI-UANN-1213
1.931260.101
Fidelity®
Emerging Markets Discovery
Fund
and Fidelity®
Total Emerging Markets
Fund
Annual Report
October 31, 2013
(Fidelity Cover Art)
Contents
Fidelity® Emerging Markets Discovery Fund |
Performance | (Click Here) | How the fund has done over time. |
Management's Discussion of Fund Performance | (Click Here) | The Portfolio Manager's review of fund performance and strategy. |
Shareholder Expense Example | (Click Here) | An example of shareholder expenses. |
Investment Changes | (Click Here) | A summary of major shifts in the fund's investments over the past six months. |
Investments | (Click Here) | A complete list of the fund's investments with their market values. |
Financial Statements | (Click Here) | Statements of assets and liabilities, operations, and changes in net assets, as well as financial highlights. |
Notes | (Click Here) | Notes to the Financial Statements. |
Fidelity Total Emerging Markets Fund |
Performance | (Click Here) | How the fund has done over time. |
Management's Discussion of Fund Performance | (Click Here) | The Portfolio Manager's review of fund performance and strategy. |
Shareholder Expense Example | (Click Here) | An example of shareholder expenses. |
Investment Changes | (Click Here) | A summary of major shifts in the fund's investments over the past six months. |
Investments | (Click Here) | A complete list of the fund's investments with their market values. |
Financial Statements | (Click Here) | Statements of assets and liabilities, operations, and changes in net assets, as well as financial highlights. |
Notes | (Click Here) | Notes to the Financial Statements. |
Report of Independent Registered Public Accounting Firm | (Click Here) | |
Trustees and Officers | (Click Here) | |
Distributions | (Click Here) | |
Board Approval of Investment Advisory Contracts and Management Fees | (Click Here) | |
To view a fund's proxy voting guidelines and proxy voting record for the 12-month period ended June 30, visit http://www.fidelity.com/proxyvotingresults or visit the Securities and Exchange Commission's (SEC) web site at http://www.sec.gov. You may also call 1-800-544-8544 to request a free copy of the proxy voting guidelines.
Standard & Poor's, S&P and S&P 500 are registered service marks of The McGraw-Hill Companies, Inc. and have been licensed for use by Fidelity Distributors Corporation.
Other third-party marks appearing herein are the property of their respective owners.
All other marks appearing herein are registered or unregistered trademarks or service marks of FMR LLC or an affiliated company. © 2013 FMR LLC. All rights reserved.
This report and the financial statements contained herein are submitted for the general information of the shareholders of the funds. This report is not authorized for distribution to prospective investors in the funds unless preceded or accompanied by an effective prospectus.
A fund files its complete schedule of portfolio holdings with the SEC for the first and third quarters of each fiscal year on Form N-Q. Forms N-Q are available on the SEC's web site at http://www.sec.gov. A fund's Forms N-Q may be reviewed and copied at the SEC's Public Reference Room in Washington, DC. Information regarding the operation of the SEC's Public Reference Room may be obtained by calling 1-800-SEC-0330. For a complete list of a fund's portfolio holdings, view the most recent holdings listing, semiannual report, or annual report on Fidelity's web site at http://www.fidelity.com, http://www.advisor.fidelity.com, or http://www.401k.com, as applicable.
NOT FDIC INSURED • MAY LOSE VALUE • NO BANK GUARANTEE
Neither the funds nor Fidelity Distributors Corporation is a bank.
Annual Report
Fidelity Emerging Markets Discovery Fund
Average annual total return reflects the change in the value of an investment, assuming reinvestment of the fund's distributions from dividend income and capital gains (the profits earned upon the sale of securities that have grown in value, if any) and assuming a constant rate of performance each year. The $10,000 table and the fund's returns do not reflect the deduction of taxes that a shareholder would pay on fund distributions or the redemption of fund shares. During periods of reimbursement by Fidelity, a fund's total return will be greater than it would be had the reimbursement not occurred. How a fund did yesterday is no guarantee of how it will do tomorrow.
Average Annual Total Returns
Periods ended October 31, 2013 | Past 1
year | Life of
fund A |
Fidelity® Emerging Markets Discovery Fund | 7.37% | 13.20% |
A From November 1, 2011
$10,000 Over Life of Fund
Let's say hypothetically that $10,000 was invested in Fidelity® Emerging Markets Discovery Fund, a class of the fund, on November 1, 2011, when the fund started. The chart shows how the value of your investment would have changed, and also shows how the MSCI® Emerging Markets SMID Cap Index performed over the same period.
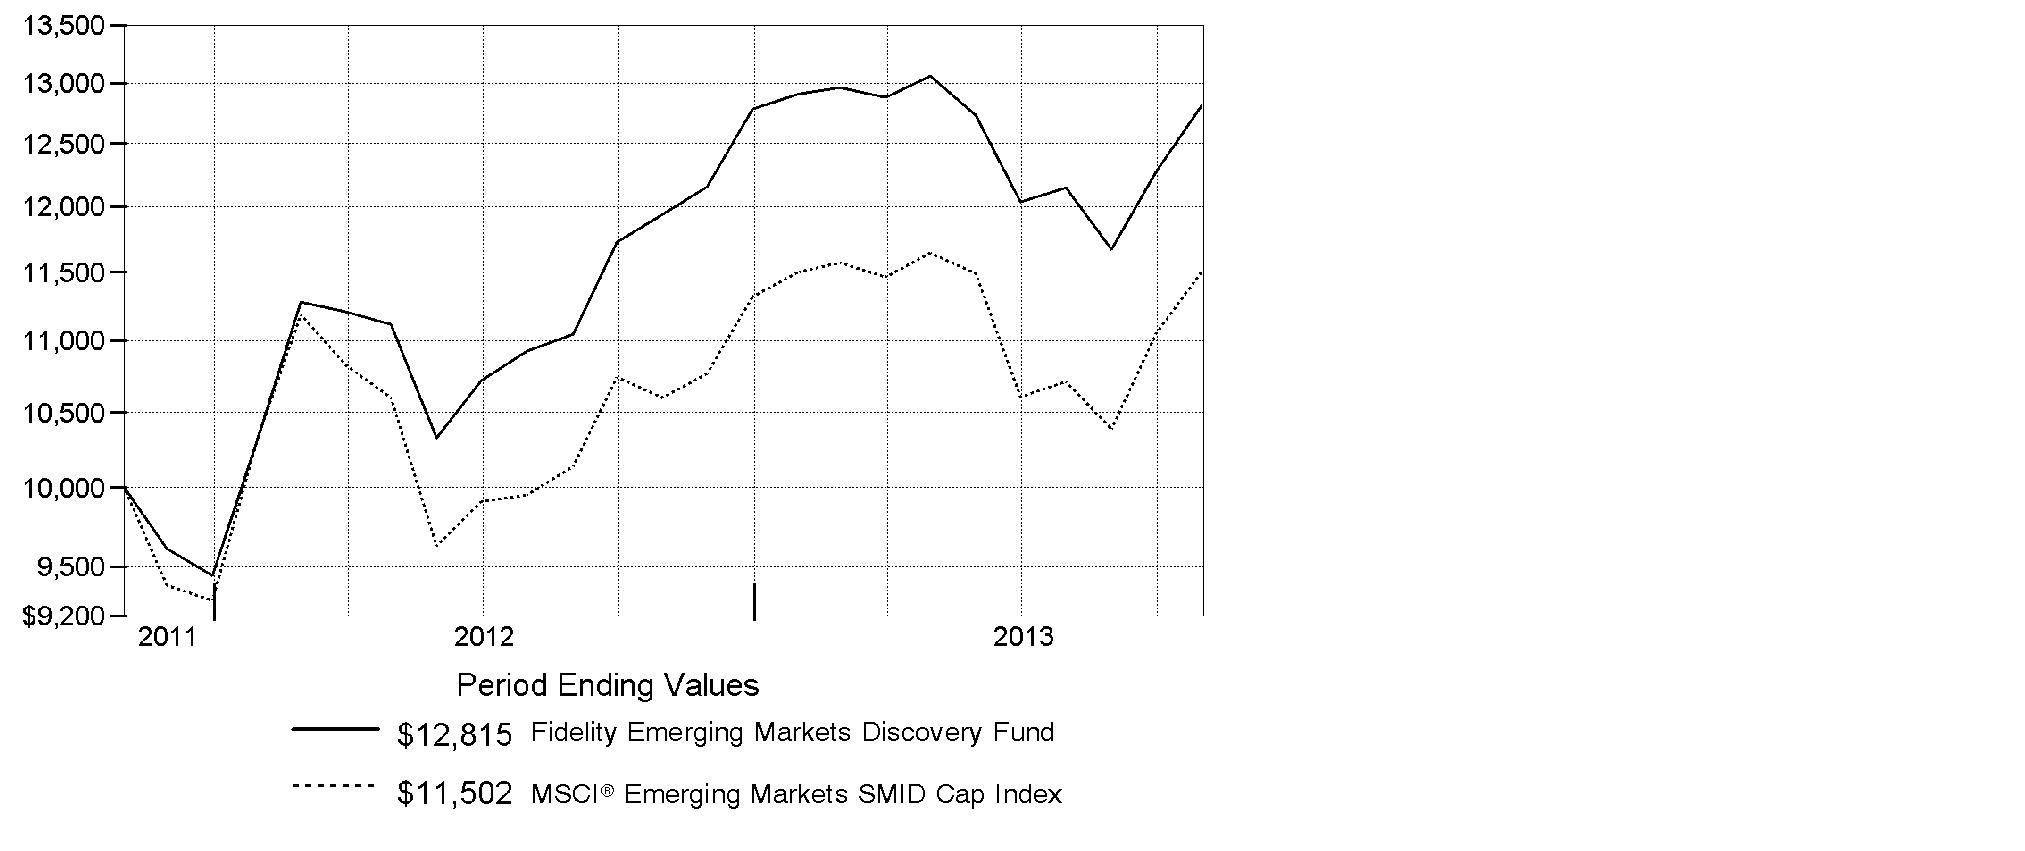
Annual Report
Fidelity Emerging Markets Discovery Fund
Market Recap: On balance, global equity markets remained upbeat for the 12-month period ending October 31, 2013. The MSCI® ACWI® (All Country World Index) Index gained 23.75% for the period, amid investor preference for higher-risk assets. The period was not without turbulence, however. In the spring and summer, central banks worldwide, especially in the U.S. and China, made clear their intentions to maintain accommodative monetary policies. That stance, combined with modest cyclical improvements around the globe and generally low valuations, underpinned the broad rally in equities. Europe (+32%) shone brightly, with most markets in the region - large and small - registering solid, index-beating gains. Another bright spot was Japan, which, despite a struggling yen and taking a second-half breather, posted a 34% result for the full year. The U.S. - by far the index's biggest constituent - also outperformed the global market with a roughly 28% advance. Meanwhile, Asia-Pacific ex Japan (+14%) lagged, hurt in part by a slowdown in Australia's mining industry as well as currency headwinds. Foreign-exchange and commodity weakness also curbed results in resource-heavy Canada and emerging markets (EM), both of which were up 7%. Country-level EM performance diverged meaningfully for the period, as evidenced by performance in Brazil (-1%), Russia (+12%), India (+1%) and China (+8%).
Comments from Ashish Swarup, Portfolio Manager of Fidelity® Emerging Markets Discovery Fund: For the year, the fund's Retail Class shares advanced 7.37%, trailing the 8.55% gain of the MSCI® Emerging Markets SMID Cap Index. Versus the index, underweighting Malaysia and China hurt, as did stock picks in South Korea. Looking at individual stocks, I saw opportunity in South Africa-based gold miner and non-index investment AngloGold Ashanti. I considered the company to be of high quality, well run and shareholder friendly, and the stock has historically been a steady performer. Unfortunately, shares fell this period alongside the price of gold. I sold AngloGold in May. Conversely, an overweighting in St. Shine Optical was a winner. The contact lens and glasses maker based in Taiwan consistently gained market share due to the high quality and reliability of its products. I was attracted to the company's good management team and the high return on equity of its business, as well as the stock's attractive valuation when I purchased it prior to the beginning of the reporting period. The stock performed very well during the past 12 months, and as its price continued to appreciate, I sold some of St. Shine to take profits.
The views expressed above reflect those of the portfolio manager(s) only through the end of the period as stated on the cover of this report and do not necessarily represent the views of Fidelity or any other person in the Fidelity organization. Any such views are subject to change at any time based upon market or other conditions and Fidelity disclaims any responsibility to update such views. These views may not be relied on as investment advice and, because investment decisions for a Fidelity fund are based on numerous factors, may not be relied on as an indication of trading intent on behalf of any Fidelity fund.
Annual Report
Fidelity Emerging Markets Discovery Fund
Shareholder Expense Example
As a shareholder of the Fund, you incur two types of costs: (1) transaction costs, including sales charges (loads) on purchase payments or redemption proceeds, redemption fees and (2) ongoing costs, including management fees, distribution and/or service (12b-1) fees and other Fund expenses. This Example is intended to help you understand your ongoing costs (in dollars) of investing in the Fund and to compare these costs with the ongoing costs of investing in other mutual funds.
The Example is based on an investment of $1,000 invested at the beginning of the period and held for the entire period (May 1, 2013 to October 31, 2013).
Actual Expenses
The first line of the accompanying table for each class of the Fund provides information about actual account values and actual expenses. You may use the information in this line, together with the amount you invested, to estimate the expenses that you paid over the period. Simply divide your account value by $1,000.00 (for example, an $8,600 account value divided by $1,000.00 = 8.6), then multiply the result by the number in the first line for a class of the Fund under the heading entitled "Expenses Paid During Period" to estimate the expenses you paid on your account during this period. A small balance maintenance fee of $12.00 that is charged once a year may apply for certain accounts with a value of less than $2,000. This fee is not included in the table below. If it was, the estimate of expenses you paid during the period would be higher, and your ending account value lower, by this amount. In addition, the Fund, as a shareholder in the underlying Fidelity Central Funds, will indirectly bear its pro-rata share of the fees and expenses incurred by the underlying Fidelity Central Funds. These fees and expenses are not included in the Fund's annualized expense ratio used to calculate the expense estimate in the table below.
Hypothetical Example for Comparison Purposes
The second line of the accompanying table for each class of the Fund provides information about hypothetical account values and hypothetical expenses based on a Class' actual expense ratio and an assumed rate of return of 5% per year before expenses, which is not the Class' actual return. The hypothetical account values and expenses may not be used to estimate the actual ending account balance or expenses you paid for the period. You may use this information to compare the ongoing costs of investing in the Fund and other funds. To do so, compare this 5% hypothetical example with the 5% hypothetical examples that appear in the shareholder reports of the other funds. A small balance maintenance fee of $12.00 that is charged once a year may apply for certain accounts with a value of less than $2,000. This fee is not included in the table below. If it was, the estimate of expenses you paid during the period would be higher, and your ending account value lower, by this amount. In addition, the Fund, as a shareholder in the underlying Fidelity Central Funds, will indirectly bear its pro-rata share of the fees and expenses incurred by the underlying Fidelity Central Funds. These fees and expenses are not included in the Fund's annualized expense ratio used to calculate the expense estimate in the table below.
Please note that the expenses shown in the table are meant to highlight your ongoing costs only and do not reflect any transaction costs. Therefore, the second line of the table is useful in comparing ongoing costs only, and will not help you determine the relative total costs of owning different funds. In addition, if these transactional costs were included, your costs would have been higher.
Annual Report
| Annualized
Expense RatioB | Beginning
Account Value
May 1, 2013 | Ending
Account Value
October 31, 2013 | Expenses Paid
During Period*
May 1, 2013
to October 31, 2013 |
Class A | 1.70% | | | |
Actual | | $ 1,000.00 | $ 980.40 | $ 8.49 |
HypotheticalA | | $ 1,000.00 | $ 1,016.64 | $ 8.64 |
Class T | 1.95% | | | |
Actual | | $ 1,000.00 | $ 978.80 | $ 9.73 |
HypotheticalA | | $ 1,000.00 | $ 1,015.38 | $ 9.91 |
Class C | 2.45% | | | |
Actual | | $ 1,000.00 | $ 977.10 | $ 12.21 |
HypotheticalA | | $ 1,000.00 | $ 1,012.85 | $ 12.43 |
Emerging Markets Discovery | 1.45% | | | |
Actual | | $ 1,000.00 | $ 981.20 | $ 7.24 |
HypotheticalA | | $ 1,000.00 | $ 1,017.90 | $ 7.38 |
Institutional Class | 1.45% | | | |
Actual | | $ 1,000.00 | $ 982.00 | $ 7.24 |
HypotheticalA | | $ 1,000.00 | $ 1,017.90 | $ 7.38 |
A 5% return per year before expenses
B Annualized expense ratio reflects expenses net of applicable fee waivers.
* Expenses are equal to each Class' annualized expense ratio, multiplied by the average account value over the period, multiplied by 184/365 (to reflect the one-half year period).
Annual Report
Fidelity Emerging Markets Discovery Fund
Investment Changes (Unaudited)
Top Five Stocks as of October 31, 2013 |
| % of fund's
net assets | % of fund's net assets
6 months ago |
E-Mart Co. Ltd. (Korea (South), Food & Staples Retailing) | 1.7 | 1.0 |
Unified-President Enterprises Corp. (Taiwan, Food Products) | 1.4 | 1.2 |
China Insurance International Holdings Co. Ltd. (Hong Kong, Insurance) | 1.4 | 0.8 |
Compania Cervecerias Unidas SA sponsored ADR (Chile, Beverages) | 1.4 | 1.0 |
LG Household & Health Care Ltd. (Korea (South), Household Products) | 1.4 | 1.1 |
| 7.3 | |
Top Five Market Sectors as of October 31, 2013 |
| % of fund's
net assets | % of fund's net assets
6 months ago |
Financials | 25.8 | 23.8 |
Industrials | 19.2 | 17.2 |
Consumer Staples | 16.9 | 17.3 |
Consumer Discretionary | 15.1 | 16.7 |
Health Care | 6.9 | 5.3 |
Top Five Countries as of October 31, 2013 |
(excluding cash equivalents) | % of fund's
net assets | % of fund's net assets
6 months ago |
India | 13.3 | 10.4 |
Taiwan | 11.8 | 22.7 |
South Africa | 10.4 | 11.0 |
Korea (South) | 9.9 | 12.8 |
Chile | 7.7 | 5.8 |
Percentages are adjusted for the effect of open futures contracts, if applicable. |
Asset Allocation (% of fund's net assets) |
As of October 31, 2013 | As of April 30, 2013 |
 | Stocks 97.3% | | | Stocks 98.8% | |
 | Short-TermInvestments andNet Other Assets (Liabilities) 2.7% | | | Short-TermInvestments andNet Other Assets (Liabilities) 1.2% | |

Annual Report
Fidelity Emerging Markets Discovery Fund
Investments October 31, 2013
Showing Percentage of Net Assets
Common Stocks - 96.3% |
| Shares | | Value |
Bermuda - 6.9% |
China Foods Ltd. | 1,566,000 | | $ 710,992 |
Shangri-La Asia Ltd. | 520,000 | | 952,406 |
Silverlake Axis Ltd. Class A | 1,533,000 | | 888,553 |
Tai Cheung Holdings Ltd. | 1,017,000 | | 771,309 |
Texwinca Holdings Ltd. | 1,228,000 | | 1,256,035 |
Trinity Ltd. | 1,246,000 | | 466,065 |
Wilson Sons Ltd. unit | 81,855 | | 1,023,096 |
Yue Yuen Industrial (Holdings) Ltd. | 471,000 | | 1,293,989 |
TOTAL BERMUDA | | 7,362,445 |
Brazil - 4.6% |
BHG SA (Brazil Hospitality Group) (a) | 106,800 | | 781,859 |
BTG Pactual Participations Ltd. unit | 48,000 | | 642,157 |
Fleury SA | 121,600 | | 941,773 |
Hypermarcas SA | 119,000 | | 1,038,501 |
Iguatemi Empresa de Shopping Centers SA | 72,200 | | 829,904 |
Terna Participacoes SA unit | 74,000 | | 718,463 |
TOTAL BRAZIL | | 4,952,657 |
Cayman Islands - 6.9% |
China Lodging Group Ltd. ADR (a) | 46,300 | | 1,017,674 |
Chu Kong Petroleum & Natural Gas Steel Pipe Holdings Ltd. | 1,000,000 | | 374,049 |
Ginko International Co. Ltd. | 29,000 | | 552,709 |
Gourmet Master Co. Ltd. | 152,000 | | 1,012,128 |
Greatview Aseptic Pack Co. Ltd. | 1,319,000 | | 830,223 |
Lifestyle International Holdings Ltd. | 113,000 | | 246,318 |
Samson Holding Ltd. | 7,877,000 | | 1,097,273 |
SITC International Holdings Co. Ltd. | 1,685,000 | | 712,860 |
Springland International Holdings Ltd. | 1,264,000 | | 692,893 |
Tao Heung Holdings Ltd. | 1,128,000 | | 865,678 |
TOTAL CAYMAN ISLANDS | | 7,401,805 |
Chile - 7.7% |
Compania Cervecerias Unidas SA sponsored ADR | 55,107 | | 1,470,806 |
Embotelladora Andina SA sponsored ADR | 32,153 | | 1,099,633 |
Empresa Nacional de Telecomunicaciones SA (ENTEL) | 60,226 | | 926,816 |
Isapre CruzBlanca SA | 1,312,507 | | 896,528 |
Parque Arauco SA | 431,517 | | 833,129 |
Quinenco SA | 456,526 | | 1,220,968 |
Quinenco SA rights 11/5/13 (a) | 108,014 | | 42,172 |
Common Stocks - continued |
| Shares | | Value |
Chile - continued |
Sociedad Matriz SAAM SA | 9,377,011 | | $ 942,552 |
Sonda SA | 290,100 | | 753,212 |
TOTAL CHILE | | 8,185,816 |
China - 1.0% |
China Communications Services Corp. Ltd. (H Shares) | 1,116,000 | | 683,735 |
Shandong Weigao Medical Polymer Co. Ltd. (H Shares) | 408,000 | | 383,108 |
TOTAL CHINA | | 1,066,843 |
Colombia - 0.6% |
Bolsa de Valores de Colombia | 48,878,613 | | 622,492 |
Hong Kong - 3.6% |
China Insurance International Holdings Co. Ltd. (a) | 946,000 | | 1,476,409 |
Dah Chong Hong Holdings Ltd. | 893,000 | | 757,892 |
HKT Trust / HKT Ltd. unit | 984,000 | | 912,545 |
Singamas Container Holdings Ltd. | 2,936,000 | | 685,433 |
TOTAL HONG KONG | | 3,832,279 |
Hungary - 1.1% |
Richter Gedeon PLC | 62,400 | | 1,186,549 |
India - 13.3% |
Bank of Baroda | 69,571 | | 725,808 |
Container Corp. of India Ltd. | 76,245 | | 936,545 |
Credit Analysis & Research Ltd. | 100,032 | | 1,080,201 |
Grasim Industries Ltd. | 19,771 | | 929,352 |
IDFC Ltd. | 648,827 | | 1,113,421 |
Indian Hotels Co. Ltd. | 938,336 | | 748,397 |
Ipca Laboratories Ltd. | 90,219 | | 1,007,944 |
Jain Irrigation Systems Ltd. | 760,572 | | 825,689 |
Mahindra Lifespace Developers Ltd. | 93,500 | | 649,921 |
Motilal Oswal Financial Services Ltd. | 685,225 | | 773,914 |
Prestige Estates Projects Ltd. (a) | 373,175 | | 866,265 |
Punjab National Bank | 80,137 | | 743,345 |
SKS Microfinance Ltd. (a) | 325,922 | | 823,479 |
Tech Mahindra Ltd. (a) | 54,154 | | 1,363,033 |
Thermax Ltd. (a) | 76,141 | | 787,802 |
Tube Investments of India Ltd. | 354,155 | | 844,813 |
TOTAL INDIA | | 14,219,929 |
Indonesia - 4.1% |
PT Astra Graphia Tbk | 7,177,500 | | 1,056,961 |
PT Bank Tabungan Pensiunan Nasional Tbk (a) | 543,500 | | 210,938 |
Common Stocks - continued |
| Shares | | Value |
Indonesia - continued |
PT Hero Supermarket Tbk (a) | 2,698,000 | | $ 861,632 |
PT Holcim Indonesia Tbk | 3,289,000 | | 751,309 |
PT Tempo Scan Pacific Tbk | 2,063,000 | | 713,742 |
PT Wijaya Karya Persero Tbk | 4,610,500 | | 785,284 |
TOTAL INDONESIA | | 4,379,866 |
Kenya - 0.8% |
East African Breweries Ltd. | 228,200 | | 852,909 |
Korea (South) - 9.9% |
Binggrea Co. Ltd. | 8,872 | | 748,194 |
E-Mart Co. Ltd. | 7,626 | | 1,825,156 |
Kiwoom Securities Co. Ltd. | 25,329 | | 1,326,975 |
Korea Plant Service & Engineering Co. Ltd. | 27,617 | | 1,400,002 |
LG Corp. | 24,155 | | 1,427,067 |
LG Household & Health Care Ltd. | 2,792 | | 1,449,562 |
Samsung Fire & Marine Insurance Co. Ltd. | 2,907 | | 679,308 |
Shinsegae Food Co. Ltd. | 10,022 | | 839,510 |
TK Corp. (a) | 45,428 | | 922,446 |
TOTAL KOREA (SOUTH) | | 10,618,220 |
Malaysia - 2.4% |
Oldtown Bhd | 1,036,900 | | 814,672 |
Oriental Holdings Bhd | 295,600 | | 827,849 |
YTL Corp. Bhd | 1,866,800 | | 975,834 |
TOTAL MALAYSIA | | 2,618,355 |
Mexico - 1.4% |
Bolsa Mexicana de Valores S.A.B. de CV | 310,300 | | 739,645 |
Consorcio ARA S.A.B. de CV (a) | 1,864,800 | | 728,926 |
TOTAL MEXICO | | 1,468,571 |
Nigeria - 0.7% |
Guaranty Trust Bank PLC | 4,415,484 | | 703,474 |
Philippines - 0.7% |
Security Bank Corp. | 217,510 | | 699,616 |
Poland - 1.2% |
Warsaw Stock Exchange | 87,205 | | 1,262,630 |
Russia - 2.4% |
Moscow Exchange MICEX-RTS OAO | 284,000 | | 542,395 |
Common Stocks - continued |
| Shares | | Value |
Russia - continued |
Synergy Co. (a) | 56,651 | | $ 1,130,167 |
Vozrozhdenie Bank | 71,500 | | 922,991 |
TOTAL RUSSIA | | 2,595,553 |
Singapore - 0.6% |
Ezion Holdings Ltd. | 378,000 | | 681,629 |
South Africa - 10.4% |
Adcorp Holdings Ltd. | 312,400 | | 1,079,532 |
African Bank Investments Ltd. | 583,117 | | 987,472 |
Astral Foods Ltd. | 136,400 | | 1,372,322 |
Bidvest Group Ltd. | 47,500 | | 1,266,714 |
Illovo Sugar Ltd. | 278,400 | | 872,188 |
JSE Ltd. | 100,955 | | 882,963 |
PSG Group Ltd. | 143,700 | | 1,180,949 |
SA Corporate Real Estate Fund | 1,935,200 | | 773,020 |
Tiger Brands Ltd. | 44,025 | | 1,290,128 |
Zeder Investments Ltd. | 3,171,609 | | 1,369,352 |
TOTAL SOUTH AFRICA | | 11,074,640 |
Sri Lanka - 0.7% |
John Keells Holdings Ltd. | 442,958 | | 756,649 |
Taiwan - 11.8% |
Chroma ATE, Inc. | 501,000 | | 1,065,487 |
Cleanaway Co. Ltd. | 142,000 | | 887,651 |
CTCI Corp. | 588,000 | | 1,026,778 |
E.SUN Financial Holdings Co. Ltd. | 1,630,655 | | 1,088,581 |
Formosa Optical Technology Co. Ltd. | 304,000 | | 1,084,423 |
Johnson Health Tech Co. Ltd. | 1,740 | | 4,960 |
Kd Holding Corp. | 134,000 | | 860,404 |
King Slide Works Co. Ltd. | 70,000 | | 618,312 |
MJC Probe, Inc. | 449,000 | | 782,528 |
Pacific Hospital Supply Co. Ltd. | 313,700 | | 1,166,983 |
Sinyi Realty, Inc. | 635,560 | | 1,159,489 |
St. Shine Optical Co. Ltd. | 20,000 | | 587,736 |
Standard Foods Corp. | 26,450 | | 80,873 |
Unified-President Enterprises Corp. | 785,803 | | 1,494,988 |
Wowprime Corp. | 43,500 | | 719,704 |
TOTAL TAIWAN | | 12,628,897 |
Turkey - 3.0% |
Anadolu Efes Biracilik Ve Malt Sanayii A/S | 83,749 | | 1,069,806 |
Common Stocks - continued |
| Shares | | Value |
Turkey - continued |
Enka Insaat ve Sanayi A/S | 403,057 | | $ 1,179,137 |
Is Yatirim Menkul Degerler A/S | 1,385,599 | | 999,505 |
TOTAL TURKEY | | 3,248,448 |
United States of America - 0.5% |
Sohu.com, Inc. (a) | 7,900 | | 528,984 |
TOTAL COMMON STOCKS (Cost $100,982,901) |
102,949,256
|
Nonconvertible Preferred Stocks - 1.0% |
| | | |
Brazil - 1.0% |
Klabin SA (PN) (non-vtg.)
(Cost $996,339) | 201,200 | |
1,068,780
|
Money Market Funds - 3.2% |
| | | |
Fidelity Cash Central Fund, 0.09% (b)
(Cost $3,360,575) | 3,360,575 | |
3,360,575
|
TOTAL INVESTMENT PORTFOLIO - 100.5% (Cost $105,339,815) | | 107,378,611 |
NET OTHER ASSETS (LIABILITIES) - (0.5)% | | (510,079) |
NET ASSETS - 100% | $ 106,868,532 |
Legend |
(a) Non-income producing |
(b) Affiliated fund that is generally available only to investment companies and other accounts managed by Fidelity Investments. The rate quoted is the annualized seven-day yield of the fund at period end. A complete unaudited listing of the fund's holdings as of its most recent quarter end is available upon request. In addition, each Fidelity Central Fund's financial statements, which are not covered by the Fund's Report of Independent Registered Public Accounting Firm, are available on the SEC's website or upon request. |
Affiliated Central Funds |
Information regarding fiscal year to date income earned by the Fund from investments in Fidelity Central Funds is as follows: |
Fund | Income earned |
Fidelity Cash Central Fund | $ 5,709 |
Fidelity Securities Lending Cash Central Fund | 3,614 |
Total | $ 9,323 |
Other Information |
Categorizations in the Schedule of Investments are based on country or territory of incorporation. |
The following is a summary of the inputs used, as of October 31, 2013, involving the Fund's assets and liabilities carried at fair value. The inputs or methodology used for valuing securities may not be an indication of the risk associated with investing in those securities. For more information on valuation inputs, and their aggregation into the levels used in the table below, please refer to the Investment Valuation section in the accompanying Notes to Financial Statements. |
Valuation Inputs at Reporting Date: |
Description | Total | Level 1 | Level 2 | Level 3 |
Investments in Securities: | | | | |
Equities: | | | | |
Consumer Discretionary | $ 16,238,792 | $ 16,238,792 | $ - | $ - |
Consumer Staples | 18,182,529 | 18,182,529 | - | - |
Energy | 1,055,678 | 1,055,678 | - | - |
Financials | 27,481,057 | 26,737,712 | 743,345 | - |
Health Care | 7,437,072 | 6,429,128 | 1,007,944 | - |
Industrials | 20,444,054 | 20,444,054 | - | - |
Information Technology | 5,381,797 | 5,381,797 | - | - |
Materials | 3,579,664 | 2,650,312 | 929,352 | - |
Telecommunication Services | 2,523,096 | 2,523,096 | - | - |
Utilities | 1,694,297 | 1,694,297 | - | - |
Money Market Funds | 3,360,575 | 3,360,575 | - | - |
Total Investments in Securities: | $ 107,378,611 | $ 104,697,970 | $ 2,680,641 | $ - |
See accompanying notes which are an integral part of the financial statements.
Annual Report
Fidelity Emerging Markets Discovery Fund
Statement of Assets and Liabilities
| October 31, 2013 |
| | |
Assets | | |
Investment in securities, at value - See accompanying schedule: Unaffiliated issuers (cost $101,979,240) | $ 104,018,036 | |
Fidelity Central Funds (cost $3,360,575) | 3,360,575 | |
Total Investments (cost $105,339,815) | | $ 107,378,611 |
Cash | | 105,599 |
Foreign currency held at value (cost $10,502) | | 10,477 |
Receivable for investments sold | | 3,062,739 |
Receivable for fund shares sold | | 297,178 |
Dividends receivable | | 39,430 |
Distributions receivable from Fidelity Central Funds | | 464 |
Prepaid expenses | | 451 |
Receivable from investment adviser for expense reductions | | 31,581 |
Other affiliated receivables | | 73,436 |
Other receivables | | 25,607 |
Total assets | | 111,025,573 |
| | |
Liabilities | | |
Payable for investments purchased | $ 3,624,635 | |
Payable for fund shares redeemed | 102,677 | |
Accrued management fee | 75,088 | |
Distribution and service plan fees payable | 3,409 | |
Other affiliated payables | 25,814 | |
Other payables and accrued expenses | 325,418 | |
Total liabilities | | 4,157,041 |
| | |
Net Assets | | $ 106,868,532 |
Net Assets consist of: | | |
Paid in capital | | $ 103,184,879 |
Undistributed net investment income | | 648,420 |
Accumulated undistributed net realized gain (loss) on investments and foreign currency transactions | | 1,216,581 |
Net unrealized appreciation (depreciation) on investments and assets and liabilities in foreign currencies | | 1,818,652 |
Net Assets | | $ 106,868,532 |
See accompanying notes which are an integral part of the financial statements.
Annual Report
Fidelity Emerging Markets Discovery Fund
Financial Statements - continued
Statement of Assets and Liabilities - continued
| October 31, 2013 |
| | |
Calculation of Maximum Offering Price Class A:
Net Asset Value and redemption price per share ($5,065,263 ÷ 405,641 shares) | | $ 12.49 |
| | |
Maximum offering price per share (100/94.25 of $12.49) | | $ 13.25 |
Class T:
Net Asset Value and redemption price per share ($1,914,183 ÷ 153,883 shares) | | $ 12.44 |
| | |
Maximum offering price per share (100/96.50 of $12.44) | | $ 12.89 |
Class C:
Net Asset Value and offering price per share ($2,081,734 ÷ 168,561 shares)A | | $ 12.35 |
| | |
Emerging Markets Discovery:
Net Asset Value, offering price and redemption price per share ($96,731,108 ÷ 7,723,835 shares) | | $ 12.52 |
| | |
Institutional Class:
Net Asset Value, offering price and redemption price per share ($1,076,244 ÷ 85,924 shares) | | $ 12.53 |
A Redemption price per share is equal to net asset value less any applicable contingent deferred sales charge.
See accompanying notes which are an integral part of the financial statements.
Annual Report
Statement of Operations
| Year ended October 31, 2013 |
| | |
Investment Income | | |
Dividends | | $ 2,828,759 |
Income from Fidelity Central Funds | | 9,323 |
Income before foreign taxes withheld | | 2,838,082 |
Less foreign taxes withheld | | (276,587) |
Total income | | 2,561,495 |
| | |
Expenses | | |
Management fee | $ 970,456 | |
Transfer agent fees | 278,936 | |
Distribution and service plan fees | 51,976 | |
Accounting and security lending fees | 58,907 | |
Custodian fees and expenses | 313,877 | |
Independent trustees' compensation | 619 | |
Registration fees | 92,723 | |
Audit | 76,674 | |
Legal | 207 | |
Miscellaneous | 435 | |
Total expenses before reductions | 1,844,810 | |
Expense reductions | (214,796) | 1,630,014 |
Net investment income (loss) | | 931,481 |
Realized and Unrealized Gain (Loss) Net realized gain (loss) on: | | |
Investment securities: | | |
Unaffiliated issuers (net of foreign taxes of $74,639) | 2,425,794 | |
Foreign currency transactions | (109,494) | |
Total net realized gain (loss) | | 2,316,300 |
Change in net unrealized appreciation (depreciation) on: Investment securities (net of increase in deferred foreign taxes of $183,313) | (861,858) | |
Assets and liabilities in foreign currencies | (3,018) | |
Total change in net unrealized appreciation (depreciation) | | (864,876) |
Net gain (loss) | | 1,451,424 |
Net increase (decrease) in net assets resulting from operations | | $ 2,382,905 |
See accompanying notes which are an integral part of the financial statements.
Annual Report
Fidelity Emerging Markets Discovery Fund
Financial Statements - continued
Statement of Changes in Net Assets
| Year ended
October 31,
2013 | For the period
November 1, 2011 (commencement of operations) to
October 31, 2012 |
Increase (Decrease) in Net Assets | | |
Operations | | |
Net investment income (loss) | $ 931,481 | $ 275,092 |
Net realized gain (loss) | 2,316,300 | 834,546 |
Change in net unrealized appreciation (depreciation) | (864,876) | 2,683,528 |
Net increase (decrease) in net assets resulting
from operations | 2,382,905 | 3,793,166 |
Distributions to shareholders from net investment income | (286,293) | (7,760) |
Distributions to shareholders from net realized gain | (914,866) | - |
Total distributions | (1,201,159) | (7,760) |
Share transactions - net increase (decrease) | 59,689,170 | 41,986,470 |
Redemption fees | 191,734 | 34,006 |
Total increase (decrease) in net assets | 61,062,650 | 45,805,882 |
| | |
Net Assets | | |
Beginning of period | 45,805,882 | - |
End of period (including undistributed net investment income of $648,420 and undistributed net investment income of $251,826, respectively) | $ 106,868,532 | $ 45,805,882 |
See accompanying notes which are an integral part of the financial statements.
Annual Report
Financial Highlights - Class A
Years ended October 31, | 2013 | 2012 F |
Selected Per-Share Data | | |
Net asset value, beginning of period | $ 11.89 | $ 10.00 |
Income from Investment Operations | | |
Net investment income (loss) C | .08 | .12 |
Net realized and unrealized gain (loss) | .75 | 1.76 |
Total from investment operations | .83 | 1.88 |
Distributions from net investment income | (.04) | (.01) |
Distributions from net realized gain | (.20) | - |
Total distributions | (.25) H | (.01) |
Redemption fees added to paid in capital C | .02 | .02 |
Net asset value, end of period | $ 12.49 | $ 11.89 |
Total Return A, B | 7.20% | 19.00% |
Ratios to Average Net Assets D, G | | |
Expenses before reductions | 1.87% | 3.49% |
Expenses net of fee waivers, if any | 1.70% | 1.70% |
Expenses net of all reductions | 1.64% | 1.64% |
Net investment income (loss) | .62% | 1.16% |
Supplemental Data | | |
Net assets, end of period (000 omitted) | $ 5,065 | $ 1,671 |
Portfolio turnover rate E | 179% | 83% |
A Total returns would have been lower if certain expenses had not been reduced during the applicable periods shown.
B Total returns do not include the effect of the sales charges.
C Calculated based on average shares outstanding during the period.
D Fees and expenses of any underlying Fidelity Central Funds are not included in the Fund's expense ratio. The Fund indirectly bears its proportionate share of the expenses of any underlying Fidelity Central Funds.
E Amount does not include the portfolio activity of any underlying Fidelity Central Funds.
F For the period November 1, 2011 (commencement of operations) to October 31, 2012.
G Expense ratios reflect operating expenses of the class. Expenses before reductions do not reflect amounts reimbursed by the investment adviser or reductions from brokerage service arrangements or reductions from other expense offset arrangements and do not represent the amount paid by the class during periods when reimbursements or reductions occur. Expense ratios before reductions for start-up periods may not be representative of longer-term operating periods. Expenses net of fee waivers reflect expenses after reimbursement by the investment adviser but prior to reductions from brokerage service arrangements or other expense offset arrangements. Expenses net of all reductions represent the net expenses paid by the class.
H Total distributions of $.25 per share is comprised of distributions from net investment income of $.044 and distributions from net realized gain of $.203 per share.
See accompanying notes which are an integral part of the financial statements.
Annual Report
Financial Highlights - Class T
Years ended October 31, | 2013 | 2012 F |
Selected Per-Share Data | | |
Net asset value, beginning of period | $ 11.87 | $ 10.00 |
Income from Investment Operations | | |
Net investment income (loss) C | .05 | .10 |
Net realized and unrealized gain (loss) | .74 | 1.75 |
Total from investment operations | .79 | 1.85 |
Distributions from net investment income | (.03) | - I |
Distributions from net realized gain | (.20) | - |
Total distributions | (.24) H | - I |
Redemption fees added to paid in capital C | .02 | .02 |
Net asset value, end of period | $ 12.44 | $ 11.87 |
Total Return A, B | 6.87% | 18.75% |
Ratios to Average Net Assets D, G | | |
Expenses before reductions | 2.19% | 3.77% |
Expenses net of fee waivers, if any | 1.95% | 1.95% |
Expenses net of all reductions | 1.89% | 1.89% |
Net investment income (loss) | .37% | .91% |
Supplemental Data | | |
Net assets, end of period (000 omitted) | $ 1,914 | $ 1,700 |
Portfolio turnover rate E | 179% | 83% |
A Total returns would have been lower if certain expenses had not been reduced during the applicable periods shown.
B Total returns do not include the effect of the sales charges.
C Calculated based on average shares outstanding during the period.
D Fees and expenses of any underlying Fidelity Central Funds are not included in the Fund's expense ratio. The Fund indirectly bears its proportionate share of the expenses of any underlying Fidelity Central Funds.
E Amount does not include the portfolio activity of any underlying Fidelity Central Funds.
F For the period November 1, 2011 (commencement of operations) to October 31, 2012.
G Expense ratios reflect operating expenses of the class. Expenses before reductions do not reflect amounts reimbursed by the investment adviser or reductions from brokerage service arrangements or reductions from other expense offset arrangements and do not represent the amount paid by the class during periods when reimbursements or reductions occur. Expense ratios before reductions for start-up periods may not be representative of longer-term operating periods. Expenses net of fee waivers reflect expenses after reimbursement by the investment adviser but prior to reductions from brokerage service arrangements or other expense offset arrangements. Expenses net of all reductions represent the net expenses paid by the class.
H Total distributions of $.24 per share is comprised of distributions from net investment income of $.034 and distributions from net realized gain of $.203 per share.
I Amount represents less than $.01 per share
See accompanying notes which are an integral part of the financial statements.
Annual Report
Financial Highlights - Class C
Years ended October 31, | 2013 | 2012 F |
Selected Per-Share Data | | |
Net asset value, beginning of period | $ 11.82 | $ 10.00 |
Income from Investment Operations | | |
Net investment income (loss) C | (.02) | .04 |
Net realized and unrealized gain (loss) | .74 | 1.76 |
Total from investment operations | .72 | 1.80 |
Distributions from net investment income | (.01) | - |
Distributions from net realized gain | (.20) | - |
Total distributions | (.21) | - |
Redemption fees added to paid in capital C | .02 | .02 |
Net asset value, end of period | $ 12.35 | $ 11.82 |
Total Return A, B | 6.32% | 18.20% |
Ratios to Average Net Assets D, G | | |
Expenses before reductions | 2.70% | 4.32% |
Expenses net of fee waivers, if any | 2.45% | 2.45% |
Expenses net of all reductions | 2.39% | 2.39% |
Net investment income (loss) | (.13)% | .41% |
Supplemental Data | | |
Net assets, end of period (000 omitted) | $ 2,082 | $ 1,474 |
Portfolio turnover rate E | 179% | 83% |
A Total returns would have been lower if certain expenses had not been reduced during the applicable periods shown.
B Total returns do not include the effect of the contingent deferred sales charge.
C Calculated based on average shares outstanding during the period.
D Fees and expenses of any underlying Fidelity Central Funds are not included in the Fund's expense ratio. The Fund indirectly bears its proportionate share of the expenses of any underlying Fidelity Central Funds.
E Amount does not include the portfolio activity of any underlying Fidelity Central Funds.
F For the period November 1, 2011 (commencement of operations) to October 31, 2012.
G Expense ratios reflect operating expenses of the class. Expenses before reductions do not reflect amounts reimbursed by the investment adviser or reductions from brokerage service arrangements or reductions from other expense offset arrangements and do not represent the amount paid by the class during periods when reimbursements or reductions occur. Expense ratios before reductions for start-up periods may not be representative of longer-term operating periods. Expenses net of fee waivers reflect expenses after reimbursement by the investment adviser but prior to reductions from brokerage service arrangements or other expense offset arrangements. Expenses net of all reductions represent the net expenses paid by the class.
See accompanying notes which are an integral part of the financial statements.
Annual Report
Financial Highlights - Emerging Markets Discovery
Years ended October 31, | 2013 | 2012 E |
Selected Per-Share Data | | |
Net asset value, beginning of period | $ 11.92 | $ 10.00 |
Income from Investment Operations | | |
Net investment income (loss) B | .11 | .15 |
Net realized and unrealized gain (loss) | .74 | 1.76 |
Total from investment operations | .85 | 1.91 |
Distributions from net investment income | (.07) | (.01) |
Distributions from net realized gain | (.20) | - |
Total distributions | (.27) | (.01) |
Redemption fees added to paid in capital B | .02 | .02 |
Net asset value, end of period | $ 12.52 | $ 11.92 |
Total Return A | 7.37% | 19.35% |
Ratios to Average Net Assets C, F | | |
Expenses before reductions | 1.57% | 3.02% |
Expenses net of fee waivers, if any | 1.45% | 1.45% |
Expenses net of all reductions | 1.39% | 1.39% |
Net investment income (loss) | .87% | 1.41% |
Supplemental Data | | |
Net assets, end of period (000 omitted) | $ 96,731 | $ 39,135 |
Portfolio turnover rate D | 179% | 83% |
A Total returns would have been lower if certain expenses had not been reduced during the applicable periods shown.
B Calculated based on average shares outstanding during the period.
C Fees and expenses of any underlying Fidelity Central Funds are not included in the Fund's expense ratio. The Fund indirectly bears its proportionate share of the expenses of any underlying Fidelity Central Funds.
D Amount does not include the portfolio activity of any underlying Fidelity Central Funds.
E For the period November 1, 2011 (commencement of operations) to October 31, 2012.
F Expense ratios reflect operating expenses of the class. Expenses before reductions do not reflect amounts reimbursed by the investment adviser or reductions from brokerage service arrangements or reductions from other expense offset arrangements and do not represent the amount paid by the class during periods when reimbursements or reductions occur. Expense ratios before reductions for start-up periods may not be representative of longer-term operating periods. Expenses net of fee waivers reflect expenses after reimbursement by the investment adviser but prior to reductions from brokerage service arrangements or other expense offset arrangements. Expenses net of all reductions represent the net expenses paid by the class.
See accompanying notes which are an integral part of the financial statements.
Annual Report
Financial Highlights - Institutional Class
Years ended October 31, | 2013 | 2012 E |
Selected Per-Share Data | | |
Net asset value, beginning of period | $ 11.92 | $ 10.00 |
Income from Investment Operations | | |
Net investment income (loss) B | .11 | .15 |
Net realized and unrealized gain (loss) | .75 | 1.76 |
Total from investment operations | .86 | 1.91 |
Distributions from net investment income | (.07) | (.01) |
Distributions from net realized gain | (.20) | - |
Total distributions | (.27) | (.01) |
Redemption fees added to paid in capital B | .02 | .02 |
Net asset value, end of period | $ 12.53 | $ 11.92 |
Total Return A | 7.45% | 19.35% |
Ratios to Average Net Assets C, F | | |
Expenses before reductions | 1.60% | 3.21% |
Expenses net of fee waivers, if any | 1.45% | 1.45% |
Expenses net of all reductions | 1.39% | 1.39% |
Net investment income (loss) | .87% | 1.41% |
Supplemental Data | | |
Net assets, end of period (000 omitted) | $ 1,076 | $ 1,825 |
Portfolio turnover rate D | 179% | 83% |
A Total returns would have been lower if certain expenses had not been reduced during the applicable periods shown.
B Calculated based on average shares outstanding during the period.
C Fees and expenses of any underlying Fidelity Central Funds are not included in the Fund's expense ratio. The Fund indirectly bears its proportionate share of the expenses of any underlying Fidelity Central Funds.
D Amount does not include the portfolio activity of any underlying Fidelity Central Funds.
E For the period November 1, 2011 (commencement of operations) to October 31, 2012.
F Expense ratios reflect operating expenses of the class. Expenses before reductions do not reflect amounts reimbursed by the investment adviser or reductions from brokerage service arrangements or reductions from other expense offset arrangements and do not represent the amount paid by the class during periods when reimbursements or reductions occur. Expense ratios before reductions for start-up periods may not be representative of longer-term operating periods. Expenses net of fee waivers reflect expenses after reimbursement by the investment adviser but prior to reductions from brokerage service arrangements or other expense offset arrangements. Expenses net of all reductions represent the net expenses paid by the class.
See accompanying notes which are an integral part of the financial statements.
Annual Report
Fidelity Emerging Markets Discovery Fund
Notes to Financial Statements
For the period ended October 31, 2013
1. Organization.
Fidelity Emerging Markets Discovery Fund (the Fund) is a non-diversified fund of Fidelity Investment Trust (the Trust) and is authorized to issue an unlimited number of shares. The Trust is registered under the Investment Company Act of 1940, as amended (the 1940 Act), as an open-end management investment company organized as a Massachusetts business trust. The Fund offers Class A, Class T, Class C, Emerging Markets Discovery and Institutional Class shares, each of which has equal rights as to assets and voting privileges. Each class has exclusive voting rights with respect to matters that affect that class. The Fund's investments in emerging markets can be subject to social, economic, regulatory, and political uncertainties and can be extremely volatile.
2. Investments in Fidelity Central Funds.
The Fund invests in Fidelity Central Funds, which are open-end investment companies generally available only to other investment companies and accounts managed by Fidelity Management & Research Company (FMR) and its affiliates. The Fund's Schedule of Investments lists each of the Fidelity Central Funds held as of period end, if any, as an investment of the Fund, but does not include the underlying holdings of each Fidelity Central Fund. As an Investing Fund, the Fund indirectly bears its proportionate share of the expenses of the underlying Fidelity Central Funds.
The Money Market Central Funds seek preservation of capital and current income and are managed by Fidelity Investments Money Management, Inc. (FIMM), an affiliate of FMR.
A complete unaudited list of holdings for each Fidelity Central Fund is available upon request or at the Securities and Exchange Commission (the SEC) website at www.sec.gov. In addition, the financial statements of the Fidelity Central Funds, which are not covered by the Fund's Report of Independent Registered Public Accounting Firm, are available on the SEC website or upon request.
3. Significant Accounting Policies.
The financial statements have been prepared in conformity with accounting principles generally accepted in the United States of America (GAAP), which require management to make certain estimates and assumptions at the date of the financial statements. Actual results could differ from those estimates. Subsequent events, if any, through the date that the financial statements were issued have been evaluated in the preparation of
Annual Report
Fidelity Emerging Markets Discovery Fund
Notes to Financial Statements - continued
3. Significant Accounting Policies - continued
the financial statements. The following summarizes the significant accounting policies of the Fund:
Investment Valuation. Investments are valued as of 4:00 p.m. Eastern time on the last calendar day of the period. In accordance with valuation policies and procedures approved by the Board of Trustees (the Board), the Fund attempts to obtain prices from one or more third party pricing vendors or brokers to value its investments. When current market prices, quotations or currency exchange rates are not readily available or reliable, investments will be fair valued in good faith by the FMR Fair Value Committee (the Committee), in accordance with procedures adopted by the Board. Factors used in determining fair value vary by investment type and may include market or investment specific events. The frequency with which these procedures are used cannot be predicted and they may be utilized to a significant extent. The Committee oversees the Fund's valuation policies and procedures and is responsible for approving and reporting to the Board all fair value determinations.
The Fund categorizes the inputs to valuation techniques used to value its investments into a disclosure hierarchy consisting of three levels as shown below:
Level 1 - quoted prices in active markets for identical investments
Level 2 - other significant observable inputs (including quoted prices for similar investments, interest rates, prepayment speeds, etc.)
Level 3 - unobservable inputs (including the Fund's own assumptions based on the best information available)
Valuation techniques used to value the Fund's investments by major category are as follows:
Equity securities, including restricted securities, for which market quotations are readily available, are valued at the last reported sale price or official closing price as reported by a third party pricing vendor on the primary market or exchange on which they are traded and are categorized as Level 1 in the hierarchy. In the event there were no sales during the day or closing prices are not available, securities are valued at the last quoted bid price or may be valued using the last available price and are generally categorized as Level 2 in the hierarchy. For foreign equity securities, when market or security specific events arise, comparisons to the valuation of American Depositary Receipts (ADRs), futures contracts, Exchange-Traded Funds (ETFs) and certain indexes as well as quoted prices for similar securities may be used and would be categorized as Level 2 in the hierarchy. Utilizing these techniques may result in transfers between Level 1 and Level 2. For equity securities, including restricted securities, where observable inputs are limited, assumptions about market activity and risk are used and these securities may be categorized as Level 3 in the hierarchy.
Annual Report
3. Significant Accounting Policies - continued
Investment Valuation - continued
Investments in open-end mutual funds, including the Fidelity Central Funds, are valued at their closing net asset value (NAV) each business day and are categorized as Level 1 in the hierarchy.
Changes in valuation techniques may result in transfers in or out of an assigned level within the disclosure hierarchy. The aggregate value of investments by input level, as of October 31, 2013, is included at the end of the Fund's Schedule of Investments.
Foreign Currency. The Fund may use foreign currency contracts to facilitate transactions in foreign-denominated securities. Gains and losses from these transactions may arise from changes in the value of the foreign currency or if the counterparties do not perform under the contracts' terms.
Foreign-denominated assets, including investment securities, and liabilities are translated into U.S. dollars at the exchange rates at period end. Purchases and sales of investment securities, income and dividends received and expenses denominated in foreign currencies are translated into U.S. dollars at the exchange rate in effect on the transaction date.
The effects of exchange rate fluctuations on investments are included with the net realized and unrealized gain (loss) on investment securities. Other foreign currency transactions resulting in realized and unrealized gain (loss) are disclosed separately.
Investment Transactions and Income. For financial reporting purposes, the Fund's investment holdings and NAV include trades executed through the end of the last business day of the period. The NAV per share for processing shareholder transactions is calculated as of the close of business of the New York Stock Exchange (NYSE), normally 4:00 p.m. Eastern time and includes trades executed through the end of the prior business day. Gains and losses on securities sold are determined on the basis of identified cost. Dividend income is recorded on the ex-dividend date, except for certain dividends from foreign securities where the ex-dividend date may have passed, which are recorded as soon as the Fund is informed of the ex-dividend date. Non-cash dividends included in dividend income, if any, are recorded at the fair market value of the securities received. Interest income and distributions from the Fidelity Central Funds are accrued as earned. Investment income is recorded net of foreign taxes withheld where recovery of such taxes is uncertain.
Annual Report
Fidelity Emerging Markets Discovery Fund
Notes to Financial Statements - continued
3. Significant Accounting Policies - continued
Class Allocations and Expenses. Investment income, realized and unrealized capital gains and losses, common expenses of the Fund, and certain fund-level expense reductions, if any, are allocated daily on a pro-rata basis to each class based on the relative net assets of each class to the total net assets of the Fund. Each class differs with respect to transfer agent and distribution and service plan fees incurred. Certain expense reductions may also differ by class. For the reporting period, the allocated portion of income and expenses to each class as a percent of its average net assets may vary due to the timing of recording these transactions in relation to fluctuating net assets of the classes. Expenses directly attributable to a fund are charged to that fund. Expenses attributable to more than one fund are allocated among the respective funds on the basis of relative net assets or other appropriate methods. Expense estimates are accrued in the period to which they relate and adjustments are made when actual amounts are known.
Income Tax Information and Distributions to Shareholders. Each year, the Fund intends to qualify as a regulated investment company under Subchapter M of the Internal Revenue Code, including distributing substantially all of its taxable income and realized gains. As a result, no provision for U.S. Federal income taxes is required. As of October 31, 2013, the Fund did not have any unrecognized tax benefits in the financial statements; nor is the Fund aware of any tax positions for which it is reasonably possible that the total amounts of unrecognized tax benefits will significantly change in the next twelve months. The Fund files a U.S. federal tax return, in addition to state and local tax returns as required. The Fund's federal income tax returns are subject to examination by the Internal Revenue Service (IRS) for a period of three fiscal years after they are filed. State and local tax returns may be subject to examination for an additional fiscal year depending on the jurisdiction. Foreign taxes are provided for based on the Fund's understanding of the tax rules and rates that exist in the foreign markets in which it invests. The Fund is subject to a tax imposed on capital gains by certain countries in which it invests. An estimated deferred tax liability for net unrealized appreciation on the applicable securities is included in Other payables and accrued expenses on the Statement of Assets & Liabilities.
Distributions are declared and recorded on the ex-dividend date. Income dividends and capital gain distributions are declared separately for each class. Income and capital gain distributions are determined in accordance with income tax regulations, which may differ from GAAP. In addition, the fund claimed a portion of the payment made to redeeming shareholders as a distribution for income tax purposes.
Capital accounts within the financial statements are adjusted for permanent book-tax differences. These adjustments have no impact on net assets or the results of operations. Temporary book-tax differences will reverse in a subsequent period.
Annual Report
3. Significant Accounting Policies - continued
Income Tax Information and Distributions to Shareholders - continued
Book-tax differences are primarily due to foreign currency transactions, certain foreign taxes, passive foreign investment companies (PFIC) and losses deferred due to wash sales.
The federal tax cost of investment securities and unrealized appreciation (depreciation) as of period end were as follows:
Gross unrealized appreciation | $ 7,324,813 |
Gross unrealized depreciation | (6,582,719) |
Net unrealized appreciation (depreciation) on securities and other investments | $ 742,094 |
| |
Tax Cost | $ 106,636,517 |
The tax-based components of distributable earnings as of period end were as follows:
Undistributed ordinary income | $ 648,420 |
Undistributed long-term capital gain | $ 2,513,282 |
Net unrealized appreciation (depreciation) | $ 738,896 |
The tax character of distributions paid was as follows:
| October 31, 2013 | October 31, 2012 |
Ordinary Income | $ 1,201,159 | $ 7,760 |
Short-Term Trading (Redemption) Fees. Shares held by investors in the Fund less than 90 days may have been subject to a redemption fee equal to 2.00% of the net asset value of shares redeemed. All redemption fees, which reduce the proceeds of the shareholder redemption, are retained by the Fund and accounted for as an addition to paid in capital.
4. Purchases and Sales of Investments.
Purchases and sales of securities, other than short-term securities, aggregated $247,560,295 and $189,920,365, respectively.
Annual Report
Fidelity Emerging Markets Discovery Fund
Notes to Financial Statements - continued
5. Fees and Other Transactions with Affiliates.
Management Fee. FMR and its affiliates provide the Fund with investment management related services for which the Fund pays a monthly management fee. The management fee is the sum of an individual fund fee rate that is based on an annual rate of .60% of the Fund's average net assets and an annualized group fee rate that averaged .25% during the period. The group fee rate is based upon the average net assets of all the mutual funds advised by FMR, including any mutual funds previously advised by FMR that are currently advised by Fidelity SelectCo, LLC, an affiliate of FMR. The group fee rate decreases as assets under management increase and increases as assets under management decrease. For the reporting period, the total annual management fee rate was .86% of the Fund's average net assets.
Distribution and Service Plan Fees. In accordance with Rule 12b-1 of the 1940 Act, the Fund has adopted separate Distribution and Service Plans for each class of shares. Certain classes pay Fidelity Distributors Corporation (FDC), an affiliate of FMR, separate Distribution and Service Fees, each of which is based on an annual percentage of each class' average net assets. In addition, FDC may pay financial intermediaries for selling shares of the Fund and providing shareholder support services. For the period, the Distribution and Service Fee rates, total fees and amounts retained by FDC were as follows:
| Distribution
Fee | Service
Fee | Total Fees | Retained
by FDC |
Class A | -% | .25% | $ 11,370 | $ 640 |
Class T | .25% | .25% | 10,003 | 706 |
Class C | .75% | .25% | 30,603 | 12,100 |
| | | $ 51,976 | $ 13,446 |
Sales Load. FDC may receive a front-end sales charge of up to 5.75% for selling Class A shares and 3.50% for selling Class T shares, some of which is paid to financial intermediaries for selling shares of the Fund. Depending on the holding period, FDC may receive contingent deferred sales charges levied on Class A, Class T and Class C redemptions. The deferred sales charges range from 1.00% for Class C shares, 1.00% for certain purchases of Class A shares and .25% for certain purchases of Class T shares.
For the period, sales charge amounts retained by FDC were as follows:
| Retained
by FDC |
Class A | $ 8,180 |
Class T | 2,075 |
Class C* | 942 |
| $ 11,197 |
* When Class C shares are initially sold, FDC pays commissions from its own resources to financial intermediaries through which the sales are made.
Annual Report
5. Fees and Other Transactions with Affiliates - continued
Transfer Agent Fees. Fidelity Investments Institutional Operations Company, Inc., (FIIOC), an affiliate of FMR, is the transfer, dividend disbursing and shareholder servicing agent for each class of the Fund. FIIOC receives account fees and asset-based fees that vary according to the account size and type of account of the shareholders of the respective classes of the Fund. FIIOC pays for typesetting, printing and mailing of shareholder reports, except proxy statements.
For the period, transfer agent fees for each class were as follows:
| Amount | % of
Average
Net Assets |
Class A | $ 13,166 | .29 |
Class T | 6,485 | .32 |
Class C | 7,570 | .25 |
Emerging Markets Discovery | 245,715 | .24 |
Institutional Class | 6,000 | .22 |
| $ 278,936 | |
Accounting and Security Lending Fees. Fidelity Service Company, Inc. (FSC), an affiliate of FMR, maintains the Fund's accounting records. The accounting fee is based on the level of average net assets for each month. Under a separate contract, FSC administers the security lending program. The security lending fee is based on the number and duration of lending transactions.
Brokerage Commissions. The Fund placed a portion of its portfolio transactions with brokerage firms which are affiliates of the investment adviser. Brokerage commissions are included in net realized gain (loss) and change in net unrealized appreciation (depreciation) in the Statement of Operations. The commissions paid to these affiliated firms were $334 for the period.
6. Committed Line of Credit.
The Fund participates with other funds managed by FMR or an affiliate in a $4.25 billion credit facility (the "line of credit") to be utilized for temporary or emergency purposes to fund shareholder redemptions or for other short-term liquidity purposes. The Fund has agreed to pay commitment fees on its pro-rata portion of the line of credit, which amounted to $232 and is reflected in Miscellaneous expenses on the Statement of Operations. During the period, there were no borrowings on this line of credit.
Annual Report
Fidelity Emerging Markets Discovery Fund
Notes to Financial Statements - continued
7. Security Lending.
The Fund lends portfolio securities through a lending agent from time to time in order to earn additional income. For equity securities, a lending agent is used and may loan securities to certain qualified borrowers, including Fidelity Capital Markets (FCM), a broker-dealer affiliated with the Fund. On the settlement date of the loan, the Fund receives collateral (in the form of U.S. Treasury obligations, letters of credit and/or cash) against the loaned securities and maintains collateral in an amount not less than 100% of the market value of the loaned securities during the period of the loan. The market value of the loaned securities is determined at the close of business of the Fund and any additional required collateral is delivered to the Fund on the next business day. If the borrower defaults on its obligation to return the securities loaned because of insolvency or other reasons, the Fund may apply collateral received from the borrower against the obligation. The Fund may experience delays and costs in recovering the securities loaned. Any cash collateral received is invested in the Fidelity Securities Lending Cash Central Fund. At period end, there were no security loans outstanding. Security lending income represents the income earned on investing cash collateral, less rebates paid to borrowers and any lending agent fees associated with the loan, plus any premium payments received for lending certain types of securities. Security lending income is presented in the Statement of Operations as a component of income from Fidelity Central Funds. Total security lending income during the period amounted to $3,614. During the period, there were no securities loaned to FCM.
8. Expense Reductions.
FMR contractually agreed to reimburse each class to the extent annual operating expenses exceeded certain levels of average net assets as noted in the table below. This reimbursement will remain in place through December 31, 2014. Some expenses, for example interest expense, including commitment fees, are excluded from this reimbursement.
The following classes were in reimbursement during the period:
| Expense
Limitations | Reimbursement |
| | |
Class A | 1.70% | $ 7,621 |
Class T | 1.95% | 4,856 |
Class C | 2.45% | 7,439 |
Emerging Markets Discovery | 1.45% | 124,923 |
Institutional Class | 1.45% | 4,058 |
| | $ 148,897 |
Annual Report
8. Expense Reductions - continued
In addition, FMR reimbursed a portion of the Fund's operating expenses during the period in the amount of $970.
Commissions paid to certain brokers with whom FMR, or its affiliates, places trades on behalf of the Fund include an amount in addition to trade execution, which may be rebated back to the Fund to offset certain expenses. This amount totaled $64,929 for the period.
9. Distributions to Shareholders.
Distributions to shareholders of each class were as follows:
Years ended October 31, | 2013 | 2012 A |
From net investment income | | |
Class A | $ 7,274 | $ 435 |
Class T | 5,643 | 203 |
Class C | 1,195 | - |
Emerging Markets Discovery | 259,277 | 6,522 |
Institutional Class | 12,904 | 600 |
Total | $ 286,293 | $ 7,760 |
From net realized gain | | |
Class A | $ 33,559 | $ - |
Class T | 33,691 | - |
Class C | 30,324 | - |
Emerging Markets Discovery | 778,518 | - |
Institutional Class | 38,774 | - |
Total | $ 914,866 | $ - |
A For the period November 1, 2011 (commencement of operations) to October 31, 2012.
Annual Report
Fidelity Emerging Markets Discovery Fund
Notes to Financial Statements - continued
10. Share Transactions.
Transactions for each class of shares were as follows:
| Shares | Dollars |
Years ended October 31, | 2013 | 2012 A | 2013 | 2012 A |
Class A | | | | |
Shares sold | 646,803 | 197,037 | $ 8,039,936 | $ 2,112,904 |
Reinvestment of distributions | 3,013 | 46 | 36,310 | 435 |
Shares redeemed | (384,660) | (56,598) | (4,712,072) | (637,589) |
Net increase (decrease) | 265,156 | 140,485 | $ 3,364,174 | $ 1,475,750 |
Class T | | | | |
Shares sold | 157,097 | 182,780 | $ 1,931,892 | $ 1,990,143 |
Reinvestment of distributions | 3,232 | 22 | 38,882 | 203 |
Shares redeemed | (149,702) | (39,546) | (1,831,906) | (451,707) |
Net increase (decrease) | 10,627 | 143,256 | $ 138,868 | $ 1,538,639 |
Class C | | | | |
Shares sold | 428,945 | 161,266 | $ 5,224,843 | $ 1,743,293 |
Reinvestment of distributions | 2,629 | - | 31,519 | - |
Shares redeemed | (387,768) | (36,511) | (4,776,955) | (415,821) |
Net increase (decrease) | 43,806 | 124,755 | $ 479,407 | $ 1,327,472 |
Emerging Markets Discovery | | | | |
Shares sold | 12,245,350 | 4,074,333 | $ 152,132,821 | $ 44,757,138 |
Reinvestment of distributions | 72,226 | 681 | 871,750 | 6,419 |
Shares redeemed | (7,876,995) | (791,760) | (96,541,547) | (8,744,517) |
Net increase (decrease) | 4,440,581 | 3,283,254 | $ 56,463,024 | $ 36,019,040 |
Institutional Class | | | | |
Shares sold | 231,788 | 199,001 | $ 2,857,278 | $ 2,149,513 |
Reinvestment of distributions | 3,612 | 64 | 43,597 | 600 |
Shares redeemed | (302,585) | (45,956) | (3,657,178) | (524,544) |
Net increase (decrease) | (67,185) | 153,109 | $ (756,303) | $ 1,625,569 |
A For the period November 1, 2011 (commencement of operations) to October 31, 2012.
11. Other.
The Fund's organizational documents provide former and current trustees and officers with a limited indemnification against liabilities arising in connection with the performance of their duties to the Fund. In the normal course of business, the Fund may also enter into contracts that provide general indemnifications. The Fund's maximum exposure under these arrangements is unknown as this would be dependent on future claims that may be made against the Fund. The risk of material loss from such claims is considered remote.
Annual Report
Fidelity Total Emerging Markets Fund
Average annual total return reflects the change in the value of an investment, assuming reinvestment of the fund's distributions from dividend income and capital gains (the profits earned upon the sale of securities that have grown in value, if any) and assuming a constant rate of performance each year. The $10,000 table and the fund's returns do not reflect the deduction of taxes that a shareholder would pay on fund distributions or the redemption of fund shares. During periods of reimbursement by Fidelity, a fund's total return will be greater than it would be had the reimbursement not occurred. How a fund did yesterday is no guarantee of how it will do tomorrow.
Average Annual Total Returns
Periods ended October 31, 2013 | Past 1
year | Life of
fund A |
Fidelity Total Emerging Markets Fund | 6.44% | 7.78% |
A From November 1, 2011
$10,000 Over Life of Fund
Let's say hypothetically that $10,000 was invested in Fidelity Total Emerging Markets Fund, a class of the fund, on November 1, 2011, when the fund started. The chart shows how the value of your investment would have changed, and also shows how the MSCI® Emerging Markets Index performed over the same period.
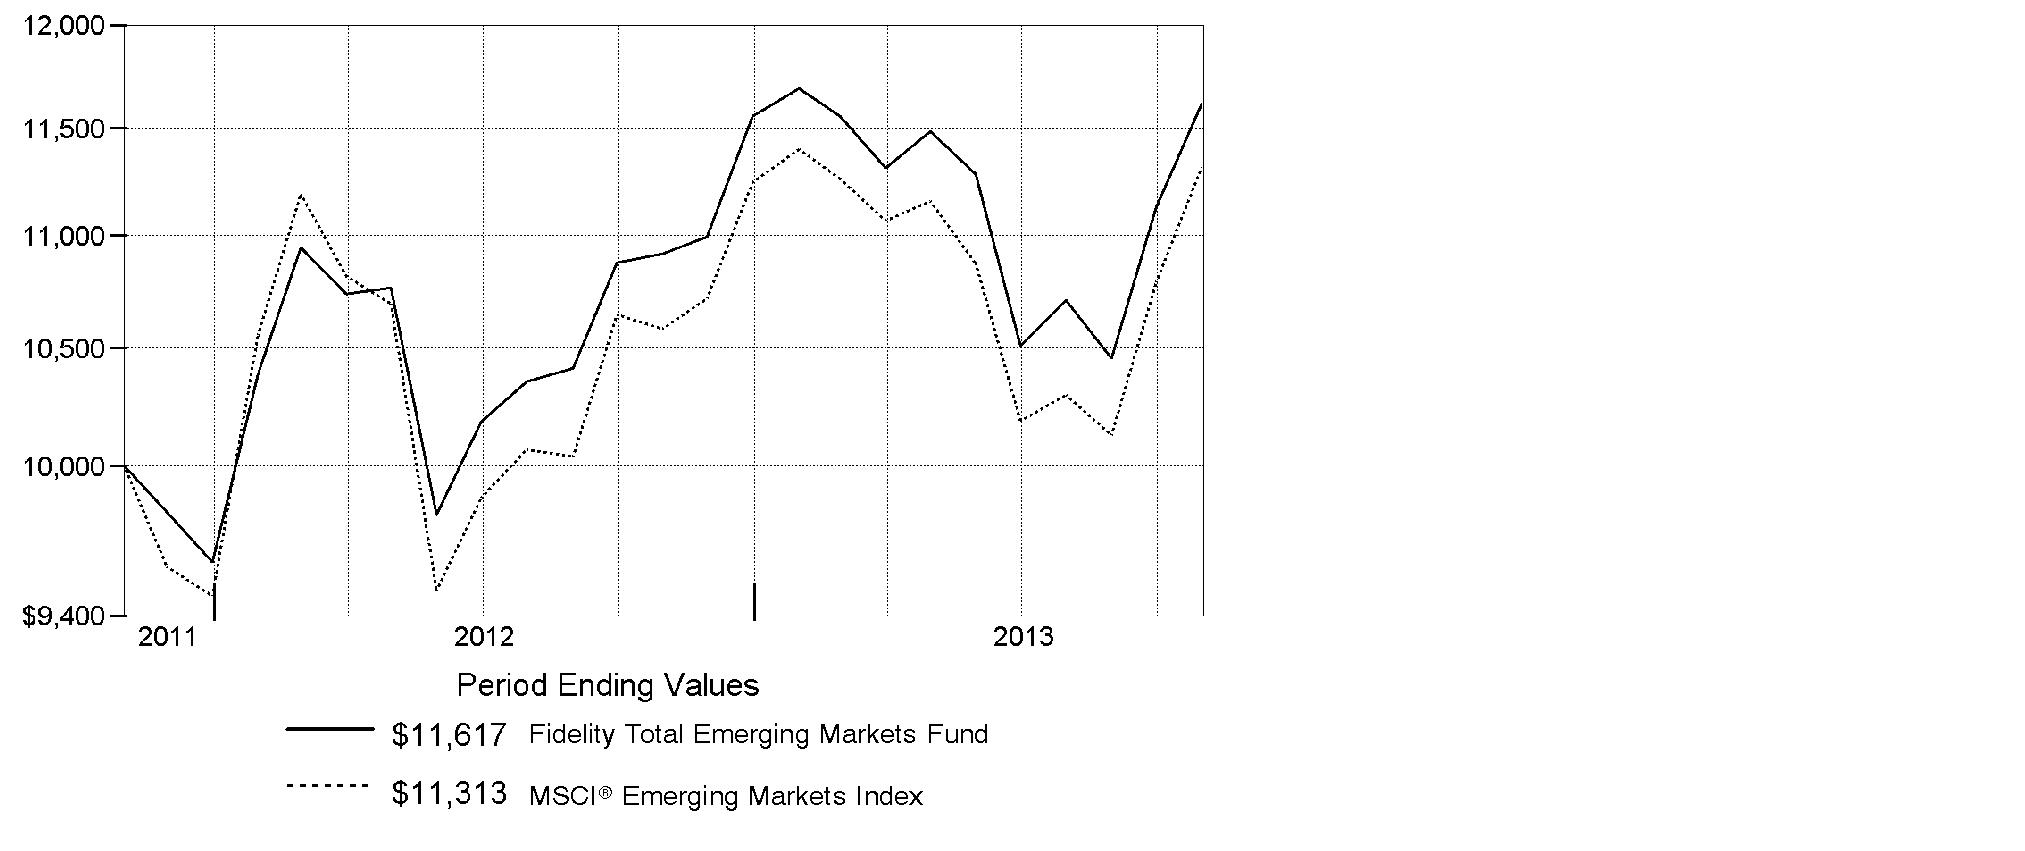
Annual Report
Fidelity Total Emerging Markets Fund
Market Recap: On balance, global equity markets remained upbeat for the 12-month period ending October 31, 2013. The MSCI® ACWI® (All Country World Index) Index gained 23.75% for the period, amid persistent preference for higher-risk assets. The period was not without turbulence, however. In the spring and summer, world central banks, especially in the U.S. and China, made clear their intentions to maintain accommodative monetary policies. That stance, along with modest cyclical improvements around the globe and generally low valuations, underpinned the broad rally in equities. Europe (+32%) shone, with most markets on the Continent notching solid, index-beating gains. Another bright spot, Japan, posted a 34% full-year result, despite a struggling yen and a weak second half. The U.S. - by far the largest index component - also outperformed, up roughly 28%. Meanwhile, Asia-Pacific ex Japan (+14%) lagged, hurt in part by a slowdown in Australia's mining industry as well as currency headwinds. Foreign-exchange and commodity weakness also curbed results in resource-heavy Canada and emerging markets (EM), both of which were up 7%. Country-level EM performance diverged meaningfully for the period, as shown by results in Brazil (-1%), Russia (+12%), India (+1%) and China (+8%). Against a strong tilt toward equities, global bond markets fell flat, with the Barclays® Global Aggregate GDP Weighted Index returning -0.15% for the full period.
Comments from John Carlson, Lead Portfolio Manager of Fidelity® Total Emerging Markets Fund: For the year, the fund's Retail Class shares gained 6.44%. By comparison, the fund's primary benchmark, the MSCI® Emerging Markets Index, returned 6.90%, while the Fidelity Total Emerging Markets Composite IndexSM advanced 3.07%. Versus the Composite index, the biggest boost came from security selection among equities. Here, the top individual contributor was Taiwan's ECLAT Textile, a supplier of performance fabrics that enjoyed pricing power for its products. We also were helped by Mobile TeleSystems, a Russian wireless telecom provider that was lifted by easing competitive conditions and upward revisions to its earnings forecasts. Conversely, the materials sector was the only notable area of weakness. Turning to emerging-markets (EM) debt, an underweighting here was helpful, as were our picks in Venezuela. Detractors included security selection in Russia and Mexico, as our holdings here were primarily long-duration securities that underperformed. It also hurt to largely avoid Argentina, which rallied significantly.
The views expressed above reflect those of the portfolio manager(s) only through the end of the period as stated on the cover of this report and do not necessarily represent the views of Fidelity or any other person in the Fidelity organization. Any such views are subject to change at any time based upon market or other conditions and Fidelity disclaims any responsibility to update such views. These views may not be relied on as investment advice and, because investment decisions for a Fidelity fund are based on numerous factors, may not be relied on as an indication of trading intent on behalf of any Fidelity fund.
Annual Report
Fidelity Total Emerging Markets Fund
Shareholder Expense Example
As a shareholder of the Fund, you incur two types of costs: (1) transaction costs, including sales charges (loads) on purchase payments or redemption proceeds, redemption fees and (2) ongoing costs, including management fees, distribution and/or service (12b-1) fees and other Fund expenses. This Example is intended to help you understand your ongoing costs (in dollars) of investing in the Fund and to compare these costs with the ongoing costs of investing in other mutual funds.
The Example is based on an investment of $1,000 invested at the beginning of the period and held for the entire period (May 1, 2013 to October 31, 2013).
Actual Expenses
The first line of the accompanying table for each class of the Fund provides information about actual account values and actual expenses. You may use the information in this line, together with the amount you invested, to estimate the expenses that you paid over the period. Simply divide your account value by $1,000.00 (for example, an $8,600 account value divided by $1,000.00 = 8.6), then multiply the result by the number in the first line for a class of the Fund under the heading entitled "Expenses Paid During Period" to estimate the expenses you paid on your account during this period. A small balance maintenance fee of $12.00 that is charged once a year may apply for certain accounts with a value of less than $2,000. This fee is not included in the table below. If it was, the estimate of expenses you paid during the period would be higher, and your ending account value lower, by this amount. In addition, the Fund, as a shareholder in the underlying Fidelity Central Funds, will indirectly bear its pro-rata share of the fees and expenses incurred by the underlying Fidelity Central Funds. These fees and expenses are not included in the Fund's annualized expense ratio used to calculate the expense estimate in the table below.
Hypothetical Example for Comparison Purposes
The second line of the accompanying table for each class of the Fund provides information about hypothetical account values and hypothetical expenses based on a Class' actual expense ratio and an assumed rate of return of 5% per year before expenses, which is not the Class' actual return. The hypothetical account values and expenses may not be used to estimate the actual ending account balance or expenses you paid for the period. You may use this information to compare the ongoing costs of investing in the Fund and other funds. To do so, compare this 5% hypothetical example with the 5% hypothetical examples that appear in the shareholder reports of the other funds. A small balance maintenance fee of $12.00 that is charged once a year may apply for certain accounts with a value of less than $2,000. This fee is not included in the table below. If it was, the estimate of expenses you paid during the period would be higher, and your ending account value lower, by this amount. In addition, the Fund, as a shareholder in the underlying Fidelity Central Funds, will indirectly bear its pro-rata share of the fees and expenses incurred by the underlying Fidelity Central Funds. These fees and expenses are not included in the Fund's annualized expense ratio used to calculate the expense estimate in the table below.
Please note that the expenses shown in the table are meant to highlight your ongoing costs only and do not reflect any transaction costs. Therefore, the second line of the table is useful in comparing ongoing costs only, and will not help you determine the relative total costs of owning different funds. In addition, if these transactional costs were included, your costs would have been higher.
Annual Report
| Annualized
Expense RatioB | Beginning
Account Value
May 1, 2013 | Ending
Account Value
October 31, 2013 | Expenses Paid
During Period*
May 1, 2013
to October 31, 2013 |
Class A | 1.65% | | | |
Actual | | $ 1,000.00 | $ 1,010.70 | $ 8.36 |
HypotheticalA | | $ 1,000.00 | $ 1,016.89 | $ 8.39 |
Class T | 1.90% | | | |
Actual | | $ 1,000.00 | $ 1,008.90 | $ 9.62 |
HypotheticalA | | $ 1,000.00 | $ 1,015.63 | $ 9.65 |
Class C | 2.40% | | | |
Actual | | $ 1,000.00 | $ 1,006.20 | $ 12.14 |
HypotheticalA | | $ 1,000.00 | $ 1,013.11 | $ 12.18 |
Total Emerging Markets | 1.40% | | | |
Actual | | $ 1,000.00 | $ 1,011.50 | $ 7.10 |
HypotheticalA | | $ 1,000.00 | $ 1,018.15 | $ 7.12 |
Institutional Class | 1.40% | | | |
Actual | | $ 1,000.00 | $ 1,011.50 | $ 7.10 |
HypotheticalA | | $ 1,000.00 | $ 1,018.15 | $ 7.12 |
A 5% return per year before expenses
B Annualized expense ratio reflects expenses net of applicable fee waivers.
* Expenses are equal to each Class' annualized expense ratio, multiplied by the average account value over the period, multiplied by 184/365 (to reflect the one-half year period).
Annual Report
Fidelity Total Emerging Markets Fund
Investment Changes (Unaudited)
Top Five Stocks as of October 31, 2013 |
| % of fund's
net assets | % of fund's net assets
6 months ago |
Samsung Electronics Co. Ltd. (Korea (South), Semiconductors & Semiconductor Equipment) | 3.6 | 4.0 |
Taiwan Semiconductor Manufacturing Co. Ltd. (Taiwan, Semiconductors & Semiconductor Equipment) | 2.4 | 2.4 |
Tencent Holdings Ltd. (Cayman Islands, Internet Software & Services) | 1.6 | 0.8 |
Sberbank (Savings Bank of the Russian Federation) (Russia, Commercial Banks) | 1.6 | 1.3 |
Industrial & Commercial Bank of China Ltd. (H Shares) (China, Commercial Banks) | 1.4 | 1.1 |
| 10.6 | |
Top Five Market Sectors as of October 31, 2013 |
| % of fund's
net assets | % of fund's net assets
6 months ago |
Financials | 21.9 | 21.9 |
Information Technology | 12.5 | 10.7 |
Energy | 11.4 | 13.0 |
Materials | 7.8 | 8.1 |
Telecommunication Services | 6.7 | 6.2 |
Top Five Countries as of October 31, 2013 |
(excluding cash equivalents) | % of fund's
net assets | % of fund's net assets
6 months ago |
Korea (South) | 14.1 | 10.9 |
Russia | 7.8 | 8.1 |
Brazil | 7.8 | 10.1 |
Cayman Islands | 6.8 | 5.6 |
Taiwan | 5.5 | 5.9 |
Percentages are adjusted for the effect of open futures contracts, if applicable. |
Asset Allocation (% of fund's net assets) |
As of October 31, 2013 | As of April 30, 2013 |
| Stocks and
Equity Futures 76.5% | | | Stocks 75.7% | |
 | Bonds 22.2% | | | Bonds 22.3% | |
| Short-Term
Investments and
Net Other Assets
(Liabilities) 1.3% | | | Short-Term
Investments and
Net Other Assets
(Liabilities) 2.0% | |

Annual Report
Fidelity Total Emerging Markets Fund
Investments October 31, 2013
Showing Percentage of Net Assets
Common Stocks - 72.7% |
| Shares | | Value |
Argentina - 0.1% |
Grupo Financiero Galicia SA sponsored ADR | 13,090 | | $ 126,711 |
Austria - 0.4% |
Erste Group Bank AG | 8,890 | | 313,529 |
Bailiwick of Jersey - 0.3% |
Atrium European Real Estate Ltd. | 45,129 | | 269,973 |
Bermuda - 1.4% |
Aquarius Platinum Ltd. (Australia) (a) | 117,431 | | 77,138 |
BW Offshore Ltd. | 228,373 | | 313,420 |
Cosan Ltd. Class A | 17,863 | | 281,521 |
GP Investments Ltd. Class A (depositary receipt) (a) | 101,622 | | 182,359 |
Shangri-La Asia Ltd. | 110,000 | | 201,470 |
Stolt-Nielsen SA | 7,271 | | 205,804 |
TOTAL BERMUDA | | 1,261,712 |
Brazil - 6.8% |
Anhanguera Educacional Participacoes SA | 34,600 | | 206,964 |
Arezzo Industria e Comercio SA | 9,700 | | 145,054 |
BHG SA (Brazil Hospitality Group) (a) | 13,600 | | 99,563 |
BR Properties SA | 42,820 | | 363,173 |
Companhia de Bebidas das Americas (AmBev) (PN) sponsored ADR | 8,700 | | 323,640 |
Companhia de Saneamento Basico do Estado de Sao Paulo (SABESP) sponsored ADR | 20,630 | | 218,884 |
Companhia Paranaense de Energia-Copel (PN-B) sponsored ADR | 13,665 | | 189,670 |
Estacio Participacoes SA | 24,200 | | 186,885 |
Fibria Celulose SA (a) | 10,000 | | 129,676 |
Gerdau SA sponsored ADR | 44,800 | | 355,264 |
Itau Unibanco Holding SA sponsored ADR | 76,790 | | 1,183,334 |
Petroleo Brasileiro SA - Petrobras: | | | |
(PN) sponsored ADR (non-vtg.) | 11,606 | | 210,765 |
sponsored ADR | 26,526 | | 462,348 |
Smiles SA | 14,300 | | 187,607 |
TIM Participacoes SA sponsored ADR | 3,280 | | 83,378 |
Ultrapar Participacoes SA | 21,700 | | 578,292 |
Vale SA (PN-A) sponsored ADR | 72,200 | | 1,057,008 |
TOTAL BRAZIL | | 5,981,505 |
British Virgin Islands - 0.0% |
Luxoft Holding, Inc. | 1,100 | | 32,142 |
Canada - 0.6% |
First Quantum Minerals Ltd. | 12,500 | | 237,136 |
Common Stocks - continued |
| Shares | | Value |
Canada - continued |
Goldcorp, Inc. | 5,900 | | $ 150,294 |
Pan American Silver Corp. | 9,200 | | 97,612 |
Torex Gold Resources, Inc. (a) | 61,700 | | 68,644 |
TOTAL CANADA | | 553,686 |
Cayman Islands - 6.1% |
21Vianet Group, Inc. ADR (a) | 10,920 | | 196,560 |
58.com, Inc. ADR | 300 | | 7,236 |
Anta Sports Products Ltd. | 149,000 | | 213,708 |
Anton Oilfield Services Group | 356,000 | | 224,997 |
China Liansu Group Holdings Ltd. | 270,000 | | 172,733 |
Cimc Enric Holdings Ltd. | 124,000 | | 174,652 |
Ctrip.com International Ltd. sponsored ADR (a) | 4,400 | | 238,700 |
Eurasia Drilling Co. Ltd. GDR (Reg. S) | 8,934 | | 378,355 |
GCL-Poly Energy Holdings Ltd. (a) | 1,193,000 | | 366,225 |
Greatview Aseptic Pack Co. Ltd. | 398,000 | | 250,515 |
Haitian International Holdings Ltd. | 78,000 | | 187,932 |
Hengan International Group Co. Ltd. | 42,000 | | 514,369 |
Hilong Holding Ltd. | 166,000 | | 110,481 |
Springland International Holdings Ltd. | 300,000 | | 164,452 |
Tencent Holdings Ltd. | 25,800 | | 1,408,301 |
Uni-President China Holdings Ltd. | 272,000 | | 271,895 |
Veripos | 29,165 | | 144,036 |
Xueda Education Group sponsored ADR | 28,100 | | 131,508 |
Yingde Gases Group Co. Ltd. | 188,000 | | 193,020 |
TOTAL CAYMAN ISLANDS | | 5,349,675 |
Chile - 1.2% |
Banco Santander Chile | 5,905,977 | | 362,948 |
Embotelladora Andina SA ADR | 2,300 | | 59,570 |
Empresa Nacional de Electricidad SA | 110,318 | | 168,196 |
Empresa Nacional de Telecomunicaciones SA (ENTEL) | 12,847 | | 197,702 |
Inversiones La Construccion SA | 7,739 | | 116,179 |
Sociedad Quimica y Minera de Chile SA (PN-B) sponsored ADR | 4,200 | | 115,962 |
TOTAL CHILE | | 1,020,557 |
China - 5.3% |
Anhui Conch Cement Co. Ltd. (H Shares) | 73,000 | | 254,695 |
BBMG Corp. (H Shares) | 351,500 | | 252,075 |
China Communications Construction Co. Ltd. (H Shares) | 349,000 | | 284,944 |
China Construction Bank Corp. (H Shares) | 653,000 | | 507,037 |
China Pacific Insurance Group Co. Ltd. (H Shares) | 251,600 | | 908,655 |
Common Stocks - continued |
| Shares | | Value |
China - continued |
China Suntien Green Energy Corp. Ltd. (H Shares) | 247,200 | | $ 86,407 |
China Telecom Corp. Ltd. (H Shares) | 846,157 | | 441,995 |
Industrial & Commercial Bank of China Ltd. (H Shares) | 1,739,000 | | 1,217,950 |
Maanshan Iron & Steel Ltd. (H Shares) (a) | 568,000 | | 145,059 |
PICC Property & Casualty Co. Ltd. (H Shares) | 177,000 | | 271,219 |
Weichai Power Co. Ltd. (H Shares) | 59,400 | | 237,891 |
TOTAL CHINA | | 4,607,927 |
Cyprus - 0.3% |
Globaltrans Investment PLC GDR (Reg. S) | 19,300 | | 293,360 |
Czech Republic - 0.1% |
Ceske Energeticke Zavody A/S | 1,780 | | 51,236 |
Denmark - 0.2% |
Auriga Industries A/S Series B (a) | 5,323 | | 208,821 |
France - 0.2% |
Technip SA | 1,888 | | 197,769 |
Hong Kong - 1.3% |
AIA Group Ltd. | 32,100 | | 162,922 |
CNOOC Ltd. | 24,000 | | 48,815 |
CNOOC Ltd. sponsored ADR | 700 | | 141,617 |
Far East Horizon Ltd. | 343,000 | | 250,846 |
Lenovo Group Ltd. | 418,000 | | 447,491 |
Sinotruk Hong Kong Ltd. | 233,500 | | 122,277 |
TOTAL HONG KONG | | 1,173,968 |
India - 5.3% |
Axis Bank Ltd. | 31,183 | | 618,711 |
Bajaj Auto Ltd. | 6,012 | | 207,792 |
Bharti Airtel Ltd. | 42,507 | | 253,218 |
Bharti Infratel Ltd. | 81,097 | | 216,942 |
Eicher Motors Ltd. | 3,283 | | 210,853 |
Grasim Industries Ltd. | 4,724 | | 222,055 |
Indiabulls Real Estate Ltd. | 167,722 | | 170,514 |
ITC Ltd. | 106,950 | | 581,401 |
JK Cement Ltd. | 21,830 | | 68,493 |
Larsen & Toubro Ltd. | 19,537 | | 308,698 |
Lupin Ltd. | 14,534 | | 215,798 |
Maruti Suzuki India Ltd. | 11,768 | | 312,456 |
Mundra Port and SEZ Ltd. | 107,251 | | 253,230 |
NHPC Ltd. | 481,849 | | 141,527 |
NTPC Ltd. | 107,028 | | 258,956 |
Petronet LNG Ltd. | 78,017 | | 157,303 |
Common Stocks - continued |
| Shares | | Value |
India - continued |
Phoenix Mills Ltd. (a) | 34,705 | | $ 131,895 |
SREI Infrastructure Finance Ltd. | 435,998 | | 144,687 |
Ultratech Cemco Ltd. | 5,561 | | 177,490 |
TOTAL INDIA | | 4,652,019 |
Indonesia - 1.3% |
PT AKR Corporindo Tbk | 247,500 | | 106,486 |
PT Bakrieland Development Tbk (a) | 21,996,000 | | 97,564 |
PT Bank Rakyat Indonesia Tbk | 398,000 | | 278,925 |
PT Bank Tabungan Negara Tbk | 1,280,200 | | 110,161 |
PT Kalbe Farma Tbk | 1,665,500 | | 192,073 |
PT Telkomunikasi Indonesia Tbk sponsored ADR | 7,626 | | 310,836 |
TOTAL INDONESIA | | 1,096,045 |
Isle of Man - 0.0% |
IBS Group Holding Ltd. GDR (Reg. S) | 1,300 | | 35,116 |
Israel - 0.2% |
NICE Systems Ltd. sponsored ADR | 4,500 | | 176,310 |
Kenya - 0.3% |
Equity Bank Ltd. | 576,900 | | 239,953 |
Korea (South) - 13.2% |
AMOREPACIFIC Group, Inc. | 727 | | 256,541 |
Daewoo International Corp. | 17,225 | | 635,420 |
Daou Technology, Inc. | 11,720 | | 160,679 |
E-Mart Co. Ltd. | 2,632 | | 629,926 |
Hana Financial Group, Inc. | 26,070 | | 1,004,695 |
Hankook Shell Oil Co. Ltd. | 265 | | 131,341 |
Hyundai Industrial Development & Construction Co. | 11,590 | | 257,730 |
Hyundai Mobis | 1,115 | | 314,660 |
KB Financial Group, Inc. | 25,480 | | 1,002,989 |
Korea Electric Power Corp. (a) | 9,825 | | 262,255 |
Korea Plant Service & Engineering Co. Ltd. | 370 | | 18,757 |
Korean Reinsurance Co. | 27,060 | | 303,420 |
KT&G Corp. | 3,666 | | 267,710 |
LG Chemical Ltd. | 1,313 | | 370,537 |
LG Corp. | 5,031 | | 297,229 |
Lotte Chemical Corp. | 822 | | 168,462 |
NHN Corp. | 1,129 | | 635,094 |
Oci Co. Ltd. | 1,507 | | 272,637 |
POSCO sponsored ADR | 5,000 | | 372,300 |
Samsung Electronics Co. Ltd. | 2,306 | | 3,183,223 |
Samsung Life Insurance Co. Ltd. | 4,099 | | 403,612 |
Common Stocks - continued |
| Shares | | Value |
Korea (South) - continued |
SK Hynix, Inc. (a) | 8,360 | | $ 251,679 |
SK Telecom Co. Ltd. | 1,502 | | 327,153 |
TOTAL KOREA (SOUTH) | | 11,528,049 |
Luxembourg - 0.3% |
Subsea 7 SA | 12,335 | | 260,871 |
Malaysia - 0.3% |
Petronas Dagangan Bhd | 22,500 | | 218,121 |
Tenaga Nasional Bhd | 10,950 | | 32,713 |
TOTAL MALAYSIA | | 250,834 |
Mexico - 4.0% |
Alpek SA de CV | 42,600 | | 92,434 |
America Movil S.A.B. de CV Series L sponsored ADR | 35,713 | | 764,615 |
CEMEX SA de CV sponsored ADR | 26,435 | | 279,682 |
El Puerto de Liverpool S.A.B. de CV Class C | 20,300 | | 219,240 |
Fomento Economico Mexicano S.A.B. de CV sponsored ADR | 5,450 | | 508,485 |
Gruma S.A.B. de CV Series B (a) | 49,500 | | 339,251 |
Grupo Comercial Chedraui S.A.B. de CV | 70,900 | | 221,711 |
Grupo Financiero Banorte S.A.B. de CV Series O | 65,600 | | 418,722 |
Grupo Televisa SA de CV (CPO) sponsored ADR | 21,000 | | 639,240 |
TOTAL MEXICO | | 3,483,380 |
Netherlands - 0.3% |
Fugro NV (Certificaten Van Aandelen) | 4,347 | | 272,000 |
Nigeria - 1.3% |
Guaranty Trust Bank PLC GDR (Reg. S) | 53,750 | | 419,250 |
Zenith Bank PLC | 5,102,305 | | 692,088 |
TOTAL NIGERIA | | 1,111,338 |
Norway - 0.9% |
ElectroMagnetic GeoServices ASA (a) | 77,389 | | 89,374 |
Spectrum ASA | 12,824 | | 74,320 |
TGS Nopec Geophysical Co. ASA | 21,811 | | 600,136 |
TOTAL NORWAY | | 763,830 |
Panama - 0.3% |
Copa Holdings SA Class A | 2,060 | | 308,052 |
Philippines - 1.1% |
Alliance Global Group, Inc. | 344,300 | | 209,934 |
Common Stocks - continued |
| Shares | | Value |
Philippines - continued |
Metropolitan Bank & Trust Co. | 137,074 | | $ 282,300 |
Robinsons Land Corp. | 915,700 | | 480,999 |
TOTAL PHILIPPINES | | 973,233 |
Poland - 0.4% |
Powszechny Zaklad Ubezpieczen SA | 1,874 | | 285,205 |
Telekomunikacja Polska SA | 24,900 | | 80,673 |
TOTAL POLAND | | 365,878 |
Portugal - 0.4% |
BPI-SGPS SA (a) | 56,385 | | 89,571 |
Jeronimo Martins SGPS SA | 11,900 | | 219,900 |
TOTAL PORTUGAL | | 309,471 |
Russia - 5.3% |
DIXY Group OJSC (a) | 6,505 | | 85,739 |
E.ON Russia JSC | 6,198,200 | | 481,233 |
Gazprom OAO sponsored ADR | 51,032 | | 476,129 |
LUKOIL Oil Co. | 1,100 | | 72,165 |
Magnit OJSC | 1,776 | | 477,914 |
Mobile TeleSystems OJSC | 83,280 | | 876,666 |
Norilsk Nickel OJSC ADR | 15,400 | | 233,156 |
RusHydro JSC sponsored ADR | 25,070 | | 42,218 |
Sberbank (Savings Bank of the Russian Federation) | 433,550 | | 1,389,707 |
Sistema JSFC | 277,400 | | 309,068 |
VTB Bank OJSC sponsored GDR (Reg. S) | 84,600 | | 235,103 |
TOTAL RUSSIA | | 4,679,098 |
Singapore - 1.1% |
Ezion Holdings Ltd. | 263,000 | | 474,255 |
First Resources Ltd. | 160,000 | | 251,167 |
Super Group Ltd. Singapore | 60,000 | | 203,349 |
TOTAL SINGAPORE | | 928,771 |
South Africa - 3.8% |
Aspen Pharmacare Holdings Ltd. | 14,400 | | 400,883 |
Barclays Africa Group Ltd. | 17,591 | | 271,590 |
Blue Label Telecoms Ltd. | 54,600 | | 51,343 |
Impala Platinum Holdings Ltd. | 18,500 | | 224,829 |
JSE Ltd. | 17,210 | | 150,521 |
Life Healthcare Group Holdings Ltd. | 66,300 | | 270,781 |
MTN Group Ltd. | 32,350 | | 643,020 |
Naspers Ltd. Class N | 10,800 | | 1,010,205 |
Common Stocks - continued |
| Shares | | Value |
South Africa - continued |
Reunert Ltd. | 20,200 | | $ 141,860 |
Wilson Bayly Holmes-Ovcon Ltd. | 7,900 | | 138,495 |
TOTAL SOUTH AFRICA | | 3,303,527 |
Sri Lanka - 0.2% |
Dialog Axiata PLC | 2,387,100 | | 165,948 |
Taiwan - 5.5% |
Chipbond Technology Corp. | 74,000 | | 149,332 |
Chroma ATE, Inc. | 43,000 | | 91,449 |
Cleanaway Co. Ltd. | 23,000 | | 143,774 |
E.SUN Financial Holdings Co. Ltd. | 411,700 | | 274,840 |
ECLAT Textile Co. Ltd. | 26,660 | | 293,002 |
Hon Hai Precision Industry Co. Ltd. (Foxconn) | 28,950 | | 73,272 |
King Slide Works Co. Ltd. | 6,000 | | 52,998 |
MediaTek, Inc. | 41,000 | | 559,946 |
Taiwan Fertilizer Co. Ltd. | 156,300 | | 371,700 |
Taiwan Semiconductor Manufacturing Co. Ltd. | 381,000 | | 1,401,553 |
Taiwan Semiconductor Manufacturing Co. Ltd. sponsored ADR | 36,242 | | 667,215 |
Tong Hsing Electronics Industries Ltd. | 26,000 | | 137,354 |
Unified-President Enterprises Corp. | 135,739 | | 258,243 |
Universal Cement Corp. | 79,000 | | 72,465 |
Yuanta Financial Holding Co. Ltd. | 443,500 | | 241,074 |
TOTAL TAIWAN | | 4,788,217 |
Thailand - 0.5% |
Bangkok Bank PCL (For. Reg.) | 61,700 | | 408,360 |
Togo - 0.2% |
Ecobank Transnational, Inc. | 2,409,565 | | 210,609 |
Turkey - 0.9% |
Aygaz A/S | 24,074 | | 110,225 |
Tupras Turkiye Petrol Rafinelleri A/S | 15,400 | | 349,465 |
Turkiye Halk Bankasi A/S | 36,800 | | 297,718 |
TOTAL TURKEY | | 757,408 |
United Kingdom - 0.4% |
John Wood Group PLC | 19,934 | | 259,533 |
Mondi PLC | 6,900 | | 123,247 |
TOTAL UNITED KINGDOM | | 382,780 |
United States of America - 0.9% |
Cognizant Technology Solutions Corp. Class A (a) | 2,400 | | 208,632 |
InvenSense, Inc. (a) | 13,111 | | 221,445 |
Common Stocks - continued |
| Shares | | Value |
United States of America - continued |
Sohu.com, Inc. (a) | 3,700 | | $ 247,752 |
Universal Display Corp. (a) | 2,247 | | 71,679 |
TOTAL UNITED STATES OF AMERICA | | 749,508 |
TOTAL COMMON STOCKS (Cost $54,256,585) |
63,643,176
|
Nonconvertible Preferred Stocks - 3.4% |
| | | |
Brazil - 1.0% |
Alpargatas Sa (PN) | 28,500 | | 197,192 |
Banco do Estado Rio Grande do Sul SA | 25,700 | | 185,276 |
Braskem SA (PN-A) | 20,300 | | 180,146 |
Companhia Paranaense de Energia-Copel (PN-B) | 715 | | 9,971 |
Lojas Americanas SA (PN) | 38,333 | | 283,707 |
TOTAL BRAZIL | | 856,292 |
Chile - 0.2% |
Embotelladora Andina SA Class A | 47,759 | | 202,317 |
Korea (South) - 0.9% |
Hyundai Motor Co. Series 2 | 3,701 | | 418,476 |
Samsung Electronics Co. Ltd. | 374 | | 360,862 |
TOTAL KOREA (SOUTH) | | 779,338 |
Russia - 1.3% |
Sberbank (Savings Bank of the Russian Federation) | 292,600 | | 755,706 |
Surgutneftegas | 476,850 | | 354,618 |
TOTAL RUSSIA | | 1,110,324 |
TOTAL NONCONVERTIBLE PREFERRED STOCKS (Cost $2,357,183) |
2,948,271
|
Nonconvertible Bonds - 7.4% |
| Principal
Amount (c) | | |
Bailiwick of Jersey - 0.2% |
Polyus Gold International Ltd. 5.625% 4/29/20 (e) | | $ 200,000 | | 199,500 |
Canada - 0.5% |
Pacific Rubiales Energy Corp. 7.25% 12/12/21 (e) | | 400,000 | | 441,000 |
Cayman Islands - 0.6% |
Odebrecht Finance Ltd. 7.5% (e)(f) | | 475,000 | | 475,000 |
Nonconvertible Bonds - continued |
| Principal
Amount (c) | | Value |
Costa Rica - 0.2% |
Instituto Costarricense de Electricidad 6.95% 11/10/21 (e) | | $ 200,000 | | $ 211,000 |
Georgia - 0.4% |
Georgia Bank Joint Stock Co. 7.75% 7/5/17 (e) | | 300,000 | | 319,500 |
Indonesia - 0.2% |
PT Pertamina Persero 5.625% 5/20/43 (e) | | 200,000 | | 168,500 |
Israel - 0.3% |
Israel Electric Corp. Ltd. 6.7% 2/10/17 (e) | | 250,000 | | 270,625 |
Kazakhstan - 1.0% |
KazMunaiGaz Finance Sub BV 7% 5/5/20 (e) | | 150,000 | | 171,570 |
KazMunaiGaz National Co. 5.75% 4/30/43 (e) | | 300,000 | | 272,220 |
Zhaikmunai International BV 7.125% 11/13/19 (e) | | 400,000 | | 424,000 |
TOTAL KAZAKHSTAN | | 867,790 |
Luxembourg - 0.7% |
Millicom International Cellular SA 4.75% 5/22/20 (e) | | 200,000 | | 188,000 |
RSHB Capital SA: | | | | |
5.1% 7/25/18 (e) | | 200,000 | | 204,240 |
5.298% 12/27/17 (e) | | 200,000 | | 207,500 |
TOTAL LUXEMBOURG | | 599,740 |
Mexico - 1.2% |
America Movil S.A.B. de CV 6.45% 12/5/22 | MXN | 9,750,000 | | 701,251 |
Petroleos Mexicanos 6.625% (e)(f) | | 300,000 | | 309,000 |
TOTAL MEXICO | | 1,010,251 |
Netherlands - 0.3% |
Indosat Palapa Co. BV 7.375% 7/29/20 (e) | | 100,000 | | 107,625 |
Mozambique Ematum Finance 2020 6.305% 9/11/20 (Reg. S) | | 200,000 | | 188,500 |
TOTAL NETHERLANDS | | 296,125 |
Paraguay - 0.2% |
Telefonica Celular del Paraguay SA 6.75% 12/13/22 (e) | | 200,000 | | 203,000 |
Trinidad & Tobago - 0.2% |
Petroleum Co. of Trinidad & Tobago Ltd. 9.75% 8/14/19 (e) | | 150,000 | | 190,875 |
Turkey - 0.2% |
Arcelik A/S 5% 4/3/23 (e) | | 200,000 | | 180,000 |
Nonconvertible Bonds - continued |
| Principal
Amount (c) | | Value |
Venezuela - 1.2% |
Petroleos de Venezuela SA 8.5% 11/2/17 (e) | | $ 1,200,000 | | $ 1,077,000 |
TOTAL NONCONVERTIBLE BONDS (Cost $6,679,240) |
6,509,906
|
Government Obligations - 14.9% |
|
Armenia - 0.2% |
Republic of Armenia 6% 9/30/20 (e) | | 200,000 | | 196,750 |
Aruba - 0.4% |
Aruba Government 4.625% 9/14/23 (e) | | 400,000 | | 376,000 |
Azerbaijan - 0.4% |
State Oil Co. of Azerbaijan Republic 5.45% 2/9/17 (Reg. S) | | 300,000 | | 321,000 |
Bahrain - 0.2% |
Bahrain Kingdom 6.125% 8/1/23 (e) | | 200,000 | | 207,000 |
Barbados - 0.1% |
Barbados Government 7% 8/4/22 (e) | | 100,000 | | 95,000 |
Belarus - 0.5% |
Belarus Republic: | | | | |
8.75% 8/3/15 (Reg. S) | | 325,000 | | 325,813 |
8.95% 1/26/18 | | 100,000 | | 99,250 |
TOTAL BELARUS | | 425,063 |
Belize - 0.2% |
Belize Government 5% 2/20/38 (d)(e) | | 332,500 | | 204,488 |
Bermuda - 0.1% |
Bermuda Government 5.603% 7/20/20 (e) | | 100,000 | | 106,625 |
Bolivia - 0.2% |
Plurinational State of Bolivia 4.875% 10/29/22 (e) | | 200,000 | | 195,000 |
Cayman Islands - 0.1% |
Cayman Island Government 5.95% 11/24/19 (e) | | 100,000 | | 112,000 |
Congo - 0.3% |
Congo Republic 3.5% 6/30/29 (d) | | 325,883 | | 286,777 |
Dominican Republic - 0.2% |
Dominican Republic 5.875% 4/18/24 (e) | | 150,000 | | 146,250 |
Ecuador - 0.5% |
Ecuador Republic 9.375% 12/15/15 (e) | | 386,000 | | 409,160 |
Government Obligations - continued |
| Principal
Amount (c) | | Value |
El Salvador - 0.2% |
El Salvador Republic 7.625% 2/1/41 (e) | | $ 150,000 | | $ 156,375 |
Guatemala - 0.2% |
Guatemalan Republic 4.875% 2/13/28 (e) | | 200,000 | | 188,000 |
Honduras - 0.2% |
Republic of Honduras 7.5% 3/15/24 (e) | | 200,000 | | 176,000 |
Hungary - 1.2% |
Hungarian Republic: | | | | |
4.75% 2/3/15 | | 140,000 | | 144,200 |
6.375% 3/29/21 | | 508,000 | | 551,815 |
7.625% 3/29/41 | | 350,000 | | 394,188 |
TOTAL HUNGARY | | 1,090,203 |
Iraq - 0.2% |
Republic of Iraq 5.8% 1/15/28 (Reg. S) | | 250,000 | | 216,875 |
Ivory Coast - 0.3% |
Ivory Coast 7.1% 12/31/32 (d) | | 275,000 | | 248,188 |
Jamaica - 0.2% |
Jamaican Government 8% 6/24/19 | | 150,000 | | 146,625 |
Jordan - 0.3% |
Jordanian Kingdom 3.875% 11/12/15 | | 300,000 | | 300,375 |
Lebanon - 0.6% |
Lebanese Republic: | | | | |
6.1% 10/4/22 | | 200,000 | | 195,000 |
11.625% 5/11/16 (Reg. S) | | 250,000 | | 288,750 |
TOTAL LEBANON | | 483,750 |
Mongolia - 0.2% |
Mongolian People's Republic 5.125% 12/5/22 (Reg. S) | | 200,000 | | 176,600 |
Morocco - 0.4% |
Moroccan Kingdom: | | | | |
4.25% 12/11/22 (e) | | 200,000 | | 188,500 |
5.5% 12/11/42 (e) | | 200,000 | | 175,000 |
TOTAL MOROCCO | | 363,500 |
Namibia - 0.2% |
Republic of Namibia 5.5% 11/3/21 (e) | | 200,000 | | 210,500 |
Netherlands - 0.3% |
Republic of Angola 7% 8/16/19 (Issued by Northern Lights III BV for Republic of Angola) (Reg. S) | | 250,000 | | 270,625 |
Government Obligations - continued |
| Principal
Amount (c) | | Value |
Nigeria - 0.4% |
Republic of Nigeria 6.75% 1/28/21 (e) | | $ 350,000 | | $ 383,250 |
Panama - 0.2% |
Panamanian Republic 4.3% 4/29/53 | | 200,000 | | 163,200 |
Peru - 0.5% |
Peruvian Republic: | | | | |
7.35% 7/21/25 | | 100,000 | | 128,250 |
8.75% 11/21/33 | | 200,000 | | 291,500 |
TOTAL PERU | | 419,750 |
Philippines - 0.5% |
Philippine Republic 10.625% 3/16/25 | | 300,000 | | 474,000 |
Romania - 0.3% |
Romanian Republic 6.75% 2/7/22 (e) | | 190,000 | | 219,450 |
Russia - 1.2% |
Russian Federation: | | | | |
5.625% 4/4/42 (e) | | 350,000 | | 364,000 |
7.5% 3/31/30 (Reg. S) | | 250,250 | | 297,798 |
12.75% 6/24/28 (Reg. S) | | 225,000 | | 391,500 |
TOTAL RUSSIA | | 1,053,298 |
Senegal - 0.3% |
Republic of Senegal 8.75% 5/13/21 (e) | | 200,000 | | 219,500 |
Slovenia - 0.5% |
Republic of Slovenia: | | | | |
4.75% 5/10/18 (e) | | 200,000 | | 197,500 |
5.85% 5/10/23 (e) | | 200,000 | | 195,000 |
TOTAL SLOVENIA | | 392,500 |
Sri Lanka - 0.4% |
Democratic Socialist Republic of Sri Lanka 6.25% 10/4/20 (e) | | 300,000 | | 304,500 |
Tanzania - 0.2% |
Tanzania United Republic of 6.3921% 3/8/20 (h) | | 200,000 | | 209,250 |
Turkey - 0.3% |
Turkish Republic 11.875% 1/15/30 | | 165,000 | | 270,188 |
Ukraine - 0.7% |
Ukraine Government: | | | | |
7.5% 4/17/23 (Reg. S) | | 200,000 | | 175,000 |
Government Obligations - continued |
| Principal
Amount (c) | | Value |
Ukraine - continued |
Ukraine Government: - continued | | | | |
7.75% 9/23/20 (e) | | $ 225,000 | | $ 205,583 |
9.25% 7/24/17 (e) | | 200,000 | | 193,500 |
TOTAL UKRAINE | | 574,083 |
United States of America - 0.1% |
U.S. Treasury Bills, yield at date of purchase 0.02% 11/29/13 to 1/2/14 (g) | | 50,000 | | 49,998 |
Venezuela - 0.9% |
Venezuelan Republic 8.5% 10/8/14 | | 815,000 | | 806,035 |
Vietnam - 0.3% |
Vietnamese Socialist Republic 6.75% 1/29/20 (e) | | 200,000 | | 218,750 |
Zambia - 0.2% |
Republic of Zambia 5.375% 9/20/22 (e) | | 200,000 | | 180,500 |
TOTAL GOVERNMENT OBLIGATIONS (Cost $13,106,317) |
13,046,981
|
Money Market Funds - 1.4% |
| Shares | | |
Fidelity Cash Central Fund, 0.09% (b)
(Cost $1,249,619) | 1,249,619 | |
1,249,619
|
TOTAL INVESTMENT PORTFOLIO - 99.8% (Cost $77,648,944) | | 87,397,953 |
NET OTHER ASSETS (LIABILITIES) - 0.2% | | 155,686 |
NET ASSETS - 100% | $ 87,553,639 |
Futures Contracts |
| Expiration
Date | | Underlying
Face Amount
at Value | | Unrealized
Appreciation/
(Depreciation) |
Purchased |
Equity Index Contracts |
6 NYSE E-mini MSCI Emerging Markets Index Contracts (United States) | Dec. 2013 | | $ 307,170 | | $ (9,007) |
|
The face value of futures purchased as a percentage of net assets is 0.4% |
Currency Abbreviations |
MXN | - | Mexican peso |
Legend |
(a) Non-income producing |
(b) Affiliated fund that is generally available only to investment companies and other accounts managed by Fidelity Investments. The rate quoted is the annualized seven-day yield of the fund at period end. A complete unaudited listing of the fund's holdings as of its most recent quarter end is available upon request. In addition, each Fidelity Central Fund's financial statements, which are not covered by the Fund's Report of Independent Registered Public Accounting Firm, are available on the SEC's website or upon request. |
(c) Amount is stated in United States dollars unless otherwise noted. |
(d) Security initially issued at one coupon which converts to a higher coupon at a specified date. The rate shown is the rate at period end. |
(e) Security exempt from registration under Rule 144A of the Securities Act of 1933. These securities may be resold in transactions exempt from registration, normally to qualified institutional buyers. At the end of the period, the value of these securities amounted to $11,444,336 or 13.1% of net assets. |
(f) Security is perpetual in nature with no stated maturity date. |
(g) Security or a portion of the security was pledged to cover margin requirements for futures contracts. At period end, the value of securities pledged amounted to $49,998. |
(h) Coupon rates for floating and adjustable rate securities reflect the rates in effect at period end. |
Affiliated Central Funds |
Information regarding fiscal year to date income earned by the Fund from investments in Fidelity Central Funds is as follows: |
Fund | Income earned |
Fidelity Cash Central Fund | $ 3,903 |
Fidelity Securities Lending Cash Central Fund | 20 |
Total | $ 3,923 |
Other Information |
Categorizations in the Schedule of Investments are based on country or territory of incorporation. |
The following is a summary of the inputs used, as of October 31, 2013, involving the Fund's assets and liabilities carried at fair value. The inputs or methodology used for valuing securities may not be an indication of the risk associated with investing in those securities. For more information on valuation inputs, and their aggregation into the levels used in the table below, please refer to the Investment Valuation section in the accompanying Notes to Financial Statements. |
Valuation Inputs at Reporting Date: |
Description | Total | Level 1 | Level 2 | Level 3 |
Investments in Securities: | | | | |
Equities: | | | | |
Consumer Discretionary | $ 5,671,881 | $ 5,671,881 | $ - | $ - |
Consumer Staples | 5,673,128 | 5,673,128 | - | - |
Energy | 6,824,418 | 6,775,603 | 48,815 | - |
Financials | 17,832,600 | 16,829,611 | 1,002,989 | - |
Health Care | 1,079,535 | 863,737 | 215,798 | - |
Industrials | 4,958,488 | 4,958,488 | - | - |
Information Technology | 11,090,547 | 9,688,994 | 1,401,553 | - |
Materials | 6,822,552 | 6,600,497 | 222,055 | - |
Telecommunication Services | 4,671,214 | 3,902,066 | 769,148 | - |
Utilities | 1,967,084 | 1,704,829 | 262,255 | - |
Corporate Bonds | 6,509,906 | - | 6,509,906 | - |
Government Obligations | 13,046,981 | - | 13,046,981 | - |
Money Market Funds | 1,249,619 | 1,249,619 | - | - |
Total Investments in Securities: | $ 87,397,953 | $ 63,918,453 | $ 23,479,500 | $ - |
Derivative Instruments: | | | | |
Liabilities | | | | |
Futures Contracts | $ (9,007) | $ (9,007) | $ - | $ - |
Value of Derivative Instruments |
The following table is a summary of the Fund's value of derivative instruments by primary risk exposure as of October 31, 2013. For additional information on derivative instruments, please refer to the Derivative Instruments section in the accompanying Notes to Financial Statements. |
Primary Risk Exposure /
Derivative Type | Value |
| Asset | Liability |
Equity Risk | | |
Futures Contracts (a) | $ - | $ (9,007) |
(a) Reflects gross cumulative appreciation (depreciation) on futures contracts as presented in the Schedule of Investments. Only the period end receivable or payable for daily variation margin and net unrealized appreciation (depreciation) are presented in the Statement of Assets and Liabilities. |
Other Information |
The composition of credit quality ratings as a percentage of net assets is as follows (Unaudited): |
AAA,AA,A | 1.0% |
BBB | 6.9% |
BB | 5.5% |
B | 6.0% |
CCC,CC,C | 1.6% |
Not Rated | 1.2% |
Equities | 76.5% |
Short-Term Investments and Net Other Assets | 1.3% |
| 100.0% |
We have used ratings from Moody's Investors Service, Inc. Where Moody's® ratings are not available, we have used S&P® ratings. All ratings are as of the date indicated and do not reflect subsequent changes. Percentages are adjusted for the effect of futures contracts, if applicable. |
See accompanying notes which are an integral part of the financial statements.
Annual Report
Fidelity Total Emerging Markets Fund
Statement of Assets and Liabilities
| October 31, 2013 |
| | |
Assets | | |
Investment in securities, at value - See accompanying schedule: Unaffiliated issuers (cost $76,399,325) | $ 86,148,334 | |
Fidelity Central Funds (cost $1,249,619) | 1,249,619 | |
Total Investments (cost $77,648,944) | | $ 87,397,953 |
Cash | | 42,610 |
Foreign currency held at value (cost $91,066) | | 91,061 |
Receivable for investments sold | | 722,628 |
Receivable for fund shares sold | | 317,152 |
Dividends receivable | | 68,199 |
Interest receivable | | 355,898 |
Distributions receivable from Fidelity Central Funds | | 106 |
Prepaid expenses | | 239 |
Receivable from investment adviser for expense reductions | | 50,718 |
Other receivables | | 6,124 |
Total assets | | 89,052,688 |
| | |
Liabilities | | |
Payable for investments purchased | $ 933,179 | |
Payable for fund shares redeemed | 270,336 | |
Accrued management fee | 57,802 | |
Distribution and service plan fees payable | 12,355 | |
Payable for daily variation margin for derivative instruments | 3,420 | |
Other affiliated payables | 18,570 | |
Custodian fee payable | 140,291 | |
Other payables and accrued expenses | 63,096 | |
Total liabilities | | 1,499,049 |
| | |
Net Assets | | $ 87,553,639 |
Net Assets consist of: | | |
Paid in capital | | $ 80,118,542 |
Undistributed net investment income | | 1,219,736 |
Accumulated undistributed net realized gain (loss) on investments and foreign currency transactions | | (3,516,388) |
Net unrealized appreciation (depreciation) on investments and assets and liabilities in foreign currencies | | 9,731,749 |
Net Assets | | $ 87,553,639 |
See accompanying notes which are an integral part of the financial statements.
Annual Report
Fidelity Total Emerging Markets Fund
Financial Statements - continued
Statement of Assets and Liabilities - continued
| October 31, 2013 |
| | |
Calculation of Maximum Offering Price Class A:
Net Asset Value and redemption price per share ($18,837,427 ÷ 1,657,238 shares) | | $ 11.37 |
| | |
Maximum offering price per share (100/94.25 of $11.37) | | $ 12.06 |
Class T:
Net Asset Value and redemption price per share ($5,967,419 ÷ 526,353 shares) | | $ 11.34 |
| | |
Maximum offering price per share (100/96.50 of $11.34) | | $ 11.75 |
Class C:
Net Asset Value and offering price per share ($7,435,717 ÷ 658,492 shares)A | | $ 11.29 |
| | |
Total Emerging Markets:
Net Asset Value, offering price and redemption price per share ($49,959,436 ÷ 4,383,198 shares) | | $ 11.40 |
| | |
Institutional Class:
Net Asset Value, offering price and redemption price per share ($5,353,640 ÷ 469,800 shares) | | $ 11.40 |
A Redemption price per share is equal to net asset value less any applicable contingent deferred sales charge.
See accompanying notes which are an integral part of the financial statements.
Annual Report
Statement of Operations
| Year ended October 31, 2013 |
| | |
Investment Income | | |
Dividends | | $ 2,210,247 |
Interest | | 1,561,521 |
Income from Fidelity Central Funds | | 3,923 |
Income before foreign taxes withheld | | 3,775,691 |
Less foreign taxes withheld | | (240,765) |
Total income | | 3,534,926 |
| | |
Expenses | | |
Management fee | $ 884,762 | |
Transfer agent fees | 222,603 | |
Distribution and service plan fees | 128,889 | |
Accounting and security lending fees | 56,973 | |
Custodian fees and expenses | 410,719 | |
Independent trustees' compensation | 654 | |
Registration fees | 70,912 | |
Audit | 81,699 | |
Legal | 281 | |
Interest | 253 | |
Miscellaneous | 998 | |
Total expenses before reductions | 1,858,743 | |
Expense reductions | (223,996) | 1,634,747 |
Net investment income (loss) | | 1,900,179 |
Realized and Unrealized Gain (Loss) Net realized gain (loss) on: | | |
Investment securities: | | |
Unaffiliated issuers (net of foreign taxes of $30,003) | (1,717,551) | |
Investment not meeting investment restrictions | 922 | |
Foreign currency transactions | (84,114) | |
Futures contracts | (77,497) | |
Total net realized gain (loss) | | (1,878,240) |
Change in net unrealized appreciation (depreciation) on: Investment securities (net of decrease in deferred foreign taxes of $54,244) | 1,880,839 | |
Assets and liabilities in foreign currencies | 415 | |
Futures contracts | (9,007) | |
Total change in net unrealized appreciation (depreciation) | | 1,872,247 |
Net gain (loss) | | (5,993) |
Net increase (decrease) in net assets resulting from operations | | $ 1,894,186 |
See accompanying notes which are an integral part of the financial statements.
Annual Report
Fidelity Total Emerging Markets Fund
Financial Statements - continued
Statement of Changes in Net Assets
| Year ended
October 31,
2013 | For the period
November 1, 2011
(commencement of
operations) to
October 31, 2012 |
Increase (Decrease) in Net Assets | | |
Operations | | |
Net investment income (loss) | $ 1,900,179 | $ 1,612,877 |
Net realized gain (loss) | (1,878,240) | (1,586,062) |
Change in net unrealized appreciation (depreciation) | 1,872,247 | 7,859,502 |
Net increase (decrease) in net assets resulting
from operations | 1,894,186 | 7,886,317 |
Distributions to shareholders from net investment income | (1,561,667) | (96,645) |
Distributions to shareholders from net realized gain | (137,352) | - |
Total distributions | (1,699,019) | (96,645) |
Share transactions - net increase (decrease) | (15,755,086) | 95,209,478 |
Redemption fees | 87,191 | 27,217 |
Total increase (decrease) in net assets | (15,472,728) | 103,026,367 |
| | |
Net Assets | | |
Beginning of period | 103,026,367 | - |
End of period (including undistributed net investment income of $1,219,736 and undistributed net investment income of $1,406,377, respectively) | $ 87,553,639 | $ 103,026,367 |
See accompanying notes which are an integral part of the financial statements.
Annual Report
Financial Highlights - Class A
Years ended October 31, | 2013 | 2012 G |
Selected Per-Share Data | | |
Net asset value, beginning of period | $ 10.86 | $ 10.00 |
Income from Investment Operations | | |
Net investment income (loss) C | .18 | .20 |
Net realized and unrealized gain (loss) | .48 F | .68 |
Total from investment operations | .66 | .88 |
Distributions from net investment income | (.15) | (.02) |
Distributions from net realized gain | (.01) | - |
Total distributions | (.16) | (.02) |
Redemption fees added to paid in capital C | .01 | - I |
Net asset value, end of period | $ 11.37 | $ 10.86 |
Total Return A, B | 6.23% | 8.80% |
Ratios to Average Net Assets D, H | | |
Expenses before reductions | 1.89% | 1.87% |
Expenses net of fee waivers, if any | 1.65% | 1.65% |
Expenses net of all reductions | 1.62% | 1.62% |
Net investment income (loss) | 1.61% | 1.92% |
Supplemental Data | | |
Net assets, end of period (000 omitted) | $ 18,837 | $ 7,675 |
Portfolio turnover rate E | 120% | 70% |
A Total returns would have been lower if certain expenses had not been reduced during the applicable periods shown.
B Total returns do not include the effect of the sales charges.
C Calculated based on average shares outstanding during the period.
D Fees and expenses of any underlying Fidelity Central Funds are not included in the Fund's expense ratio. The Fund indirectly bears its proportionate share of the expenses of any underlying Fidelity Central Funds.
E Amount does not include the portfolio activity of any underlying Fidelity Central Funds.
F The amount shown for a share outstanding does not correspond with the aggregate net gain (loss) on investments for the period due to the timing of sales and repurchases of shares in relation to fluctuating market values of the investments of the Fund.
G For the period November 1, 2011 (commencement of operations) to October 31, 2012.
H Expense ratios reflect operating expenses of the class. Expenses before reductions do not reflect amounts reimbursed by the investment adviser or reductions from brokerage service arrangements or reductions from other expense offset arrangements and do not represent the amount paid by the class during periods when reimbursements or reductions occur. Expense ratios before reductions for start-up periods may not be representative of longer-term operating periods. Expenses net of fee waivers reflect expenses after reimbursement by the investment adviser but prior to reductions from brokerage service arrangements or other expense offset arrangements. Expenses net of all reductions represent the net expenses paid by the class.
I Amount represents less than $.01 per share.
See accompanying notes which are an integral part of the financial statements.
Annual Report
Financial Highlights - Class T
Years ended October 31, | 2013 | 2012 G |
Selected Per-Share Data | | |
Net asset value, beginning of period | $ 10.84 | $ 10.00 |
Income from Investment Operations | | |
Net investment income (loss) C | .15 | .17 |
Net realized and unrealized gain (loss) | .48 F | .68 |
Total from investment operations | .63 | .85 |
Distributions from net investment income | (.12) | (.01) |
Distributions from net realized gain | (.01) | - |
Total distributions | (.14) J | (.01) |
Redemption fees added to paid in capital C | .01 | - I |
Net asset value, end of period | $ 11.34 | $ 10.84 |
Total Return A, B | 5.93% | 8.56% |
Ratios to Average Net Assets D, H | | |
Expenses before reductions | 2.13% | 2.10% |
Expenses net of fee waivers, if any | 1.90% | 1.90% |
Expenses net of all reductions | 1.88% | 1.87% |
Net investment income (loss) | 1.36% | 1.67% |
Supplemental Data | | |
Net assets, end of period (000 omitted) | $ 5,967 | $ 5,823 |
Portfolio turnover rate E | 120% | 70% |
A Total returns would have been lower if certain expenses had not been reduced during the applicable periods shown.
B Total returns do not include the effect of the sales charges.
C Calculated based on average shares outstanding during the period.
D Fees and expenses of any underlying Fidelity Central Funds are not included in the Fund's expense ratio. The Fund indirectly bears its proportionate share of the expenses of any underlying Fidelity Central Funds.
E Amount does not include the portfolio activity of any underlying Fidelity Central Funds.
F The amount shown for a share outstanding does not correspond with the aggregate net gain (loss) on investments for the period due to the timing of sales and repurchases of shares in relation to fluctuating market values of the investments of the Fund.
G For the period November 1, 2011 (commencement of operations) to October 31, 2012.
H Expense ratios reflect operating expenses of the class. Expenses before reductions do not reflect amounts reimbursed by the investment adviser or reductions from brokerage service arrangements or reductions from other expense offset arrangements and do not represent the amount paid by the class during periods when reimbursements or reductions occur. Expense ratios before reductions for start-up periods may not be representative of longer-term operating periods. Expenses net of fee waivers reflect expenses after reimbursement by the investment adviser but prior to reductions from brokerage service arrangements or other expense offset arrangements. Expenses net of all reductions represent the net expenses paid by the class.
I Amount represents less than $.01 per share.
J Total distributions of $.14 per share is comprised of distributions from net investment income of $.124 and distributions from net realized gain of $.014 per share.
See accompanying notes which are an integral part of the financial statements.
Annual Report
Financial Highlights - Class C
Years ended October 31, | 2013 | 2012 G |
Selected Per-Share Data | | |
Net asset value, beginning of period | $ 10.80 | $ 10.00 |
Income from Investment Operations | | |
Net investment income (loss) C | .09 | .12 |
Net realized and unrealized gain (loss) | .47 F | .69 |
Total from investment operations | .56 | .81 |
Distributions from net investment income | (.07) | (.01) |
Distributions from net realized gain | (.01) | - |
Total distributions | (.08) | (.01) |
Redemption fees added to paid in capital C | .01 | - I |
Net asset value, end of period | $ 11.29 | $ 10.80 |
Total Return A, B | 5.31% | 8.07% |
Ratios to Average Net Assets D, H | | |
Expenses before reductions | 2.65% | 2.63% |
Expenses net of fee waivers, if any | 2.40% | 2.40% |
Expenses net of all reductions | 2.37% | 2.37% |
Net investment income (loss) | .86% | 1.17% |
Supplemental Data | | |
Net assets, end of period (000 omitted) | $ 7,436 | $ 5,824 |
Portfolio turnover rate E | 120% | 70% |
A Total returns would have been lower if certain expenses had not been reduced during the applicable periods shown.
B Total returns do not include the effect of the contingent deferred sales charge.
C Calculated based on average shares outstanding during the period.
D Fees and expenses of any underlying Fidelity Central Funds are not included in the Fund's expense ratio. The Fund indirectly bears its proportionate share of the expenses of any underlying Fidelity Central Funds.
E Amount does not include the portfolio activity of any underlying Fidelity Central Funds.
F The amount shown for a share outstanding does not correspond with the aggregate net gain (loss) on investments for the period due to the timing of sales and repurchases of shares in relation to fluctuating market values of the investments of the Fund.
G For the period November 1, 2011 (commencement of operations) to October 31, 2012.
H Expense ratios reflect operating expenses of the class. Expenses before reductions do not reflect amounts reimbursed by the investment adviser or reductions from brokerage service arrangements or reductions from other expense offset arrangements and do not represent the amount paid by the class during periods when reimbursements or reductions occur. Expense ratios before reductions for start-up periods may not be representative of longer-term operating periods. Expenses net of fee waivers reflect expenses after reimbursement by the investment adviser but prior to reductions from brokerage service arrangements or other expense offset arrangements. Expenses net of all reductions represent the net expenses paid by the class.
I Amount represents less than $.01 per share.
See accompanying notes which are an integral part of the financial statements.
Annual Report
Financial Highlights - Total Emerging Markets
Years ended October 31, | 2013 | 2012 F |
Selected Per-Share Data | | |
Net asset value, beginning of period | $ 10.89 | $ 10.00 |
Income from Investment Operations | | |
Net investment income (loss) B | .21 | .22 |
Net realized and unrealized gain (loss) | .47 E | .69 |
Total from investment operations | .68 | .91 |
Distributions from net investment income | (.17) | (.02) |
Distributions from net realized gain | (.01) | - |
Total distributions | (.18) | (.02) |
Redemption fees added to paid in capital B | .01 | - H |
Net asset value, end of period | $ 11.40 | $ 10.89 |
Total Return A | 6.44% | 9.15% |
Ratios to Average Net Assets C, G | | |
Expenses before reductions | 1.56% | 1.60% |
Expenses net of fee waivers, if any | 1.40% | 1.40% |
Expenses net of all reductions | 1.38% | 1.38% |
Net investment income (loss) | 1.85% | 2.16% |
Supplemental Data | | |
Net assets, end of period (000 omitted) | $ 49,959 | $ 81,416 |
Portfolio turnover rate D | 120% | 70% |
A Total returns would have been lower if certain expenses had not been reduced during the applicable periods shown.
B Calculated based on average shares outstanding during the period.
C Fees and expenses of any underlying Fidelity Central Funds are not included in the Fund's expense ratio. The Fund indirectly bears its proportionate share of the expenses of any underlying Fidelity Central Funds.
D Amount does not include the portfolio activity of any underlying Fidelity Central Funds.
E The amount shown for a share outstanding does not correspond with the aggregate net gain (loss) on investments for the period due to the timing of sales and repurchases of shares in relation to fluctuating market values of the investments of the Fund.
F For the period November 1, 2011 (commencement of operations) to October 31, 2012.
G Expense ratios reflect operating expenses of the class. Expenses before reductions do not reflect amounts reimbursed by the investment adviser or reductions from brokerage service arrangements or reductions from other expense offset arrangements and do not represent the amount paid by the class during periods when reimbursements or reductions occur. Expense ratios before reductions for start-up periods may not be representative of longer-term operating periods. Expenses net of fee waivers reflect expenses after reimbursement by the investment adviser but prior to reductions from brokerage service arrangements or other expense offset arrangements. Expenses net of all reductions represent the net expenses paid by the class.
H Amount represents less than $.01 per share.
See accompanying notes which are an integral part of the financial statements.
Annual Report
Financial Highlights - Institutional Class
Years ended October 31, | 2013 | 2012 F |
Selected Per-Share Data | | |
Net asset value, beginning of period | $ 10.89 | $ 10.00 |
Income from Investment Operations | | |
Net investment income (loss) B | .20 | .22 |
Net realized and unrealized gain (loss) | .48 E | .69 |
Total from investment operations | .68 | .91 |
Distributions from net investment income | (.17) | (.02) |
Distributions from net realized gain | (.01) | - |
Total distributions | (.18) | (.02) |
Redemption fees added to paid in capital B | .01 | - H |
Net asset value, end of period | $ 11.40 | $ 10.89 |
Total Return A | 6.44% | 9.15% |
Ratios to Average Net Assets C, G | | |
Expenses before reductions | 1.63% | 1.62% |
Expenses net of fee waivers, if any | 1.40% | 1.40% |
Expenses net of all reductions | 1.37% | 1.37% |
Net investment income (loss) | 1.86% | 2.17% |
Supplemental Data | | |
Net assets, end of period (000 omitted) | $ 5,354 | $ 2,287 |
Portfolio turnover rate D | 120% | 70% |
A Total returns would have been lower if certain expenses had not been reduced during the applicable periods shown.
B Calculated based on average shares outstanding during the period.
C Fees and expenses of any underlying Fidelity Central Funds are not included in the Fund's expense ratio. The Fund indirectly bears its proportionate share of the expenses of any underlying Fidelity Central Funds.
D Amount does not include the portfolio activity of any underlying Fidelity Central Funds.
E The amount shown for a share outstanding does not correspond with the aggregate net gain (loss) on investments for the period due to the timing of sales and repurchases of shares in relation to fluctuating market values of the investments of the Fund.
F For the period November 1, 2011 (commencement of operations) to October 31, 2012.
G Expense ratios reflect operating expenses of the class. Expenses before reductions do not reflect amounts reimbursed by the investment adviser or reductions from brokerage service arrangements or reductions from other expense offset arrangements and do not represent the amount paid by the class during periods when reimbursements or reductions occur. Expense ratios before reductions for start-up periods may not be representative of longer-term operating periods. Expenses net of fee waivers reflect expenses after reimbursement by the investment adviser but prior to reductions from brokerage service arrangements or other expense offset arrangements. Expenses net of all reductions represent the net expenses paid by the class.
H Amount represents less than $.01 per share.
See accompanying notes which are an integral part of the financial statements.
Annual Report
Fidelity Total Emerging Markets Fund
Notes to Financial Statements
For the period ended October 31, 2013
1. Organization.
Fidelity Total Emerging Markets Fund (the Fund) is a fund of Fidelity Investment Trust (the Trust) and is authorized to issue an unlimited number of shares. The Trust is registered under the Investment Company Act of 1940, as amended (the 1940 Act), as an open-end management investment company organized as a Massachusetts business trust. The Fund offers Class A, Class T, Class C, Total Emerging Markets and Institutional Class shares, each of which has equal rights as to assets and voting privileges. Each class has exclusive voting rights with respect to matters that affect that class. The Fund's investments in emerging markets can be subject to social, economic, regulatory, and political uncertainties and can be extremely volatile.
2. Investments in Fidelity Central Funds.
The Fund invests in Fidelity Central Funds, which are open-end investment companies generally available only to other investment companies and accounts managed by Fidelity Management & Research Company (FMR) and its affiliates. The Fund's Schedule of Investments lists each of the Fidelity Central Funds held as of period end, if any, as an investment of the Fund, but does not include the underlying holdings of each Fidelity Central Fund. As an Investing Fund, the Fund indirectly bears its proportionate share of the expenses of the underlying Fidelity Central Funds.
The Money Market Central Funds seek preservation of capital and current income and are managed by Fidelity Investments Money Management, Inc. (FIMM), an affiliate of FMR.
A complete unaudited list of holdings for each Fidelity Central Fund is available upon request or at the Securities and Exchange Commission (the SEC) website at www.sec.gov. In addition, the financial statements of the Fidelity Central Funds, which are not covered by the Fund's Report of Independent Registered Public Accounting Firm, are available on the SEC website or upon request.
3. Significant Accounting Policies.
The financial statements have been prepared in conformity with accounting principles generally accepted in the United States of America (GAAP), which require management to make certain estimates and assumptions at the date of the financial statements. Actual results could differ from those estimates. Subsequent events, if any, through the date that the financial statements were issued have been evaluated in the preparation of the financial statements. The following summarizes the significant accounting policies of the Fund:
Investment Valuation. Investments are valued as of 4:00 p.m. Eastern time on the last calendar day of the period. In accordance with valuation policies and procedures
Annual Report
Fidelity Total Emerging Markets Fund
Notes to Financial Statements - continued
3. Significant Accounting Policies - continued
Investment Valuation - continued
approved by the Board of Trustees (the Board), the Fund attempts to obtain prices from one or more third party pricing vendors or brokers to value its investments. When current market prices, quotations or currency exchange rates are not readily available or reliable, investments will be fair valued in good faith by the FMR Fair Value Committee (the Committee), in accordance with procedures adopted by the Board. Factors used in determining fair value vary by investment type and may include market or investment specific events, changes in interest rates and credit quality. The frequency with which these procedures are used cannot be predicted and they may be utilized to a significant extent. The Committee oversees the Fund's valuation policies and procedures and is responsible for approving and reporting to the Board all fair value determinations.
The Fund categorizes the inputs to valuation techniques used to value its investments into a disclosure hierarchy consisting of three levels as shown below:
Level 1 - quoted prices in active markets for identical investments
Level 2 - other significant observable inputs (including quoted prices for similar investments, interest rates, prepayment speeds, etc.)
Level 3 - unobservable inputs (including the Fund's own assumptions based on the best information available)
Valuation techniques used to value the Fund's investments by major category are as follows:
Equity securities, including restricted securities, for which market quotations are readily available, are valued at the last reported sale price or official closing price as reported by a third party pricing vendor on the primary market or exchange on which they are traded and are categorized as Level 1 in the hierarchy. In the event there were no sales during the day or closing prices are not available, securities are valued at the last quoted bid price or may be valued using the last available price and are generally categorized as Level 2 in the hierarchy. For foreign equity securities, when market or security specific events arise, comparisons to the valuation of American Depositary Receipts (ADRs), futures contracts, Exchange-Traded Funds (ETFs) and certain indexes as well as quoted prices for similar securities may be used and would be categorized as Level 2 in the hierarchy. Utilizing these techniques may result in transfers between Level 1 and Level 2. For equity securities, including restricted securities, where observable inputs are limited, assumptions about market activity and risk are used and these securities may be categorized as Level 3 in the hierarchy.
Debt securities, including restricted securities, are valued based on evaluated prices received from third party pricing vendors or from brokers who make markets in such
Annual Report
3. Significant Accounting Policies - continued
Investment Valuation - continued
securities. For corporate bonds and foreign government and government agency obligations, pricing vendors utilize matrix pricing which considers yield or price of bonds of comparable quality, coupon, maturity and type as well as broker-supplied prices. When independent prices are unavailable or unreliable, debt securities may be valued utilizing pricing methodologies which consider similar factors that would be used by third party pricing vendors. Debt securities are generally categorized as Level 2 in the hierarchy but may be Level 3 depending on the circumstances.
Futures contracts are valued at the settlement price or official closing price established each day by the board of trade or exchange on which they are traded and are categorized as Level 1 in the hierarchy. Investments in open-end mutual funds, including the Fidelity Central Funds, are valued at their closing net asset value (NAV) each business day and are categorized as Level 1 in the hierarchy.
Changes in valuation techniques may result in transfers in or out of an assigned level within the disclosure hierarchy. The aggregate value of investments by input level, as of October 31, 2013, is included at the end of the Fund's Schedule of Investments.
Foreign Currency. The Fund may use foreign currency contracts to facilitate transactions in foreign-denominated securities. Gains and losses from these transactions may arise from changes in the value of the foreign currency or if the counterparties do not perform under the contracts' terms.
Foreign-denominated assets, including investment securities, and liabilities are translated into U.S. dollars at the exchange rates at period end. Purchases and sales of investment securities, income and dividends received and expenses denominated in foreign currencies are translated into U.S. dollars at the exchange rate in effect on the transaction date.
The effects of exchange rate fluctuations on investments are included with the net realized and unrealized gain (loss) on investment securities. Other foreign currency transactions resulting in realized and unrealized gain (loss) are disclosed separately.
Investment Transactions and Income. For financial reporting purposes, the Fund's investment holdings and NAV include trades executed through the end of the last business day of the period. The NAV per share for processing shareholder transactions is calculated as of the close of business of the New York Stock Exchange (NYSE), normally 4:00 p.m. Eastern time and includes trades executed through the end of the prior business day. Gains and losses on securities sold are determined on the basis of identified cost. Dividend income is recorded on the ex-dividend date, except for certain dividends from foreign securities where the ex-dividend date may have passed, which are recorded
Annual Report
Fidelity Total Emerging Markets Fund
Notes to Financial Statements - continued
3. Significant Accounting Policies - continued
Investment Transactions and Income - continued
as soon as the Fund is informed of the ex-dividend date. Non-cash dividends included in dividend income, if any, are recorded at the fair market value of the securities received. Distributions received on securities that represent a return of capital or capital gain are recorded as a reduction of cost of investments and/or as a realized gain. Subsequent to ex-dividend date the Fund determines the components of these distributions, based upon receipt of tax filings or other correspondence relating to the underlying investment. Interest income and distributions from the Fidelity Central Funds are accrued as earned. Interest income includes coupon interest and amortization of premium and accretion of discount on debt securities. Investment income is recorded net of foreign taxes withheld where recovery of such taxes is uncertain.
Class Allocations and Expenses. Investment income, realized and unrealized capital gains and losses, common expenses of the Fund, and certain fund-level expense reductions, if any, are allocated daily on a pro-rata basis to each class based on the relative net assets of each class to the total net assets of the Fund. Each class differs with respect to transfer agent and distribution and service plan fees incurred. Certain expense reductions may also differ by class. For the reporting period, the allocated portion of income and expenses to each class as a percent of its average net assets may vary due to the timing of recording these transactions in relation to fluctuating net assets of the classes. Expenses directly attributable to a fund are charged to that fund. Expenses attributable to more than one fund are allocated among the respective funds on the basis of relative net assets or other appropriate methods. Expense estimates are accrued in the period to which they relate and adjustments are made when actual amounts are known.
Income Tax Information and Distributions to Shareholders. Each year, the Fund intends to qualify as a regulated investment company under Subchapter M of the Internal Revenue Code, including distributing substantially all of its taxable income and realized gains. As a result, no provision for U.S. Federal income taxes is required. As of October 31, 2013, the Fund did not have any unrecognized tax benefits in the financial statements; nor is the Fund aware of any tax positions for which it is reasonably possible that the total amounts of unrecognized tax benefits will significantly change in the next twelve months. The Fund files a U.S. federal tax return, in addition to state and local tax returns as required. The Fund's federal income tax returns are subject to examination by the Internal Revenue Service (IRS) for a period of three fiscal years after they are filed. State and local tax returns may be subject to examination for an additional fiscal year depending on the jurisdiction. Foreign taxes are provided for based on the Fund's understanding of the tax rules and rates that exist in the foreign markets in which it invests. The Fund is subject to a tax imposed on capital gains by certain countries in which it invests. An estimated deferred tax liability for net unrealized appreciation on
Annual Report
3. Significant Accounting Policies - continued
Income Tax Information and Distributions to Shareholders - continued
the applicable securities is included in Other payables and accrued expenses on the Statement of Assets & Liabilities.
Distributions are declared and recorded on the ex-dividend date. Income dividends and capital gain distributions are declared separately for each class. Income and capital gain distributions are determined in accordance with income tax regulations, which may differ from GAAP. In addition, the Fund claimed a portion of the payment made to redeeming shareholders as a distribution for income tax purposes.
Capital accounts within the financial statements are adjusted for permanent book-tax differences. These adjustments have no impact on net assets or the results of operations. Temporary book-tax differences will reverse in a subsequent period.
Book-tax differences are primarily due to futures transactions, foreign currency transactions, certain foreign taxes, passive foreign investment companies (PFIC), market discount, capital loss carry forwards and losses deferred due to wash sales.
The federal tax cost of investment securities and unrealized appreciation (depreciation) as of period end were as follows:
Gross unrealized appreciation | $ 12,054,189 |
Gross unrealized depreciation | (2,823,600) |
Net unrealized appreciation (depreciation) on securities and other investments | $ 9,230,589 |
| |
Tax Cost | $ 78,167,364 |
The tax-based components of distributable earnings as of period end were as follows:
Undistributed ordinary income | $ 1,161,940 |
Capital loss carryforward | $ (2,949,184) |
Net unrealized appreciation (depreciation) | $ 9,230,033 |
Capital loss carryforwards are only available to offset future capital gains of the Fund to the extent provided by regulations and may be limited. Under the Regulated Investment Company Modernization Act of 2010 (the Act), the Fund is permitted to carry forward capital losses incurred in taxable years beginning after December 22, 2010 for an unlimited period and such capital losses are required to be used prior to any losses that expire.
Annual Report
Fidelity Total Emerging Markets Fund
Notes to Financial Statements - continued
3. Significant Accounting Policies - continued
Income Tax Information and Distributions to Shareholders - continued
The capital loss carryforward information presented below, including any applicable limitation, is estimated as of fiscal period end and is subject to adjustment.
No expiration | |
Short-term | $ (2,949,184) |
The tax character of distributions paid was as follows:
| October 31, 2013 | October 31, 2012 |
Ordinary Income | $ 1,699,019 | $ 96,645 |
Short-Term Trading (Redemption) Fees. Shares held by investors in the Fund less than 90 days may have been subject to a redemption fee equal to 1.50% of the net asset value of shares redeemed. All redemption fees, which reduce the proceeds of the shareholder redemption, are retained by the Fund and accounted for as an addition to paid in capital.
Restricted Securities. The Fund may invest in securities that are subject to legal or contractual restrictions on resale. These securities generally may be resold in transactions exempt from registration or to the public if the securities are registered. Disposal of these securities may involve time-consuming negotiations and expense, and prompt sale at an acceptable price may be difficult. Information regarding restricted securities is included at the end of the Fund's Schedule of Investments.
New Accounting Pronouncement. The Financial Accounting Standards Board issued in December 2011, Accounting Standard Update No. 2011-11, Disclosures about Offsetting Assets and Liabilities, and in January 2013, Accounting Standards Update No. 2013-1 Clarifying the Scope of Disclosures about Offsetting Assets and Liabilities. These updates create new disclosure requirements requiring entities to disclose both gross and net information for derivatives and other financial instruments that are either offset in the Statement of Assets and Liabilities or subject to an enforceable master netting arrangement or similar agreement. The disclosure requirements are effective for annual reporting periods beginning on or after January 1, 2013, and interim periods within those annual periods. Management expects that the impact of the updates' adoption will be limited to additional financial statement disclosures as applicable.
4. Derivative Instruments.
Risk Exposures and the Use of Derivative Instruments. The Fund's investment objective allows the Fund to enter into various types of derivative contracts, including futures contracts. Derivatives are investments whose value is primarily derived from
Annual Report
4. Derivative Instruments - continued
Risk Exposures and the Use of Derivative Instruments - continued
underlying assets, indices or reference rates and may be transacted on an exchange or over-the-counter (OTC). Derivatives may involve a future commitment to buy or sell a specified asset based on specified terms, to exchange future cash flows at periodic intervals based on a notional principal amount, or for one party to make one or more payments upon the occurrence of specified events in exchange for periodic payments from the other party.
The Fund used derivatives to increase returns and to manage exposure to certain risks as defined below. The success of any strategy involving derivatives depends on analysis of numerous economic factors, and if the strategies for investment do not work as intended, the Fund may not achieve its objectives.
The Fund's use of derivatives increased or decreased its exposure to the following risk:
Equity Risk | Equity risk relates to the fluctuations in the value of financial instruments as a result of changes in market prices (other than those arising from interest rate risk or foreign exchange risk), whether caused by factors specific to an individual investment, its issuer, or all factors affecting all instruments traded in a market or market segment. |
The Fund is also exposed to additional risks from investing in derivatives, such as liquidity risk and counterparty credit risk. Liquidity risk is the risk that the Fund will be unable to close out the derivative in the open market in a timely manner. Counterparty credit risk is the risk that the counterparty will not be able to fulfill its obligation to the Fund. Counterparty credit risk related to exchange-traded futures contracts may be mitigated by the protection provided by the exchange on which they trade.
Investing in derivatives may involve greater risks than investing in the underlying assets directly and, to varying degrees, may involve risk of loss in excess of any initial investment and collateral received and amounts recognized in the Statement of Assets and Liabilities. In addition, there may be the risk that the change in value of the derivative contract does not correspond to the change in value of the underlying instrument.
Futures Contracts. A futures contract is an agreement between two parties to buy or sell a specified underlying instrument for a fixed price at a specified future date. The Fund used futures contracts to manage its exposure to the stock market.
Upon entering into a futures contract, a fund is required to deposit either cash or securities (initial margin) with a clearing broker in an amount equal to a certain percentage of the face value of the contract. Futures contracts are marked-to-market daily and subsequent daily payments (variation margin) are made or received by a fund depending on
Annual Report
Fidelity Total Emerging Markets Fund
Notes to Financial Statements - continued
4. Derivative Instruments - continued
Futures Contracts - continued
the daily fluctuations in the value of the futures contracts and are recorded as unrealized appreciation or (depreciation). This receivable and/or payable, if any, is included in daily variation margin for derivative instruments in the Statement of Assets and Liabilities. Realized gain or (loss) is recorded upon the expiration or closing of a futures contract.
Any open futures contracts at period end are presented in the Schedule of Investments under the caption "Futures Contracts." The underlying face amount at value reflects each contract's exposure to the underlying instrument or index at period end and is representative of activity for the period. Securities deposited to meet initial margin requirements are identified in the Schedule of Investments.
During the period the Fund recognized net realized gain (loss) of $(77,497) and a change in net unrealized appreciation (depreciation) of $(9,007) related to its investment in futures contracts. These amounts are included in the Statement of Operations.
5. Purchases and Sales of Investments.
Purchases and sales of securities, other than short-term securities, aggregated $127,907,727 and $141,712,892, respectively.
The Fund realized a gain on the sale of an investment not meeting the investment restrictions of the Fund.
6. Fees and Other Transactions with Affiliates.
Management Fee. FMR and its affiliates provide the Fund with investment management related services for which the Fund pays a monthly management fee. The management fee is the sum of an individual fund fee rate that is based on an annual rate of .55% of the Fund's average net assets and an annualized group fee rate that averaged .25% during the period. The group fee rate is based upon the average net assets of all the mutual funds advised by FMR, including any mutual funds previously advised by FMR that are currently advised by Fidelity SelectCo, LLC, an affiliate of FMR. The group fee rate decreases as assets under management increase and increases as assets under management decrease. For the reporting period, the total annual management fee rate was .81% of the Fund's average net assets.
Distribution and Service Plan Fees. In accordance with Rule 12b-1 of the 1940 Act, the Fund has adopted separate Distribution and Service Plans for each class of shares. Certain classes pay Fidelity Distributors Corporation (FDC), an affiliate of FMR, separate Distribution and Service Fees, each of which is based on an annual percentage of each class' average net assets. In addition, FDC may pay financial intermediaries for selling shares of the Fund and providing shareholder support services. For the period,
Annual Report
6. Fees and Other Transactions with Affiliates - continued
Distribution and Service Plan Fees - continued
the Distribution and Service Fee rates, total fees and amounts retained by FDC were as follows:
| Distribution
Fee | Service
Fee | Total Fees | Retained
by FDC |
Class A | -% | .25% | $ 35,394 | $ 11,702 |
Class T | .25% | .25% | 31,862 | 11,312 |
Class C | .75% | .25% | 61,633 | 54,524 |
| | | $ 128,889 | $ 77,538 |
Sales Load. FDC may receive a front-end sales charge of up to 5.75% for selling Class A shares and 3.50% for selling Class T shares, some of which is paid to financial intermediaries for selling shares of the Fund. Depending on the holding period, FDC may receive contingent deferred sales charges levied on Class A, Class T, and Class C redemptions. The deferred sales charges range from 1.00% for Class C shares, 1.00% for certain purchases of Class A shares and .25% for certain purchases of Class T shares.
For the period, sales charge amounts retained by FDC were as follows:
| Retained
by FDC |
Class A | $ 13,119 |
Class T | 3,441 |
Class C* | 578 |
| $ 17,138 |
* When Class C shares are initially sold, FDC pays commissions from its own resources to financial intermediaries through which the sales are made.
Transfer Agent Fees. Fidelity Investments Institutional Operations Company, Inc., (FIIOC), an affiliate of FMR, is the transfer, dividend disbursing and shareholder servicing agent for each class of the Fund. FIIOC receives account fees and asset-based fees that vary according to the account size and type of account of the shareholders of the respective classes of the Fund. FIIOC pays for typesetting, printing and mailing of shareholder reports, except proxy statements.
Annual Report
Fidelity Total Emerging Markets Fund
Notes to Financial Statements - continued
6. Fees and Other Transactions with Affiliates - continued
Transfer Agent Fees - continued
For the period, transfer agent fees for each class were as follows:
| Amount | % of
Average
Net Assets |
Class A | $ 31,225 | .22 |
Class T | 15,225 | .24 |
Class C | 15,227 | .25 |
Total Emerging Markets | 153,704 | .19 |
Institutional Class | 7,222 | .19 |
| $ 222,603 | |
Accounting and Security Lending Fees. Fidelity Service Company, Inc. (FSC), an affiliate of FMR, maintains the Fund's accounting records. The accounting fee is based on the level of average net assets for each month. Under a separate contract, FSC administers the security lending program. The security lending fee is based on the number and duration of lending transactions.
Brokerage Commissions. The Fund placed a portion of its portfolio transactions with brokerage firms which are affiliates of the investment adviser. Brokerage commissions are included in net realized gain (loss) and change in net unrealized appreciation (depreciation) in the Statement of Operations. The commissions paid to these affiliated firms were $996 for the period.
Interfund Lending Program. Pursuant to an Exemptive Order issued by the SEC, the Fund, along with other registered investment companies having management contracts with FMR, may participate in an interfund lending program. This program provides an alternative credit facility allowing the funds to borrow from, or lend money to, other participating affiliated funds. At period end, there were no interfund loans outstanding. The Fund's activity in this program during the period for which loans were outstanding was as follows:
Borrower or Lender | Average Loan
Balance | Weighted Average
Interest Rate | Interest
Expense |
Borrower | $ 3,919,500 | .39% | $ 253 |
7. Committed Line of Credit.
The Fund participates with other funds managed by FMR or an affiliate in a $4.25 billion credit facility (the "line of credit") to be utilized for temporary or emergency purposes to fund shareholder redemptions or for other short-term liquidity purposes. The Fund has
Annual Report
7. Committed Line of Credit - continued
agreed to pay commitment fees on its pro-rata portion of the line of credit, which amounted to $248 and is reflected in Miscellaneous expenses on the Statement of Operations. During the period, there were no borrowings on this line of credit.
8. Security Lending.
The Fund lends portfolio securities through a lending agent from time to time in order to earn additional income. For equity securities, a lending agent is used and may loan securities to certain qualified borrowers, including Fidelity Capital Markets (FCM), a broker-dealer affiliated with the Fund. On the settlement date of the loan, the Fund receives collateral (in the form of U.S. Treasury obligations, letters of credit and/or cash) against the loaned securities and maintains collateral in an amount not less than 100% of the market value of the loaned securities during the period of the loan. The market value of the loaned securities is determined at the close of business of the Fund and any additional required collateral is delivered to the Fund on the next business day. If the borrower defaults on its obligation to return the securities loaned because of insolvency or other reasons, the Fund may apply collateral received from the borrower against the obligation. The Fund may experience delays and costs in recovering the securities loaned. Any cash collateral received is invested in the Fidelity Securities Lending Cash Central Fund. At period end, there were no security loans outstanding. Security lending income represents the income earned on investing cash collateral, less rebates paid to borrowers and any lending agent fees associated with the loan, plus any premium payments received for lending certain types of securities. Security lending income is presented in the Statement of Operations as a component of income from Fidelity Central Funds. Total security lending income during the period amounted to $20. During the period, there were no securities loaned to FCM.
9. Expense Reductions.
FMR contractually agreed to reimburse each class to the extent annual operating expenses exceeded certain levels of average net assets as noted in the table below. This reimbursement will remain in place through December 31, 2014. Some expenses, for example interest expense, including commitment fees, are excluded from this reimbursement.
Annual Report
Fidelity Total Emerging Markets Fund
Notes to Financial Statements - continued
9. Expense Reductions - continued
The following classes were in reimbursement during the period:
| Expense
Limitations | Reimbursement |
| | |
Class A | 1.65% | $ 33,991 |
Class T | 1.90% | 14,907 |
Class C | 2.40% | 15,690 |
Total Emerging Markets | 1.40% | 123,344 |
Institutional Class | 1.40% | 8,511 |
| | $ 196,443 |
In addition, FMR reimbursed a portion of the Fund's operating expenses during the period in the amount of $426.
Commissions paid to certain brokers with whom FMR, or its affiliates, places trades on behalf of the Fund include an amount in addition to trade execution, which may be rebated back to the Fund to offset certain expenses. This amount totaled $26,904 for the period. In addition, through arrangements with the Fund's custodian, credits realized as a result of uninvested cash balances were used to reduce the Fund's expenses. During the period, these credits reduced the Fund's custody expenses by $223.
10. Distributions to Shareholders.
Distributions to shareholders of each class were as follows:
Years ended October 31, | 2013 | 2012 A |
From net investment income | | |
Class A | $ 104,565 | $ 9,099 |
Class T | 69,282 | 4,204 |
Class C | 35,970 | 3,000 |
Total Emerging Markets | 1,316,259 | 75,940 |
Institutional Class | 35,591 | 4,402 |
Total | $ 1,561,667 | $ 96,645 |
From net realized gain | | |
Class A | $ 10,027 | $ - |
Class T | 7,822 | - |
Class C | 7,516 | - |
Total Emerging Markets | 109,039 | - |
Institutional Class | 2,948 | - |
Total | $ 137,352 | $ - |
A For the period November 1, 2011 (commencement of operations) to October 31, 2012.
Annual Report
11. Share Transactions.
Transactions for each class of shares were as follows:
| Shares | Dollars |
Years ended October 31, | 2013 | 2012 A | 2013 | 2012 A |
Class A | | | | |
Shares sold | 1,550,621 | 723,537 | $ 17,267,543 | $ 7,311,002 |
Reinvestment of distributions | 9,656 | 949 | 105,541 | 9,099 |
Shares redeemed | (609,546) | (17,979) | (6,666,165) | (179,387) |
Net increase (decrease) | 950,731 | 706,507 | $ 10,706,919 | $ 7,140,714 |
Class T | | | | |
Shares sold | 277,882 | 597,107 | $ 3,114,089 | $ 6,082,522 |
Reinvestment of distributions | 7,041 | 439 | 76,883 | 4,204 |
Shares redeemed | (295,695) | (60,421) | (3,268,261) | (637,924) |
Net increase (decrease) | (10,772) | 537,125 | $ (77,289) | $ 5,448,802 |
Class C | | | | |
Shares sold | 431,831 | 540,321 | $ 4,824,945 | $ 5,429,037 |
Reinvestment of distributions | 3,973 | 314 | 43,420 | 3,000 |
Shares redeemed | (316,804) | (1,143) | (3,521,280) | (12,081) |
Net increase (decrease) | 119,000 | 539,492 | $ 1,347,085 | $ 5,419,956 |
Total Emerging Markets | | | | |
Shares sold | 5,085,608 | 8,901,615 | $ 57,439,168 | $ 89,854,661 |
Reinvestment of distributions | 113,766 | 7,686 | 1,243,462 | 73,759 |
Shares redeemed | (8,294,710) | (1,430,767) | (89,232,029) | (14,834,512) |
Net increase (decrease) | (3,095,336) | 7,478,534 | $ (30,549,399) | $ 75,093,908 |
Institutional Class | | | | |
Shares sold | 491,268 | 209,638 | $ 5,357,985 | $ 2,101,696 |
Reinvestment of distributions | 3,526 | 459 | 38,539 | 4,402 |
Shares redeemed | (235,091) | - | (2,578,926) | - |
Net increase (decrease) | 259,703 | 210,097 | $ 2,817,598 | $ 2,106,098 |
A For the period November 1, 2011 (commencement of operations) to October 31, 2012.
12. Other.
The Fund's organizational documents provide former and current trustees and officers with a limited indemnification against liabilities arising in connection with the performance of their duties to the Fund. In the normal course of business, the Fund may also enter into contracts that provide general indemnifications. The Fund's maximum exposure under these arrangements is unknown as this would be dependent on future
Annual Report
Fidelity Total Emerging Markets Fund
Notes to Financial Statements - continued
12. Other - continued
claims that may be made against the Fund. The risk of material loss from such claims is considered remote.
At the end of the period, FMR or its affiliates were the owners of record of 16% of the total outstanding shares of the Fund.
Annual Report
To the Trustees of Fidelity Investment Trust and the Shareholders of Fidelity Emerging Markets Discovery Fund and Fidelity Total Emerging Markets Fund:
In our opinion, the accompanying statements of assets and liabilities, including the schedules of investments, and the related statements of operations and of changes in net assets and the financial highlights present fairly, in all material respects, the financial position of Fidelity Emerging Markets Discovery Fund and Fidelity Total Emerging Markets Fund at October 31, 2013, the results of each of their operations for the year then ended, the changes in its net assets for each of the periods indicated and the financial highlights for each of the periods indicated, in conformity with accounting principles generally accepted in the United States of America. These financial statements and financial highlights (hereafter referred to as "financial statements") are the responsibility of the Fidelity Emerging Markets Discovery Fund's and Fidelity Total Emerging Markets Fund's management. Our responsibility is to express an opinion on these financial statements based on our audits. We conducted our audits of these financial statements in accordance with the standards of the Public Company Accounting Oversight Board (United States). Those standards require that we plan and perform the audit to obtain reasonable assurance about whether the financial statements are free of material misstatement. An audit includes examining, on a test basis, evidence supporting the amounts and disclosures in the financial statements, assessing the accounting principles used and significant estimates made by management, and evaluating the overall financial statement presentation. We believe that our audits, which included confirmation of securities at October 31, 2013 by correspondence with the custodian and brokers, provide a reasonable basis for our opinion.
PricewaterhouseCoopers LLP
Boston, Massachusetts
December 17, 2013
Annual Report
The Trustees, Member of the Advisory Board, and executive officers of the trust and funds, as applicable, are listed below. The Board of Trustees governs each fund and is responsible for protecting the interests of shareholders. The Trustees are experienced executives who meet periodically throughout the year to oversee each fund's activities, review contractual arrangements with companies that provide services to each fund, oversee management of the risks associated with such activities and contractual arrangements, and review each fund's performance. Except for James C. Curvey, Ned C. Lautenbach, Ronald P. O'Hanley, and William S. Stavropoulos, each of the Trustees oversees 171 funds. Mr. Curvey oversees 394 funds. Mr. Lautenbach, Mr. O'Hanley, and Mr. Stavropoulos each oversees 245 funds.
The Trustees hold office without limit in time except that (a) any Trustee may resign; (b) any Trustee may be removed by written instrument, signed by at least two-thirds of the number of Trustees prior to such removal; (c) any Trustee who requests to be retired or who has become incapacitated by illness or injury may be retired by written instrument signed by a majority of the other Trustees; and (d) any Trustee may be removed at any special meeting of shareholders by a two-thirds vote of the outstanding voting securities of the trust. Each Trustee who is not an interested person of the trust and the funds (as defined in the 1940 Act) (Independent Trustee), shall retire not later than the last day of the calendar year in which his or her 75th birthday occurs. The Independent Trustees may waive this mandatory retirement age policy with respect to individual Trustees. The executive officers and Advisory Board Member hold office without limit in time, except that any officer and Advisory Board Member may resign or may be removed by a vote of a majority of the Trustees at any regular meeting or any special meeting of the Trustees. Except as indicated, each individual has held the office shown or other offices in the same company for the past five years.
Experience, Skills, Attributes, and Qualifications of the Funds' Trustees. The Governance and Nominating Committee has adopted a statement of policy that describes the experience, qualifications, attributes, and skills that are necessary and desirable for potential Independent Trustee candidates (Statement of Policy). The Board believes that each Trustee satisfied at the time he or she was initially elected or appointed a Trustee, and continues to satisfy, the standards contemplated by the Statement of Policy. The Governance and Nominating Committee also engages professional search firms to help identify potential Independent Trustee candidates who have the experience, qualifications, attributes, and skills consistent with the Statement of Policy. From time to time, additional criteria based on the composition and skills of the current Independent Trustees, as well as experience or skills that may be appropriate in light of future changes to board composition, business conditions, and regulatory or other developments, have also been considered by the professional search firms and the Governance and Nominating Committee. In addition, the Board takes into account the Trustees' commitment and participation in Board and committee meetings, as well as their leadership of standing and ad hoc committees throughout their tenure.
Annual Report
Trustees and Officers - continued
In determining that a particular Trustee was and continues to be qualified to serve as a Trustee, the Board has considered a variety of criteria, none of which, in isolation, was controlling. The Board believes that, collectively, the Trustees have balanced and diverse experience, qualifications, attributes, and skills, which allow the Board to operate effectively in governing each fund and protecting the interests of shareholders. Information about the specific experience, skills, attributes, and qualifications of each Trustee, which in each case led to the Board's conclusion that the Trustee should serve (or continue to serve) as a trustee of the funds, is provided below.
Board Structure and Oversight Function. James C. Curvey is an interested person (as defined in the 1940 Act) and currently serves as Chairman. The Trustees have determined that an interested Chairman is appropriate and benefits shareholders because an interested Chairman has a personal and professional stake in the quality and continuity of services provided to the funds. Independent Trustees exercise their informed business judgment to appoint an individual of their choosing to serve as Chairman, regardless of whether the Trustee happens to be independent or a member of management. The Independent Trustees have determined that they can act independently and effectively without having an Independent Trustee serve as Chairman and that a key structural component for assuring that they are in a position to do so is for the Independent Trustees to constitute a substantial majority for the Board. The Independent Trustees also regularly meet in executive session. Ned C. Lautenbach serves as Chairman of the Independent Trustees and as such (i) acts as a liaison between the Independent Trustees and management with respect to matters important to the Independent Trustees and (ii) with management prepares agendas for Board meetings.
Fidelity funds are overseen by different Boards of Trustees. The funds' Board oversees Fidelity's equity and high income funds and another Board oversees Fidelity's investment-grade bond, money market, and asset allocation funds. The asset allocation funds may invest in Fidelity funds overseen by the funds' Board. The use of separate Boards, each with its own committee structure, allows the Trustees of each group of Fidelity funds to focus on the unique issues of the funds they oversee, including common research, investment, and operational issues. On occasion, the separate Boards establish joint committees to address issues of overlapping consequences for the Fidelity funds overseen by each Board.
The Trustees operate using a system of committees to facilitate the timely and efficient consideration of all matters of importance to the Trustees, each fund, and fund shareholders and to facilitate compliance with legal and regulatory requirements and oversight of the funds' activities and associated risks. The Board, acting through its committees, has charged FMR and its affiliates with (i) identifying events or circumstances the occurrence of which could have demonstrably adverse effects on the funds' business and/or reputation; (ii) implementing processes and controls to lessen the possibility that such events or circumstances occur or to mitigate the effects of such events or circumstances if they do occur; and (iii) creating and maintaining a system designed to evaluate continuously business and market conditions in order to facilitate the identification and implementation processes described in (i) and (ii) above. Because the day-to-day operations and activities of the funds are carried out by or through FMR, its affiliates and other service providers, the funds' exposure to risks is mitigated but not eliminated by the processes overseen by the Trustees. While each of the Board's committees has responsibility for overseeing different aspects of the funds' activities, oversight is exercised primarily through the Operations, Audit, and Compliance Committees. In addition, the Independent Trustees have worked with FMR to enhance the Board's oversight of investment and financial risks, legal and regulatory risks, technology risks, and operational risks, including the development of additional risk reporting to the Board. For example, a working group comprised of Independent Trustees and FMR has worked and continues to work to review the Fidelity funds' valuation-related activities, reporting and risk management. Appropriate personnel, including but not limited to the funds' Chief Compliance Officer (CCO), FMR's internal auditor, the independent accountants, the funds' Treasurer and portfolio management personnel, make periodic reports to the Board's committees, as appropriate, including an annual review of FMR's risk management program for the Fidelity funds. The responsibilities of each standing committee, including their oversight responsibilities, are described further under "Standing Committees of the Funds' Trustees."
Annual Report
The funds' Statement of Additional Information (SAI) includes more information about the Trustees. To request a free copy, call Fidelity at 1-800-544-8544.
Interested Trustees*:
Correspondence intended for each Trustee who is an interested person may be sent to Fidelity Investments, 245 Summer Street, Boston, Massachusetts 02210.
Name, Year of Birth; Principal Occupations and Other Relevant Experience+ |
James C. Curvey (1935) |
Year of Election or Appointment: 2007 Trustee Chairman of the Board of Trustees |
| Mr. Curvey also serves as Trustee of other Fidelity funds. Mr. Curvey is a Director of Fidelity Investments Money Management, Inc. (2009-present), Director of Fidelity Research & Analysis Co. (2009-present) and Director of FMR and FMR Co., Inc. (2007-present). Mr. Curvey is also Vice Chairman (2007-present) and Director of FMR LLC. In addition, Mr. Curvey serves as an Overseer for the Boston Symphony Orchestra and a member of the Trustees of Villanova University. Previously, Mr. Curvey was the Vice Chairman (2006-2007) and Director (2000-2007) of FMR Corp. |
Ronald P. O'Hanley (1957) |
Year of Election or Appointment: 2011 Trustee |
| Mr. O'Hanley also serves as Trustee of other Fidelity funds. He is Director of Fidelity SelectCo, LLC (2013-present), FMR Co., Inc. (2010-present), Director of Fidelity Investments Money Management, Inc. (2010-present), Director of Fidelity Research & Analysis Company (2010-present), President of Fidelity Asset Management and Corporate Services and a Member of Fidelity's Executive Committee (2010-present). Previously, Mr. O'Hanley served as President and Chief Executive Officer of BNY Mellon Asset Management (2007-2010). Mr. O'Hanley also served as Vice Chairman of Bank New York Mellon Corp. and a member of that firm's Executive Committee. Prior to the 2007 merger of The Bank of New York and Mellon Financial Corporation, he was Vice Chairman of Mellon Financial Corporation and President and Chief Executive Officer of Mellon Asset Management. He joined Mellon in February 1997. Mr. O'Hanley currently serves as Chairman of the Boston Public Library Foundation Board of Directors and sits on the Board of Directors of Beth Israel Deaconess Medical Center, the Board of Trustees of the Marine Biological Laboratory and the Advisory Board of the Maxwell School of Citizenship and Public Administration at Syracuse University. Mr. O'Hanley also chairs the Council on Asset Management for the Financial Services Roundtable and is a member of the Board of Directors of Institutional Investor's U.S. Institute. |
* Trustees have been determined to be "Interested Trustees" by virtue of, among other things, their affiliation with the trust or various entities under common control with FMR.
+ The information above includes each Trustee's principal occupation during the last five years and other information relating to the experience, attributes, and skills relevant to each Trustee's qualifications to serve as a Trustee, which led to the conclusion that each Trustee should serve as a Trustee for each fund.
Annual Report
Independent Trustees:
Correspondence intended for each Independent Trustee (that is, the Trustees other than the Interested Trustees) may be sent to Fidelity Investments, P.O. Box 55235, Boston, Massachusetts 02205-5235.
Name, Year of Birth; Principal Occupations and Other Relevant Experience+ |
Dennis J. Dirks (1948) |
Year of Election or Appointment: 2005 Trustee |
| Mr. Dirks also serves as Trustee of other Fidelity funds. Prior to his retirement in May 2003, Mr. Dirks was Chief Operating Officer and a member of the Board of The Depository Trust & Clearing Corporation (DTCC). He also served as President, Chief Operating Officer, and Board member of The Depository Trust Company (DTC) and President and Board member of the National Securities Clearing Corporation (NSCC). In addition, Mr. Dirks served as Chief Executive Officer and Board member of the Government Securities Clearing Corporation, Chief Executive Officer and Board member of the Mortgage-Backed Securities Clearing Corporation, as a Trustee and a member of the Finance Committee of Manhattan College (2005-2008), and as a Trustee and a member of the Finance Committee of AHRC of Nassau County (2006-2008). Mr. Dirks is a member of the Independent Directors Council (IDC) Governing Council (2010-present) and Board of Directors for The Brookville Center for Children's Services, Inc. (2009-present). |
Alan J. Lacy (1953) |
Year of Election or Appointment: 2008 Trustee |
| Mr. Lacy also serves as Trustee of other Fidelity funds. Mr. Lacy serves as Senior Adviser (2007-present) of Oak Hill Capital Partners, L.P. (private equity). Mr. Lacy also served as Chief Executive Officer (2000-2005) and Vice Chairman (2005-2006) of Sears Holdings Corporation and Sears, Roebuck and Co. (retail). In addition, Mr. Lacy serves as a member of the Board of Directors of Dave & Buster's Entertainment, Inc. (restaurant and entertainment complexes, 2010-present), Earth Fare, Inc. (retail grocery, 2012-present), The Hillman Companies, Inc. (hardware wholesalers, 2010-present), and Bristol-Myers Squibb Company (global pharmaceuticals, 2008-present). Mr. Lacy is a member of the Board of Trustees of The National Parks Conservation Association (2006-present). Previously, Mr. Lacy served as Chairman of the Board of Trustees of the National Parks Conservation Association (2008-2011) and as a member of the Board of Directors for the Western Union Company (global money transfer, 2006-2011). |
Ned C. Lautenbach (1944) |
Year of Election or Appointment: 2000 Trustee Chairman of the Independent Trustees |
| Mr. Lautenbach also serves as Trustee of other Fidelity funds. Mr. Lautenbach currently serves as the Lead Director of the Eaton Corporation Board of Directors (diversified industrial, 1997-present). Mr. Lautenbach is Chairman of the Board of Directors of the Philharmonic Center for the Arts in Naples, Florida (2012-present) and a member of the Council on Foreign Relations (1994-present). Previously, Mr. Lautenbach was a Partner/Advisory Partner at Clayton, Dubilier & Rice, LLC (private equity investment, 1998-2010), as well as a Director of Sony Corporation (2006-2007). |
Joseph Mauriello (1944) |
Year of Election or Appointment: 2008 Trustee |
| Mr. Mauriello also serves as Trustee of other Fidelity funds. Prior to his retirement in January 2006, Mr. Mauriello served in numerous senior management positions including Deputy Chairman and Chief Operating Officer (2004-2005), and Vice Chairman of Financial Services (2002-2004) of KPMG LLP US (professional services, 1965-2005). Mr. Mauriello currently serves as a member of the Board of Directors of XL Group plc. (global insurance and re-insurance, 2006-present). Previously, Mr. Mauriello served as a Director of the Hamilton Funds of the Bank of New York (2006-2007) and of Arcadia Resources Inc. (health care services and products, 2007-2012). |
Robert W. Selander (1950) |
Year of Election or Appointment: 2011 Trustee |
| Mr. Selander also serves as Trustee of other Fidelity funds. Previously, Mr. Selander served as a Member of the Advisory Board of other Fidelity funds (2011), and Executive Vice Chairman (2010), Chief Executive Officer (2009-2010), and President and Chief Executive Officer (1997-2009) of Mastercard, Inc. |
Cornelia M. Small (1944) |
Year of Election or Appointment: 2005 Trustee |
| Ms. Small also serves as Trustee of other Fidelity funds. Ms. Small is a member of the Board of Directors (2009-present) and Chair of the Investment Committee (2010-present) of the Teagle Foundation. Ms. Small also serves on the Investment Committee of the Berkshire Taconic Community Foundation (2008-present). Previously, Ms. Small served as Chairperson (2002-2008) and a member of the Investment Committee and Chairperson (2008-2012) and a member of the Board of Trustees of Smith College. In addition, Ms. Small served as Chief Investment Officer, Director of Global Equity Investments, and a member of the Board of Directors of Scudder, Stevens & Clark and Scudder Kemper Investments. |
William S. Stavropoulos (1939) |
Year of Election or Appointment: 2001 Trustee Vice Chairman of the Independent Trustees |
| Mr. Stavropoulos also serves as Trustee of other Fidelity funds. Mr. Stavropoulos serves as President and Founder of the Michigan Baseball Foundation, the Great Lakes Loons (2007-present). Mr. Stavropoulos is Chairman Emeritus of the Board of Directors of The Dow Chemical Company, where he previously served in numerous senior management positions, including President, CEO (1995-2000; 2002-2004), Chairman of the Executive Committee (2000-2006), and as a member of the Board of Directors (1990-2006). Currently, Mr. Stavropoulos is Chairman of the Board of Directors of Univar Inc. (global distributor of commodity and specialty chemicals), a Director of Teradata Corporation (data warehousing and technology solutions), and Maersk Inc. (industrial conglomerate), and a member of the Advisory Board for Metalmark Capital LLC (private equity investment, 2005-present). Mr. Stavropoulos is an operating advisor to Clayton, Dubilier & Rice, LLC (private equity investment). In addition, Mr. Stavropoulos is a member of the University of Notre Dame Advisory Council for the College of Science, a Trustee of the Rollin L. Gerstacker Foundation, and a Director of the Naples Philharmonic Center for the Arts. Previously, Mr. Stavropoulos served as a Director of Chemical Financial Corporation (bank holding company, 1993-2012) and Tyco International, Ltd. (multinational manufacturing and services, 2007-2012). |
David M. Thomas (1949) |
Year of Election or Appointment: 2008 Trustee |
| Mr. Thomas also serves as Trustee of other Fidelity funds. Mr. Thomas serves as Non-Executive Chairman of the Board of Directors of Fortune Brands Home and Security (home and security products, 2011-present), and as a member of the Board of Directors of Interpublic Group of Companies, Inc. (marketing communication, 2004-present). Previously, Mr. Thomas served as Executive Chairman (2005-2006) and Chairman and Chief Executive Officer (2000-2005) of IMS Health, Inc. (pharmaceutical and healthcare information solutions), and a Director of Fortune Brands, Inc. (consumer products, 2000-2011). |
+ The information above includes each Trustee's principal occupation during the last five years and other information relating to the experience, attributes, and skills relevant to each Trustee's qualifications to serve as a Trustee, which led to the conclusion that each Trustee should serve as a Trustee for each fund.
Advisory Board Member and Executive Officers:
Correspondence intended for each executive officer and Peter S. Lynch may be sent to Fidelity Investments, 245 Summer Street, Boston, Massachusetts 02210. Executive officers appear below in alphabetical order.
Name, Year of Birth; Principal Occupation |
Peter S. Lynch (1944) |
Year of Election or Appointment: 2003 Member of the Advisory Board |
| Mr. Lynch also serves as Member of the Advisory Board of other Fidelity funds. Mr. Lynch is Vice Chairman and a Director of FMR and FMR Co., Inc. In addition, Mr. Lynch serves as a Trustee of Boston College and as the Chairman of the Inner-City Scholarship Fund. Previously, Mr. Lynch served on the Special Olympics International Board of Directors (1997-2006). |
Elizabeth Paige Baumann (1968) |
Year of Election or Appointment: 2012 Anti-Money Laundering (AML) Officer |
| Ms. Baumann also serves as AML Officer of other funds. She is Chief AML Officer of FMR LLC (2012-present) and is an employee of Fidelity Investments. Previously, Ms. Baumann served as Vice President and Deputy Anti-Money Laundering Officer (2007-2012). |
William C. Coffey (1969) |
Year of Election or Appointment: 2009 Assistant Secretary |
| Mr. Coffey also serves as Assistant Secretary of other funds. He is Senior Vice President and Deputy General Counsel of FMR LLC (2010-present), and is an employee of Fidelity Investments. Previously, Mr. Coffey served as Vice President and Associate General Counsel of FMR LLC (2005-2009). |
Jonathan Davis (1968) |
Year of Election or Appointment: 2010 Assistant Treasurer |
| Mr. Davis also serves as Assistant Treasurer of other funds. Mr. Davis is an employee of Fidelity Investments. Previously, Mr. Davis served as Vice President and Associate General Counsel of FMR LLC (2003-2010). |
Adrien E. Deberghes (1967) |
Year of Election or Appointment: 2008 Deputy Treasurer |
| Mr. Deberghes also serves as an officer of other funds. He is an employee of Fidelity Investments (2008-present). Prior to joining Fidelity Investments, Mr. Deberghes was Senior Vice President of Mutual Fund Administration at State Street Corporation (2007-2008), Senior Director of Mutual Fund Administration at Investors Bank & Trust (2005-2007), and Director of Finance for Dunkin' Brands (2000-2005). |
Stephanie J. Dorsey (1969) |
Year of Election or Appointment: 2010 Assistant Treasurer |
| Ms. Dorsey also serves as an officer of other funds. She is an employee of Fidelity Investments (2008-present) and has served in other fund officer roles. Prior to joining Fidelity Investments, Ms. Dorsey served as Treasurer (2004-2008) of the JPMorgan Mutual Funds and Vice President (2004-2008) of JPMorgan Chase Bank. |
Scott C. Goebel (1968) |
Year of Election or Appointment: 2008 Secretary and Chief Legal Officer (CLO) |
| Mr. Goebel serves as Secretary and CLO of other funds. Mr. Goebel also serves as Secretary of Fidelity Investments Money Management, Inc. (FIMM) (2010-present) and Fidelity Research and Analysis Company (FRAC) (2010-present); General Counsel, Secretary, and Senior Vice President of FMR (2008-present) and FMR Co., Inc. (2008-present); Chief Legal Officer of Fidelity Management & Research (Hong Kong) Limited (2008-present) and Assistant Secretary of Fidelity Management & Research (Japan) Inc. (2008-present), and Fidelity Management & Research (U.K.) Inc. (2008-present). Previously, Mr. Goebel served as Secretary and CLO of other Fidelity funds (2008-2013), Assistant Secretary of FIMM (2008-2010), FRAC (2008-2010), and certain funds (2007-2008); and as Vice President and Secretary of Fidelity Distributors Corporation (FDC) (2005-2007). Mr. Goebel has been employed by FMR LLC or an affiliate since 2001. |
Joseph A. Hanlon (1968) |
Year of Election or Appointment: 2012 Chief Compliance Officer |
| Mr. Hanlon also serves as Chief Compliance Officer of other funds. Mr. Hanlon serves as Compliance Officer of FMR, FMR Co., Inc., Fidelity Investments Money Management, Inc. (FIMM), Fidelity Research and Analysis Company (FRAC), and Fidelity Management & Research (Hong Kong) (2009-present), as Senior Vice President of the Fidelity Asset Management Division (2009-present), and is an employee of Fidelity Investments. Previously, Mr. Hanlon served as Compliance Officer of Fidelity Management & Research (Japan) Inc. (2009-2013), Strategic Advisers, Inc. (2009-2013), and Fidelity Management & Research (U.K.) Inc. (2009-2013). |
Bruce T. Herring (1965) |
Year of Election or Appointment: 2006 Vice President of certain Equity Funds |
| Mr. Herring also serves as Vice President of other funds. He serves as Chief Investment Officer of Fidelity Global Asset Allocation (GAA) (2013-present), Chief Investment Officer and Director of Fidelity Management & Research (U.K.) Inc. (2010-present), Group Chief Investment Officer of FMR, and President of Fidelity Research & Analysis Company (2010-present). Previously, Mr. Herring served as Vice President (2005-2006) and Senior Vice President (2006-2007) of Fidelity Management & Research Company, Vice President of FMR Co., Inc. (2001-2007), and as a portfolio manager for Fidelity U.S. Equity Funds. |
Brian B. Hogan (1964) |
Year of Election or Appointment: 2009 Vice President |
| Mr. Hogan also serves as Vice President of other funds. Mr. Hogan serves as President of FMR's Equity Division (2009-present). Previously, Mr. Hogan served as Senior Vice President, Equity Research of FMR (2006-2009) and as a portfolio manager. |
Chris Maher (1972) |
Year of Election or Appointment: 2013 Assistant Treasurer |
| Mr. Maher serves as Assistant Treasurer of other funds. Mr. Maher is Vice President of Valuation Oversight and is an employee of Fidelity Investments. Previously, Mr. Maher served as Vice President of Asset Management Compliance (2013), Vice President of FMR's Program Management Group (2010-2013), and Vice President of Valuation Oversight (2008-2010). |
Christine Reynolds (1958) |
Year of Election or Appointment: 2008 Chief Financial Officer |
| Ms. Reynolds also serves as Chief Financial Officer of other funds. Ms. Reynolds became President of Fidelity Pricing and Cash Management Services (FPCMS) in August 2008. Ms. Reynolds served as Chief Operating Officer of FPCMS (2007-2008). Previously, Ms. Reynolds served as President, Treasurer, and Anti-Money Laundering officer of the Fidelity funds (2004-2007). |
Kenneth B. Robins (1969) |
Year of Election or Appointment: 2008 President and Treasurer |
| Mr. Robins also serves as an officer of other funds. Mr. Robins serves as Executive Vice President of Fidelity Investments Money Management, Inc. (FIMM) (2013-present) and is an employee of Fidelity Investments (2004-present). Previously, Mr. Robins served in other fund officer roles. |
Gary W. Ryan (1958) |
Year of Election or Appointment: 2005 Assistant Treasurer |
| Mr. Ryan also serves as Assistant Treasurer of other funds. Mr. Ryan is an employee of Fidelity Investments and has served in other fund officer roles. Previously, Mr. Ryan served as Vice President of Fund Reporting in Fidelity Pricing and Cash Management Services (FPCMS) (1999-2005). |
Stephen Sadoski (1971) |
Year of Election or Appointment: 2012 Deputy Treasurer |
| Mr. Sadoski also serves as Deputy Treasurer of other funds. He is an employee of Fidelity Investments (2012-present) and has served in another fund officer role. Prior to joining Fidelity Investments, Mr. Sadoski served as an assistant chief accountant in the Division of Investment Management of the Securities and Exchange Commission (SEC) (2009-2012) and as a senior manager at Deloitte & Touche LLP (1997-2009). |
Stacie M. Smith (1974) |
Year of Election or Appointment: 2013 Deputy Treasurer |
| Ms. Smith also serves as an officer of other funds. She is an employee of Fidelity Investments (2009-present) and has served in other fund officer roles. Prior to joining Fidelity Investments, Ms. Smith served as Senior Audit Manager of Ernst & Young LLP (1996-2009). |
Renee Stagnone (1975) |
Year of Election or Appointment: 2013 Deputy Treasurer |
| Ms. Stagnone also serves as Deputy Treasurer of other funds. Ms. Stagnone is an employee of Fidelity Investments. |
Joseph F. Zambello (1957) |
Year of Election or Appointment: 2011 Deputy Treasurer |
| Mr. Zambello also serves as Deputy Treasurer of other funds. Mr. Zambello is an employee of Fidelity Investments. Previously, Mr. Zambello served as Vice President of FMR's Program Management Group (2009-2011) and Vice President of the Transfer Agent Oversight Group (2005-2009). |
Annual Report
The Board of Trustees of each fund voted to pay to shareholders of record at the opening of business on record date, the following distributions per share derived from capital gains realized from sales of portfolio securities and dividends derived from net investment income:
| Pay Date | Record Date | Dividends | Capital Gains |
Emerging Markets Discovery | 12/09/13 | 12/06/13 | $0.085 | $0.300 |
Total Emerging Markets | 12/09/13 | 12/06/13 | $0.197 | $0.000 |
The funds hereby designate as capital gain dividend the amounts noted below for the taxable year ended October 31, 2013, or, if subsequently determined to be different, the net capital gain of such year.
Emerging Markets Discovery | $2,657,028 |
A percentage of the dividends distributed during the fiscal year for the following funds may be taken into account as a dividend for purposes of the maximum rate under section 1(h)(11) of the Internal Revenue Code.
Emerging Markets Discovery | |
December 7, 2012 | 17% |
December 27, 2012 | 100% |
Total Emerging Markets | |
December 7, 2012 | 63% |
The amounts per share which represent income derived from sources within, and taxes paid to, foreign countries or possessions of the United States are as follows:
| Pay Date | Income | Taxes |
Emerging Markets Discovery | 12/10/12 | $0.095 | $0.0134 |
| 12/28/12 | $0.002 | $0.0000 |
| Pay Date | Income | Taxes |
Total Emerging Markets | 12/10/12 | $0.175 | $0.0157 |
The funds will notify shareholders in January 2014 of amounts for use in preparing 2013 income tax returns.
Annual Report
Board Approval of Investment Advisory Contracts and Management Fees
Fidelity Emerging Markets Discovery Fund
Fidelity Total Emerging Markets Fund
Each year, the Board of Trustees, including the Independent Trustees (together, the Board), votes on the renewal of the management contract and sub-advisory agreements (together, the Advisory Contracts) for each fund. The Board, assisted by the advice of fund counsel and Independent Trustees' counsel, requests and considers a broad range of information relevant to the renewal of the Advisory Contracts throughout the year.
The Board meets regularly and, at each of its meetings, covers an extensive agenda of topics and materials and considers factors that are relevant to its annual consideration of the renewal of each fund's Advisory Contracts, including the services and support provided to each fund and its shareholders. The Board has established various standing committees, each composed of and chaired by Independent Trustees with varying backgrounds, to which the Board has assigned specific subject matter responsibilities in order to enhance effective decision-making by the Board. The Board, acting directly and through its Committees, requests and receives information concerning the annual consideration of the renewal of each fund's Advisory Contracts. The Board also meets as needed to consider matters specifically related to the Board's annual consideration of the renewal of Advisory Contracts. Members of the Board may also meet with trustees of other Fidelity funds through ad hoc joint committees to discuss certain matters relevant to the Fidelity funds.
At its July 2013 meeting, the Board, including the Independent Trustees, unanimously determined to renew each fund's Advisory Contracts. In reaching its determination, the Board considered all factors it believed relevant, including (i) the nature, extent, and quality of the services to be provided to each fund and its shareholders (including the investment performance of each fund); (ii) the competitiveness of each fund's management fee and total expense ratio relative to peer funds; (iii) the total costs of the services to be provided by and the profits to be realized by Fidelity from its relationship with each fund; (iv) the extent to which economies of scale exist and would be realized as each fund grows; and (v) whether fee levels reflect these economies of scale, if any, for the benefit of fund shareholders.
In considering whether to renew the Advisory Contracts for each fund, the Board reached a determination, with the assistance of fund counsel and Independent Trustees' counsel and through the exercise of its business judgment, that the renewal of the Advisory Contracts was in the best interests of each fund and its shareholders and that the compensation payable under the Advisory Contracts was fair and reasonable. The Board's decision to renew the Advisory Contracts was not based on any single factor, but rather was based on a comprehensive consideration of all the information provided to the Board at its meetings throughout the year. The Board, in reaching its determination to renew the Advisory Contracts, was aware that shareholders in each fund have a broad range of investment choices available to them, including a wide choice among mutual funds offered by Fidelity's competitors, and that each fund's shareholders, who have the opportunity to review and weigh the disclosure provided by the fund in its prospectus and other public disclosures, have chosen to invest in that fund, which is a part of the Fidelity family of funds.
Annual Report
Nature, Extent, and Quality of Services Provided. The Board considered the staffing within the investment adviser, Fidelity Management & Research Company (FMR), and the sub-advisers (together, the Investment Advisers) as it relates to the funds, including the backgrounds of the funds' investment personnel, and also considered the funds' investment objectives, strategies, and related investment philosophies. The Independent Trustees also had discussions with senior management of Fidelity's investment operations and investment groups. The Board considered the structure of the portfolio manager compensation program and whether this structure provides appropriate incentives to act in the best interests of each fund.
Resources Dedicated to Investment Management and Support Services. The Board and the Fund Oversight and Research Committees reviewed the general qualifications and capabilities of the Investment Advisers' investment staff, including its size, education, experience, and resources, as well as the Investment Advisers' approach to recruiting, training, managing, and compensating investment personnel. The Board noted that FMR has continued to increase the resources devoted to non-U.S. offices, including expansion of Fidelity's global investment organization. The Board also noted that Fidelity's analysts have extensive resources, tools and capabilities that allow them to conduct sophisticated quantitative and fundamental analysis, as well as credit analysis of issuers, counterparties and guarantors. Further, the Board believes that Fidelity's investment professionals have sufficient access to global information and data so as to provide competitive investment results over time, and that those professionals also have access to sophisticated tools that permit them to assess portfolio construction and risk and performance attribution characteristics continuously, as well as to transmit new information and research conclusions rapidly around the world. Additionally, in its deliberations, the Board considered the Investment Advisers' trading and risk management capabilities and resources, which are an integral part of the investment management process.
Shareholder and Administrative Services. The Board considered (i) the nature, extent, quality, and cost of advisory, administrative, and shareholder services performed by the Investment Advisers and their affiliates under the Advisory Contracts and under separate agreements covering transfer agency, pricing and bookkeeping, and securities lending services for each fund; (ii) the nature and extent of the supervision of third party service providers, principally custodians and subcustodians; and (iii) the resources devoted to, and the record of compliance with, each fund's compliance policies and procedures. The Board also reviewed the allocation of fund brokerage, including allocations to brokers affiliated with the Investment Advisers, the use of brokerage commissions to pay fund expenses, and the use of "soft" commission dollars to pay for research services.
Annual Report
Board Approval of Investment Advisory Contracts and
Management Fees - continued
The Board noted that the growth of fund assets over time across the complex allows Fidelity to reinvest in the development of services designed to enhance the value or convenience of the Fidelity funds as investment vehicles. These services include 24-hour access to account information and market information through telephone representatives and over the Internet, investor education materials and asset allocation tools, and the expanded availability of Fidelity Investor Centers.
Investment in a Large Fund Family. The Board considered the benefits to shareholders of investing in a Fidelity fund, including the benefits of investing in a fund that is part of a large family of funds offering a variety of investment disciplines and providing a large variety of mutual fund investor services. The Board noted that Fidelity had taken, or had made recommendations that resulted in the Fidelity funds taking, a number of actions over the previous year that benefited particular funds, including (i) continuing to dedicate additional resources to investment research and to the support of the senior management team that oversees asset management; (ii) persisting in efforts to enhance Fidelity's global research capabilities; (iii) launching new funds and making other enhancements to meet client needs for global and income-oriented solutions; (iv) continuing to launch dedicated lower cost underlying funds to meet portfolio construction needs related to expanding underlying fund options for Fidelity funds of funds, specifically for the Freedom Fund product lines; (v) rationalizing product lines and gaining increased efficiencies through the mergers of several funds into other funds; (vi) strengthening Fidelity's index fund offerings by reducing investment minimums and adopting or lowering existing expense caps for certain funds and classes; (vii) enhancing Global Asset Allocation product offerings by launching new funds and strategies, including "open architecture" target date funds that utilize affiliated and unaffiliated sub-advisers; (viii) modifying the eligibility criteria for Institutional Class shares of Advisor funds to increase their marketability to a portion of the defined contribution plan market; (ix) creating a new low-cost retirement share class for certain Advisor funds to appeal to large retirement plans; (x) transitioning the management of certain Fidelity commodity funds to Geode Capital Management LLC, a registered commodity pool operator, while retaining administrative responsibilities for the funds; (xi) reorganizing a number of funds; and (xii) taking steps toward establishing a new Fidelity adviser to manage sector-based funds and products.
Investment Performance. The Board considered whether each fund has operated in accordance with its investment objective, as well as its record of compliance with its investment restrictions and its performance history.
The Board took into account discussions with the Investment Advisers about fund investment performance that occur at Board meetings throughout the year. In this regard the Board noted that as part of regularly scheduled fund reviews and other reports to the Board on fund performance, the Board periodically considers annualized return information for each fund, for different time periods, measured against a securities market index ("benchmark index") and a peer group of mutual funds with similar objectives ("peer group"). In its evaluation of fund investment performance, the Board gave particular attention to information indicating changes in performance of certain Fidelity funds for specific time periods and the Investment Advisers' explanations for any overperformance or underperformance.
Annual Report
In addition to reviewing absolute and relative fund performance, the Independent Trustees periodically consider the appropriateness of fund performance metrics in evaluating the results achieved. In general, the Independent Trustees believe that fund performance should be evaluated based on net performance (after fees and expenses) of both the highest performing and lowest performing classes, where applicable, compared to appropriate benchmark indices, over appropriate time periods which may include full market cycles, and compared to peer groups, as applicable, over the same periods, taking into account relevant factors including the following: general market conditions; issuer-specific information; tactical opportunities for investment; and fund cash flows and other factors.
The Independent Trustees recognize that shareholders evaluate performance on a net basis over their own holding periods, for which one-, three-, and five-year periods are used as a proxy. For this reason, the performance information reviewed by the Board also included net cumulative calendar year total return information for each fund and an appropriate benchmark index and, in the case of Fidelity Emerging Markets Discovery Fund, peer group for the most recent one-year period, as shown below. Returns are shown compared to the 25th percentile (top of box) and 75th percentile (bottom of box) of the peer universe.
Annual Report
Board Approval of Investment Advisory Contracts and
Management Fees - continued
Fidelity Emerging Markets Discovery Fund

Fidelity Total Emerging Markets Fund
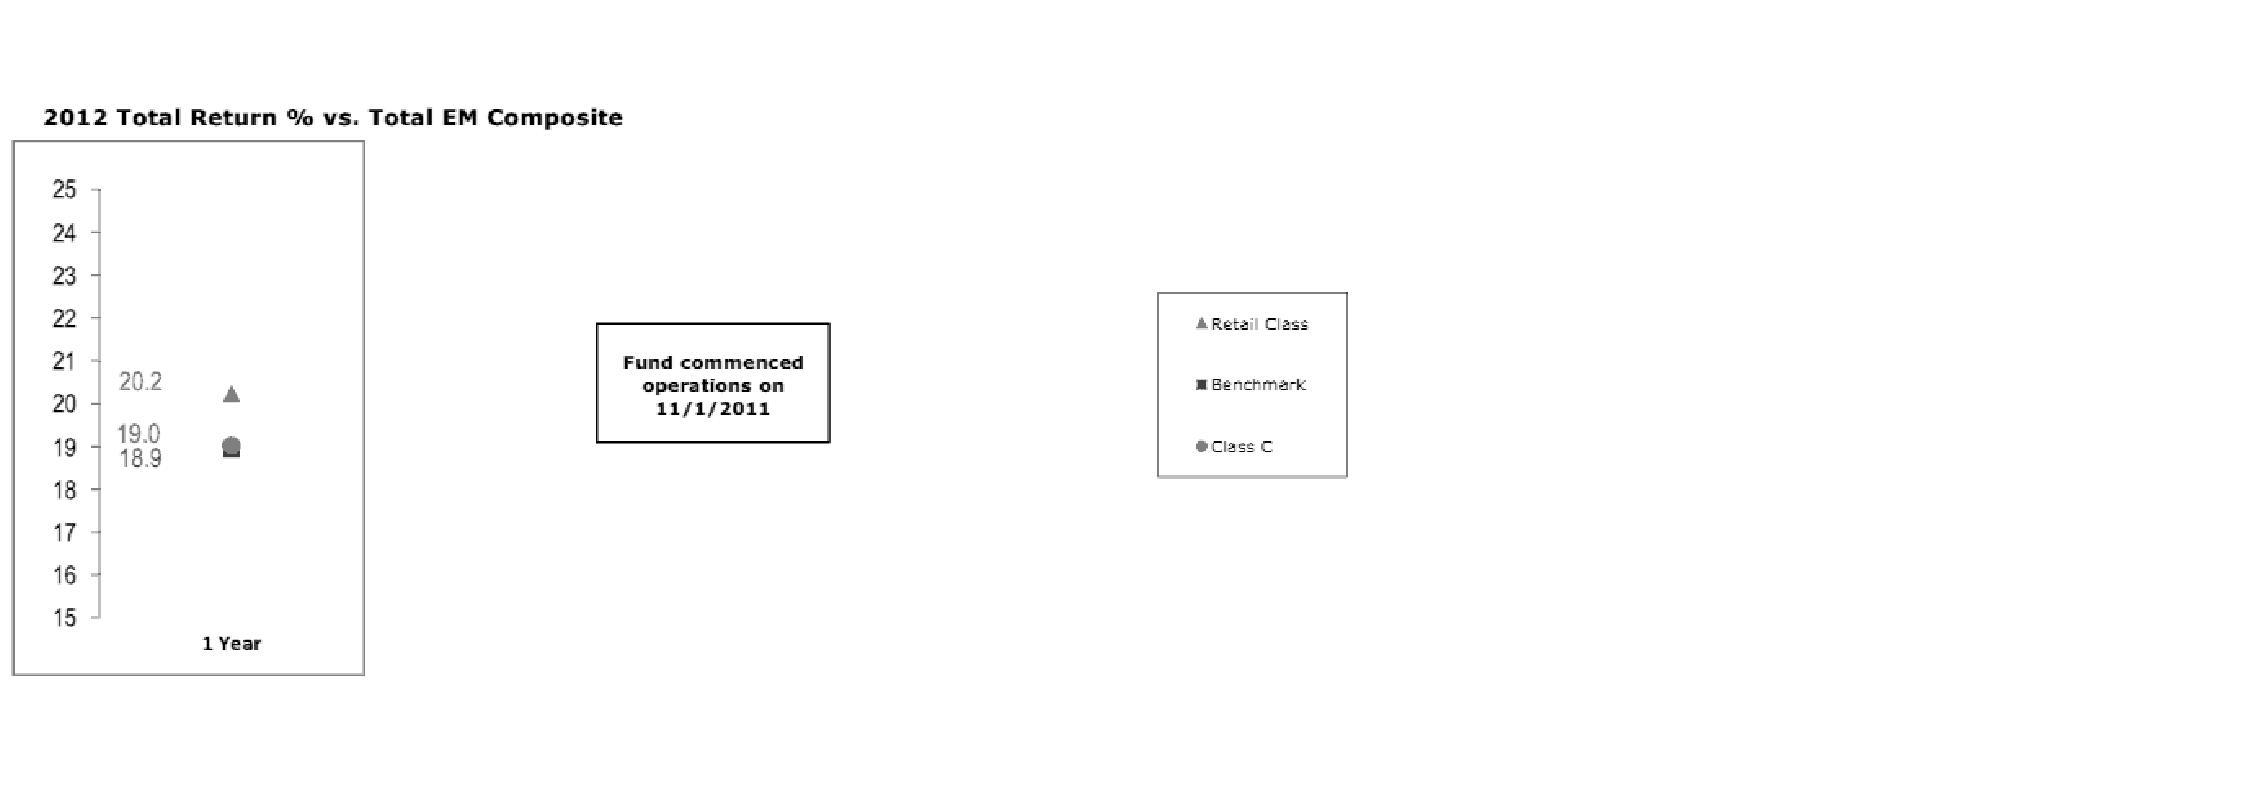
Based on its review, the Board concluded that the nature, extent, and quality of services provided to each fund under the Advisory Contracts should benefit each fund's shareholders.
Competitiveness of Management Fee and Total Expense Ratio. The Board considered each fund's management fee and total expense ratio compared to "mapped groups" of competitive funds and classes. Fidelity creates "mapped groups" by combining similar Lipper investment objective categories that have comparable management fee characteristics. Combining Lipper investment objective categories aids the Board's management fee and total expense ratio comparisons by broadening the competitive group used for comparison and by reducing the number of universes to which various Fidelity funds are compared.
Annual Report
Management Fee. The Board considered two proprietary management fee comparisons for the 12-month (or shorter) periods shown in the charts below. The group of Lipper funds used by the Board for management fee comparisons is referred to below as the "Total Mapped Group." The Total Mapped Group comparison focuses on a fund's standing in terms of gross management fees before expense reimbursements or caps relative to the total universe of funds with comparable investment mandates, regardless of whether their management fee structures also are comparable. Funds with comparable investment mandates offer exposure to similar types of securities. Funds with comparable management fee structures have similar management fee contractual arrangements (e.g., flat rate charged for advisory services, all-inclusive fee rate, etc.). "TMG %" represents the percentage of funds in the Total Mapped Group that had management fees that were lower than a fund's. For example, a TMG % of 19% would mean that 81% of the funds in the Total Mapped Group had higher management fees than a fund. The "Asset-Size Peer Group" (ASPG) comparison focuses on a fund's standing relative to a subset of non-Fidelity funds within the Total Mapped Group that are similar in size and management fee structure. The ASPG represents at least 15% of the funds in the Total Mapped Group with comparable asset size and management fee structures, subject to a minimum of 50 funds (or all funds in the Total Mapped Group if fewer than 50). Additional information, such as the ASPG quartile in which a fund's management fee ranked, is also included in the charts and considered by the Board.
Annual Report
Board Approval of Investment Advisory Contracts and
Management Fees - continued
Fidelity Emerging Markets Discovery Fund
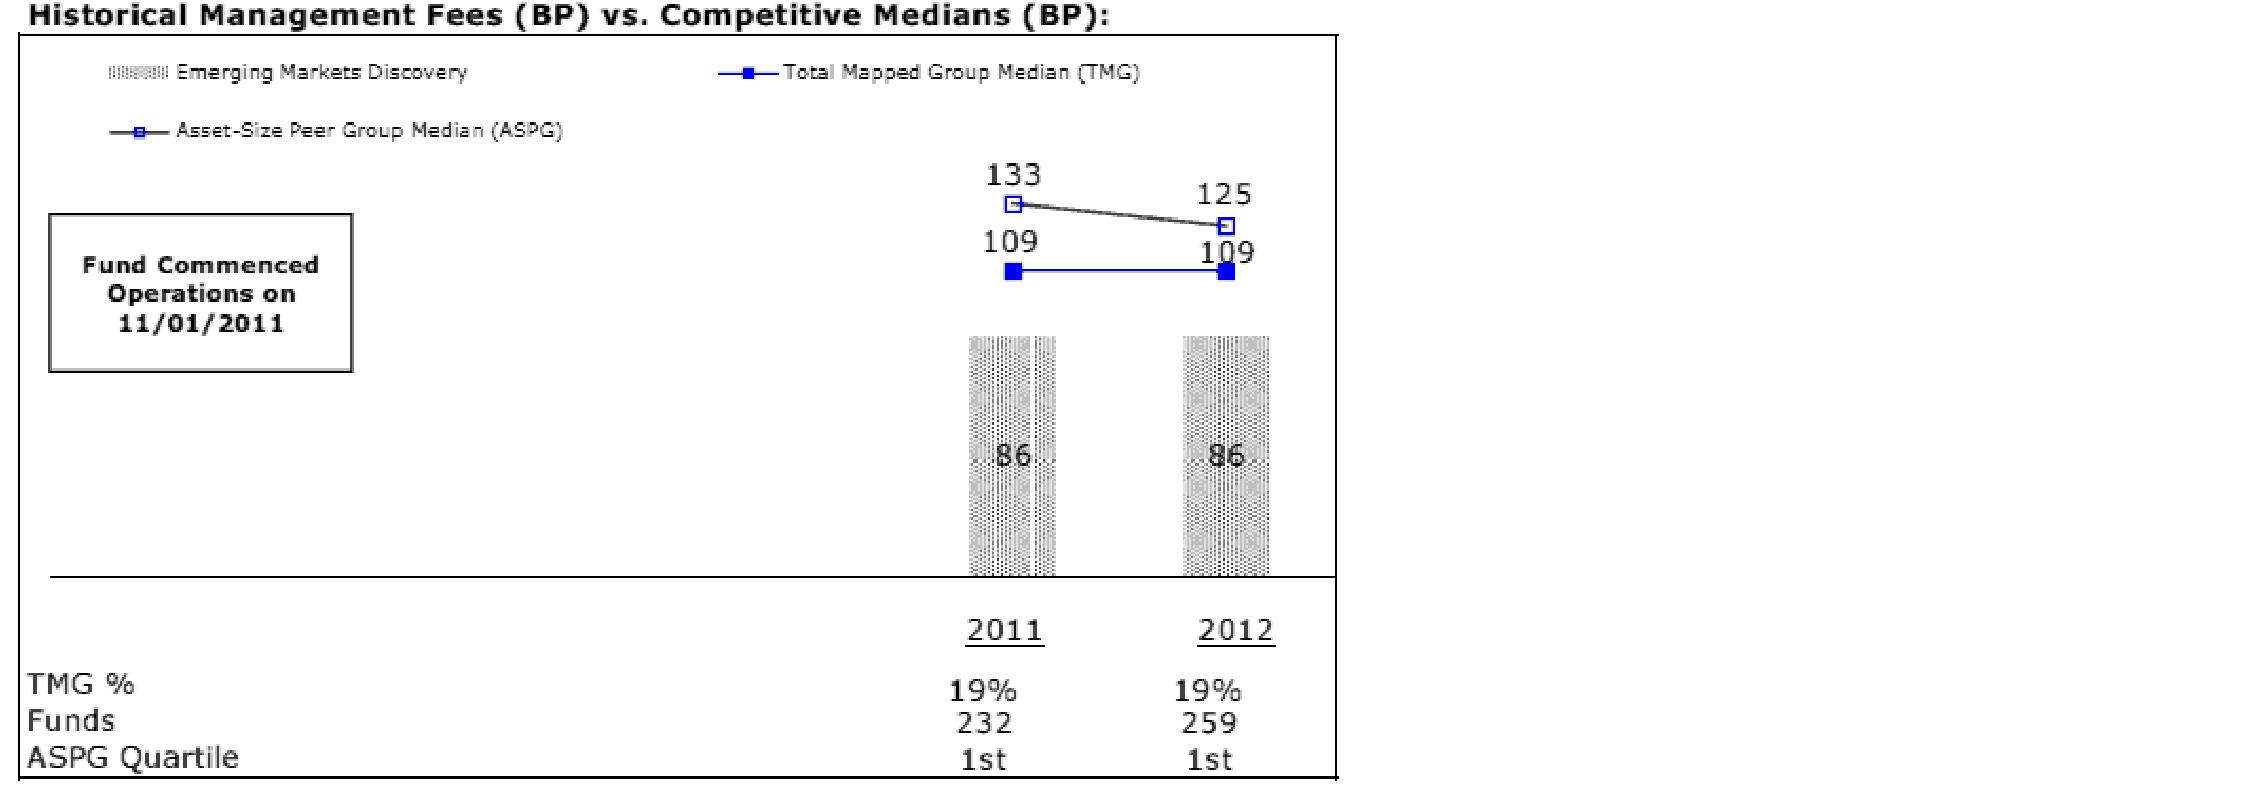
Fidelity Total Emerging Markets Fund
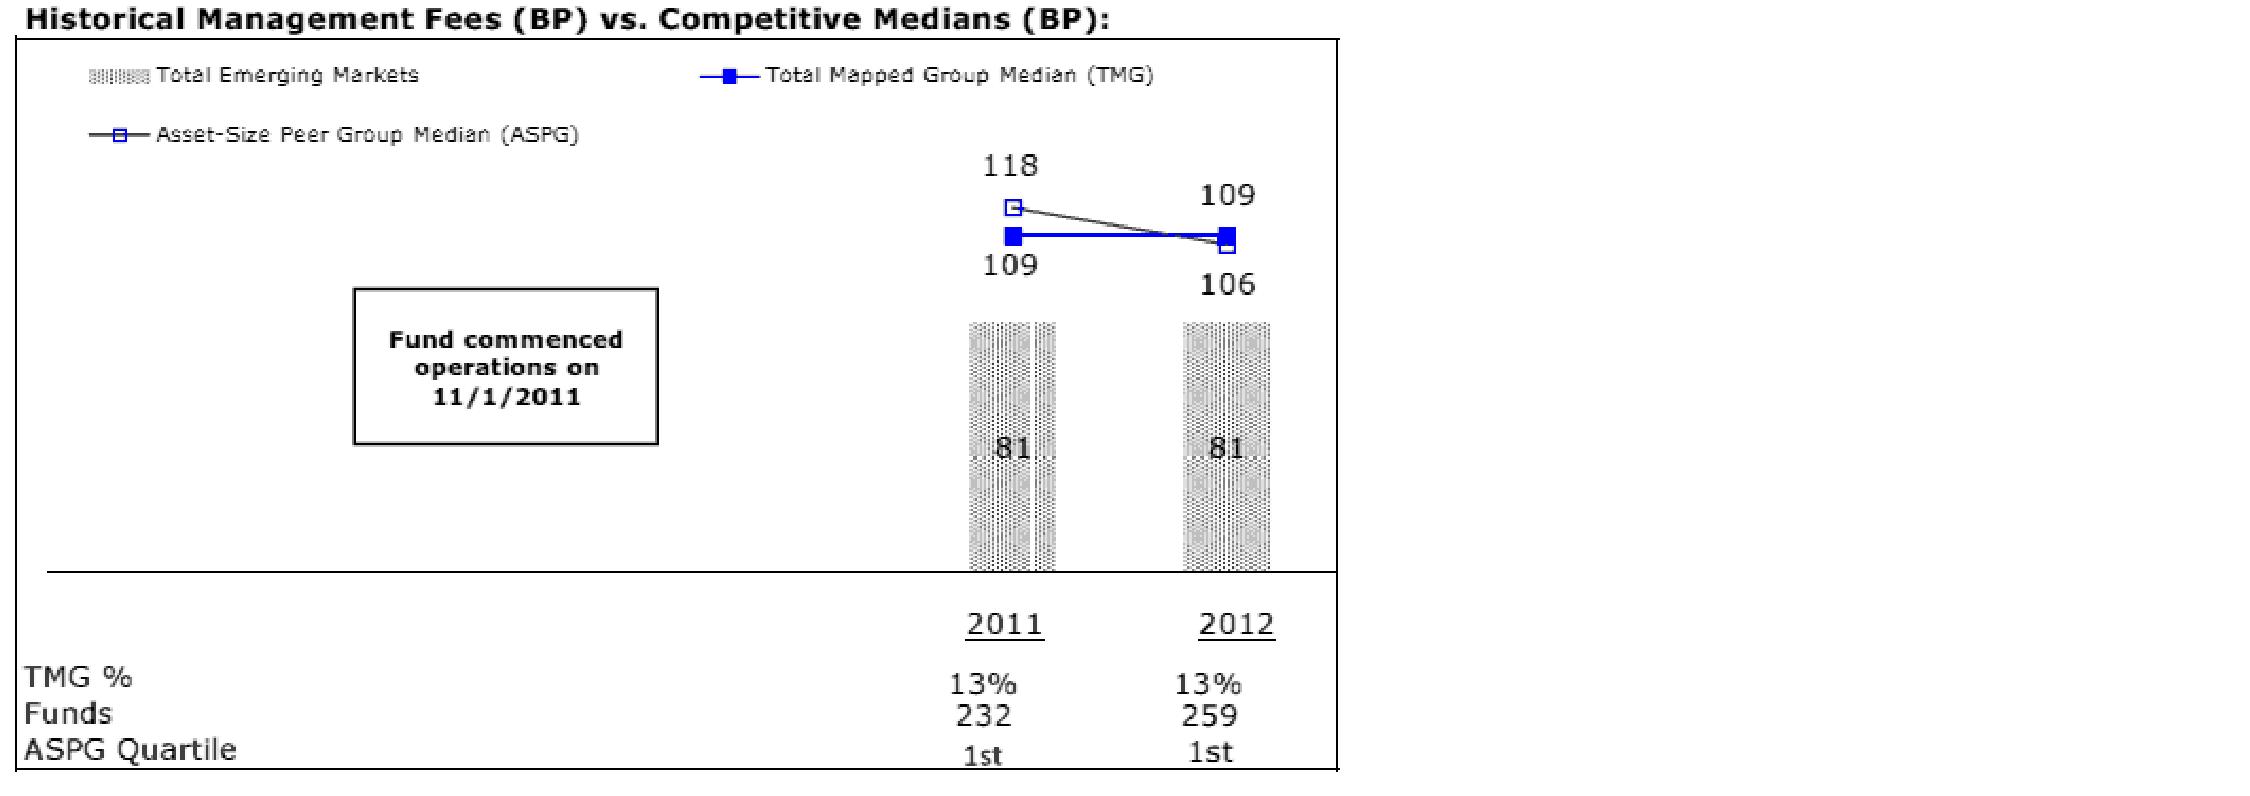
The Board noted that each fund's management fee ranked below the median of its Total Mapped Group and below the median of its ASPG for 2012.
Based on its review, the Board concluded that each fund's management fee is fair and reasonable in light of the services that the fund receives and the other factors considered.
Annual Report
Total Expense Ratio. In its review of the total expense ratio of each class of each fund, the Board considered the fund's management fee as well as other fund or class expenses, as applicable, such as transfer agent fees, pricing and bookkeeping fees, fund-paid 12b-1 fees, and custodial, legal, and audit fees. The Board also noted the effects of any waivers and reimbursements on fees and expenses. As part of its review, the Board also considered the current and historical total expense ratios of each class of each fund compared to competitive fund median expenses. Each class of each fund is compared to those funds and classes in the Total Mapped Group (used by the Board for management fee comparisons) that have a similar sales load structure.
The Board noted that each fund offers multiple classes, each of which has a different sales load and 12b-1 fee structure, and that the multiple structures are intended to offer a range of pricing options for the intermediary market. The Board also noted that the total expense ratios of the classes of each fund vary primarily by the level of their 12b-1 fees, although differences in transfer agent fees may also cause expenses to vary from class to class.
The Board noted that the total expense ratio of each of Class A and the retail class of each fund ranked below its competitive median for the period and the total expense ratio of each of Class T, Class C, and Institutional Class ranked above its competitive median for the period. The Board considered that, in general, various factors can affect total expense ratios. The Board noted that the total expense ratio of Class T was above the competitive median primarily because of higher 12b-1 fees on Class T. Class T has a higher 12b-1 fee, but a lower front-end sales charge, than traditionally priced front-end sales charge classes. The Board considered that Class T is primarily sold load-waived in the retirement plan market where its 0.50% 12b-1 fee is comparable to competing no-load, higher 12b-1 fee classes designed specifically for retirement plans.
The Board further considered that FMR contractually agreed to reimburse Class A, Class T, Class C, Institutional Class and the retail class of Fidelity Emerging Markets Discovery Fund to the extent that total operating expenses (excluding interest, taxes, certain securities lending costs, brokerage commissions, extraordinary expenses, and acquired fund fees and expenses, if any), as a percentage of their respective average net assets, exceed 1.70%, 1.95%, 2.45%, 1.45%, and 1.45% through December 31, 2013.
The Board further considered that FMR contractually agreed to reimburse Class A, Class T, Class C, Institutional Class, and the retail class of Fidelity Total Emerging Markets Fund to the extent that total operating expenses (excluding interest, taxes, certain securities lending costs, brokerage commissions, extraordinary expenses, and acquired fund fees and expenses, if any), as a percentage of their respective average net assets, exceed 1.65%, 1.90%, 2.40%, 1.40%, and 1.40% through December 31, 2013.
Fees Charged to Other Fidelity Clients. The Board also considered Fidelity fee structures and other information with respect to clients of FMR and its affiliates, such as other mutual funds advised or subadvised by FMR or its affiliates, pension plan clients, and other institutional clients. The Board noted the findings of the 2013 ad hoc joint committee (created with the board of other Fidelity funds), which reviewed and compared Fidelity's institutional investment advisory business with its business of providing services to the Fidelity funds, including the differences in services provided, fees charged, and costs incurred, as well as competition in their respective marketplaces.
Annual Report
Board Approval of Investment Advisory Contracts and
Management Fees - continued
Based on its review of total expense ratios and fees charged to other Fidelity clients, the Board concluded that the total expense ratio of each class of each fund was reasonable, although in some cases above the median of the universe presented for comparison, in light of the services that the fund and its shareholders receive and the other factors considered.
Costs of the Services and Profitability. The Board considered the revenues earned and the expenses incurred by Fidelity in conducting the business of developing, marketing, distributing, managing, administering and servicing each fund and servicing each fund's shareholders. The Board also considered the level of Fidelity's profits in respect of all the Fidelity funds.
On an annual basis, FMR presents to the Board Fidelity's profitability for each fund. Fidelity calculates the profitability for each fund, as well as aggregate profitability for groups of Fidelity funds and all Fidelity funds, using a series of detailed revenue and cost allocation methodologies which originate with the books and records of Fidelity on which Fidelity's audited financial statements are based. The Audit Committee of the Board reviews any significant changes from the prior year's methodologies.
PricewaterhouseCoopers LLP (PwC), independent registered public accounting firm and auditor to Fidelity and certain Fidelity funds, has been engaged annually by the Board as part of the Board's assessment of Fidelity's profitability analysis. PwC's engagement includes the review and assessment of the methodologies used by Fidelity in determining the revenues and expenses attributable to Fidelity's mutual fund business, and completion of agreed-upon procedures surrounding the mathematical accuracy of fund profitability and its conformity to allocation methodologies. After considering PwC's reports issued under the engagement and information provided by Fidelity, the Board concluded that while other allocation methods may also be reasonable, Fidelity's profitability methodologies are reasonable in all material respects.
The Board also reviewed Fidelity's non-fund businesses and fall-out benefits related to the mutual fund business as well as cases where Fidelity's affiliates may benefit from or be related to the funds' business.
The Board considered the costs of the services provided by and the profits realized by Fidelity in connection with the operation of each fund and was satisfied that the profitability was not excessive in the circumstances.
Annual Report
Economies of Scale. The Board considered whether there have been economies of scale in respect of the management of the Fidelity funds, whether the Fidelity funds (including each fund) have appropriately benefited from any such economies of scale, and whether there is potential for realization of any further economies of scale. The Board considered the extent to which each fund will benefit from economies of scale through increased services to the fund, through waivers or reimbursements, or through fee or expense reductions. The Board also noted that in 2009, it and the board of other Fidelity funds created an ad hoc committee (the Economies of Scale Committee) to analyze whether FMR attains economies of scale in respect of the management and servicing of the Fidelity funds, whether the Fidelity funds have appropriately benefited from such economies of scale, and whether there is potential for realization of any further economies of scale.
The Board recognized that each fund's management contract incorporates a "group fee" structure, which provides for lower group fee rates as total fund assets under FMR's management increase, and for higher group fee rates as total fund assets under FMR's management decrease. FMR calculates the group fee rates based on a tiered asset "breakpoint" schedule that varies based on asset class. The Board considered that the group fee is designed to deliver the benefits of economies of scale to fund shareholders when total Fidelity fund assets increase, even if assets of any particular fund are unchanged or have declined, because some portion of Fidelity's costs are attributable to services provided to all Fidelity funds, and all funds benefit if those costs can be allocated among more assets. The Board concluded that, given the group fee structure, fund shareholders will benefit from lower management fees as assets under FMR's management increase at the fund complex level, regardless of whether Fidelity achieves any such economies of scale.
The Board concluded, taking into account the analysis of the Economies of Scale Committee, that economies of scale, if any, are being appropriately shared between fund shareholders and Fidelity.
Amendment to Description of Group Fee Rate. At its July 2013 meeting, the Board voted to approve an amendment to each fund's management contract to modify the description of the "group fee rate" effective August 1, 2013. The Board noted that under the prior description in the contract, the group fee rate was based on the average net assets of all registered investment companies with which FMR has management contracts. Under the contract's tiered asset breakpoint schedule, the group fee rate is lower as total fund assets under FMR's management increase, and higher as total fund assets under FMR's management decrease. The Board considered that the prior description would have excluded the assets of 64 Fidelity sector funds from the group fee rate calculation once Fidelity SelectCo, LLC, an affiliate of FMR, assumed management responsibilities for those funds. The Board noted that modifying the description of the group fee rate to continue to include the assets of those 64 funds for purposes of determining group fee rate breakpoints would avoid an immediate adverse impact on the group fee rate for any fund.
Annual Report
Board Approval of Investment Advisory Contracts and
Management Fees - continued
Additional Information Requested by the Board. In order to develop fully the factual basis for consideration of the Fidelity funds' Advisory Contracts, the Board requested and received additional information on certain topics, including: (i) fund performance trends and Fidelity's long-term strategies for certain funds; (ii) the potential to further rationalize the Fidelity fund lineup with the possibility of achieving savings for the funds and Fidelity; (iii) the methodology with respect to competitive fund data and peer group classifications; (iv) the arrangements with, and performance of, certain sub-advisers on behalf of the Fidelity funds, as well as certain proposed participating affiliate arrangements; (v) the realization of fall-out benefits in certain Fidelity business units; (vi) Fidelity's group fee structures, including the rationale for the individual fee rates of certain categories of funds and the definition of group assets; (vii) trends regarding industry use of performance fee structures and the performance adjustment methodologies applicable to the Fidelity funds; (viii) additional competitive analysis regarding the total expenses for certain classes; and (ix) fund profitability methodology, including Fidelity's cost allocation methodology, and the impact of certain factors on fund profitability results.
Based on its evaluation of all of the conclusions noted above, and after considering all factors it believed relevant, the Board ultimately concluded that the advisory fee structures are fair and reasonable, and that each fund's Advisory Contracts should be renewed.
Annual Report
Investment Adviser
Fidelity Management &
Research Company
Boston, MA
Investment Sub-Advisers
FMR Co., Inc.
Fidelity Management & Research
(U.K.) Inc.
Fidelity Management & Research
(Hong Kong) Limited
Fidelity Management & Research
(Japan) Inc.
FIL Investments (Japan) Limited
FIL Investment Advisors
FIL Investment Advisors
(UK) Limited
General Distributor
Fidelity Distributors Corporation
Smithfield, RI
Transfer and Service Agents
Fidelity Investments Institutional
Operations Company, Inc.
Boston, MA
Fidelity Service Company, Inc.
Boston, MA
Custodian
The Northern Trust Company
Chicago, IL
The Fidelity Telephone Connection
Mutual Fund 24-Hour Service
Exchanges/Redemptions
and Account Assistance 1-800-544-6666
Product Information 1-800-544-6666
Retirement Accounts 1-800-544-4774
(8 a.m. - 9 p.m.)
TDD Service 1-800-544-0118
for the deaf and hearing impaired
(9 a.m. - 9 p.m. Eastern time)
Fidelity Automated Service
Telephone (FAST®)
1-800-544-5555
Automated line for quickest service
(Fidelity Investment logo)(registered trademark)
Corporate Headquarters
245 Summer St., Boston, MA 02210
www.fidelity.com
EMD-TEK-UANN-1213
1.931236.101
(Fidelity Investment logo)(registered trademark)
Fidelity Advisor®
Emerging Markets Discovery
Fund - Class A, Class T,
and Class C
Annual Report
October 31, 2013
(Fidelity Cover Art)
Class A, Class T, and
Class C are classes of
Fidelity® Emerging
Markets Discovery Fund
Contents
Performance | (Click Here) | How the fund has done over time. |
Management's Discussion of Fund Performance | (Click Here) | The Portfolio Manager's review of fund performance and strategy. |
Shareholder Expense Example | (Click Here) | An example of shareholder expenses. |
Investment Changes | (Click Here) | A summary of major shifts in the fund's investments over the past six months. |
Investments | (Click Here) | A complete list of the fund's investments with their market values. |
Financial Statements | (Click Here) | Statements of assets and liabilities, operations, and changes in net assets, as well as financial highlights. |
Notes | (Click Here) | Notes to the financial statements. |
Report of Independent Registered Public Accounting Firm | (Click Here) | |
Trustees and Officers | (Click Here) | |
Distributions | (Click Here) | |
Board Approval of Investment Advisory Contracts and Management Fees | (Click Here) | |
To view a fund's proxy voting guidelines and proxy voting record for the 12-month period ended June 30, visit http://www.fidelity.com/proxyvotingresults or visit the Securities and Exchange Commission's (SEC) web site at http://www.sec.gov. You may also call 1-877-208-0098 to request a free copy of the proxy voting guidelines.
Standard & Poor's, S&P and S&P 500 are registered service marks of The McGraw-Hill Companies, Inc. and have been licensed for use by Fidelity Distributors Corporation.
Other third-party marks appearing herein are the property of their respective owners.
All other marks appearing herein are registered or unregistered trademarks or service marks of FMR LLC or an affiliated company. © 2013 FMR LLC. All rights reserved.
Annual Report
This report and the financial statements contained herein are submitted for the general information of the shareholders of the fund. This report is not authorized for distribution to prospective investors in the fund unless preceded or accompanied by an effective prospectus.
A fund files its complete schedule of portfolio holdings with the SEC for the first and third quarters of each fiscal year on Form N-Q. Forms N-Q are available on the SEC's web site at http://www.sec.gov. A fund's Forms N-Q may be reviewed and copied at the SEC's Public Reference Room in Washington, DC. Information regarding the operation of the SEC's Public Reference Room may be obtained by calling 1-800-SEC-0330. For a complete list of a fund's portfolio holdings, view the most recent holdings listing, semiannual report, or annual report on Fidelity's web site at http://www.fidelity.com, http://www.advisor.fidelity.com, or http://www.401k.com, as applicable.
NOT FDIC INSURED • MAY LOSE VALUE • NO BANK GUARANTEE
Neither the fund nor Fidelity Distributors Corporation is a bank.
Annual Report
Average annual total return reflects the change in the value of an investment, assuming reinvestment of the class' distributions from dividend income and capital gains (the profits earned upon the sale of securities that have grown in value, if any) and assuming a constant rate of performance each year. The $10,000 table and the fund's returns do not reflect the deduction of taxes that a shareholder would pay on fund distributions or the redemption of fund shares. During periods of reimbursement by Fidelity, a fund's total return will be greater than it would be had the reimbursement not occurred. How a fund did yesterday is no guarantee of how it will do tomorrow.
Average Annual Total Returns
Periods ended October 31, 2013 | Past 1
year | Life of
fund A |
Class A (incl. 5.75% sales charge) | 1.04% | 9.65% |
Class T (incl. 3.50% sales charge) | 3.13% | 10.66% |
Class C (incl. contingent deferred sales charge) | 5.32% | 12.10% |
A From November 1, 2011
$10,000 Over Life of Fund
Let's say hypothetically that $10,000 was invested in Fidelity Advisor® Emerging Markets Discovery Fund - Class A on November 1, 2011, when the fund started, and the current 5.75% sales charge was paid. The chart shows how the value of your investment would have changed, and also shows how the MSCI® Emerging Markets SMID Cap Index performed over the same period.
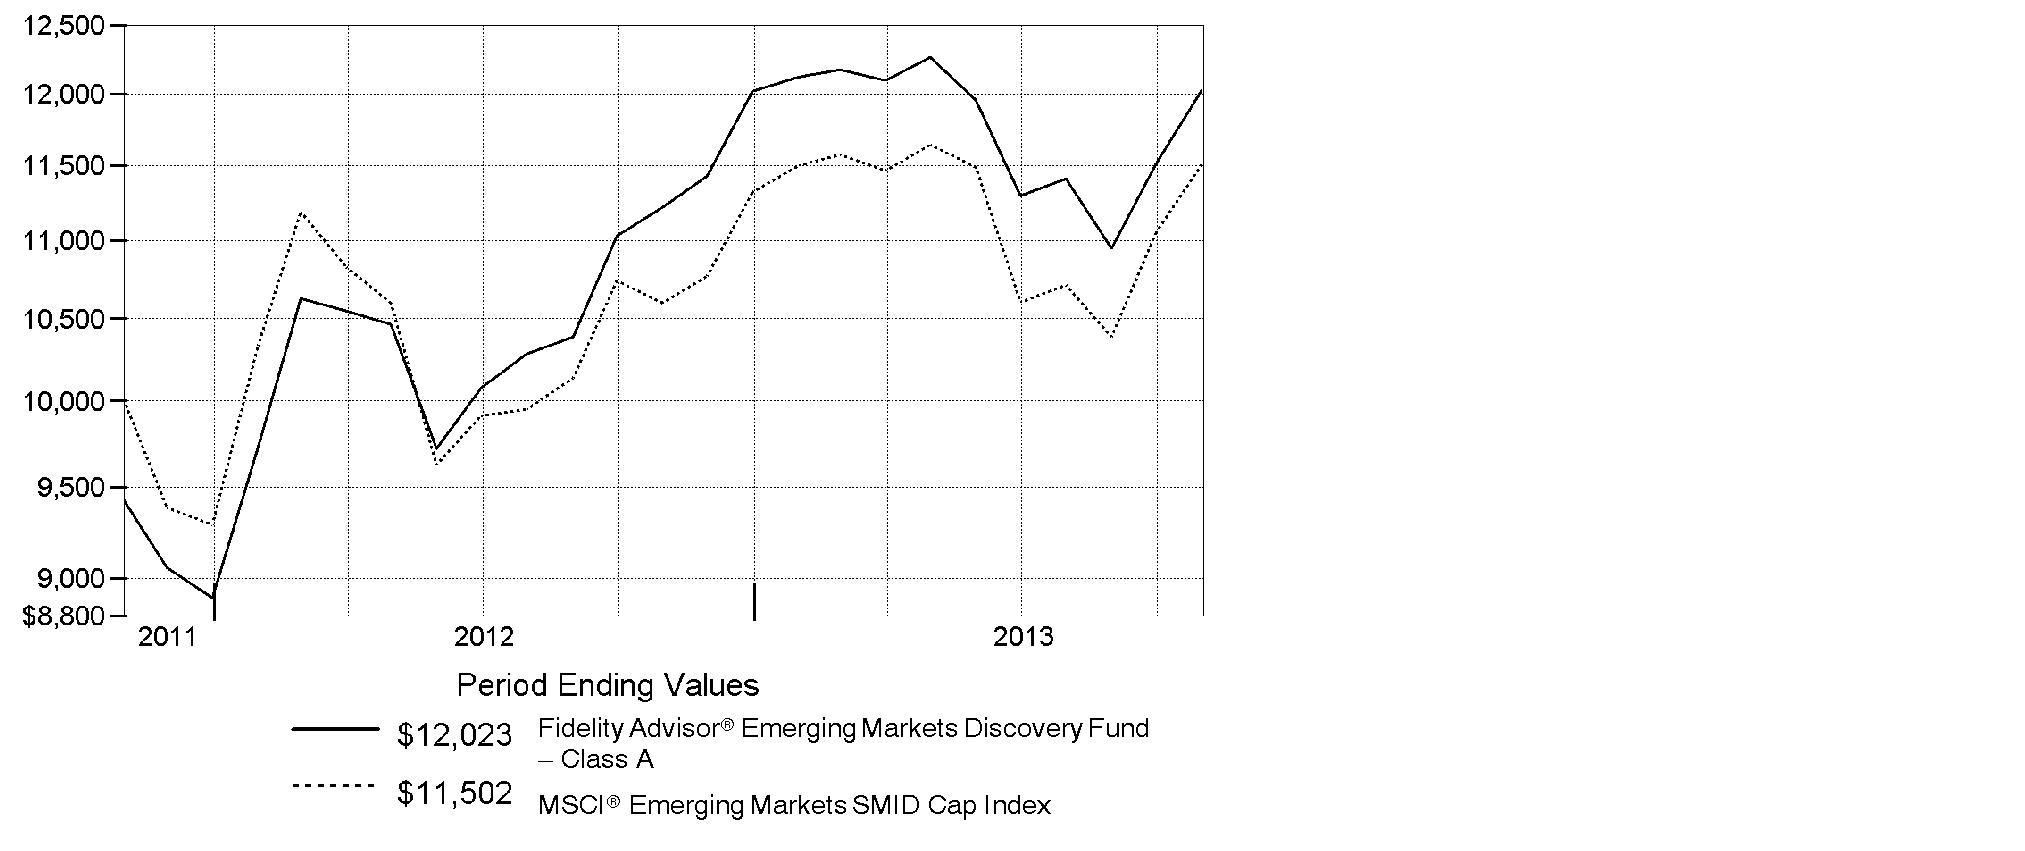
Annual Report
Market Recap: On balance, global equity markets remained upbeat for the 12-month period ending October 31, 2013. The MSCI® ACWI® (All Country World Index) Index gained 23.75% for the period, amid investor preference for higher-risk assets. The period was not without turbulence, however. In the spring and summer, central banks worldwide, especially in the U.S. and China, made clear their intentions to maintain accommodative monetary policies. That stance, combined with modest cyclical improvements around the globe and generally low valuations, underpinned the broad rally in equities. Europe (+32%) shone brightly, with most markets in the region - large and small - registering solid, index-beating gains. Another bright spot was Japan, which, despite a struggling yen and taking a second-half breather, posted a 34% result for the full year. The U.S. - by far the index's biggest constituent - also outperformed the global market with a roughly 28% advance. Meanwhile, Asia-Pacific ex Japan (+14%) lagged, hurt in part by a slowdown in Australia's mining industry as well as currency headwinds. Foreign-exchange and commodity weakness also curbed results in resource-heavy Canada and emerging markets (EM), both of which were up 7%. Country-level EM performance diverged meaningfully for the period, as evidenced by performance in Brazil (-1%), Russia (+12%), India (+1%) and China (+8%).
Comments from Ashish Swarup, Portfolio Manager of Fidelity Advisor® Emerging Markets Discovery Fund: For the year, the fund's Class A, Class T and Class C shares advanced 7.20%, 6.87% and 6.32%, respectively (excluding sales charges), trailing the 8.55% gain of the MSCI® Emerging Markets SMID Cap Index. Versus the index, underweighting Malaysia and China hurt, as did stock picks in South Korea. Looking at individual stocks, I saw opportunity in South Africa-based gold miner and non-index investment AngloGold Ashanti. I considered the company to be of high quality, well run and shareholder friendly, and the stock has historically been a steady performer. Unfortunately, shares fell this period alongside the price of gold. I sold AngloGold in May. Conversely, an overweighting in St. Shine Optical was a winner. The contact lens and glasses maker based in Taiwan consistently gained market share due to the high quality and reliability of its products. I was attracted to the company's good management team and high return on equity of its business, as well as the stock's attractive valuation when I purchased it prior to the beginning of the reporting period. The stock performed very well during the past 12 months, and as its price continued to appreciate, I sold some of St. Shine to take profits.
The views expressed above reflect those of the portfolio manager(s) only through the end of the period as stated on the cover of this report and do not necessarily represent the views of Fidelity or any other person in the Fidelity organization. Any such views are subject to change at any time based upon market or other conditions and Fidelity disclaims any responsibility to update such views. These views may not be relied on as investment advice and, because investment decisions for a Fidelity fund are based on numerous factors, may not be relied on as an indication of trading intent on behalf of any Fidelity fund.
Annual Report
Fidelity Emerging Markets Discovery Fund
Shareholder Expense Example
As a shareholder of the Fund, you incur two types of costs: (1) transaction costs, including sales charges (loads) on purchase payments or redemption proceeds, redemption fees and (2) ongoing costs, including management fees, distribution and/or service (12b-1) fees and other Fund expenses. This Example is intended to help you understand your ongoing costs (in dollars) of investing in the Fund and to compare these costs with the ongoing costs of investing in other mutual funds.
The Example is based on an investment of $1,000 invested at the beginning of the period and held for the entire period (May 1, 2013 to October 31, 2013).
Actual Expenses
The first line of the accompanying table for each class of the Fund provides information about actual account values and actual expenses. You may use the information in this line, together with the amount you invested, to estimate the expenses that you paid over the period. Simply divide your account value by $1,000.00 (for example, an $8,600 account value divided by $1,000.00 = 8.6), then multiply the result by the number in the first line for a class of the Fund under the heading entitled "Expenses Paid During Period" to estimate the expenses you paid on your account during this period. A small balance maintenance fee of $12.00 that is charged once a year may apply for certain accounts with a value of less than $2,000. This fee is not included in the table below. If it was, the estimate of expenses you paid during the period would be higher, and your ending account value lower, by this amount. In addition, the Fund, as a shareholder in the underlying Fidelity Central Funds, will indirectly bear its pro-rata share of the fees and expenses incurred by the underlying Fidelity Central Funds. These fees and expenses are not included in the Fund's annualized expense ratio used to calculate the expense estimate in the table below.
Hypothetical Example for Comparison Purposes
The second line of the accompanying table for each class of the Fund provides information about hypothetical account values and hypothetical expenses based on a Class' actual expense ratio and an assumed rate of return of 5% per year before expenses, which is not the Class' actual return. The hypothetical account values and expenses may not be used to estimate the actual ending account balance or expenses you paid for the period. You may use this information to compare the ongoing costs of investing in the Fund and other funds. To do so, compare this 5% hypothetical example with the 5% hypothetical examples that appear in the shareholder reports of the other funds. A small balance maintenance fee of $12.00 that is charged once a year may apply for certain accounts with a value of less than $2,000. This fee is not included in the table below. If it was, the estimate of expenses you paid during the period would be higher, and your ending account value lower, by this amount. In addition, the Fund, as a shareholder in the underlying Fidelity Central Funds, will indirectly bear its pro-rata share of the fees and expenses incurred by the underlying Fidelity Central Funds. These fees and expenses are not included in the Fund's annualized expense ratio used to calculate the expense estimate in the table below.
Please note that the expenses shown in the table are meant to highlight your ongoing costs only and do not reflect any transaction costs. Therefore, the second line of the table is useful in comparing ongoing costs only, and will not help you determine the relative total costs of owning different funds. In addition, if these transactional costs were included, your costs would have been higher.
Annual Report
| Annualized
Expense RatioB | Beginning
Account Value
May 1, 2013 | Ending
Account Value
October 31, 2013 | Expenses Paid
During Period*
May 1, 2013
to October 31, 2013 |
Class A | 1.70% | | | |
Actual | | $ 1,000.00 | $ 980.40 | $ 8.49 |
HypotheticalA | | $ 1,000.00 | $ 1,016.64 | $ 8.64 |
Class T | 1.95% | | | |
Actual | | $ 1,000.00 | $ 978.80 | $ 9.73 |
HypotheticalA | | $ 1,000.00 | $ 1,015.38 | $ 9.91 |
Class C | 2.45% | | | |
Actual | | $ 1,000.00 | $ 977.10 | $ 12.21 |
HypotheticalA | | $ 1,000.00 | $ 1,012.85 | $ 12.43 |
Emerging Markets Discovery | 1.45% | | | |
Actual | | $ 1,000.00 | $ 981.20 | $ 7.24 |
HypotheticalA | | $ 1,000.00 | $ 1,017.90 | $ 7.38 |
Institutional Class | 1.45% | | | |
Actual | | $ 1,000.00 | $ 982.00 | $ 7.24 |
HypotheticalA | | $ 1,000.00 | $ 1,017.90 | $ 7.38 |
A 5% return per year before expenses
B Annualized expense ratio reflects expenses net of applicable fee waivers.
* Expenses are equal to each Class' annualized expense ratio, multiplied by the average account value over the period, multiplied by 184/365 (to reflect the one-half year period).
Annual Report
Fidelity Emerging Markets Discovery Fund
Investment Changes (Unaudited)
Top Five Stocks as of October 31, 2013 |
| % of fund's
net assets | % of fund's net assets
6 months ago |
E-Mart Co. Ltd. (Korea (South), Food & Staples Retailing) | 1.7 | 1.0 |
Unified-President Enterprises Corp. (Taiwan, Food Products) | 1.4 | 1.2 |
China Insurance International Holdings Co. Ltd. (Hong Kong, Insurance) | 1.4 | 0.8 |
Compania Cervecerias Unidas SA sponsored ADR (Chile, Beverages) | 1.4 | 1.0 |
LG Household & Health Care Ltd. (Korea (South), Household Products) | 1.4 | 1.1 |
| 7.3 | |
Top Five Market Sectors as of October 31, 2013 |
| % of fund's
net assets | % of fund's net assets
6 months ago |
Financials | 25.8 | 23.8 |
Industrials | 19.2 | 17.2 |
Consumer Staples | 16.9 | 17.3 |
Consumer Discretionary | 15.1 | 16.7 |
Health Care | 6.9 | 5.3 |
Top Five Countries as of October 31, 2013 |
(excluding cash equivalents) | % of fund's
net assets | % of fund's net assets
6 months ago |
India | 13.3 | 10.4 |
Taiwan | 11.8 | 22.7 |
South Africa | 10.4 | 11.0 |
Korea (South) | 9.9 | 12.8 |
Chile | 7.7 | 5.8 |
Percentages are adjusted for the effect of open futures contracts, if applicable. |
Asset Allocation (% of fund's net assets) |
As of October 31, 2013 | As of April 30, 2013 |
 | Stocks 97.3% | | | Stocks 98.8% | |
 | Short-TermInvestments andNet Other Assets (Liabilities) 2.7% | |  | Short-TermInvestments andNet Other Assets (Liabilities) 1.2% | |

Annual Report
Fidelity Emerging Markets Discovery Fund
Investments October 31, 2013
Showing Percentage of Net Assets
Common Stocks - 96.3% |
| Shares | | Value |
Bermuda - 6.9% |
China Foods Ltd. | 1,566,000 | | $ 710,992 |
Shangri-La Asia Ltd. | 520,000 | | 952,406 |
Silverlake Axis Ltd. Class A | 1,533,000 | | 888,553 |
Tai Cheung Holdings Ltd. | 1,017,000 | | 771,309 |
Texwinca Holdings Ltd. | 1,228,000 | | 1,256,035 |
Trinity Ltd. | 1,246,000 | | 466,065 |
Wilson Sons Ltd. unit | 81,855 | | 1,023,096 |
Yue Yuen Industrial (Holdings) Ltd. | 471,000 | | 1,293,989 |
TOTAL BERMUDA | | 7,362,445 |
Brazil - 4.6% |
BHG SA (Brazil Hospitality Group) (a) | 106,800 | | 781,859 |
BTG Pactual Participations Ltd. unit | 48,000 | | 642,157 |
Fleury SA | 121,600 | | 941,773 |
Hypermarcas SA | 119,000 | | 1,038,501 |
Iguatemi Empresa de Shopping Centers SA | 72,200 | | 829,904 |
Terna Participacoes SA unit | 74,000 | | 718,463 |
TOTAL BRAZIL | | 4,952,657 |
Cayman Islands - 6.9% |
China Lodging Group Ltd. ADR (a) | 46,300 | | 1,017,674 |
Chu Kong Petroleum & Natural Gas Steel Pipe Holdings Ltd. | 1,000,000 | | 374,049 |
Ginko International Co. Ltd. | 29,000 | | 552,709 |
Gourmet Master Co. Ltd. | 152,000 | | 1,012,128 |
Greatview Aseptic Pack Co. Ltd. | 1,319,000 | | 830,223 |
Lifestyle International Holdings Ltd. | 113,000 | | 246,318 |
Samson Holding Ltd. | 7,877,000 | | 1,097,273 |
SITC International Holdings Co. Ltd. | 1,685,000 | | 712,860 |
Springland International Holdings Ltd. | 1,264,000 | | 692,893 |
Tao Heung Holdings Ltd. | 1,128,000 | | 865,678 |
TOTAL CAYMAN ISLANDS | | 7,401,805 |
Chile - 7.7% |
Compania Cervecerias Unidas SA sponsored ADR | 55,107 | | 1,470,806 |
Embotelladora Andina SA sponsored ADR | 32,153 | | 1,099,633 |
Empresa Nacional de Telecomunicaciones SA (ENTEL) | 60,226 | | 926,816 |
Isapre CruzBlanca SA | 1,312,507 | | 896,528 |
Parque Arauco SA | 431,517 | | 833,129 |
Quinenco SA | 456,526 | | 1,220,968 |
Quinenco SA rights 11/5/13 (a) | 108,014 | | 42,172 |
Common Stocks - continued |
| Shares | | Value |
Chile - continued |
Sociedad Matriz SAAM SA | 9,377,011 | | $ 942,552 |
Sonda SA | 290,100 | | 753,212 |
TOTAL CHILE | | 8,185,816 |
China - 1.0% |
China Communications Services Corp. Ltd. (H Shares) | 1,116,000 | | 683,735 |
Shandong Weigao Medical Polymer Co. Ltd. (H Shares) | 408,000 | | 383,108 |
TOTAL CHINA | | 1,066,843 |
Colombia - 0.6% |
Bolsa de Valores de Colombia | 48,878,613 | | 622,492 |
Hong Kong - 3.6% |
China Insurance International Holdings Co. Ltd. (a) | 946,000 | | 1,476,409 |
Dah Chong Hong Holdings Ltd. | 893,000 | | 757,892 |
HKT Trust / HKT Ltd. unit | 984,000 | | 912,545 |
Singamas Container Holdings Ltd. | 2,936,000 | | 685,433 |
TOTAL HONG KONG | | 3,832,279 |
Hungary - 1.1% |
Richter Gedeon PLC | 62,400 | | 1,186,549 |
India - 13.3% |
Bank of Baroda | 69,571 | | 725,808 |
Container Corp. of India Ltd. | 76,245 | | 936,545 |
Credit Analysis & Research Ltd. | 100,032 | | 1,080,201 |
Grasim Industries Ltd. | 19,771 | | 929,352 |
IDFC Ltd. | 648,827 | | 1,113,421 |
Indian Hotels Co. Ltd. | 938,336 | | 748,397 |
Ipca Laboratories Ltd. | 90,219 | | 1,007,944 |
Jain Irrigation Systems Ltd. | 760,572 | | 825,689 |
Mahindra Lifespace Developers Ltd. | 93,500 | | 649,921 |
Motilal Oswal Financial Services Ltd. | 685,225 | | 773,914 |
Prestige Estates Projects Ltd. (a) | 373,175 | | 866,265 |
Punjab National Bank | 80,137 | | 743,345 |
SKS Microfinance Ltd. (a) | 325,922 | | 823,479 |
Tech Mahindra Ltd. (a) | 54,154 | | 1,363,033 |
Thermax Ltd. (a) | 76,141 | | 787,802 |
Tube Investments of India Ltd. | 354,155 | | 844,813 |
TOTAL INDIA | | 14,219,929 |
Indonesia - 4.1% |
PT Astra Graphia Tbk | 7,177,500 | | 1,056,961 |
PT Bank Tabungan Pensiunan Nasional Tbk (a) | 543,500 | | 210,938 |
Common Stocks - continued |
| Shares | | Value |
Indonesia - continued |
PT Hero Supermarket Tbk (a) | 2,698,000 | | $ 861,632 |
PT Holcim Indonesia Tbk | 3,289,000 | | 751,309 |
PT Tempo Scan Pacific Tbk | 2,063,000 | | 713,742 |
PT Wijaya Karya Persero Tbk | 4,610,500 | | 785,284 |
TOTAL INDONESIA | | 4,379,866 |
Kenya - 0.8% |
East African Breweries Ltd. | 228,200 | | 852,909 |
Korea (South) - 9.9% |
Binggrea Co. Ltd. | 8,872 | | 748,194 |
E-Mart Co. Ltd. | 7,626 | | 1,825,156 |
Kiwoom Securities Co. Ltd. | 25,329 | | 1,326,975 |
Korea Plant Service & Engineering Co. Ltd. | 27,617 | | 1,400,002 |
LG Corp. | 24,155 | | 1,427,067 |
LG Household & Health Care Ltd. | 2,792 | | 1,449,562 |
Samsung Fire & Marine Insurance Co. Ltd. | 2,907 | | 679,308 |
Shinsegae Food Co. Ltd. | 10,022 | | 839,510 |
TK Corp. (a) | 45,428 | | 922,446 |
TOTAL KOREA (SOUTH) | | 10,618,220 |
Malaysia - 2.4% |
Oldtown Bhd | 1,036,900 | | 814,672 |
Oriental Holdings Bhd | 295,600 | | 827,849 |
YTL Corp. Bhd | 1,866,800 | | 975,834 |
TOTAL MALAYSIA | | 2,618,355 |
Mexico - 1.4% |
Bolsa Mexicana de Valores S.A.B. de CV | 310,300 | | 739,645 |
Consorcio ARA S.A.B. de CV (a) | 1,864,800 | | 728,926 |
TOTAL MEXICO | | 1,468,571 |
Nigeria - 0.7% |
Guaranty Trust Bank PLC | 4,415,484 | | 703,474 |
Philippines - 0.7% |
Security Bank Corp. | 217,510 | | 699,616 |
Poland - 1.2% |
Warsaw Stock Exchange | 87,205 | | 1,262,630 |
Russia - 2.4% |
Moscow Exchange MICEX-RTS OAO | 284,000 | | 542,395 |
Common Stocks - continued |
| Shares | | Value |
Russia - continued |
Synergy Co. (a) | 56,651 | | $ 1,130,167 |
Vozrozhdenie Bank | 71,500 | | 922,991 |
TOTAL RUSSIA | | 2,595,553 |
Singapore - 0.6% |
Ezion Holdings Ltd. | 378,000 | | 681,629 |
South Africa - 10.4% |
Adcorp Holdings Ltd. | 312,400 | | 1,079,532 |
African Bank Investments Ltd. | 583,117 | | 987,472 |
Astral Foods Ltd. | 136,400 | | 1,372,322 |
Bidvest Group Ltd. | 47,500 | | 1,266,714 |
Illovo Sugar Ltd. | 278,400 | | 872,188 |
JSE Ltd. | 100,955 | | 882,963 |
PSG Group Ltd. | 143,700 | | 1,180,949 |
SA Corporate Real Estate Fund | 1,935,200 | | 773,020 |
Tiger Brands Ltd. | 44,025 | | 1,290,128 |
Zeder Investments Ltd. | 3,171,609 | | 1,369,352 |
TOTAL SOUTH AFRICA | | 11,074,640 |
Sri Lanka - 0.7% |
John Keells Holdings Ltd. | 442,958 | | 756,649 |
Taiwan - 11.8% |
Chroma ATE, Inc. | 501,000 | | 1,065,487 |
Cleanaway Co. Ltd. | 142,000 | | 887,651 |
CTCI Corp. | 588,000 | | 1,026,778 |
E.SUN Financial Holdings Co. Ltd. | 1,630,655 | | 1,088,581 |
Formosa Optical Technology Co. Ltd. | 304,000 | | 1,084,423 |
Johnson Health Tech Co. Ltd. | 1,740 | | 4,960 |
Kd Holding Corp. | 134,000 | | 860,404 |
King Slide Works Co. Ltd. | 70,000 | | 618,312 |
MJC Probe, Inc. | 449,000 | | 782,528 |
Pacific Hospital Supply Co. Ltd. | 313,700 | | 1,166,983 |
Sinyi Realty, Inc. | 635,560 | | 1,159,489 |
St. Shine Optical Co. Ltd. | 20,000 | | 587,736 |
Standard Foods Corp. | 26,450 | | 80,873 |
Unified-President Enterprises Corp. | 785,803 | | 1,494,988 |
Wowprime Corp. | 43,500 | | 719,704 |
TOTAL TAIWAN | | 12,628,897 |
Turkey - 3.0% |
Anadolu Efes Biracilik Ve Malt Sanayii A/S | 83,749 | | 1,069,806 |
Common Stocks - continued |
| Shares | | Value |
Turkey - continued |
Enka Insaat ve Sanayi A/S | 403,057 | | $ 1,179,137 |
Is Yatirim Menkul Degerler A/S | 1,385,599 | | 999,505 |
TOTAL TURKEY | | 3,248,448 |
United States of America - 0.5% |
Sohu.com, Inc. (a) | 7,900 | | 528,984 |
TOTAL COMMON STOCKS (Cost $100,982,901) |
102,949,256
|
Nonconvertible Preferred Stocks - 1.0% |
| | | |
Brazil - 1.0% |
Klabin SA (PN) (non-vtg.)
(Cost $996,339) | 201,200 | |
1,068,780
|
Money Market Funds - 3.2% |
| | | |
Fidelity Cash Central Fund, 0.09% (b)
(Cost $3,360,575) | 3,360,575 | |
3,360,575
|
TOTAL INVESTMENT PORTFOLIO - 100.5% (Cost $105,339,815) | | 107,378,611 |
NET OTHER ASSETS (LIABILITIES) - (0.5)% | | (510,079) |
NET ASSETS - 100% | $ 106,868,532 |
Legend |
(a) Non-income producing |
(b) Affiliated fund that is generally available only to investment companies and other accounts managed by Fidelity Investments. The rate quoted is the annualized seven-day yield of the fund at period end. A complete unaudited listing of the fund's holdings as of its most recent quarter end is available upon request. In addition, each Fidelity Central Fund's financial statements, which are not covered by the Fund's Report of Independent Registered Public Accounting Firm, are available on the SEC's website or upon request. |
Affiliated Central Funds |
Information regarding fiscal year to date income earned by the Fund from investments in Fidelity Central Funds is as follows: |
Fund | Income earned |
Fidelity Cash Central Fund | $ 5,709 |
Fidelity Securities Lending Cash Central Fund | 3,614 |
Total | $ 9,323 |
Other Information |
Categorizations in the Schedule of Investments are based on country or territory of incorporation. |
The following is a summary of the inputs used, as of October 31, 2013, involving the Fund's assets and liabilities carried at fair value. The inputs or methodology used for valuing securities may not be an indication of the risk associated with investing in those securities. For more information on valuation inputs, and their aggregation into the levels used in the table below, please refer to the Investment Valuation section in the accompanying Notes to Financial Statements. |
Valuation Inputs at Reporting Date: |
Description | Total | Level 1 | Level 2 | Level 3 |
Investments in Securities: | | | | |
Equities: | | | | |
Consumer Discretionary | $ 16,238,792 | $ 16,238,792 | $ - | $ - |
Consumer Staples | 18,182,529 | 18,182,529 | - | - |
Energy | 1,055,678 | 1,055,678 | - | - |
Financials | 27,481,057 | 26,737,712 | 743,345 | - |
Health Care | 7,437,072 | 6,429,128 | 1,007,944 | - |
Industrials | 20,444,054 | 20,444,054 | - | - |
Information Technology | 5,381,797 | 5,381,797 | - | - |
Materials | 3,579,664 | 2,650,312 | 929,352 | - |
Telecommunication Services | 2,523,096 | 2,523,096 | - | - |
Utilities | 1,694,297 | 1,694,297 | - | - |
Money Market Funds | 3,360,575 | 3,360,575 | - | - |
Total Investments in Securities: | $ 107,378,611 | $ 104,697,970 | $ 2,680,641 | $ - |
See accompanying notes which are an integral part of the financial statements.
Annual Report
Fidelity Emerging Markets Discovery Fund
Statement of Assets and Liabilities
| October 31, 2013 |
| | |
Assets | | |
Investment in securities, at value - See accompanying schedule: Unaffiliated issuers (cost $101,979,240) | $ 104,018,036 | |
Fidelity Central Funds (cost $3,360,575) | 3,360,575 | |
Total Investments (cost $105,339,815) | | $ 107,378,611 |
Cash | | 105,599 |
Foreign currency held at value (cost $10,502) | | 10,477 |
Receivable for investments sold | | 3,062,739 |
Receivable for fund shares sold | | 297,178 |
Dividends receivable | | 39,430 |
Distributions receivable from Fidelity Central Funds | | 464 |
Prepaid expenses | | 451 |
Receivable from investment adviser for expense reductions | | 31,581 |
Other affiliated receivables | | 73,436 |
Other receivables | | 25,607 |
Total assets | | 111,025,573 |
| | |
Liabilities | | |
Payable for investments purchased | $ 3,624,635 | |
Payable for fund shares redeemed | 102,677 | |
Accrued management fee | 75,088 | |
Distribution and service plan fees payable | 3,409 | |
Other affiliated payables | 25,814 | |
Other payables and accrued expenses | 325,418 | |
Total liabilities | | 4,157,041 |
| | |
Net Assets | | $ 106,868,532 |
Net Assets consist of: | | |
Paid in capital | | $ 103,184,879 |
Undistributed net investment income | | 648,420 |
Accumulated undistributed net realized gain (loss) on investments and foreign currency transactions | | 1,216,581 |
Net unrealized appreciation (depreciation) on investments and assets and liabilities in foreign currencies | | 1,818,652 |
Net Assets | | $ 106,868,532 |
See accompanying notes which are an integral part of the financial statements.
Annual Report
Fidelity Emerging Markets Discovery Fund
Financial Statements - continued
Statement of Assets and Liabilities - continued
| October 31, 2013 |
| | |
Calculation of Maximum Offering Price Class A:
Net Asset Value and redemption price per share ($5,065,263 ÷ 405,641 shares) | | $ 12.49 |
| | |
Maximum offering price per share (100/94.25 of $12.49) | | $ 13.25 |
Class T:
Net Asset Value and redemption price per share ($1,914,183 ÷ 153,883 shares) | | $ 12.44 |
| | |
Maximum offering price per share (100/96.50 of $12.44) | | $ 12.89 |
Class C:
Net Asset Value and offering price per share ($2,081,734 ÷ 168,561 shares)A | | $ 12.35 |
| | |
Emerging Markets Discovery:
Net Asset Value, offering price and redemption price per share ($96,731,108 ÷ 7,723,835 shares) | | $ 12.52 |
| | |
Institutional Class:
Net Asset Value, offering price and redemption price per share ($1,076,244 ÷ 85,924 shares) | | $ 12.53 |
A Redemption price per share is equal to net asset value less any applicable contingent deferred sales charge.
See accompanying notes which are an integral part of the financial statements.
Annual Report
Statement of Operations
| Year ended October 31, 2013 |
| | |
Investment Income | | |
Dividends | | $ 2,828,759 |
Income from Fidelity Central Funds | | 9,323 |
Income before foreign taxes withheld | | 2,838,082 |
Less foreign taxes withheld | | (276,587) |
Total income | | 2,561,495 |
| | |
Expenses | | |
Management fee | $ 970,456 | |
Transfer agent fees | 278,936 | |
Distribution and service plan fees | 51,976 | |
Accounting and security lending fees | 58,907 | |
Custodian fees and expenses | 313,877 | |
Independent trustees' compensation | 619 | |
Registration fees | 92,723 | |
Audit | 76,674 | |
Legal | 207 | |
Miscellaneous | 435 | |
Total expenses before reductions | 1,844,810 | |
Expense reductions | (214,796) | 1,630,014 |
Net investment income (loss) | | 931,481 |
Realized and Unrealized Gain (Loss) Net realized gain (loss) on: | | |
Investment securities: | | |
Unaffiliated issuers (net of foreign taxes of $74,639) | 2,425,794 | |
Foreign currency transactions | (109,494) | |
Total net realized gain (loss) | | 2,316,300 |
Change in net unrealized appreciation (depreciation) on: Investment securities (net of increase in deferred foreign taxes of $183,313) | (861,858) | |
Assets and liabilities in foreign currencies | (3,018) | |
Total change in net unrealized appreciation (depreciation) | | (864,876) |
Net gain (loss) | | 1,451,424 |
Net increase (decrease) in net assets resulting from operations | | $ 2,382,905 |
See accompanying notes which are an integral part of the financial statements.
Annual Report
Fidelity Emerging Markets Discovery Fund
Financial Statements - continued
Statement of Changes in Net Assets
| Year ended
October 31,
2013 | For the period
November 1, 2011 (commencement of operations) to
October 31, 2012 |
Increase (Decrease) in Net Assets | | |
Operations | | |
Net investment income (loss) | $ 931,481 | $ 275,092 |
Net realized gain (loss) | 2,316,300 | 834,546 |
Change in net unrealized appreciation (depreciation) | (864,876) | 2,683,528 |
Net increase (decrease) in net assets resulting
from operations | 2,382,905 | 3,793,166 |
Distributions to shareholders from net investment income | (286,293) | (7,760) |
Distributions to shareholders from net realized gain | (914,866) | - |
Total distributions | (1,201,159) | (7,760) |
Share transactions - net increase (decrease) | 59,689,170 | 41,986,470 |
Redemption fees | 191,734 | 34,006 |
Total increase (decrease) in net assets | 61,062,650 | 45,805,882 |
| | |
Net Assets | | |
Beginning of period | 45,805,882 | - |
End of period (including undistributed net investment income of $648,420 and undistributed net investment income of $251,826, respectively) | $ 106,868,532 | $ 45,805,882 |
See accompanying notes which are an integral part of the financial statements.
Annual Report
Financial Highlights - Class A
Years ended October 31, | 2013 | 2012 F |
Selected Per-Share Data | | |
Net asset value, beginning of period | $ 11.89 | $ 10.00 |
Income from Investment Operations | | |
Net investment income (loss) C | .08 | .12 |
Net realized and unrealized gain (loss) | .75 | 1.76 |
Total from investment operations | .83 | 1.88 |
Distributions from net investment income | (.04) | (.01) |
Distributions from net realized gain | (.20) | - |
Total distributions | (.25) H | (.01) |
Redemption fees added to paid in capital C | .02 | .02 |
Net asset value, end of period | $ 12.49 | $ 11.89 |
Total Return A, B | 7.20% | 19.00% |
Ratios to Average Net Assets D, G | | |
Expenses before reductions | 1.87% | 3.49% |
Expenses net of fee waivers, if any | 1.70% | 1.70% |
Expenses net of all reductions | 1.64% | 1.64% |
Net investment income (loss) | .62% | 1.16% |
Supplemental Data | | |
Net assets, end of period (000 omitted) | $ 5,065 | $ 1,671 |
Portfolio turnover rate E | 179% | 83% |
A Total returns would have been lower if certain expenses had not been reduced during the applicable periods shown.
B Total returns do not include the effect of the sales charges.
C Calculated based on average shares outstanding during the period.
D Fees and expenses of any underlying Fidelity Central Funds are not included in the Fund's expense ratio. The Fund indirectly bears its proportionate share of the expenses of any underlying Fidelity Central Funds.
E Amount does not include the portfolio activity of any underlying Fidelity Central Funds.
F For the period November 1, 2011 (commencement of operations) to October 31, 2012.
G Expense ratios reflect operating expenses of the class. Expenses before reductions do not reflect amounts reimbursed by the investment adviser or reductions from brokerage service arrangements or reductions from other expense offset arrangements and do not represent the amount paid by the class during periods when reimbursements or reductions occur. Expense ratios before reductions for start-up periods may not be representative of longer-term operating periods. Expenses net of fee waivers reflect expenses after reimbursement by the investment adviser but prior to reductions from brokerage service arrangements or other expense offset arrangements. Expenses net of all reductions represent the net expenses paid by the class.
H Total distributions of $.25 per share is comprised of distributions from net investment income of $.044 and distributions from net realized gain of $.203 per share.
See accompanying notes which are an integral part of the financial statements.
Annual Report
Financial Highlights - Class T
Years ended October 31, | 2013 | 2012 F |
Selected Per-Share Data | | |
Net asset value, beginning of period | $ 11.87 | $ 10.00 |
Income from Investment Operations | | |
Net investment income (loss) C | .05 | .10 |
Net realized and unrealized gain (loss) | .74 | 1.75 |
Total from investment operations | .79 | 1.85 |
Distributions from net investment income | (.03) | - I |
Distributions from net realized gain | (.20) | - |
Total distributions | (.24) H | - I |
Redemption fees added to paid in capital C | .02 | .02 |
Net asset value, end of period | $ 12.44 | $ 11.87 |
Total Return A, B | 6.87% | 18.75% |
Ratios to Average Net Assets D, G | | |
Expenses before reductions | 2.19% | 3.77% |
Expenses net of fee waivers, if any | 1.95% | 1.95% |
Expenses net of all reductions | 1.89% | 1.89% |
Net investment income (loss) | .37% | .91% |
Supplemental Data | | |
Net assets, end of period (000 omitted) | $ 1,914 | $ 1,700 |
Portfolio turnover rate E | 179% | 83% |
A Total returns would have been lower if certain expenses had not been reduced during the applicable periods shown.
B Total returns do not include the effect of the sales charges.
C Calculated based on average shares outstanding during the period.
D Fees and expenses of any underlying Fidelity Central Funds are not included in the Fund's expense ratio. The Fund indirectly bears its proportionate share of the expenses of any underlying Fidelity Central Funds.
E Amount does not include the portfolio activity of any underlying Fidelity Central Funds.
F For the period November 1, 2011 (commencement of operations) to October 31, 2012.
G Expense ratios reflect operating expenses of the class. Expenses before reductions do not reflect amounts reimbursed by the investment adviser or reductions from brokerage service arrangements or reductions from other expense offset arrangements and do not represent the amount paid by the class during periods when reimbursements or reductions occur. Expense ratios before reductions for start-up periods may not be representative of longer-term operating periods. Expenses net of fee waivers reflect expenses after reimbursement by the investment adviser but prior to reductions from brokerage service arrangements or other expense offset arrangements. Expenses net of all reductions represent the net expenses paid by the class.
H Total distributions of $.24 per share is comprised of distributions from net investment income of $.034 and distributions from net realized gain of $.203 per share.
I Amount represents less than $.01 per share
See accompanying notes which are an integral part of the financial statements.
Annual Report
Financial Highlights - Class C
Years ended October 31, | 2013 | 2012 F |
Selected Per-Share Data | | |
Net asset value, beginning of period | $ 11.82 | $ 10.00 |
Income from Investment Operations | | |
Net investment income (loss) C | (.02) | .04 |
Net realized and unrealized gain (loss) | .74 | 1.76 |
Total from investment operations | .72 | 1.80 |
Distributions from net investment income | (.01) | - |
Distributions from net realized gain | (.20) | - |
Total distributions | (.21) | - |
Redemption fees added to paid in capital C | .02 | .02 |
Net asset value, end of period | $ 12.35 | $ 11.82 |
Total Return A, B | 6.32% | 18.20% |
Ratios to Average Net Assets D, G | | |
Expenses before reductions | 2.70% | 4.32% |
Expenses net of fee waivers, if any | 2.45% | 2.45% |
Expenses net of all reductions | 2.39% | 2.39% |
Net investment income (loss) | (.13)% | .41% |
Supplemental Data | | |
Net assets, end of period (000 omitted) | $ 2,082 | $ 1,474 |
Portfolio turnover rate E | 179% | 83% |
A Total returns would have been lower if certain expenses had not been reduced during the applicable periods shown.
B Total returns do not include the effect of the contingent deferred sales charge.
C Calculated based on average shares outstanding during the period.
D Fees and expenses of any underlying Fidelity Central Funds are not included in the Fund's expense ratio. The Fund indirectly bears its proportionate share of the expenses of any underlying Fidelity Central Funds.
E Amount does not include the portfolio activity of any underlying Fidelity Central Funds.
F For the period November 1, 2011 (commencement of operations) to October 31, 2012.
G Expense ratios reflect operating expenses of the class. Expenses before reductions do not reflect amounts reimbursed by the investment adviser or reductions from brokerage service arrangements or reductions from other expense offset arrangements and do not represent the amount paid by the class during periods when reimbursements or reductions occur. Expense ratios before reductions for start-up periods may not be representative of longer-term operating periods. Expenses net of fee waivers reflect expenses after reimbursement by the investment adviser but prior to reductions from brokerage service arrangements or other expense offset arrangements. Expenses net of all reductions represent the net expenses paid by the class.
See accompanying notes which are an integral part of the financial statements.
Annual Report
Financial Highlights - Emerging Markets Discovery
Years ended October 31, | 2013 | 2012 E |
Selected Per-Share Data | | |
Net asset value, beginning of period | $ 11.92 | $ 10.00 |
Income from Investment Operations | | |
Net investment income (loss) B | .11 | .15 |
Net realized and unrealized gain (loss) | .74 | 1.76 |
Total from investment operations | .85 | 1.91 |
Distributions from net investment income | (.07) | (.01) |
Distributions from net realized gain | (.20) | - |
Total distributions | (.27) | (.01) |
Redemption fees added to paid in capital B | .02 | .02 |
Net asset value, end of period | $ 12.52 | $ 11.92 |
Total Return A | 7.37% | 19.35% |
Ratios to Average Net Assets C, F | | |
Expenses before reductions | 1.57% | 3.02% |
Expenses net of fee waivers, if any | 1.45% | 1.45% |
Expenses net of all reductions | 1.39% | 1.39% |
Net investment income (loss) | .87% | 1.41% |
Supplemental Data | | |
Net assets, end of period (000 omitted) | $ 96,731 | $ 39,135 |
Portfolio turnover rate D | 179% | 83% |
A Total returns would have been lower if certain expenses had not been reduced during the applicable periods shown.
B Calculated based on average shares outstanding during the period.
C Fees and expenses of any underlying Fidelity Central Funds are not included in the Fund's expense ratio. The Fund indirectly bears its proportionate share of the expenses of any underlying Fidelity Central Funds.
D Amount does not include the portfolio activity of any underlying Fidelity Central Funds.
E For the period November 1, 2011 (commencement of operations) to October 31, 2012.
F Expense ratios reflect operating expenses of the class. Expenses before reductions do not reflect amounts reimbursed by the investment adviser or reductions from brokerage service arrangements or reductions from other expense offset arrangements and do not represent the amount paid by the class during periods when reimbursements or reductions occur. Expense ratios before reductions for start-up periods may not be representative of longer-term operating periods. Expenses net of fee waivers reflect expenses after reimbursement by the investment adviser but prior to reductions from brokerage service arrangements or other expense offset arrangements. Expenses net of all reductions represent the net expenses paid by the class.
See accompanying notes which are an integral part of the financial statements.
Annual Report
Financial Highlights - Institutional Class
Years ended October 31, | 2013 | 2012 E |
Selected Per-Share Data | | |
Net asset value, beginning of period | $ 11.92 | $ 10.00 |
Income from Investment Operations | | |
Net investment income (loss) B | .11 | .15 |
Net realized and unrealized gain (loss) | .75 | 1.76 |
Total from investment operations | .86 | 1.91 |
Distributions from net investment income | (.07) | (.01) |
Distributions from net realized gain | (.20) | - |
Total distributions | (.27) | (.01) |
Redemption fees added to paid in capital B | .02 | .02 |
Net asset value, end of period | $ 12.53 | $ 11.92 |
Total Return A | 7.45% | 19.35% |
Ratios to Average Net Assets C, F | | |
Expenses before reductions | 1.60% | 3.21% |
Expenses net of fee waivers, if any | 1.45% | 1.45% |
Expenses net of all reductions | 1.39% | 1.39% |
Net investment income (loss) | .87% | 1.41% |
Supplemental Data | | |
Net assets, end of period (000 omitted) | $ 1,076 | $ 1,825 |
Portfolio turnover rate D | 179% | 83% |
A Total returns would have been lower if certain expenses had not been reduced during the applicable periods shown.
B Calculated based on average shares outstanding during the period.
C Fees and expenses of any underlying Fidelity Central Funds are not included in the Fund's expense ratio. The Fund indirectly bears its proportionate share of the expenses of any underlying Fidelity Central Funds.
D Amount does not include the portfolio activity of any underlying Fidelity Central Funds.
E For the period November 1, 2011 (commencement of operations) to October 31, 2012.
F Expense ratios reflect operating expenses of the class. Expenses before reductions do not reflect amounts reimbursed by the investment adviser or reductions from brokerage service arrangements or reductions from other expense offset arrangements and do not represent the amount paid by the class during periods when reimbursements or reductions occur. Expense ratios before reductions for start-up periods may not be representative of longer-term operating periods. Expenses net of fee waivers reflect expenses after reimbursement by the investment adviser but prior to reductions from brokerage service arrangements or other expense offset arrangements. Expenses net of all reductions represent the net expenses paid by the class.
See accompanying notes which are an integral part of the financial statements.
Annual Report
Fidelity Emerging Markets Discovery Fund
Notes to Financial Statements
For the period ended October 31, 2013
1. Organization.
Fidelity Emerging Markets Discovery Fund (the Fund) is a non-diversified fund of Fidelity Investment Trust (the Trust) and is authorized to issue an unlimited number of shares. The Trust is registered under the Investment Company Act of 1940, as amended (the 1940 Act), as an open-end management investment company organized as a Massachusetts business trust. The Fund offers Class A, Class T, Class C, Emerging Markets Discovery and Institutional Class shares, each of which has equal rights as to assets and voting privileges. Each class has exclusive voting rights with respect to matters that affect that class. The Fund's investments in emerging markets can be subject to social, economic, regulatory, and political uncertainties and can be extremely volatile.
2. Investments in Fidelity Central Funds.
The Fund invests in Fidelity Central Funds, which are open-end investment companies generally available only to other investment companies and accounts managed by Fidelity Management & Research Company (FMR) and its affiliates. The Fund's Schedule of Investments lists each of the Fidelity Central Funds held as of period end, if any, as an investment of the Fund, but does not include the underlying holdings of each Fidelity Central Fund. As an Investing Fund, the Fund indirectly bears its proportionate share of the expenses of the underlying Fidelity Central Funds.
The Money Market Central Funds seek preservation of capital and current income and are managed by Fidelity Investments Money Management, Inc. (FIMM), an affiliate of FMR.
A complete unaudited list of holdings for each Fidelity Central Fund is available upon request or at the Securities and Exchange Commission (the SEC) website at www.sec.gov. In addition, the financial statements of the Fidelity Central Funds, which are not covered by the Fund's Report of Independent Registered Public Accounting Firm, are available on the SEC website or upon request.
3. Significant Accounting Policies.
The financial statements have been prepared in conformity with accounting principles generally accepted in the United States of America (GAAP), which require management to make certain estimates and assumptions at the date of the financial statements. Actual results could differ from those estimates. Subsequent events, if any, through the date that the financial statements were issued have been evaluated in the preparation of
Annual Report
Fidelity Emerging Markets Discovery Fund
Notes to Financial Statements - continued
3. Significant Accounting Policies - continued
the financial statements. The following summarizes the significant accounting policies of the Fund:
Investment Valuation. Investments are valued as of 4:00 p.m. Eastern time on the last calendar day of the period. In accordance with valuation policies and procedures approved by the Board of Trustees (the Board), the Fund attempts to obtain prices from one or more third party pricing vendors or brokers to value its investments. When current market prices, quotations or currency exchange rates are not readily available or reliable, investments will be fair valued in good faith by the FMR Fair Value Committee (the Committee), in accordance with procedures adopted by the Board. Factors used in determining fair value vary by investment type and may include market or investment specific events. The frequency with which these procedures are used cannot be predicted and they may be utilized to a significant extent. The Committee oversees the Fund's valuation policies and procedures and is responsible for approving and reporting to the Board all fair value determinations.
The Fund categorizes the inputs to valuation techniques used to value its investments into a disclosure hierarchy consisting of three levels as shown below:
Level 1 - quoted prices in active markets for identical investments
Level 2 - other significant observable inputs (including quoted prices for similar investments, interest rates, prepayment speeds, etc.)
Level 3 - unobservable inputs (including the Fund's own assumptions based on the best information available)
Valuation techniques used to value the Fund's investments by major category are as follows:
Equity securities, including restricted securities, for which market quotations are readily available, are valued at the last reported sale price or official closing price as reported by a third party pricing vendor on the primary market or exchange on which they are traded and are categorized as Level 1 in the hierarchy. In the event there were no sales during the day or closing prices are not available, securities are valued at the last quoted bid price or may be valued using the last available price and are generally categorized as Level 2 in the hierarchy. For foreign equity securities, when market or security specific events arise, comparisons to the valuation of American Depositary Receipts (ADRs), futures contracts, Exchange-Traded Funds (ETFs) and certain indexes as well as quoted prices for similar securities may be used and would be categorized as Level 2 in the hierarchy. Utilizing these techniques may result in transfers between Level 1 and Level 2. For equity securities, including restricted securities, where observable inputs are limited, assumptions about market activity and risk are used and these securities may be categorized as Level 3 in the hierarchy.
Annual Report
3. Significant Accounting Policies - continued
Investment Valuation - continued
Investments in open-end mutual funds, including the Fidelity Central Funds, are valued at their closing net asset value (NAV) each business day and are categorized as Level 1 in the hierarchy.
Changes in valuation techniques may result in transfers in or out of an assigned level within the disclosure hierarchy. The aggregate value of investments by input level, as of October 31, 2013, is included at the end of the Fund's Schedule of Investments.
Foreign Currency. The Fund may use foreign currency contracts to facilitate transactions in foreign-denominated securities. Gains and losses from these transactions may arise from changes in the value of the foreign currency or if the counterparties do not perform under the contracts' terms.
Foreign-denominated assets, including investment securities, and liabilities are translated into U.S. dollars at the exchange rates at period end. Purchases and sales of investment securities, income and dividends received and expenses denominated in foreign currencies are translated into U.S. dollars at the exchange rate in effect on the transaction date.
The effects of exchange rate fluctuations on investments are included with the net realized and unrealized gain (loss) on investment securities. Other foreign currency transactions resulting in realized and unrealized gain (loss) are disclosed separately.
Investment Transactions and Income. For financial reporting purposes, the Fund's investment holdings and NAV include trades executed through the end of the last business day of the period. The NAV per share for processing shareholder transactions is calculated as of the close of business of the New York Stock Exchange (NYSE), normally 4:00 p.m. Eastern time and includes trades executed through the end of the prior business day. Gains and losses on securities sold are determined on the basis of identified cost. Dividend income is recorded on the ex-dividend date, except for certain dividends from foreign securities where the ex-dividend date may have passed, which are recorded as soon as the Fund is informed of the ex-dividend date. Non-cash dividends included in dividend income, if any, are recorded at the fair market value of the securities received. Interest income and distributions from the Fidelity Central Funds are accrued as earned. Investment income is recorded net of foreign taxes withheld where recovery of such taxes is uncertain.
Annual Report
Fidelity Emerging Markets Discovery Fund
Notes to Financial Statements - continued
3. Significant Accounting Policies - continued
Class Allocations and Expenses. Investment income, realized and unrealized capital gains and losses, common expenses of the Fund, and certain fund-level expense reductions, if any, are allocated daily on a pro-rata basis to each class based on the relative net assets of each class to the total net assets of the Fund. Each class differs with respect to transfer agent and distribution and service plan fees incurred. Certain expense reductions may also differ by class. For the reporting period, the allocated portion of income and expenses to each class as a percent of its average net assets may vary due to the timing of recording these transactions in relation to fluctuating net assets of the classes. Expenses directly attributable to a fund are charged to that fund. Expenses attributable to more than one fund are allocated among the respective funds on the basis of relative net assets or other appropriate methods. Expense estimates are accrued in the period to which they relate and adjustments are made when actual amounts are known.
Income Tax Information and Distributions to Shareholders. Each year, the Fund intends to qualify as a regulated investment company under Subchapter M of the Internal Revenue Code, including distributing substantially all of its taxable income and realized gains. As a result, no provision for U.S. Federal income taxes is required. As of October 31, 2013, the Fund did not have any unrecognized tax benefits in the financial statements; nor is the Fund aware of any tax positions for which it is reasonably possible that the total amounts of unrecognized tax benefits will significantly change in the next twelve months. The Fund files a U.S. federal tax return, in addition to state and local tax returns as required. The Fund's federal income tax returns are subject to examination by the Internal Revenue Service (IRS) for a period of three fiscal years after they are filed. State and local tax returns may be subject to examination for an additional fiscal year depending on the jurisdiction. Foreign taxes are provided for based on the Fund's understanding of the tax rules and rates that exist in the foreign markets in which it invests. The Fund is subject to a tax imposed on capital gains by certain countries in which it invests. An estimated deferred tax liability for net unrealized appreciation on the applicable securities is included in Other payables and accrued expenses on the Statement of Assets & Liabilities.
Distributions are declared and recorded on the ex-dividend date. Income dividends and capital gain distributions are declared separately for each class. Income and capital gain distributions are determined in accordance with income tax regulations, which may differ from GAAP. In addition, the fund claimed a portion of the payment made to redeeming shareholders as a distribution for income tax purposes.
Capital accounts within the financial statements are adjusted for permanent book-tax differences. These adjustments have no impact on net assets or the results of operations. Temporary book-tax differences will reverse in a subsequent period.
Annual Report
3. Significant Accounting Policies - continued
Income Tax Information and Distributions to Shareholders - continued
Book-tax differences are primarily due to foreign currency transactions, certain foreign taxes, passive foreign investment companies (PFIC) and losses deferred due to wash sales.
The federal tax cost of investment securities and unrealized appreciation (depreciation) as of period end were as follows:
Gross unrealized appreciation | $ 7,324,813 |
Gross unrealized depreciation | (6,582,719) |
Net unrealized appreciation (depreciation) on securities and other investments | $ 742,094 |
| |
Tax Cost | $ 106,636,517 |
The tax-based components of distributable earnings as of period end were as follows:
Undistributed ordinary income | $ 648,420 |
Undistributed long-term capital gain | $ 2,513,282 |
Net unrealized appreciation (depreciation) | $ 738,896 |
The tax character of distributions paid was as follows:
| October 31, 2013 | October 31, 2012 |
Ordinary Income | $ 1,201,159 | $ 7,760 |
Short-Term Trading (Redemption) Fees. Shares held by investors in the Fund less than 90 days may have been subject to a redemption fee equal to 2.00% of the net asset value of shares redeemed. All redemption fees, which reduce the proceeds of the shareholder redemption, are retained by the Fund and accounted for as an addition to paid in capital.
4. Purchases and Sales of Investments.
Purchases and sales of securities, other than short-term securities, aggregated $247,560,295 and $189,920,365, respectively.
Annual Report
Fidelity Emerging Markets Discovery Fund
Notes to Financial Statements - continued
5. Fees and Other Transactions with Affiliates.
Management Fee. FMR and its affiliates provide the Fund with investment management related services for which the Fund pays a monthly management fee. The management fee is the sum of an individual fund fee rate that is based on an annual rate of .60% of the Fund's average net assets and an annualized group fee rate that averaged .25% during the period. The group fee rate is based upon the average net assets of all the mutual funds advised by FMR, including any mutual funds previously advised by FMR that are currently advised by Fidelity SelectCo, LLC, an affiliate of FMR. The group fee rate decreases as assets under management increase and increases as assets under management decrease. For the reporting period, the total annual management fee rate was .86% of the Fund's average net assets.
Distribution and Service Plan Fees. In accordance with Rule 12b-1 of the 1940 Act, the Fund has adopted separate Distribution and Service Plans for each class of shares. Certain classes pay Fidelity Distributors Corporation (FDC), an affiliate of FMR, separate Distribution and Service Fees, each of which is based on an annual percentage of each class' average net assets. In addition, FDC may pay financial intermediaries for selling shares of the Fund and providing shareholder support services. For the period, the Distribution and Service Fee rates, total fees and amounts retained by FDC were as follows:
| Distribution
Fee | Service
Fee | Total Fees | Retained
by FDC |
Class A | -% | .25% | $ 11,370 | $ 640 |
Class T | .25% | .25% | 10,003 | 706 |
Class C | .75% | .25% | 30,603 | 12,100 |
| | | $ 51,976 | $ 13,446 |
Sales Load. FDC may receive a front-end sales charge of up to 5.75% for selling Class A shares and 3.50% for selling Class T shares, some of which is paid to financial intermediaries for selling shares of the Fund. Depending on the holding period, FDC may receive contingent deferred sales charges levied on Class A, Class T and Class C redemptions. The deferred sales charges range from 1.00% for Class C shares, 1.00% for certain purchases of Class A shares and .25% for certain purchases of Class T shares.
For the period, sales charge amounts retained by FDC were as follows:
| Retained
by FDC |
Class A | $ 8,180 |
Class T | 2,075 |
Class C* | 942 |
| $ 11,197 |
* When Class C shares are initially sold, FDC pays commissions from its own resources to financial intermediaries through which the sales are made.
Annual Report
5. Fees and Other Transactions with Affiliates - continued
Transfer Agent Fees. Fidelity Investments Institutional Operations Company, Inc., (FIIOC), an affiliate of FMR, is the transfer, dividend disbursing and shareholder servicing agent for each class of the Fund. FIIOC receives account fees and asset-based fees that vary according to the account size and type of account of the shareholders of the respective classes of the Fund. FIIOC pays for typesetting, printing and mailing of shareholder reports, except proxy statements.
For the period, transfer agent fees for each class were as follows:
| Amount | % of
Average
Net Assets |
Class A | $ 13,166 | .29 |
Class T | 6,485 | .32 |
Class C | 7,570 | .25 |
Emerging Markets Discovery | 245,715 | .24 |
Institutional Class | 6,000 | .22 |
| $ 278,936 | |
Accounting and Security Lending Fees. Fidelity Service Company, Inc. (FSC), an affiliate of FMR, maintains the Fund's accounting records. The accounting fee is based on the level of average net assets for each month. Under a separate contract, FSC administers the security lending program. The security lending fee is based on the number and duration of lending transactions.
Brokerage Commissions. The Fund placed a portion of its portfolio transactions with brokerage firms which are affiliates of the investment adviser. Brokerage commissions are included in net realized gain (loss) and change in net unrealized appreciation (depreciation) in the Statement of Operations. The commissions paid to these affiliated firms were $334 for the period.
6. Committed Line of Credit.
The Fund participates with other funds managed by FMR or an affiliate in a $4.25 billion credit facility (the "line of credit") to be utilized for temporary or emergency purposes to fund shareholder redemptions or for other short-term liquidity purposes. The Fund has agreed to pay commitment fees on its pro-rata portion of the line of credit, which amounted to $232 and is reflected in Miscellaneous expenses on the Statement of Operations. During the period, there were no borrowings on this line of credit.
Annual Report
Fidelity Emerging Markets Discovery Fund
Notes to Financial Statements - continued
7. Security Lending.
The Fund lends portfolio securities through a lending agent from time to time in order to earn additional income. For equity securities, a lending agent is used and may loan securities to certain qualified borrowers, including Fidelity Capital Markets (FCM), a broker-dealer affiliated with the Fund. On the settlement date of the loan, the Fund receives collateral (in the form of U.S. Treasury obligations, letters of credit and/or cash) against the loaned securities and maintains collateral in an amount not less than 100% of the market value of the loaned securities during the period of the loan. The market value of the loaned securities is determined at the close of business of the Fund and any additional required collateral is delivered to the Fund on the next business day. If the borrower defaults on its obligation to return the securities loaned because of insolvency or other reasons, the Fund may apply collateral received from the borrower against the obligation. The Fund may experience delays and costs in recovering the securities loaned. Any cash collateral received is invested in the Fidelity Securities Lending Cash Central Fund. At period end, there were no security loans outstanding. Security lending income represents the income earned on investing cash collateral, less rebates paid to borrowers and any lending agent fees associated with the loan, plus any premium payments received for lending certain types of securities. Security lending income is presented in the Statement of Operations as a component of income from Fidelity Central Funds. Total security lending income during the period amounted to $3,614. During the period, there were no securities loaned to FCM.
8. Expense Reductions.
FMR contractually agreed to reimburse each class to the extent annual operating expenses exceeded certain levels of average net assets as noted in the table below. This reimbursement will remain in place through December 31, 2014. Some expenses, for example interest expense, including commitment fees, are excluded from this reimbursement.
The following classes were in reimbursement during the period:
| Expense
Limitations | Reimbursement |
| | |
Class A | 1.70% | $ 7,621 |
Class T | 1.95% | 4,856 |
Class C | 2.45% | 7,439 |
Emerging Markets Discovery | 1.45% | 124,923 |
Institutional Class | 1.45% | 4,058 |
| | $ 148,897 |
Annual Report
8. Expense Reductions - continued
In addition, FMR reimbursed a portion of the Fund's operating expenses during the period in the amount of $970.
Commissions paid to certain brokers with whom FMR, or its affiliates, places trades on behalf of the Fund include an amount in addition to trade execution, which may be rebated back to the Fund to offset certain expenses. This amount totaled $64,929 for the period.
9. Distributions to Shareholders.
Distributions to shareholders of each class were as follows:
Years ended October 31, | 2013 | 2012 A |
From net investment income | | |
Class A | $ 7,274 | $ 435 |
Class T | 5,643 | 203 |
Class C | 1,195 | - |
Emerging Markets Discovery | 259,277 | 6,522 |
Institutional Class | 12,904 | 600 |
Total | $ 286,293 | $ 7,760 |
From net realized gain | | |
Class A | $ 33,559 | $ - |
Class T | 33,691 | - |
Class C | 30,324 | - |
Emerging Markets Discovery | 778,518 | - |
Institutional Class | 38,774 | - |
Total | $ 914,866 | $ - |
A For the period November 1, 2011 (commencement of operations) to October 31, 2012.
Annual Report
Fidelity Emerging Markets Discovery Fund
Notes to Financial Statements - continued
10. Share Transactions.
Transactions for each class of shares were as follows:
| Shares | Dollars |
Years ended October 31, | 2013 | 2012 A | 2013 | 2012 A |
Class A | | | | |
Shares sold | 646,803 | 197,037 | $ 8,039,936 | $ 2,112,904 |
Reinvestment of distributions | 3,013 | 46 | 36,310 | 435 |
Shares redeemed | (384,660) | (56,598) | (4,712,072) | (637,589) |
Net increase (decrease) | 265,156 | 140,485 | $ 3,364,174 | $ 1,475,750 |
Class T | | | | |
Shares sold | 157,097 | 182,780 | $ 1,931,892 | $ 1,990,143 |
Reinvestment of distributions | 3,232 | 22 | 38,882 | 203 |
Shares redeemed | (149,702) | (39,546) | (1,831,906) | (451,707) |
Net increase (decrease) | 10,627 | 143,256 | $ 138,868 | $ 1,538,639 |
Class C | | | | |
Shares sold | 428,945 | 161,266 | $ 5,224,843 | $ 1,743,293 |
Reinvestment of distributions | 2,629 | - | 31,519 | - |
Shares redeemed | (387,768) | (36,511) | (4,776,955) | (415,821) |
Net increase (decrease) | 43,806 | 124,755 | $ 479,407 | $ 1,327,472 |
Emerging Markets Discovery | | | | |
Shares sold | 12,245,350 | 4,074,333 | $ 152,132,821 | $ 44,757,138 |
Reinvestment of distributions | 72,226 | 681 | 871,750 | 6,419 |
Shares redeemed | (7,876,995) | (791,760) | (96,541,547) | (8,744,517) |
Net increase (decrease) | 4,440,581 | 3,283,254 | $ 56,463,024 | $ 36,019,040 |
Institutional Class | | | | |
Shares sold | 231,788 | 199,001 | $ 2,857,278 | $ 2,149,513 |
Reinvestment of distributions | 3,612 | 64 | 43,597 | 600 |
Shares redeemed | (302,585) | (45,956) | (3,657,178) | (524,544) |
Net increase (decrease) | (67,185) | 153,109 | $ (756,303) | $ 1,625,569 |
A For the period November 1, 2011 (commencement of operations) to October 31, 2012.
11. Other.
The Fund's organizational documents provide former and current trustees and officers with a limited indemnification against liabilities arising in connection with the performance of their duties to the Fund. In the normal course of business, the Fund may also enter into contracts that provide general indemnifications. The Fund's maximum exposure under these arrangements is unknown as this would be dependent on future claims that may be made against the Fund. The risk of material loss from such claims is considered remote.
Annual Report
To the Trustees of Fidelity Investment Trust and the Shareholders of Fidelity Emerging Markets Discovery Fund:
In our opinion, the accompanying statement of assets and liabilities, including the schedule of investments, and the related statements of operations and of changes in net assets and the financial highlights present fairly, in all material respects, the financial position of Fidelity Emerging Markets Discovery Fund (a fund of Fidelity Investment Trust) at October 31, 2013, the results of its operations for the year then ended, the changes in its net assets for the period indicated and the financial highlights for each of the periods indicated, in conformity with accounting principles generally accepted in the United States of America. These financial statements and financial highlights (hereafter referred to as "financial statements") are the responsibility of the Fidelity Emerging Markets Discovery Fund's management. Our responsibility is to express an opinion on these financial statements based on our audits. We conducted our audits of these financial statements in accordance with the standards of the Public Company Accounting Oversight Board (United States). Those standards require that we plan and perform the audit to obtain reasonable assurance about whether the financial statements are free of material misstatement. An audit includes examining, on a test basis, evidence supporting the amounts and disclosures in the financial statements, assessing the accounting principles used and significant estimates made by management, and evaluating the overall financial statement presentation. We believe that our audits, which included confirmation of securities at October 31, 2013 by correspondence with the custodian and brokers, provide a reasonable basis for our opinion.
PricewaterhouseCoopers LLP
Boston, Massachusetts
December 17, 2013
Annual Report
The Trustees, Member of the Advisory Board, and executive officers of the trust and fund, as applicable, are listed below. The Board of Trustees governs the fund and is responsible for protecting the interests of shareholders. The Trustees are experienced executives who meet periodically throughout the year to oversee the fund's activities, review contractual arrangements with companies that provide services to the fund, oversee management of the risks associated with such activities and contractual arrangements, and review the fund's performance. Except for James C. Curvey, Ned C. Lautenbach, Ronald P. O'Hanley, and William S. Stavropoulos, each of the Trustees oversees 171 funds. Mr. Curvey oversees 394 funds. Mr. Lautenbach, Mr. O'Hanley, and Mr. Stavropoulos each oversees 245 funds.
The Trustees hold office without limit in time except that (a) any Trustee may resign; (b) any Trustee may be removed by written instrument, signed by at least two-thirds of the number of Trustees prior to such removal; (c) any Trustee who requests to be retired or who has become incapacitated by illness or injury may be retired by written instrument signed by a majority of the other Trustees; and (d) any Trustee may be removed at any special meeting of shareholders by a two-thirds vote of the outstanding voting securities of the trust. Each Trustee who is not an interested person of the trust and the fund (as defined in the 1940 Act) (Independent Trustee), shall retire not later than the last day of the calendar year in which his or her 75th birthday occurs. The Independent Trustees may waive this mandatory retirement age policy with respect to individual Trustees. The executive officers and Advisory Board Member hold office without limit in time, except that any officer and Advisory Board Member may resign or may be removed by a vote of a majority of the Trustees at any regular meeting or any special meeting of the Trustees. Except as indicated, each individual has held the office shown or other offices in the same company for the past five years.
Experience, Skills, Attributes, and Qualifications of the Fund's Trustees. The Governance and Nominating Committee has adopted a statement of policy that describes the experience, qualifications, attributes, and skills that are necessary and desirable for potential Independent Trustee candidates (Statement of Policy). The Board believes that each Trustee satisfied at the time he or she was initially elected or appointed a Trustee, and continues to satisfy, the standards contemplated by the Statement of Policy. The Governance and Nominating Committee also engages professional search firms to help identify potential Independent Trustee candidates who have the experience, qualifications, attributes, and skills consistent with the Statement of Policy. From time to time, additional criteria based on the composition and skills of the current Independent Trustees, as well as experience or skills that may be appropriate in light of future changes to board composition, business conditions, and regulatory or other developments, have also been considered by the professional search firms and the Governance and Nominating Committee. In addition, the Board takes into account the Trustees' commitment and participation in Board and committee meetings, as well as their leadership of standing and ad hoc committees throughout their tenure.
Annual Report
Trustees and Officers - continued
In determining that a particular Trustee was and continues to be qualified to serve as a Trustee, the Board has considered a variety of criteria, none of which, in isolation, was controlling. The Board believes that, collectively, the Trustees have balanced and diverse experience, qualifications, attributes, and skills, which allow the Board to operate effectively in governing the fund and protecting the interests of shareholders. Information about the specific experience, skills, attributes, and qualifications of each Trustee, which in each case led to the Board's conclusion that the Trustee should serve (or continue to serve) as a trustee of the fund, is provided below.
Board Structure and Oversight Function. James C. Curvey is an interested person (as defined in the 1940 Act) and currently serves as Chairman. The Trustees have determined that an interested Chairman is appropriate and benefits shareholders because an interested Chairman has a personal and professional stake in the quality and continuity of services provided to the fund. Independent Trustees exercise their informed business judgment to appoint an individual of their choosing to serve as Chairman, regardless of whether the Trustee happens to be independent or a member of management. The Independent Trustees have determined that they can act independently and effectively without having an Independent Trustee serve as Chairman and that a key structural component for assuring that they are in a position to do so is for the Independent Trustees to constitute a substantial majority for the Board. The Independent Trustees also regularly meet in executive session. Ned C. Lautenbach serves as Chairman of the Independent Trustees and as such (i) acts as a liaison between the Independent Trustees and management with respect to matters important to the Independent Trustees and (ii) with management prepares agendas for Board meetings.
Fidelity funds are overseen by different Boards of Trustees. The fund's Board oversees Fidelity's equity and high income funds and another Board oversees Fidelity's investment-grade bond, money market, and asset allocation funds. The asset allocation funds may invest in Fidelity funds overseen by the fund's Board. The use of separate Boards, each with its own committee structure, allows the Trustees of each group of Fidelity funds to focus on the unique issues of the funds they oversee, including common research, investment, and operational issues. On occasion, the separate Boards establish joint committees to address issues of overlapping consequences for the Fidelity funds overseen by each Board.
The Trustees operate using a system of committees to facilitate the timely and efficient consideration of all matters of importance to the Trustees, the fund, and fund shareholders and to facilitate compliance with legal and regulatory requirements and oversight of the fund's activities and associated risks. The Board, acting through its committees, has charged FMR and its affiliates with (i) identifying events or circumstances the occurrence of which could have demonstrably adverse effects on the fund's business and/or reputation; (ii) implementing processes and controls to lessen the possibility that such events or circumstances occur or to mitigate the effects of such events or circumstances if they do occur; and (iii) creating and maintaining a system designed to evaluate continuously business and market conditions in order to facilitate the identification and implementation processes described in (i) and (ii) above. Because the day-to-day operations and activities of the fund are carried out by or through FMR, its affiliates and other service providers, the fund's exposure to risks is mitigated but not eliminated by the processes overseen by the Trustees. While each of the Board's committees has responsibility for overseeing different aspects of the fund's activities, oversight is exercised primarily through the Operations, Audit, and Compliance Committees. In addition, the Independent Trustees have worked with FMR to enhance the Board's oversight of investment and financial risks, legal and regulatory risks, technology risks, and operational risks, including the development of additional risk reporting to the Board. For example, a working group comprised of Independent Trustees and FMR has worked and continues to work to review the Fidelity funds' valuation-related activities, reporting and risk management. Appropriate personnel, including but not limited to the fund's Chief Compliance Officer (CCO), FMR's internal auditor, the independent accountants, the fund's Treasurer and portfolio management personnel, make periodic reports to the Board's committees, as appropriate, including an annual review of FMR's risk management program for the Fidelity funds. The responsibilities of each standing committee, including their oversight responsibilities, are described further under "Standing Committees of the Fund's Trustees."
Annual Report
The fund's Statement of Additional Information (SAI) includes more information about the Trustees. To request a free copy, call Fidelity at 1-877-208-0098.
Interested Trustees*:
Correspondence intended for each Trustee who is an interested person may be sent to Fidelity Investments, 245 Summer Street, Boston, Massachusetts 02210.
Name, Year of Birth; Principal Occupations and Other Relevant Experience+ |
James C. Curvey (1935) |
Year of Election or Appointment: 2007 Trustee Chairman of the Board of Trustees |
| Mr. Curvey also serves as Trustee of other Fidelity funds. Mr. Curvey is a Director of Fidelity Investments Money Management, Inc. (2009-present), Director of Fidelity Research & Analysis Co. (2009-present) and Director of FMR and FMR Co., Inc. (2007-present). Mr. Curvey is also Vice Chairman (2007-present) and Director of FMR LLC. In addition, Mr. Curvey serves as an Overseer for the Boston Symphony Orchestra and a member of the Trustees of Villanova University. Previously, Mr. Curvey was the Vice Chairman (2006-2007) and Director (2000-2007) of FMR Corp. |
Ronald P. O'Hanley (1957) |
Year of Election or Appointment: 2011 Trustee |
| Mr. O'Hanley also serves as Trustee of other Fidelity funds. He is Director of Fidelity SelectCo, LLC (2013-present), FMR Co., Inc. (2010-present), Director of Fidelity Investments Money Management, Inc. (2010-present), Director of Fidelity Research & Analysis Company (2010-present), President of Fidelity Asset Management and Corporate Services and a Member of Fidelity's Executive Committee (2010-present). Previously, Mr. O'Hanley served as President and Chief Executive Officer of BNY Mellon Asset Management (2007-2010). Mr. O'Hanley also served as Vice Chairman of Bank New York Mellon Corp. and a member of that firm's Executive Committee. Prior to the 2007 merger of The Bank of New York and Mellon Financial Corporation, he was Vice Chairman of Mellon Financial Corporation and President and Chief Executive Officer of Mellon Asset Management. He joined Mellon in February 1997. Mr. O'Hanley currently serves as Chairman of the Boston Public Library Foundation Board of Directors and sits on the Board of Directors of Beth Israel Deaconess Medical Center, the Board of Trustees of the Marine Biological Laboratory and the Advisory Board of the Maxwell School of Citizenship and Public Administration at Syracuse University. Mr. O'Hanley also chairs the Council on Asset Management for the Financial Services Roundtable and is a member of the Board of Directors of Institutional Investor's U.S. Institute. |
* Trustees have been determined to be "Interested Trustees" by virtue of, among other things, their affiliation with the trust or various entities under common control with FMR.
+ The information above includes each Trustee's principal occupation during the last five years and other information relating to the experience, attributes, and skills relevant to each Trustee's qualifications to serve as a Trustee, which led to the conclusion that each Trustee should serve as a Trustee for the fund.
Annual Report
Independent Trustees:
Correspondence intended for each Independent Trustee (that is, the Trustees other than the Interested Trustees) may be sent to Fidelity Investments, P.O. Box 55235, Boston, Massachusetts 02205-5235.
Name, Year of Birth; Principal Occupations and Other Relevant Experience+ |
Dennis J. Dirks (1948) |
Year of Election or Appointment: 2005 Trustee |
| Mr. Dirks also serves as Trustee of other Fidelity funds. Prior to his retirement in May 2003, Mr. Dirks was Chief Operating Officer and a member of the Board of The Depository Trust & Clearing Corporation (DTCC). He also served as President, Chief Operating Officer, and Board member of The Depository Trust Company (DTC) and President and Board member of the National Securities Clearing Corporation (NSCC). In addition, Mr. Dirks served as Chief Executive Officer and Board member of the Government Securities Clearing Corporation, Chief Executive Officer and Board member of the Mortgage-Backed Securities Clearing Corporation, as a Trustee and a member of the Finance Committee of Manhattan College (2005-2008), and as a Trustee and a member of the Finance Committee of AHRC of Nassau County (2006-2008). Mr. Dirks is a member of the Independent Directors Council (IDC) Governing Council (2010-present) and Board of Directors for The Brookville Center for Children's Services, Inc. (2009-present). |
Alan J. Lacy (1953) |
Year of Election or Appointment: 2008 Trustee |
| Mr. Lacy also serves as Trustee of other Fidelity funds. Mr. Lacy serves as Senior Adviser (2007-present) of Oak Hill Capital Partners, L.P. (private equity). Mr. Lacy also served as Chief Executive Officer (2000-2005) and Vice Chairman (2005-2006) of Sears Holdings Corporation and Sears, Roebuck and Co. (retail). In addition, Mr. Lacy serves as a member of the Board of Directors of Dave & Buster's Entertainment, Inc. (restaurant and entertainment complexes, 2010-present), Earth Fare, Inc. (retail grocery, 2012-present), The Hillman Companies, Inc. (hardware wholesalers, 2010-present), and Bristol-Myers Squibb Company (global pharmaceuticals, 2008-present). Mr. Lacy is a member of the Board of Trustees of The National Parks Conservation Association (2006-present). Previously, Mr. Lacy served as Chairman of the Board of Trustees of the National Parks Conservation Association (2008-2011) and as a member of the Board of Directors for the Western Union Company (global money transfer, 2006-2011). |
Ned C. Lautenbach (1944) |
Year of Election or Appointment: 2000 Trustee Chairman of the Independent Trustees |
| Mr. Lautenbach also serves as Trustee of other Fidelity funds. Mr. Lautenbach currently serves as the Lead Director of the Eaton Corporation Board of Directors (diversified industrial, 1997-present). Mr. Lautenbach is Chairman of the Board of Directors of the Philharmonic Center for the Arts in Naples, Florida (2012-present) and a member of the Council on Foreign Relations (1994-present). Previously, Mr. Lautenbach was a Partner/Advisory Partner at Clayton, Dubilier & Rice, LLC (private equity investment, 1998-2010), as well as a Director of Sony Corporation (2006-2007). |
Joseph Mauriello (1944) |
Year of Election or Appointment: 2008 Trustee |
| Mr. Mauriello also serves as Trustee of other Fidelity funds. Prior to his retirement in January 2006, Mr. Mauriello served in numerous senior management positions including Deputy Chairman and Chief Operating Officer (2004-2005), and Vice Chairman of Financial Services (2002-2004) of KPMG LLP US (professional services, 1965-2005). Mr. Mauriello currently serves as a member of the Board of Directors of XL Group plc. (global insurance and re-insurance, 2006-present). Previously, Mr. Mauriello served as a Director of the Hamilton Funds of the Bank of New York (2006-2007) and of Arcadia Resources Inc. (health care services and products, 2007-2012). |
Robert W. Selander (1950) |
Year of Election or Appointment: 2011 Trustee |
| Mr. Selander also serves as Trustee of other Fidelity funds. Previously, Mr. Selander served as a Member of the Advisory Board of other Fidelity funds (2011), and Executive Vice Chairman (2010), Chief Executive Officer (2009-2010), and President and Chief Executive Officer (1997-2009) of Mastercard, Inc. |
Cornelia M. Small (1944) |
Year of Election or Appointment: 2005 Trustee |
| Ms. Small also serves as Trustee of other Fidelity funds. Ms. Small is a member of the Board of Directors (2009-present) and Chair of the Investment Committee (2010-present) of the Teagle Foundation. Ms. Small also serves on the Investment Committee of the Berkshire Taconic Community Foundation (2008-present). Previously, Ms. Small served as Chairperson (2002-2008) and a member of the Investment Committee and Chairperson (2008-2012) and a member of the Board of Trustees of Smith College. In addition, Ms. Small served as Chief Investment Officer, Director of Global Equity Investments, and a member of the Board of Directors of Scudder, Stevens & Clark and Scudder Kemper Investments. |
William S. Stavropoulos (1939) |
Year of Election or Appointment: 2002 Trustee Vice Chairman of the Independent Trustees |
| Mr. Stavropoulos also serves as Trustee of other Fidelity funds. Mr. Stavropoulos serves as President and Founder of the Michigan Baseball Foundation, the Great Lakes Loons (2007-present). Mr. Stavropoulos is Chairman Emeritus of the Board of Directors of The Dow Chemical Company, where he previously served in numerous senior management positions, including President, CEO (1995-2000; 2002-2004), Chairman of the Executive Committee (2000-2006), and as a member of the Board of Directors (1990-2006). Currently, Mr. Stavropoulos is Chairman of the Board of Directors of Univar Inc. (global distributor of commodity and specialty chemicals), a Director of Teradata Corporation (data warehousing and technology solutions), and Maersk Inc. (industrial conglomerate), and a member of the Advisory Board for Metalmark Capital LLC (private equity investment, 2005-present). Mr. Stavropoulos is an operating advisor to Clayton, Dubilier & Rice, LLC (private equity investment). In addition, Mr. Stavropoulos is a member of the University of Notre Dame Advisory Council for the College of Science, a Trustee of the Rollin L. Gerstacker Foundation, and a Director of the Naples Philharmonic Center for the Arts. Previously, Mr. Stavropoulos served as a Director of Chemical Financial Corporation (bank holding company, 1993-2012) and Tyco International, Ltd. (multinational manufacturing and services, 2007-2012). |
David M. Thomas (1949) |
Year of Election or Appointment: 2008 Trustee |
| Mr. Thomas also serves as Trustee of other Fidelity funds. Mr. Thomas serves as Non-Executive Chairman of the Board of Directors of Fortune Brands Home and Security (home and security products, 2011-present), and as a member of the Board of Directors of Interpublic Group of Companies, Inc. (marketing communication, 2004-present). Previously, Mr. Thomas served as Executive Chairman (2005-2006) and Chairman and Chief Executive Officer (2000-2005) of IMS Health, Inc. (pharmaceutical and healthcare information solutions), and a Director of Fortune Brands, Inc. (consumer products, 2000-2011). |
+ The information above includes each Trustee's principal occupation during the last five years and other information relating to the experience, attributes, and skills relevant to each Trustee's qualifications to serve as a Trustee, which led to the conclusion that each Trustee should serve as a Trustee for the fund.
Advisory Board Member and Executive Officers:
Correspondence intended for each executive officer and Peter S. Lynch may be sent to Fidelity Investments, 245 Summer Street, Boston, Massachusetts 02210. Executive officers appear below in alphabetical order.
Name, Year of Birth; Principal Occupation |
Peter S. Lynch (1944) |
Year of Election or Appointment: 2003 Member of the Advisory Board |
| Mr. Lynch also serves as Member of the Advisory Board of other Fidelity funds. Mr. Lynch is Vice Chairman and a Director of FMR and FMR Co., Inc. In addition, Mr. Lynch serves as a Trustee of Boston College and as the Chairman of the Inner-City Scholarship Fund. Previously, Mr. Lynch served on the Special Olympics International Board of Directors (1997-2006). |
Elizabeth Paige Baumann (1968) |
Year of Election or Appointment: 2012 Anti-Money Laundering (AML) Officer |
| Ms. Baumann also serves as AML Officer of other funds. She is Chief AML Officer of FMR LLC (2012-present) and is an employee of Fidelity Investments. Previously, Ms. Baumann served as Vice President and Deputy Anti-Money Laundering Officer (2007-2012). |
William C. Coffey (1969) |
Year of Election or Appointment: 2009 Assistant Secretary |
| Mr. Coffey also serves as Assistant Secretary of other funds. He is Senior Vice President and Deputy General Counsel of FMR LLC (2010-present), and is an employee of Fidelity Investments. Previously, Mr. Coffey served as Vice President and Associate General Counsel of FMR LLC (2005-2009). |
Jonathan Davis (1968) |
Year of Election or Appointment: 2010 Assistant Treasurer |
| Mr. Davis also serves as Assistant Treasurer of other funds. Mr. Davis is an employee of Fidelity Investments. Previously, Mr. Davis served as Vice President and Associate General Counsel of FMR LLC (2003-2010). |
Adrien E. Deberghes (1967) |
Year of Election or Appointment: 2008 Deputy Treasurer |
| Mr. Deberghes also serves as an officer of other funds. He is an employee of Fidelity Investments (2008-present). Prior to joining Fidelity Investments, Mr. Deberghes was Senior Vice President of Mutual Fund Administration at State Street Corporation (2007-2008), Senior Director of Mutual Fund Administration at Investors Bank & Trust (2005-2007), and Director of Finance for Dunkin' Brands (2000-2005). |
Stephanie J. Dorsey (1969) |
Year of Election or Appointment: 2010 Assistant Treasurer |
| Ms. Dorsey also serves as an officer of other funds. She is an employee of Fidelity Investments (2008-present) and has served in other fund officer roles. Prior to joining Fidelity Investments, Ms. Dorsey served as Treasurer (2004-2008) of the JPMorgan Mutual Funds and Vice President (2004-2008) of JPMorgan Chase Bank. |
Scott C. Goebel (1968) |
Year of Election or Appointment: 2008 Secretary and Chief Legal Officer (CLO) |
| Mr. Goebel serves as Secretary and CLO of other funds. Mr. Goebel also serves as Secretary of Fidelity Investments Money Management, Inc. (FIMM) (2010-present) and Fidelity Research and Analysis Company (FRAC) (2010-present); General Counsel, Secretary, and Senior Vice President of FMR (2008-present) and FMR Co., Inc. (2008-present); Chief Legal Officer of Fidelity Management & Research (Hong Kong) Limited (2008-present) and Assistant Secretary of Fidelity Management & Research (Japan) Inc. (2008-present), and Fidelity Management & Research (U.K.) Inc. (2008-present). Previously, Mr. Goebel served as Secretary and CLO of other Fidelity funds (2008-2013), Assistant Secretary of FIMM (2008-2010), FRAC (2008-2010), and certain funds (2007-2008); and as Vice President and Secretary of Fidelity Distributors Corporation (FDC) (2005-2007). Mr. Goebel has been employed by FMR LLC or an affiliate since 2001. |
Joseph A. Hanlon (1968) |
Year of Election or Appointment: 2012 Chief Compliance Officer |
| Mr. Hanlon also serves as Chief Compliance Officer of other funds. Mr. Hanlon serves as Compliance Officer of FMR, FMR Co., Inc., Fidelity Investments Money Management, Inc. (FIMM), Fidelity Research and Analysis Company (FRAC), and Fidelity Management & Research (Hong Kong) (2009-present), as Senior Vice President of the Fidelity Asset Management Division (2009-present), and is an employee of Fidelity Investments. Previously, Mr. Hanlon served as Compliance Officer of Fidelity Management & Research (Japan) Inc. (2009-2013), Strategic Advisers, Inc. (2009-2013), and Fidelity Management & Research (U.K.) Inc. (2009-2013). |
Bruce T. Herring (1965) |
Year of Election or Appointment: 2006 Vice President of certain Equity Funds |
| Mr. Herring also serves as Vice President of other funds. He serves as Chief Investment Officer of Fidelity Global Asset Allocation (GAA) (2013-present), Chief Investment Officer and Director of Fidelity Management & Research (U.K.) Inc. (2010-present), Group Chief Investment Officer of FMR, and President of Fidelity Research & Analysis Company (2010-present). Previously, Mr. Herring served as Vice President (2005-2006) and Senior Vice President (2006-2007) of Fidelity Management & Research Company, Vice President of FMR Co., Inc. (2001-2007), and as a portfolio manager for Fidelity U.S. Equity Funds. |
Brian B. Hogan (1964) |
Year of Election or Appointment: 2009 Vice President |
| Mr. Hogan also serves as Vice President of other funds. Mr. Hogan serves as President of FMR's Equity Division (2009-present). Previously, Mr. Hogan served as Senior Vice President, Equity Research of FMR (2006-2009) and as a portfolio manager. |
Chris Maher (1972) |
Year of Election or Appointment: 2013 Assistant Treasurer |
| Mr. Maher serves as Assistant Treasurer of other funds. Mr. Maher is Vice President of Valuation Oversight and is an employee of Fidelity Investments. Previously, Mr. Maher served as Vice President of Asset Management Compliance (2013), Vice President of FMR's Program Management Group (2010-2013), and Vice President of Valuation Oversight (2008-2010). |
Christine Reynolds (1958) |
Year of Election or Appointment: 2008 Chief Financial Officer |
| Ms. Reynolds also serves as Chief Financial Officer of other funds. Ms. Reynolds became President of Fidelity Pricing and Cash Management Services (FPCMS) in August 2008. Ms. Reynolds served as Chief Operating Officer of FPCMS (2007-2008). Previously, Ms. Reynolds served as President, Treasurer, and Anti-Money Laundering officer of the Fidelity funds (2004-2007). |
Kenneth B. Robins (1969) |
Year of Election or Appointment: 2008 President and Treasurer |
| Mr. Robins also serves as an officer of other funds. Mr. Robins serves as Executive Vice President of Fidelity Investments Money Management, Inc. (FIMM) (2013-present) and is an employee of Fidelity Investments (2004-present). Previously, Mr. Robins served in other fund officer roles. |
Gary W. Ryan (1958) |
Year of Election or Appointment: 2005 Assistant Treasurer |
| Mr. Ryan also serves as Assistant Treasurer of other funds. Mr. Ryan is an employee of Fidelity Investments and has served in other fund officer roles. Previously, Mr. Ryan served as Vice President of Fund Reporting in Fidelity Pricing and Cash Management Services (FPCMS) (1999-2005). |
Stephen Sadoski (1971) |
Year of Election or Appointment: 2012 Deputy Treasurer |
| Mr. Sadoski also serves as Deputy Treasurer of other funds. He is an employee of Fidelity Investments (2012-present) and has served in another fund officer role. Prior to joining Fidelity Investments, Mr. Sadoski served as an assistant chief accountant in the Division of Investment Management of the Securities and Exchange Commission (SEC) (2009-2012) and as a senior manager at Deloitte & Touche LLP (1997-2009). |
Stacie M. Smith (1974) |
Year of Election or Appointment: 2013 Deputy Treasurer |
| Ms. Smith also serves as an officer of other funds. She is an employee of Fidelity Investments (2009-present) and has served in other fund officer roles. Prior to joining Fidelity Investments, Ms. Smith served as Senior Audit Manager of Ernst & Young LLP (1996-2009). |
Renee Stagnone (1975) |
Year of Election or Appointment: 2013 Deputy Treasurer |
| Ms. Stagnone also serves as Deputy Treasurer of other funds. Ms. Stagnone is an employee of Fidelity Investments. |
Joseph F. Zambello (1957) |
Year of Election or Appointment: 2011 Deputy Treasurer |
| Mr. Zambello also serves as Deputy Treasurer of other funds. Mr. Zambello is an employee of Fidelity Investments. Previously, Mr. Zambello served as Vice President of FMR's Program Management Group (2009-2011) and Vice President of the Transfer Agent Oversight Group (2005-2009). |
Annual Report
The Board of Trustees of Fidelity Advisor Emerging Markets Discovery Fund voted to pay to shareholders of record at the opening of business on record date, the following distributions per share derived from capital gains realized from sales of portfolio securities and dividends derived from net investment income:
| Pay Date | Record Date | Dividends | Capital Gains |
Class A | 12/09/13 | 12/06/13 | $0.058 | $0.30 |
Class T | 12/09/13 | 12/06/13 | $0.017 | $0.30 |
Class C | 12/09/13 | 12/06/13 | $0.000 | $0.30 |
The fund hereby designates as a capital gain dividend with respect to the taxable year ended October 31, 2013, $2,657,028, or, if subsequently determined to be different, the net capital gain of such year.
A percentage of the dividends distributed during the fiscal year for the following funds may be taken into account as a dividend for purposes of the maximum rate under section 1(h)(11) of the Internal Revenue Code:
December 7, 2012 |
Class A | 18% |
Class T | 19% |
Class C | 21% |
The amounts per share which represent income derived from sources within, and taxes paid to, foreign countries or possessions of the United States are as follows:
| Pay Date | Income | Taxes |
Class A | 12/10/12 | $0.090 | $0.0134 |
| 12/28/12 | $0.000 | $0.0000 |
Class T | 12/10/12 | $0.086 | $0.0134 |
| 12/28/12 | $0.000 | $0.0000 |
Class C | 12/10/12 | $0.077 | $0.0134 |
| 12/28/12 | $0.000 | $0.0000 |
The fund will notify shareholders in January 2014 of amounts for use in preparing 2013 income tax returns.
Annual Report
Board Approval of Investment Advisory Contracts and Management Fees
Fidelity Emerging Markets Discovery Fund
Each year, the Board of Trustees, including the Independent Trustees (together, the Board), votes on the renewal of the management contract and sub-advisory agreements (together, the Advisory Contracts) for the fund. The Board, assisted by the advice of fund counsel and Independent Trustees' counsel, requests and considers a broad range of information relevant to the renewal of the Advisory Contracts throughout the year.
The Board meets regularly and, at each of its meetings, covers an extensive agenda of topics and materials and considers factors that are relevant to its annual consideration of the renewal of the fund's Advisory Contracts, including the services and support provided to the fund and its shareholders. The Board has established various standing committees, each composed of and chaired by Independent Trustees with varying backgrounds, to which the Board has assigned specific subject matter responsibilities in order to enhance effective decision-making by the Board. The Board, acting directly and through its Committees, requests and receives information concerning the annual consideration of the renewal of the fund's Advisory Contracts. The Board also meets as needed to consider matters specifically related to the Board's annual consideration of the renewal of Advisory Contracts. Members of the Board may also meet with trustees of other Fidelity funds through ad hoc joint committees to discuss certain matters relevant to the Fidelity funds.
At its July 2013 meeting, the Board, including the Independent Trustees, unanimously determined to renew the fund's Advisory Contracts. In reaching its determination, the Board considered all factors it believed relevant, including (i) the nature, extent, and quality of the services to be provided to the fund and its shareholders (including the investment performance of the fund); (ii) the competitiveness of the fund's management fee and total expense ratio relative to peer funds; (iii) the total costs of the services to be provided by and the profits to be realized by Fidelity from its relationship with the fund; (iv) the extent to which economies of scale exist and would be realized as the fund grows; and (v) whether fee levels reflect these economies of scale, if any, for the benefit of fund shareholders.
In considering whether to renew the Advisory Contracts for the fund, the Board reached a determination, with the assistance of fund counsel and Independent Trustees' counsel and through the exercise of its business judgment, that the renewal of the Advisory Contracts was in the best interests of the fund and its shareholders and that the compensation payable under the Advisory Contracts was fair and reasonable. The Board's decision to renew the Advisory Contracts was not based on any single factor, but rather was based on a comprehensive consideration of all the information provided to the Board at its meetings throughout the year. The Board, in reaching its determination to renew the Advisory Contracts, was aware that shareholders in the fund have a broad range of investment choices available to them, including a wide choice among mutual funds offered by Fidelity's competitors, and that the fund's shareholders, who have the opportunity to review and weigh the disclosure provided by the fund in its prospectus and other public disclosures, have chosen to invest in this fund, which is a part of the Fidelity family of funds.
Annual Report
Nature, Extent, and Quality of Services Provided. The Board considered the staffing within the investment adviser, Fidelity Management & Research Company (FMR), and the sub-advisers (together, the Investment Advisers) as it relates to the fund, including the backgrounds of the fund's investment personnel, and also considered the fund's investment objective, strategies, and related investment philosophy. The Independent Trustees also had discussions with senior management of Fidelity's investment operations and investment groups. The Board considered the structure of the portfolio manager compensation program and whether this structure provides appropriate incentives to act in the best interests of the fund.
Resources Dedicated to Investment Management and Support Services. The Board and the Fund Oversight and Research Committees reviewed the general qualifications and capabilities of the Investment Advisers' investment staff, including its size, education, experience, and resources, as well as the Investment Advisers' approach to recruiting, training, managing, and compensating investment personnel. The Board noted that FMR has continued to increase the resources devoted to non-U.S. offices, including expansion of Fidelity's global investment organization. The Board also noted that Fidelity's analysts have extensive resources, tools and capabilities that allow them to conduct sophisticated quantitative and fundamental analysis, as well as credit analysis of issuers, counterparties and guarantors. Further, the Board believes that Fidelity's investment professionals have sufficient access to global information and data so as to provide competitive investment results over time, and that those professionals also have access to sophisticated tools that permit them to assess portfolio construction and risk and performance attribution characteristics continuously, as well as to transmit new information and research conclusions rapidly around the world. Additionally, in its deliberations, the Board considered the Investment Advisers' trading and risk management capabilities and resources, which are an integral part of the investment management process.
Shareholder and Administrative Services. The Board considered (i) the nature, extent, quality, and cost of advisory, administrative, and shareholder services performed by the Investment Advisers and their affiliates under the Advisory Contracts and under separate agreements covering transfer agency, pricing and bookkeeping, and securities lending services for the fund; (ii) the nature and extent of the supervision of third party service providers, principally custodians and subcustodians; and (iii) the resources devoted to, and the record of compliance with, the fund's compliance policies and procedures. The Board also reviewed the allocation of fund brokerage, including allocations to brokers affiliated with the Investment Advisers, the use of brokerage commissions to pay fund expenses, and the use of "soft" commission dollars to pay for research services.
Annual Report
Board Approval of Investment Advisory Contracts and
Management Fees - continued
The Board noted that the growth of fund assets over time across the complex allows Fidelity to reinvest in the development of services designed to enhance the value or convenience of the Fidelity funds as investment vehicles. These services include 24-hour access to account information and market information through telephone representatives and over the Internet, investor education materials and asset allocation tools, and the expanded availability of Fidelity Investor Centers.
Investment in a Large Fund Family. The Board considered the benefits to shareholders of investing in a Fidelity fund, including the benefits of investing in a fund that is part of a large family of funds offering a variety of investment disciplines and providing a large variety of mutual fund investor services. The Board noted that Fidelity had taken, or had made recommendations that resulted in the Fidelity funds taking, a number of actions over the previous year that benefited particular funds, including (i) continuing to dedicate additional resources to investment research and to the support of the senior management team that oversees asset management; (ii) persisting in efforts to enhance Fidelity's global research capabilities; (iii) launching new funds and making other enhancements to meet client needs for global and income-oriented solutions; (iv) continuing to launch dedicated lower cost underlying funds to meet portfolio construction needs related to expanding underlying fund options for Fidelity funds of funds, specifically for the Freedom Fund product lines; (v) rationalizing product lines and gaining increased efficiencies through the mergers of several funds into other funds; (vi) strengthening Fidelity's index fund offerings by reducing investment minimums and adopting or lowering existing expense caps for certain funds and classes; (vii) enhancing Global Asset Allocation product offerings by launching new funds and strategies, including "open architecture" target date funds that utilize affiliated and unaffiliated sub-advisers; (viii) modifying the eligibility criteria for Institutional Class shares of Advisor funds to increase their marketability to a portion of the defined contribution plan market; (ix) creating a new low-cost retirement share class for certain Advisor funds to appeal to large retirement plans; (x) transitioning the management of certain Fidelity commodity funds to Geode Capital Management LLC, a registered commodity pool operator, while retaining administrative responsibilities for the funds; (xi) reorganizing a number of funds; and (xii) taking steps toward establishing a new Fidelity adviser to manage sector-based funds and products.
Investment Performance. The Board considered whether the fund has operated in accordance with its investment objective, as well as its record of compliance with its investment restrictions and its performance history.
The Board took into account discussions with the Investment Advisers about fund investment performance that occur at Board meetings throughout the year. In this regard the Board noted that as part of regularly scheduled fund reviews and other reports to the Board on fund performance, the Board periodically considers annualized return information for the fund, for different time periods, measured against a securities market index ("benchmark index") and a peer group of mutual funds with similar objectives ("peer group"). In its evaluation of fund investment performance, the Board gave particular attention to information indicating changes in performance of certain Fidelity funds for specific time periods and the Investment Advisers' explanations for any overperformance or underperformance.
Annual Report
In addition to reviewing absolute and relative fund performance, the Independent Trustees periodically consider the appropriateness of fund performance metrics in evaluating the results achieved. In general, the Independent Trustees believe that fund performance should be evaluated based on net performance (after fees and expenses) of both the highest performing and lowest performing classes, where applicable, compared to appropriate benchmark indices, over appropriate time periods which may include full market cycles, and compared to peer groups, as applicable, over the same periods, taking into account relevant factors including the following: general market conditions; issuer-specific information; tactical opportunities for investment; and fund cash flows and other factors.
The Independent Trustees recognize that shareholders evaluate performance on a net basis over their own holding periods, for which one-, three-, and five-year periods are used as a proxy. For this reason, the performance information reviewed by the Board also included net cumulative calendar year total return information for the fund and an appropriate benchmark index and peer group for the most recent one-year period, as shown below. Returns are shown compared to the 25th percentile (top of box) and 75th percentile (bottom of box) of the peer universe.
Annual Report
Board Approval of Investment Advisory Contracts and
Management Fees - continued
Fidelity Emerging Markets Discovery Fund
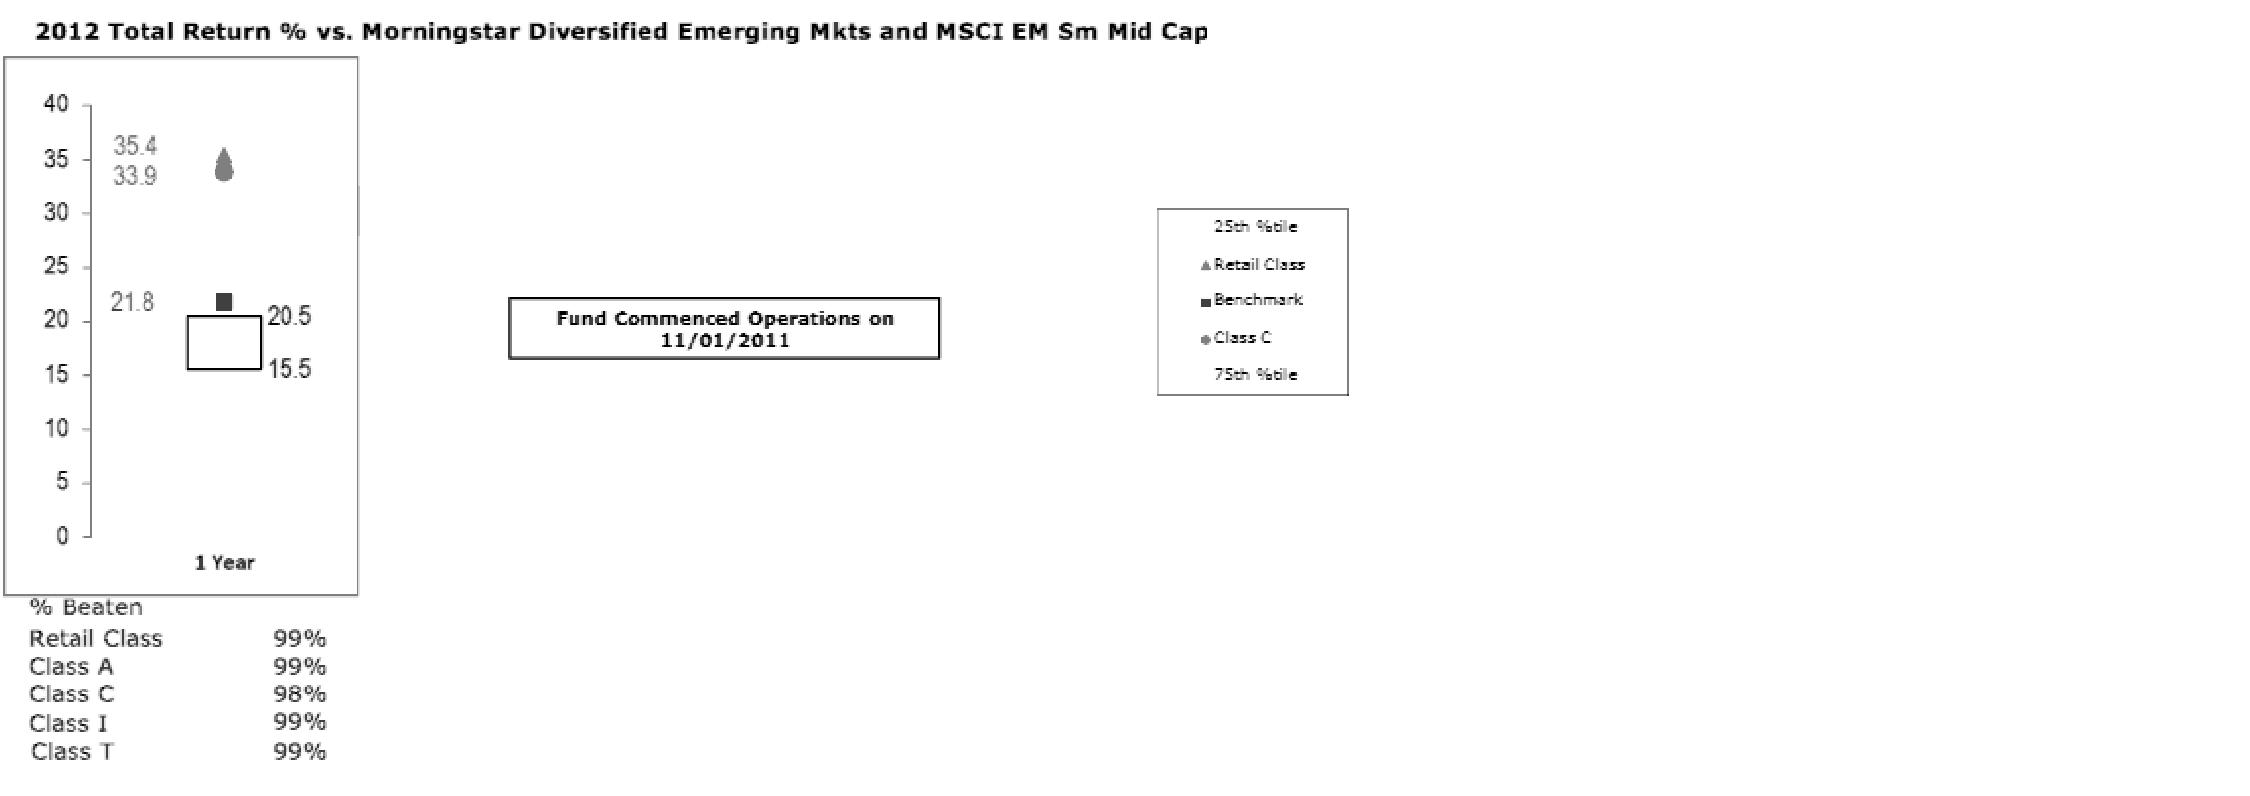
Based on its review, the Board concluded that the nature, extent, and quality of services provided to the fund under the Advisory Contracts should benefit the fund's shareholders.
Competitiveness of Management Fee and Total Expense Ratio. The Board considered the fund's management fee and total expense ratio compared to "mapped groups" of competitive funds and classes. Fidelity creates "mapped groups" by combining similar Lipper investment objective categories that have comparable management fee characteristics. Combining Lipper investment objective categories aids the Board's management fee and total expense ratio comparisons by broadening the competitive group used for comparison and by reducing the number of universes to which various Fidelity funds are compared.
Management Fee. The Board considered two proprietary management fee comparisons for the 12-month (or shorter) periods shown in the chart below. The group of Lipper funds used by the Board for management fee comparisons is referred to below as the "Total Mapped Group." The Total Mapped Group comparison focuses on a fund's standing in terms of gross management fees before expense reimbursements or caps relative to the total universe of funds with comparable investment mandates, regardless of whether their management fee structures also are comparable. Funds with comparable investment mandates offer exposure to similar types of securities. Funds with comparable management fee structures have similar management fee contractual arrangements (e.g., flat rate charged for advisory services, all-inclusive fee rate, etc.). "TMG %" represents the percentage of funds in the Total Mapped Group that had management fees that were lower than the fund's. For example, a TMG % of 19% means that 81% of the funds in the Total Mapped Group had higher management fees than the fund. The "Asset-Size Peer Group" (ASPG) comparison focuses on a fund's standing relative to a subset of non-Fidelity funds within the Total Mapped Group that are similar in size and management fee structure. The ASPG represents at least 15% of the funds in the Total Mapped Group with comparable asset size and management fee structures, subject to a minimum of 50 funds (or all funds in the Total Mapped Group if fewer than 50). Additional information, such as the ASPG quartile in which the fund's management fee ranked, is also included in the chart and considered by the Board.
Annual Report
Fidelity Emerging Markets Discovery Fund
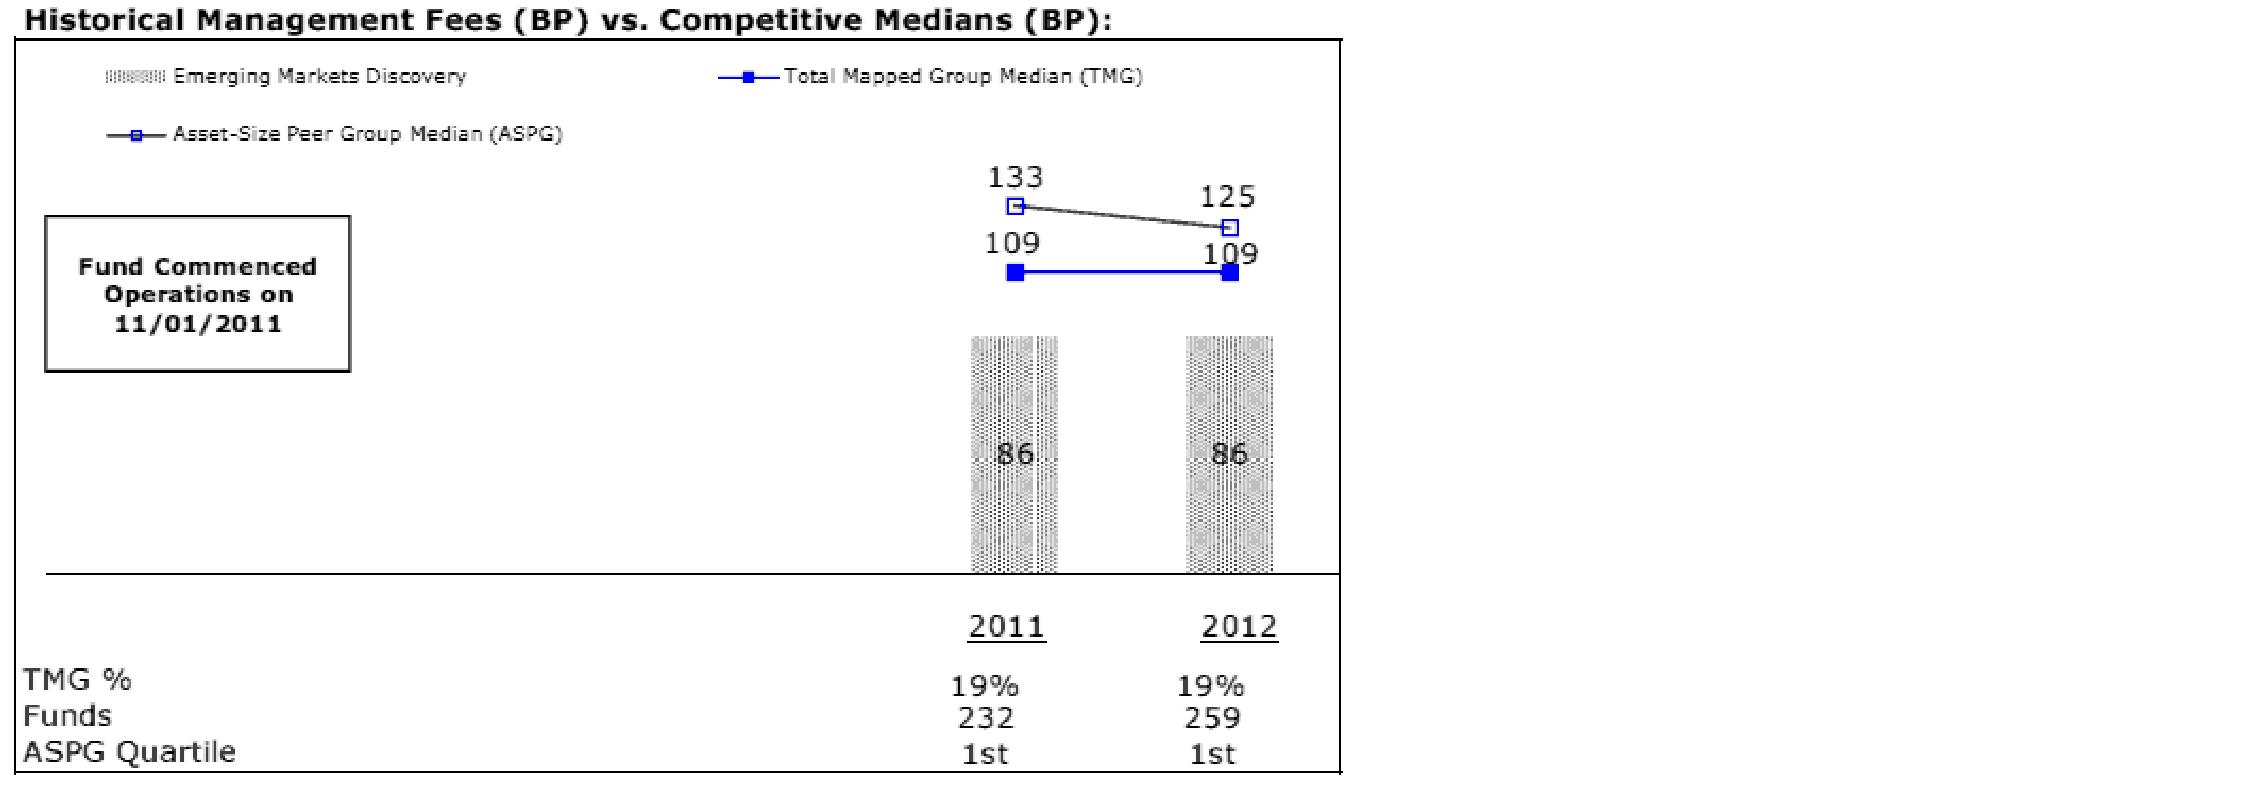
The Board noted that the fund's management fee ranked below the median of its Total Mapped Group and below the median of its ASPG for 2012.
Based on its review, the Board concluded that the fund's management fee is fair and reasonable in light of the services that the fund receives and the other factors considered.
Total Expense Ratio. In its review of each class's total expense ratio, the Board considered the fund's management fee as well as other fund or class expenses, as applicable, such as transfer agent fees, pricing and bookkeeping fees, fund-paid 12b-1 fees, and custodial, legal, and audit fees. The Board also noted the effects of any waivers and reimbursements on fees and expenses. As part of its review, the Board also considered the current and historical total expense ratios of each class of the fund compared to competitive fund median expenses. Each class of the fund is compared to those funds and classes in the Total Mapped Group (used by the Board for management fee comparisons) that have a similar sales load structure.
Annual Report
Board Approval of Investment Advisory Contracts and
Management Fees - continued
The Board noted that the total expense ratio of each of Class A and the retail class ranked below its competitive median for 2012 and the total expense ratio of each of Class T, Class C, and Institutional Class ranked above its competitive median for 2012. The Board considered that, in general, various factors can affect total expense ratios. The Board noted that the total expense ratio of Class T was above the competitive median primarily because of higher 12b-1 fees on Class T. Class T has a higher 12b-1 fee, but a lower front-end sales charge, than traditionally priced front-end sales charge classes. The Board considered that Class T is primarily sold load-waived in the retirement plan market where its 0.50% 12b-1 fee is comparable to competing no-load, higher 12b-1 fee classes designed specifically for retirement plans. The Board noted that the fund offers multiple classes, each of which has a different sales load and 12b-1 fee structure, and that the multiple structures are intended to offer a range of pricing options for the intermediary market. The Board also noted that the total expense ratios of the classes vary primarily by the level of their 12b-1 fees, although differences in transfer agent fees may also cause expenses to vary from class to class.
The Board further considered that FMR contractually agreed to reimburse Class A, Class T, Class C, Institutional Class, and the retail class of the fund to the extent that total operating expenses (excluding interest, taxes, certain securities lending costs, brokerage commissions, extraordinary expenses, and acquired fund fees and expenses, if any), as a percentage of their respective average net assets, exceed 1.70%, 1.95%, 2.45%, 1.45%, and 1.45% through December 31, 2013.
Fees Charged to Other Fidelity Clients. The Board also considered Fidelity fee structures and other information with respect to clients of FMR and its affiliates, such as other mutual funds advised or subadvised by FMR or its affiliates, pension plan clients, and other institutional clients. The Board noted the findings of the 2013 ad hoc joint committee (created with the board of other Fidelity funds), which reviewed and compared Fidelity's institutional investment advisory business with its business of providing services to the Fidelity funds, including the differences in services provided, fees charged, and costs incurred, as well as competition in their respective marketplaces.
Based on its review of total expense ratios and fees charged to other Fidelity clients, the Board concluded that the total expense ratio of each class of the fund was reasonable, although in some cases above the median of the universe presented for comparison, in light of the services that the fund and its shareholders receive and the other factors considered.
Costs of the Services and Profitability. The Board considered the revenues earned and the expenses incurred by Fidelity in conducting the business of developing, marketing, distributing, managing, administering and servicing the fund and servicing the fund's shareholders. The Board also considered the level of Fidelity's profits in respect of all the Fidelity funds.
Annual Report
On an annual basis, FMR presents to the Board Fidelity's profitability for the fund. Fidelity calculates the profitability for each fund, as well as aggregate profitability for groups of Fidelity funds and all Fidelity funds, using a series of detailed revenue and cost allocation methodologies which originate with the books and records of Fidelity on which Fidelity's audited financial statements are based. The Audit Committee of the Board reviews any significant changes from the prior year's methodologies.
PricewaterhouseCoopers LLP (PwC), independent registered public accounting firm and auditor to Fidelity and certain Fidelity funds, has been engaged annually by the Board as part of the Board's assessment of Fidelity's profitability analysis. PwC's engagement includes the review and assessment of the methodologies used by Fidelity in determining the revenues and expenses attributable to Fidelity's mutual fund business, and completion of agreed-upon procedures surrounding the mathematical accuracy of fund profitability and its conformity to allocation methodologies. After considering PwC's reports issued under the engagement and information provided by Fidelity, the Board concluded that while other allocation methods may also be reasonable, Fidelity's profitability methodologies are reasonable in all material respects.
The Board also reviewed Fidelity's non-fund businesses and fall-out benefits related to the mutual fund business as well as cases where Fidelity's affiliates may benefit from or be related to the fund's business.
The Board considered the costs of the services provided by and the profits realized by Fidelity in connection with the operation of the fund and was satisfied that the profitability was not excessive in the circumstances.
Economies of Scale. The Board considered whether there have been economies of scale in respect of the management of the Fidelity funds, whether the Fidelity funds (including the fund) have appropriately benefited from any such economies of scale, and whether there is potential for realization of any further economies of scale. The Board considered the extent to which the fund will benefit from economies of scale through increased services to the fund, through waivers or reimbursements, or through fee or expense reductions. The Board also noted that in 2009, it and the board of other Fidelity funds created an ad hoc committee (the Economies of Scale Committee) to analyze whether FMR attains economies of scale in respect of the management and servicing of the Fidelity funds, whether the Fidelity funds have appropriately benefited from such economies of scale, and whether there is potential for realization of any further economies of scale.
The Board recognized that the fund's management contract incorporates a "group fee" structure, which provides for lower group fee rates as total fund assets under FMR's management increase, and for higher group fee rates as total fund assets under FMR's management decrease. FMR calculates the group fee rates based on a tiered asset "breakpoint" schedule that varies based on asset class. The Board considered that the group fee is designed to deliver the benefits of economies of scale to fund shareholders when total Fidelity fund assets increase, even if assets of any particular fund are unchanged or have declined, because some portion of Fidelity's costs are attributable to services provided to all Fidelity funds, and all funds benefit if those costs can be allocated among more assets. The Board concluded that, given the group fee structure, fund shareholders will benefit from lower management fees as assets under FMR's management increase at the fund complex level, regardless of whether Fidelity achieves any such economies of scale.
Annual Report
Board Approval of Investment Advisory Contracts and
Management Fees - continued
The Board concluded, taking into account the analysis of the Economies of Scale Committee, that economies of scale, if any, are being appropriately shared between fund shareholders and Fidelity.
Amendment to Description of Group Fee Rate. At its July 2013 meeting, the Board voted to approve an amendment to the fund's management contract to modify the description of the "group fee rate" effective August 1, 2013. The Board noted that under the prior description in the contract, the group fee rate was based on the average net assets of all registered investment companies with which FMR has management contracts. Under the contract's tiered asset breakpoint schedule, the group fee rate is lower as total fund assets under FMR's management increase, and higher as total fund assets under FMR's management decrease. The Board considered that the prior description would have excluded the assets of 64 Fidelity sector funds from the group fee rate calculation once Fidelity SelectCo, LLC, an affiliate of FMR, assumed management responsibilities for those funds. The Board noted that modifying the description of the group fee rate to continue to include the assets of those 64 funds for purposes of determining group fee rate breakpoints would avoid an immediate adverse impact on the group fee rate for any fund.
Additional Information Requested by the Board. In order to develop fully the factual basis for consideration of the Fidelity funds' Advisory Contracts, the Board requested and received additional information on certain topics, including: (i) fund performance trends and Fidelity's long-term strategies for certain funds; (ii) the potential to further rationalize the Fidelity fund lineup with the possibility of achieving savings for the funds and Fidelity; (iii) the methodology with respect to competitive fund data and peer group classifications; (iv) the arrangements with, and performance of, certain sub-advisers on behalf of the Fidelity funds, as well as certain proposed participating affiliate arrangements; (v) the realization of fall-out benefits in certain Fidelity business units; (vi) Fidelity's group fee structures, including the rationale for the individual fee rates of certain categories of funds and the definition of group assets; (vii) trends regarding industry use of performance fee structures and the performance adjustment methodologies applicable to the Fidelity funds; (viii) additional competitive analysis regarding the total expenses for certain classes; and (ix) fund profitability methodology, including Fidelity's cost allocation methodology, and the impact of certain factors on fund profitability results.
Annual Report
Based on its evaluation of all of the conclusions noted above, and after considering all factors it believed relevant, the Board ultimately concluded that the advisory fee structures are fair and reasonable, and that the fund's Advisory Contracts should be renewed.
Annual Report
Investment Adviser
Fidelity Management & Research Company
Boston, MA
Investment Sub-Advisers
FMR Co., Inc.
Fidelity Management & Research
(U.K.) Inc.
Fidelity Management & Research
(Hong Kong) Limited
Fidelity Management & Research
(Japan) Inc.
FIL Investments (Japan) Limited
FIL Investment Advisors (UK) Limited
FIL Investment Advisors
General Distributor
Fidelity Distributors Corporation
Smithfield, RI
Transfer and Service Agents
Fidelity Investments Institutional Operations Company, Inc.
Boston, MA
Fidelity Service Company, Inc.
Boston, MA
Custodian
The Northern Trust Company
Chicago, IL
(Fidelity Investment logo)(registered trademark)
AEMD-UANN-1213
1.931249.101
(Fidelity Investment logo)(registered trademark)
Fidelity Advisor®
Emerging Markets Discovery
Fund - Institutional Class
Annual Report
October 31, 2013
(Fidelity Cover Art)
Institutional Class is
a class of Fidelity®
Emerging Markets
Discovery Fund
Contents
Performance | (Click Here) | How the fund has done over time. |
Management's Discussion of Fund Performance | (Click Here) | The Portfolio Manager's review of fund performance and strategy. |
Shareholder Expense Example | (Click Here) | An example of shareholder expenses. |
Investment Changes | (Click Here) | A summary of major shifts in the fund's investments over the past six months. |
Investments | (Click Here) | A complete list of the fund's investments with their market values. |
Financial Statements | (Click Here) | Statements of assets and liabilities, operations, and changes in net assets,
as well as financial highlights. |
Notes | (Click Here) | Notes to the financial statements. |
Report of Independent Registered Public Accounting Firm | (Click Here) | |
Trustees and Officers | (Click Here) | |
Distributions | (Click Here) | |
Board Approval of Investment Advisory Contracts and Management Fees | (Click Here) | |
To view a fund's proxy voting guidelines and proxy voting record for the 12-month period ended June 30, visit http://www.fidelity.com/proxyvotingresults or visit the Securities and Exchange Commission's (SEC) web site at http://www.sec.gov. You may also call 1-877-208-0098 to request a free copy of the proxy voting guidelines.
Standard & Poor's, S&P and S&P 500 are registered service marks of The McGraw-Hill Companies, Inc. and have been licensed for use by Fidelity Distributors Corporation.
Other third-party marks appearing herein are the property of their respective owners.
All other marks appearing herein are registered or unregistered trademarks or service marks of FMR LLC or an affiliated company. © 2013 FMR LLC. All rights reserved.
Annual Report
This report and the financial statements contained herein are submitted for the general information of the shareholders of the fund. This report is not authorized for distribution to prospective investors in the fund unless preceded or accompanied by an effective prospectus.
A fund files its complete schedule of portfolio holdings with the SEC for the first and third quarters of each fiscal year on Form N-Q. Forms N-Q are available on the SEC's web site at http://www.sec.gov. A fund's Forms N-Q may be reviewed and copied at the SEC's Public Reference Room in Washington, DC. Information regarding the operation of the SEC's Public Reference Room may be obtained by calling 1-800-SEC-0330. For a complete list of a fund's portfolio holdings, view the most recent holdings listing, semiannual report, or annual report on Fidelity's web site at http://www.fidelity.com, http://www.advisor.fidelity.com, or http://www.401k.com, as applicable.
NOT FDIC INSURED • MAY LOSE VALUE • NO BANK GUARANTEE
Neither the fund nor Fidelity Distributors Corporation is a bank.
Annual Report
Average annual total return reflects the change in the value of an investment, assuming reinvestment of the class' distributions from dividend income and capital gains (the profits earned upon the sale of securities that have grown in value, if any) and assuming a constant rate of performance each year. The $10,000 table and the fund's returns do not reflect the deduction of taxes that a shareholder would pay on fund distributions or the redemption of fund shares. During periods of reimbursement by Fidelity, a fund's total return will be greater than it would be had the reimbursement not occurred. How a fund did yesterday is no guarantee of how it will do tomorrow.
Average Annual Total Returns
Periods ended October 31, 2013 | Past 1
year | Life of
fund A |
Institutional Class | 7.45% | 13.25% |
A From November 1, 2011
$10,000 Over Life of Fund
Let's say hypothetically that $10,000 was invested in Fidelity Advisor® Emerging Markets Discovery Fund - Institutional Class on November 1, 2011, when the fund started. The chart shows how the value of your investment would have changed, and also shows how the MSCI® Emerging Markets SMID Cap Index performed over the same period.
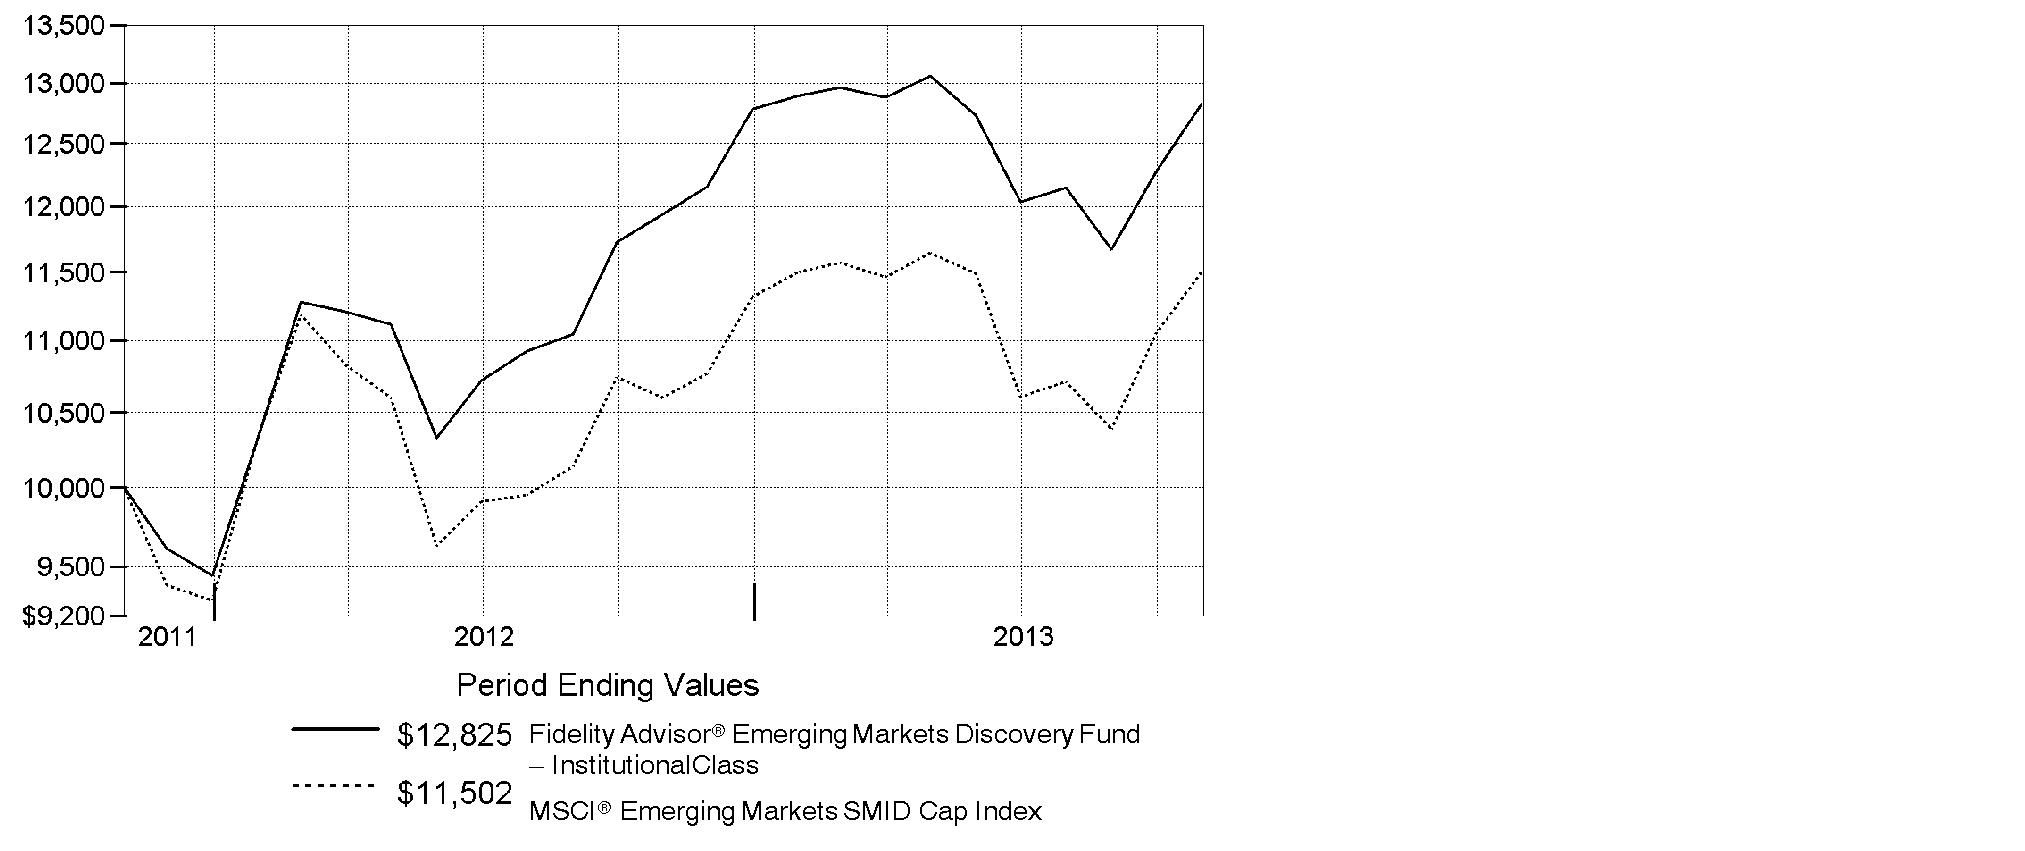
Annual Report
Market Recap: On balance, global equity markets remained upbeat for the 12-month period ending October 31, 2013. The MSCI® ACWI® (All Country World Index) Index gained 23.75% for the period, amid investor preference for higher-risk assets. The period was not without turbulence, however. In the spring and summer, central banks worldwide, especially in the U.S. and China, made clear their intentions to maintain accommodative monetary policies. That stance, combined with modest cyclical improvements around the globe and generally low valuations, underpinned the broad rally in equities. Europe (+32%) shone brightly, with most markets in the region - large and small - registering solid, index-beating gains. Another bright spot was Japan, which, despite a struggling yen and taking a second-half breather, posted a 34% result for the full year. The U.S. - by far the index's biggest constituent - also outperformed the global market with a roughly 28% advance. Meanwhile, Asia-Pacific ex Japan (+14%) lagged, hurt in part by a slowdown in Australia's mining industry as well as currency headwinds. Foreign-exchange and commodity weakness also curbed results in resource-heavy Canada and emerging markets (EM), both of which were up 7%. Country-level EM performance diverged meaningfully for the period, as evidenced by performance in Brazil (-1%), Russia (+12%), India (+1%) and China (+8%).
Comments from Ashish Swarup, Portfolio Manager of Fidelity Advisor® Emerging Markets Discovery Fund: For the year, the fund's Institutional Class shares advanced 7.45%, trailing the 8.55% gain of the MSCI® Emerging Markets SMID Cap Index. Versus the index, underweighting Malaysia and China hurt, as did stock picks in South Korea. Looking at individual stocks, I saw opportunity in South Africa-based gold miner and non-index investment AngloGold Ashanti. I considered the company to be of high quality, well run and shareholder friendly, and the stock has historically been a steady performer. Unfortunately, shares fell this period alongside the price of gold. I sold AngloGold in May. Conversely, an overweighting in St. Shine Optical was a winner. The contact lens and glasses maker based in Taiwan consistently gained market share due to the high quality and reliability of its products. I was attracted to the company's good management team and high return on equity of its business, as well as the stock's attractive valuation when I purchased it prior to the beginning of the reporting period. The stock performed very well during the past 12 months, and as its price continued to appreciate, I sold some of St. Shine to take profits.
The views expressed above reflect those of the portfolio manager(s) only through the end of the period as stated on the cover of this report and do not necessarily represent the views of Fidelity or any other person in the Fidelity organization. Any such views are subject to change at any time based upon market or other conditions and Fidelity disclaims any responsibility to update such views. These views may not be relied on as investment advice and, because investment decisions for a Fidelity fund are based on numerous factors, may not be relied on as an indication of trading intent on behalf of any Fidelity fund.
Annual Report
Fidelity Emerging Markets Discovery Fund
Shareholder Expense Example
As a shareholder of the Fund, you incur two types of costs: (1) transaction costs, including sales charges (loads) on purchase payments or redemption proceeds, redemption fees and (2) ongoing costs, including management fees, distribution and/or service (12b-1) fees and other Fund expenses. This Example is intended to help you understand your ongoing costs (in dollars) of investing in the Fund and to compare these costs with the ongoing costs of investing in other mutual funds.
The Example is based on an investment of $1,000 invested at the beginning of the period and held for the entire period (May 1, 2013 to October 31, 2013).
Actual Expenses
The first line of the accompanying table for each class of the Fund provides information about actual account values and actual expenses. You may use the information in this line, together with the amount you invested, to estimate the expenses that you paid over the period. Simply divide your account value by $1,000.00 (for example, an $8,600 account value divided by $1,000.00 = 8.6), then multiply the result by the number in the first line for a class of the Fund under the heading entitled "Expenses Paid During Period" to estimate the expenses you paid on your account during this period. A small balance maintenance fee of $12.00 that is charged once a year may apply for certain accounts with a value of less than $2,000. This fee is not included in the table below. If it was, the estimate of expenses you paid during the period would be higher, and your ending account value lower, by this amount. In addition, the Fund, as a shareholder in the underlying Fidelity Central Funds, will indirectly bear its pro-rata share of the fees and expenses incurred by the underlying Fidelity Central Funds. These fees and expenses are not included in the Fund's annualized expense ratio used to calculate the expense estimate in the table below.
Hypothetical Example for Comparison Purposes
The second line of the accompanying table for each class of the Fund provides information about hypothetical account values and hypothetical expenses based on a Class' actual expense ratio and an assumed rate of return of 5% per year before expenses, which is not the Class' actual return. The hypothetical account values and expenses may not be used to estimate the actual ending account balance or expenses you paid for the period. You may use this information to compare the ongoing costs of investing in the Fund and other funds. To do so, compare this 5% hypothetical example with the 5% hypothetical examples that appear in the shareholder reports of the other funds. A small balance maintenance fee of $12.00 that is charged once a year may apply for certain accounts with a value of less than $2,000. This fee is not included in the table below. If it was, the estimate of expenses you paid during the period would be higher, and your ending account value lower, by this amount. In addition, the Fund, as a shareholder in the underlying Fidelity Central Funds, will indirectly bear its pro-rata share of the fees and expenses incurred by the underlying Fidelity Central Funds. These fees and expenses are not included in the Fund's annualized expense ratio used to calculate the expense estimate in the table below.
Please note that the expenses shown in the table are meant to highlight your ongoing costs only and do not reflect any transaction costs. Therefore, the second line of the table is useful in comparing ongoing costs only, and will not help you determine the relative total costs of owning different funds. In addition, if these transactional costs were included, your costs would have been higher.
Annual Report
Shareholder Expense Example - continued
| Annualized
Expense RatioB | Beginning
Account Value
May 1, 2013 | Ending
Account Value
October 31, 2013 | Expenses Paid
During Period*
May 1, 2013
to October 31, 2013 |
Class A | 1.70% | | | |
Actual | | $ 1,000.00 | $ 980.40 | $ 8.49 |
HypotheticalA | | $ 1,000.00 | $ 1,016.64 | $ 8.64 |
Class T | 1.95% | | | |
Actual | | $ 1,000.00 | $ 978.80 | $ 9.73 |
HypotheticalA | | $ 1,000.00 | $ 1,015.38 | $ 9.91 |
Class C | 2.45% | | | |
Actual | | $ 1,000.00 | $ 977.10 | $ 12.21 |
HypotheticalA | | $ 1,000.00 | $ 1,012.85 | $ 12.43 |
Emerging Markets Discovery | 1.45% | | | |
Actual | | $ 1,000.00 | $ 981.20 | $ 7.24 |
HypotheticalA | | $ 1,000.00 | $ 1,017.90 | $ 7.38 |
Institutional Class | 1.45% | | | |
Actual | | $ 1,000.00 | $ 982.00 | $ 7.24 |
HypotheticalA | | $ 1,000.00 | $ 1,017.90 | $ 7.38 |
A 5% return per year before expenses
B Annualized expense ratio reflects expenses net of applicable fee waivers.
* Expenses are equal to each Class' annualized expense ratio, multiplied by the average account value over the period, multiplied by 184/365 (to reflect the one-half year period).
Annual Report
Fidelity Emerging Markets Discovery Fund
Investment Changes (Unaudited)
Top Five Stocks as of October 31, 2013 |
| % of fund's
net assets | % of fund's net assets
6 months ago |
E-Mart Co. Ltd. (Korea (South), Food & Staples Retailing) | 1.7 | 1.0 |
Unified-President Enterprises Corp. (Taiwan, Food Products) | 1.4 | 1.2 |
China Insurance International Holdings Co. Ltd. (Hong Kong, Insurance) | 1.4 | 0.8 |
Compania Cervecerias Unidas SA sponsored ADR (Chile, Beverages) | 1.4 | 1.0 |
LG Household & Health Care Ltd. (Korea (South), Household Products) | 1.4 | 1.1 |
| 7.3 | |
Top Five Market Sectors as of October 31, 2013 |
| % of fund's
net assets | % of fund's net assets
6 months ago |
Financials | 25.8 | 23.8 |
Industrials | 19.2 | 17.2 |
Consumer Staples | 16.9 | 17.3 |
Consumer Discretionary | 15.1 | 16.7 |
Health Care | 6.9 | 5.3 |
Top Five Countries as of October 31, 2013 |
(excluding cash equivalents) | % of fund's
net assets | % of fund's net assets
6 months ago |
India | 13.3 | 10.4 |
Taiwan | 11.8 | 22.7 |
South Africa | 10.4 | 11.0 |
Korea (South) | 9.9 | 12.8 |
Chile | 7.7 | 5.8 |
Percentages are adjusted for the effect of open futures contracts, if applicable. |
Asset Allocation (% of fund's net assets) |
As of October 31, 2013 | As of April 30, 2013 |
 | Stocks 97.3% | | | Stocks 98.8% | |
 | Short-TermInvestments andNet Other Assets (Liabilities) 2.7% | | | Short-TermInvestments andNet Other Assets (Liabilities) 1.2% | |

Annual Report
Fidelity Emerging Markets Discovery Fund
Investments October 31, 2013
Showing Percentage of Net Assets
Common Stocks - 96.3% |
| Shares | | Value |
Bermuda - 6.9% |
China Foods Ltd. | 1,566,000 | | $ 710,992 |
Shangri-La Asia Ltd. | 520,000 | | 952,406 |
Silverlake Axis Ltd. Class A | 1,533,000 | | 888,553 |
Tai Cheung Holdings Ltd. | 1,017,000 | | 771,309 |
Texwinca Holdings Ltd. | 1,228,000 | | 1,256,035 |
Trinity Ltd. | 1,246,000 | | 466,065 |
Wilson Sons Ltd. unit | 81,855 | | 1,023,096 |
Yue Yuen Industrial (Holdings) Ltd. | 471,000 | | 1,293,989 |
TOTAL BERMUDA | | 7,362,445 |
Brazil - 4.6% |
BHG SA (Brazil Hospitality Group) (a) | 106,800 | | 781,859 |
BTG Pactual Participations Ltd. unit | 48,000 | | 642,157 |
Fleury SA | 121,600 | | 941,773 |
Hypermarcas SA | 119,000 | | 1,038,501 |
Iguatemi Empresa de Shopping Centers SA | 72,200 | | 829,904 |
Terna Participacoes SA unit | 74,000 | | 718,463 |
TOTAL BRAZIL | | 4,952,657 |
Cayman Islands - 6.9% |
China Lodging Group Ltd. ADR (a) | 46,300 | | 1,017,674 |
Chu Kong Petroleum & Natural Gas Steel Pipe Holdings Ltd. | 1,000,000 | | 374,049 |
Ginko International Co. Ltd. | 29,000 | | 552,709 |
Gourmet Master Co. Ltd. | 152,000 | | 1,012,128 |
Greatview Aseptic Pack Co. Ltd. | 1,319,000 | | 830,223 |
Lifestyle International Holdings Ltd. | 113,000 | | 246,318 |
Samson Holding Ltd. | 7,877,000 | | 1,097,273 |
SITC International Holdings Co. Ltd. | 1,685,000 | | 712,860 |
Springland International Holdings Ltd. | 1,264,000 | | 692,893 |
Tao Heung Holdings Ltd. | 1,128,000 | | 865,678 |
TOTAL CAYMAN ISLANDS | | 7,401,805 |
Chile - 7.7% |
Compania Cervecerias Unidas SA sponsored ADR | 55,107 | | 1,470,806 |
Embotelladora Andina SA sponsored ADR | 32,153 | | 1,099,633 |
Empresa Nacional de Telecomunicaciones SA (ENTEL) | 60,226 | | 926,816 |
Isapre CruzBlanca SA | 1,312,507 | | 896,528 |
Parque Arauco SA | 431,517 | | 833,129 |
Quinenco SA | 456,526 | | 1,220,968 |
Quinenco SA rights 11/5/13 (a) | 108,014 | | 42,172 |
Common Stocks - continued |
| Shares | | Value |
Chile - continued |
Sociedad Matriz SAAM SA | 9,377,011 | | $ 942,552 |
Sonda SA | 290,100 | | 753,212 |
TOTAL CHILE | | 8,185,816 |
China - 1.0% |
China Communications Services Corp. Ltd. (H Shares) | 1,116,000 | | 683,735 |
Shandong Weigao Medical Polymer Co. Ltd. (H Shares) | 408,000 | | 383,108 |
TOTAL CHINA | | 1,066,843 |
Colombia - 0.6% |
Bolsa de Valores de Colombia | 48,878,613 | | 622,492 |
Hong Kong - 3.6% |
China Insurance International Holdings Co. Ltd. (a) | 946,000 | | 1,476,409 |
Dah Chong Hong Holdings Ltd. | 893,000 | | 757,892 |
HKT Trust / HKT Ltd. unit | 984,000 | | 912,545 |
Singamas Container Holdings Ltd. | 2,936,000 | | 685,433 |
TOTAL HONG KONG | | 3,832,279 |
Hungary - 1.1% |
Richter Gedeon PLC | 62,400 | | 1,186,549 |
India - 13.3% |
Bank of Baroda | 69,571 | | 725,808 |
Container Corp. of India Ltd. | 76,245 | | 936,545 |
Credit Analysis & Research Ltd. | 100,032 | | 1,080,201 |
Grasim Industries Ltd. | 19,771 | | 929,352 |
IDFC Ltd. | 648,827 | | 1,113,421 |
Indian Hotels Co. Ltd. | 938,336 | | 748,397 |
Ipca Laboratories Ltd. | 90,219 | | 1,007,944 |
Jain Irrigation Systems Ltd. | 760,572 | | 825,689 |
Mahindra Lifespace Developers Ltd. | 93,500 | | 649,921 |
Motilal Oswal Financial Services Ltd. | 685,225 | | 773,914 |
Prestige Estates Projects Ltd. (a) | 373,175 | | 866,265 |
Punjab National Bank | 80,137 | | 743,345 |
SKS Microfinance Ltd. (a) | 325,922 | | 823,479 |
Tech Mahindra Ltd. (a) | 54,154 | | 1,363,033 |
Thermax Ltd. (a) | 76,141 | | 787,802 |
Tube Investments of India Ltd. | 354,155 | | 844,813 |
TOTAL INDIA | | 14,219,929 |
Indonesia - 4.1% |
PT Astra Graphia Tbk | 7,177,500 | | 1,056,961 |
PT Bank Tabungan Pensiunan Nasional Tbk (a) | 543,500 | | 210,938 |
Common Stocks - continued |
| Shares | | Value |
Indonesia - continued |
PT Hero Supermarket Tbk (a) | 2,698,000 | | $ 861,632 |
PT Holcim Indonesia Tbk | 3,289,000 | | 751,309 |
PT Tempo Scan Pacific Tbk | 2,063,000 | | 713,742 |
PT Wijaya Karya Persero Tbk | 4,610,500 | | 785,284 |
TOTAL INDONESIA | | 4,379,866 |
Kenya - 0.8% |
East African Breweries Ltd. | 228,200 | | 852,909 |
Korea (South) - 9.9% |
Binggrea Co. Ltd. | 8,872 | | 748,194 |
E-Mart Co. Ltd. | 7,626 | | 1,825,156 |
Kiwoom Securities Co. Ltd. | 25,329 | | 1,326,975 |
Korea Plant Service & Engineering Co. Ltd. | 27,617 | | 1,400,002 |
LG Corp. | 24,155 | | 1,427,067 |
LG Household & Health Care Ltd. | 2,792 | | 1,449,562 |
Samsung Fire & Marine Insurance Co. Ltd. | 2,907 | | 679,308 |
Shinsegae Food Co. Ltd. | 10,022 | | 839,510 |
TK Corp. (a) | 45,428 | | 922,446 |
TOTAL KOREA (SOUTH) | | 10,618,220 |
Malaysia - 2.4% |
Oldtown Bhd | 1,036,900 | | 814,672 |
Oriental Holdings Bhd | 295,600 | | 827,849 |
YTL Corp. Bhd | 1,866,800 | | 975,834 |
TOTAL MALAYSIA | | 2,618,355 |
Mexico - 1.4% |
Bolsa Mexicana de Valores S.A.B. de CV | 310,300 | | 739,645 |
Consorcio ARA S.A.B. de CV (a) | 1,864,800 | | 728,926 |
TOTAL MEXICO | | 1,468,571 |
Nigeria - 0.7% |
Guaranty Trust Bank PLC | 4,415,484 | | 703,474 |
Philippines - 0.7% |
Security Bank Corp. | 217,510 | | 699,616 |
Poland - 1.2% |
Warsaw Stock Exchange | 87,205 | | 1,262,630 |
Russia - 2.4% |
Moscow Exchange MICEX-RTS OAO | 284,000 | | 542,395 |
Common Stocks - continued |
| Shares | | Value |
Russia - continued |
Synergy Co. (a) | 56,651 | | $ 1,130,167 |
Vozrozhdenie Bank | 71,500 | | 922,991 |
TOTAL RUSSIA | | 2,595,553 |
Singapore - 0.6% |
Ezion Holdings Ltd. | 378,000 | | 681,629 |
South Africa - 10.4% |
Adcorp Holdings Ltd. | 312,400 | | 1,079,532 |
African Bank Investments Ltd. | 583,117 | | 987,472 |
Astral Foods Ltd. | 136,400 | | 1,372,322 |
Bidvest Group Ltd. | 47,500 | | 1,266,714 |
Illovo Sugar Ltd. | 278,400 | | 872,188 |
JSE Ltd. | 100,955 | | 882,963 |
PSG Group Ltd. | 143,700 | | 1,180,949 |
SA Corporate Real Estate Fund | 1,935,200 | | 773,020 |
Tiger Brands Ltd. | 44,025 | | 1,290,128 |
Zeder Investments Ltd. | 3,171,609 | | 1,369,352 |
TOTAL SOUTH AFRICA | | 11,074,640 |
Sri Lanka - 0.7% |
John Keells Holdings Ltd. | 442,958 | | 756,649 |
Taiwan - 11.8% |
Chroma ATE, Inc. | 501,000 | | 1,065,487 |
Cleanaway Co. Ltd. | 142,000 | | 887,651 |
CTCI Corp. | 588,000 | | 1,026,778 |
E.SUN Financial Holdings Co. Ltd. | 1,630,655 | | 1,088,581 |
Formosa Optical Technology Co. Ltd. | 304,000 | | 1,084,423 |
Johnson Health Tech Co. Ltd. | 1,740 | | 4,960 |
Kd Holding Corp. | 134,000 | | 860,404 |
King Slide Works Co. Ltd. | 70,000 | | 618,312 |
MJC Probe, Inc. | 449,000 | | 782,528 |
Pacific Hospital Supply Co. Ltd. | 313,700 | | 1,166,983 |
Sinyi Realty, Inc. | 635,560 | | 1,159,489 |
St. Shine Optical Co. Ltd. | 20,000 | | 587,736 |
Standard Foods Corp. | 26,450 | | 80,873 |
Unified-President Enterprises Corp. | 785,803 | | 1,494,988 |
Wowprime Corp. | 43,500 | | 719,704 |
TOTAL TAIWAN | | 12,628,897 |
Turkey - 3.0% |
Anadolu Efes Biracilik Ve Malt Sanayii A/S | 83,749 | | 1,069,806 |
Common Stocks - continued |
| Shares | | Value |
Turkey - continued |
Enka Insaat ve Sanayi A/S | 403,057 | | $ 1,179,137 |
Is Yatirim Menkul Degerler A/S | 1,385,599 | | 999,505 |
TOTAL TURKEY | | 3,248,448 |
United States of America - 0.5% |
Sohu.com, Inc. (a) | 7,900 | | 528,984 |
TOTAL COMMON STOCKS (Cost $100,982,901) |
102,949,256
|
Nonconvertible Preferred Stocks - 1.0% |
| | | |
Brazil - 1.0% |
Klabin SA (PN) (non-vtg.)
(Cost $996,339) | 201,200 | |
1,068,780
|
Money Market Funds - 3.2% |
| | | |
Fidelity Cash Central Fund, 0.09% (b)
(Cost $3,360,575) | 3,360,575 | |
3,360,575
|
TOTAL INVESTMENT PORTFOLIO - 100.5% (Cost $105,339,815) | | 107,378,611 |
NET OTHER ASSETS (LIABILITIES) - (0.5)% | | (510,079) |
NET ASSETS - 100% | $ 106,868,532 |
Legend |
(a) Non-income producing |
(b) Affiliated fund that is generally available only to investment companies and other accounts managed by Fidelity Investments. The rate quoted is the annualized seven-day yield of the fund at period end. A complete unaudited listing of the fund's holdings as of its most recent quarter end is available upon request. In addition, each Fidelity Central Fund's financial statements, which are not covered by the Fund's Report of Independent Registered Public Accounting Firm, are available on the SEC's website or upon request. |
Affiliated Central Funds |
Information regarding fiscal year to date income earned by the Fund from investments in Fidelity Central Funds is as follows: |
Fund | Income earned |
Fidelity Cash Central Fund | $ 5,709 |
Fidelity Securities Lending Cash Central Fund | 3,614 |
Total | $ 9,323 |
Other Information |
Categorizations in the Schedule of Investments are based on country or territory of incorporation. |
The following is a summary of the inputs used, as of October 31, 2013, involving the Fund's assets and liabilities carried at fair value. The inputs or methodology used for valuing securities may not be an indication of the risk associated with investing in those securities. For more information on valuation inputs, and their aggregation into the levels used in the table below, please refer to the Investment Valuation section in the accompanying Notes to Financial Statements. |
Valuation Inputs at Reporting Date: |
Description | Total | Level 1 | Level 2 | Level 3 |
Investments in Securities: | | | | |
Equities: | | | | |
Consumer Discretionary | $ 16,238,792 | $ 16,238,792 | $ - | $ - |
Consumer Staples | 18,182,529 | 18,182,529 | - | - |
Energy | 1,055,678 | 1,055,678 | - | - |
Financials | 27,481,057 | 26,737,712 | 743,345 | - |
Health Care | 7,437,072 | 6,429,128 | 1,007,944 | - |
Industrials | 20,444,054 | 20,444,054 | - | - |
Information Technology | 5,381,797 | 5,381,797 | - | - |
Materials | 3,579,664 | 2,650,312 | 929,352 | - |
Telecommunication Services | 2,523,096 | 2,523,096 | - | - |
Utilities | 1,694,297 | 1,694,297 | - | - |
Money Market Funds | 3,360,575 | 3,360,575 | - | - |
Total Investments in Securities: | $ 107,378,611 | $ 104,697,970 | $ 2,680,641 | $ - |
See accompanying notes which are an integral part of the financial statements.
Annual Report
Fidelity Emerging Markets Discovery Fund
Statement of Assets and Liabilities
| October 31, 2013 |
| | |
Assets | | |
Investment in securities, at value - See accompanying schedule: Unaffiliated issuers (cost $101,979,240) | $ 104,018,036 | |
Fidelity Central Funds (cost $3,360,575) | 3,360,575 | |
Total Investments (cost $105,339,815) | | $ 107,378,611 |
Cash | | 105,599 |
Foreign currency held at value (cost $10,502) | | 10,477 |
Receivable for investments sold | | 3,062,739 |
Receivable for fund shares sold | | 297,178 |
Dividends receivable | | 39,430 |
Distributions receivable from Fidelity Central Funds | | 464 |
Prepaid expenses | | 451 |
Receivable from investment adviser for expense reductions | | 31,581 |
Other affiliated receivables | | 73,436 |
Other receivables | | 25,607 |
Total assets | | 111,025,573 |
| | |
Liabilities | | |
Payable for investments purchased | $ 3,624,635 | |
Payable for fund shares redeemed | 102,677 | |
Accrued management fee | 75,088 | |
Distribution and service plan fees payable | 3,409 | |
Other affiliated payables | 25,814 | |
Other payables and accrued expenses | 325,418 | |
Total liabilities | | 4,157,041 |
| | |
Net Assets | | $ 106,868,532 |
Net Assets consist of: | | |
Paid in capital | | $ 103,184,879 |
Undistributed net investment income | | 648,420 |
Accumulated undistributed net realized gain (loss) on investments and foreign currency transactions | | 1,216,581 |
Net unrealized appreciation (depreciation) on investments and assets and liabilities in foreign currencies | | 1,818,652 |
Net Assets | | $ 106,868,532 |
See accompanying notes which are an integral part of the financial statements.
Annual Report
Statement of Assets and Liabilities - continued
| October 31, 2013 |
| | |
Calculation of Maximum Offering Price Class A:
Net Asset Value and redemption price per share ($5,065,263 ÷ 405,641 shares) | | $ 12.49 |
| | |
Maximum offering price per share (100/94.25 of $12.49) | | $ 13.25 |
Class T:
Net Asset Value and redemption price per share ($1,914,183 ÷ 153,883 shares) | | $ 12.44 |
| | |
Maximum offering price per share (100/96.50 of $12.44) | | $ 12.89 |
Class C:
Net Asset Value and offering price per share ($2,081,734 ÷ 168,561 shares)A | | $ 12.35 |
| | |
Emerging Markets Discovery:
Net Asset Value, offering price and redemption price per share ($96,731,108 ÷ 7,723,835 shares) | | $ 12.52 |
| | |
Institutional Class:
Net Asset Value, offering price and redemption price per share ($1,076,244 ÷ 85,924 shares) | | $ 12.53 |
A Redemption price per share is equal to net asset value less any applicable contingent deferred sales charge.
See accompanying notes which are an integral part of the financial statements.
Annual Report
Fidelity Emerging Markets Discovery Fund
Financial Statements - continued
Statement of Operations
| Year ended October 31, 2013 |
| | |
Investment Income | | |
Dividends | | $ 2,828,759 |
Income from Fidelity Central Funds | | 9,323 |
Income before foreign taxes withheld | | 2,838,082 |
Less foreign taxes withheld | | (276,587) |
Total income | | 2,561,495 |
| | |
Expenses | | |
Management fee | $ 970,456 | |
Transfer agent fees | 278,936 | |
Distribution and service plan fees | 51,976 | |
Accounting and security lending fees | 58,907 | |
Custodian fees and expenses | 313,877 | |
Independent trustees' compensation | 619 | |
Registration fees | 92,723 | |
Audit | 76,674 | |
Legal | 207 | |
Miscellaneous | 435 | |
Total expenses before reductions | 1,844,810 | |
Expense reductions | (214,796) | 1,630,014 |
Net investment income (loss) | | 931,481 |
Realized and Unrealized Gain (Loss) Net realized gain (loss) on: | | |
Investment securities: | | |
Unaffiliated issuers (net of foreign taxes of $74,639) | 2,425,794 | |
Foreign currency transactions | (109,494) | |
Total net realized gain (loss) | | 2,316,300 |
Change in net unrealized appreciation (depreciation) on: Investment securities (net of increase in deferred foreign taxes of $183,313) | (861,858) | |
Assets and liabilities in foreign currencies | (3,018) | |
Total change in net unrealized appreciation (depreciation) | | (864,876) |
Net gain (loss) | | 1,451,424 |
Net increase (decrease) in net assets resulting from operations | | $ 2,382,905 |
See accompanying notes which are an integral part of the financial statements.
Annual Report
Statement of Changes in Net Assets
| Year ended
October 31,
2013 | For the period
November 1, 2011 (commencement of operations) to
October 31, 2012 |
Increase (Decrease) in Net Assets | | |
Operations | | |
Net investment income (loss) | $ 931,481 | $ 275,092 |
Net realized gain (loss) | 2,316,300 | 834,546 |
Change in net unrealized appreciation (depreciation) | (864,876) | 2,683,528 |
Net increase (decrease) in net assets resulting
from operations | 2,382,905 | 3,793,166 |
Distributions to shareholders from net investment income | (286,293) | (7,760) |
Distributions to shareholders from net realized gain | (914,866) | - |
Total distributions | (1,201,159) | (7,760) |
Share transactions - net increase (decrease) | 59,689,170 | 41,986,470 |
Redemption fees | 191,734 | 34,006 |
Total increase (decrease) in net assets | 61,062,650 | 45,805,882 |
| | |
Net Assets | | |
Beginning of period | 45,805,882 | - |
End of period (including undistributed net investment income of $648,420 and undistributed net investment income of $251,826, respectively) | $ 106,868,532 | $ 45,805,882 |
See accompanying notes which are an integral part of the financial statements.
Annual Report
Financial Highlights - Class A
Years ended October 31, | 2013 | 2012 F |
Selected Per-Share Data | | |
Net asset value, beginning of period | $ 11.89 | $ 10.00 |
Income from Investment Operations | | |
Net investment income (loss) C | .08 | .12 |
Net realized and unrealized gain (loss) | .75 | 1.76 |
Total from investment operations | .83 | 1.88 |
Distributions from net investment income | (.04) | (.01) |
Distributions from net realized gain | (.20) | - |
Total distributions | (.25) H | (.01) |
Redemption fees added to paid in capital C | .02 | .02 |
Net asset value, end of period | $ 12.49 | $ 11.89 |
Total Return A, B | 7.20% | 19.00% |
Ratios to Average Net Assets D, G | | |
Expenses before reductions | 1.87% | 3.49% |
Expenses net of fee waivers, if any | 1.70% | 1.70% |
Expenses net of all reductions | 1.64% | 1.64% |
Net investment income (loss) | .62% | 1.16% |
Supplemental Data | | |
Net assets, end of period (000 omitted) | $ 5,065 | $ 1,671 |
Portfolio turnover rate E | 179% | 83% |
A Total returns would have been lower if certain expenses had not been reduced during the applicable periods shown.
B Total returns do not include the effect of the sales charges.
C Calculated based on average shares outstanding during the period.
D Fees and expenses of any underlying Fidelity Central Funds are not included in the Fund's expense ratio. The Fund indirectly bears its proportionate share of the expenses of any underlying Fidelity Central Funds.
E Amount does not include the portfolio activity of any underlying Fidelity Central Funds.
F For the period November 1, 2011 (commencement of operations) to October 31, 2012.
G Expense ratios reflect operating expenses of the class. Expenses before reductions do not reflect amounts reimbursed by the investment adviser or reductions from brokerage service arrangements or reductions from other expense offset arrangements and do not represent the amount paid by the class during periods when reimbursements or reductions occur. Expense ratios before reductions for start-up periods may not be representative of longer-term operating periods. Expenses net of fee waivers reflect expenses after reimbursement by the investment adviser but prior to reductions from brokerage service arrangements or other expense offset arrangements. Expenses net of all reductions represent the net expenses paid by the class.
H Total distributions of $.25 per share is comprised of distributions from net investment income of $.044 and distributions from net realized gain of $.203 per share.
See accompanying notes which are an integral part of the financial statements.
Annual Report
Financial Highlights - Class T
Years ended October 31, | 2013 | 2012 F |
Selected Per-Share Data | | |
Net asset value, beginning of period | $ 11.87 | $ 10.00 |
Income from Investment Operations | | |
Net investment income (loss) C | .05 | .10 |
Net realized and unrealized gain (loss) | .74 | 1.75 |
Total from investment operations | .79 | 1.85 |
Distributions from net investment income | (.03) | - I |
Distributions from net realized gain | (.20) | - |
Total distributions | (.24) H | - I |
Redemption fees added to paid in capital C | .02 | .02 |
Net asset value, end of period | $ 12.44 | $ 11.87 |
Total Return A, B | 6.87% | 18.75% |
Ratios to Average Net Assets D, G | | |
Expenses before reductions | 2.19% | 3.77% |
Expenses net of fee waivers, if any | 1.95% | 1.95% |
Expenses net of all reductions | 1.89% | 1.89% |
Net investment income (loss) | .37% | .91% |
Supplemental Data | | |
Net assets, end of period (000 omitted) | $ 1,914 | $ 1,700 |
Portfolio turnover rate E | 179% | 83% |
A Total returns would have been lower if certain expenses had not been reduced during the applicable periods shown.
B Total returns do not include the effect of the sales charges.
C Calculated based on average shares outstanding during the period.
D Fees and expenses of any underlying Fidelity Central Funds are not included in the Fund's expense ratio. The Fund indirectly bears its proportionate share of the expenses of any underlying Fidelity Central Funds.
E Amount does not include the portfolio activity of any underlying Fidelity Central Funds.
F For the period November 1, 2011 (commencement of operations) to October 31, 2012.
G Expense ratios reflect operating expenses of the class. Expenses before reductions do not reflect amounts reimbursed by the investment adviser or reductions from brokerage service arrangements or reductions from other expense offset arrangements and do not represent the amount paid by the class during periods when reimbursements or reductions occur. Expense ratios before reductions for start-up periods may not be representative of longer-term operating periods. Expenses net of fee waivers reflect expenses after reimbursement by the investment adviser but prior to reductions from brokerage service arrangements or other expense offset arrangements. Expenses net of all reductions represent the net expenses paid by the class.
H Total distributions of $.24 per share is comprised of distributions from net investment income of $.034 and distributions from net realized gain of $.203 per share.
I Amount represents less than $.01 per share
See accompanying notes which are an integral part of the financial statements.
Annual Report
Financial Highlights - Class C
Years ended October 31, | 2013 | 2012 F |
Selected Per-Share Data | | |
Net asset value, beginning of period | $ 11.82 | $ 10.00 |
Income from Investment Operations | | |
Net investment income (loss) C | (.02) | .04 |
Net realized and unrealized gain (loss) | .74 | 1.76 |
Total from investment operations | .72 | 1.80 |
Distributions from net investment income | (.01) | - |
Distributions from net realized gain | (.20) | - |
Total distributions | (.21) | - |
Redemption fees added to paid in capital C | .02 | .02 |
Net asset value, end of period | $ 12.35 | $ 11.82 |
Total Return A, B | 6.32% | 18.20% |
Ratios to Average Net Assets D, G | | |
Expenses before reductions | 2.70% | 4.32% |
Expenses net of fee waivers, if any | 2.45% | 2.45% |
Expenses net of all reductions | 2.39% | 2.39% |
Net investment income (loss) | (.13)% | .41% |
Supplemental Data | | |
Net assets, end of period (000 omitted) | $ 2,082 | $ 1,474 |
Portfolio turnover rate E | 179% | 83% |
A Total returns would have been lower if certain expenses had not been reduced during the applicable periods shown.
B Total returns do not include the effect of the contingent deferred sales charge.
C Calculated based on average shares outstanding during the period.
D Fees and expenses of any underlying Fidelity Central Funds are not included in the Fund's expense ratio. The Fund indirectly bears its proportionate share of the expenses of any underlying Fidelity Central Funds.
E Amount does not include the portfolio activity of any underlying Fidelity Central Funds.
F For the period November 1, 2011 (commencement of operations) to October 31, 2012.
G Expense ratios reflect operating expenses of the class. Expenses before reductions do not reflect amounts reimbursed by the investment adviser or reductions from brokerage service arrangements or reductions from other expense offset arrangements and do not represent the amount paid by the class during periods when reimbursements or reductions occur. Expense ratios before reductions for start-up periods may not be representative of longer-term operating periods. Expenses net of fee waivers reflect expenses after reimbursement by the investment adviser but prior to reductions from brokerage service arrangements or other expense offset arrangements. Expenses net of all reductions represent the net expenses paid by the class.
See accompanying notes which are an integral part of the financial statements.
Annual Report
Financial Highlights - Emerging Markets Discovery
Years ended October 31, | 2013 | 2012 E |
Selected Per-Share Data | | |
Net asset value, beginning of period | $ 11.92 | $ 10.00 |
Income from Investment Operations | | |
Net investment income (loss) B | .11 | .15 |
Net realized and unrealized gain (loss) | .74 | 1.76 |
Total from investment operations | .85 | 1.91 |
Distributions from net investment income | (.07) | (.01) |
Distributions from net realized gain | (.20) | - |
Total distributions | (.27) | (.01) |
Redemption fees added to paid in capital B | .02 | .02 |
Net asset value, end of period | $ 12.52 | $ 11.92 |
Total Return A | 7.37% | 19.35% |
Ratios to Average Net Assets C, F | | |
Expenses before reductions | 1.57% | 3.02% |
Expenses net of fee waivers, if any | 1.45% | 1.45% |
Expenses net of all reductions | 1.39% | 1.39% |
Net investment income (loss) | .87% | 1.41% |
Supplemental Data | | |
Net assets, end of period (000 omitted) | $ 96,731 | $ 39,135 |
Portfolio turnover rate D | 179% | 83% |
A Total returns would have been lower if certain expenses had not been reduced during the applicable periods shown.
B Calculated based on average shares outstanding during the period.
C Fees and expenses of any underlying Fidelity Central Funds are not included in the Fund's expense ratio. The Fund indirectly bears its proportionate share of the expenses of any underlying Fidelity Central Funds.
D Amount does not include the portfolio activity of any underlying Fidelity Central Funds.
E For the period November 1, 2011 (commencement of operations) to October 31, 2012.
F Expense ratios reflect operating expenses of the class. Expenses before reductions do not reflect amounts reimbursed by the investment adviser or reductions from brokerage service arrangements or reductions from other expense offset arrangements and do not represent the amount paid by the class during periods when reimbursements or reductions occur. Expense ratios before reductions for start-up periods may not be representative of longer-term operating periods. Expenses net of fee waivers reflect expenses after reimbursement by the investment adviser but prior to reductions from brokerage service arrangements or other expense offset arrangements. Expenses net of all reductions represent the net expenses paid by the class.
See accompanying notes which are an integral part of the financial statements.
Annual Report
Financial Highlights - Institutional Class
Years ended October 31, | 2013 | 2012 E |
Selected Per-Share Data | | |
Net asset value, beginning of period | $ 11.92 | $ 10.00 |
Income from Investment Operations | | |
Net investment income (loss) B | .11 | .15 |
Net realized and unrealized gain (loss) | .75 | 1.76 |
Total from investment operations | .86 | 1.91 |
Distributions from net investment income | (.07) | (.01) |
Distributions from net realized gain | (.20) | - |
Total distributions | (.27) | (.01) |
Redemption fees added to paid in capital B | .02 | .02 |
Net asset value, end of period | $ 12.53 | $ 11.92 |
Total Return A | 7.45% | 19.35% |
Ratios to Average Net Assets C, F | | |
Expenses before reductions | 1.60% | 3.21% |
Expenses net of fee waivers, if any | 1.45% | 1.45% |
Expenses net of all reductions | 1.39% | 1.39% |
Net investment income (loss) | .87% | 1.41% |
Supplemental Data | | |
Net assets, end of period (000 omitted) | $ 1,076 | $ 1,825 |
Portfolio turnover rate D | 179% | 83% |
A Total returns would have been lower if certain expenses had not been reduced during the applicable periods shown.
B Calculated based on average shares outstanding during the period.
C Fees and expenses of any underlying Fidelity Central Funds are not included in the Fund's expense ratio. The Fund indirectly bears its proportionate share of the expenses of any underlying Fidelity Central Funds.
D Amount does not include the portfolio activity of any underlying Fidelity Central Funds.
E For the period November 1, 2011 (commencement of operations) to October 31, 2012.
F Expense ratios reflect operating expenses of the class. Expenses before reductions do not reflect amounts reimbursed by the investment adviser or reductions from brokerage service arrangements or reductions from other expense offset arrangements and do not represent the amount paid by the class during periods when reimbursements or reductions occur. Expense ratios before reductions for start-up periods may not be representative of longer-term operating periods. Expenses net of fee waivers reflect expenses after reimbursement by the investment adviser but prior to reductions from brokerage service arrangements or other expense offset arrangements. Expenses net of all reductions represent the net expenses paid by the class.
See accompanying notes which are an integral part of the financial statements.
Annual Report
Fidelity Emerging Markets Discovery Fund
Notes to Financial Statements
For the period ended October 31, 2013
1. Organization.
Fidelity Emerging Markets Discovery Fund (the Fund) is a non-diversified fund of Fidelity Investment Trust (the Trust) and is authorized to issue an unlimited number of shares. The Trust is registered under the Investment Company Act of 1940, as amended (the 1940 Act), as an open-end management investment company organized as a Massachusetts business trust. The Fund offers Class A, Class T, Class C, Emerging Markets Discovery and Institutional Class shares, each of which has equal rights as to assets and voting privileges. Each class has exclusive voting rights with respect to matters that affect that class. The Fund's investments in emerging markets can be subject to social, economic, regulatory, and political uncertainties and can be extremely volatile.
2. Investments in Fidelity Central Funds.
The Fund invests in Fidelity Central Funds, which are open-end investment companies generally available only to other investment companies and accounts managed by Fidelity Management & Research Company (FMR) and its affiliates. The Fund's Schedule of Investments lists each of the Fidelity Central Funds held as of period end, if any, as an investment of the Fund, but does not include the underlying holdings of each Fidelity Central Fund. As an Investing Fund, the Fund indirectly bears its proportionate share of the expenses of the underlying Fidelity Central Funds.
The Money Market Central Funds seek preservation of capital and current income and are managed by Fidelity Investments Money Management, Inc. (FIMM), an affiliate of FMR.
A complete unaudited list of holdings for each Fidelity Central Fund is available upon request or at the Securities and Exchange Commission (the SEC) website at www.sec.gov. In addition, the financial statements of the Fidelity Central Funds, which are not covered by the Fund's Report of Independent Registered Public Accounting Firm, are available on the SEC website or upon request.
3. Significant Accounting Policies.
The financial statements have been prepared in conformity with accounting principles generally accepted in the United States of America (GAAP), which require management to make certain estimates and assumptions at the date of the financial statements. Actual results could differ from those estimates. Subsequent events, if any, through the date that the financial statements were issued have been evaluated in the preparation of
Annual Report
3. Significant Accounting Policies - continued
the financial statements. The following summarizes the significant accounting policies of the Fund:
Investment Valuation. Investments are valued as of 4:00 p.m. Eastern time on the last calendar day of the period. In accordance with valuation policies and procedures approved by the Board of Trustees (the Board), the Fund attempts to obtain prices from one or more third party pricing vendors or brokers to value its investments. When current market prices, quotations or currency exchange rates are not readily available or reliable, investments will be fair valued in good faith by the FMR Fair Value Committee (the Committee), in accordance with procedures adopted by the Board. Factors used in determining fair value vary by investment type and may include market or investment specific events. The frequency with which these procedures are used cannot be predicted and they may be utilized to a significant extent. The Committee oversees the Fund's valuation policies and procedures and is responsible for approving and reporting to the Board all fair value determinations.
The Fund categorizes the inputs to valuation techniques used to value its investments into a disclosure hierarchy consisting of three levels as shown below:
Level 1 - quoted prices in active markets for identical investments
Level 2 - other significant observable inputs (including quoted prices for similar investments, interest rates, prepayment speeds, etc.)
Level 3 - unobservable inputs (including the Fund's own assumptions based on the best information available)
Valuation techniques used to value the Fund's investments by major category are as follows:
Equity securities, including restricted securities, for which market quotations are readily available, are valued at the last reported sale price or official closing price as reported by a third party pricing vendor on the primary market or exchange on which they are traded and are categorized as Level 1 in the hierarchy. In the event there were no sales during the day or closing prices are not available, securities are valued at the last quoted bid price or may be valued using the last available price and are generally categorized as Level 2 in the hierarchy. For foreign equity securities, when market or security specific events arise, comparisons to the valuation of American Depositary Receipts (ADRs), futures contracts, Exchange-Traded Funds (ETFs) and certain indexes as well as quoted prices for similar securities may be used and would be categorized as Level 2 in the hierarchy. Utilizing these techniques may result in transfers between Level 1 and Level 2. For equity securities, including restricted securities, where observable inputs are limited, assumptions about market activity and risk are used and these securities may be categorized as Level 3 in the hierarchy.
Annual Report
Fidelity Emerging Markets Discovery Fund
Notes to Financial Statements - continued
3. Significant Accounting Policies - continued
Investment Valuation - continued
Investments in open-end mutual funds, including the Fidelity Central Funds, are valued at their closing net asset value (NAV) each business day and are categorized as Level 1 in the hierarchy.
Changes in valuation techniques may result in transfers in or out of an assigned level within the disclosure hierarchy. The aggregate value of investments by input level, as of October 31, 2013, is included at the end of the Fund's Schedule of Investments.
Foreign Currency. The Fund may use foreign currency contracts to facilitate transactions in foreign-denominated securities. Gains and losses from these transactions may arise from changes in the value of the foreign currency or if the counterparties do not perform under the contracts' terms.
Foreign-denominated assets, including investment securities, and liabilities are translated into U.S. dollars at the exchange rates at period end. Purchases and sales of investment securities, income and dividends received and expenses denominated in foreign currencies are translated into U.S. dollars at the exchange rate in effect on the transaction date.
The effects of exchange rate fluctuations on investments are included with the net realized and unrealized gain (loss) on investment securities. Other foreign currency transactions resulting in realized and unrealized gain (loss) are disclosed separately.
Investment Transactions and Income. For financial reporting purposes, the Fund's investment holdings and NAV include trades executed through the end of the last business day of the period. The NAV per share for processing shareholder transactions is calculated as of the close of business of the New York Stock Exchange (NYSE), normally 4:00 p.m. Eastern time and includes trades executed through the end of the prior business day. Gains and losses on securities sold are determined on the basis of identified cost. Dividend income is recorded on the ex-dividend date, except for certain dividends from foreign securities where the ex-dividend date may have passed, which are recorded as soon as the Fund is informed of the ex-dividend date. Non-cash dividends included in dividend income, if any, are recorded at the fair market value of the securities received. Interest income and distributions from the Fidelity Central Funds are accrued as earned. Investment income is recorded net of foreign taxes withheld where recovery of such taxes is uncertain.
Annual Report
3. Significant Accounting Policies - continued
Class Allocations and Expenses. Investment income, realized and unrealized capital gains and losses, common expenses of the Fund, and certain fund-level expense reductions, if any, are allocated daily on a pro-rata basis to each class based on the relative net assets of each class to the total net assets of the Fund. Each class differs with respect to transfer agent and distribution and service plan fees incurred. Certain expense reductions may also differ by class. For the reporting period, the allocated portion of income and expenses to each class as a percent of its average net assets may vary due to the timing of recording these transactions in relation to fluctuating net assets of the classes. Expenses directly attributable to a fund are charged to that fund. Expenses attributable to more than one fund are allocated among the respective funds on the basis of relative net assets or other appropriate methods. Expense estimates are accrued in the period to which they relate and adjustments are made when actual amounts are known.
Income Tax Information and Distributions to Shareholders. Each year, the Fund intends to qualify as a regulated investment company under Subchapter M of the Internal Revenue Code, including distributing substantially all of its taxable income and realized gains. As a result, no provision for U.S. Federal income taxes is required. As of October 31, 2013, the Fund did not have any unrecognized tax benefits in the financial statements; nor is the Fund aware of any tax positions for which it is reasonably possible that the total amounts of unrecognized tax benefits will significantly change in the next twelve months. The Fund files a U.S. federal tax return, in addition to state and local tax returns as required. The Fund's federal income tax returns are subject to examination by the Internal Revenue Service (IRS) for a period of three fiscal years after they are filed. State and local tax returns may be subject to examination for an additional fiscal year depending on the jurisdiction. Foreign taxes are provided for based on the Fund's understanding of the tax rules and rates that exist in the foreign markets in which it invests. The Fund is subject to a tax imposed on capital gains by certain countries in which it invests. An estimated deferred tax liability for net unrealized appreciation on the applicable securities is included in Other payables and accrued expenses on the Statement of Assets & Liabilities.
Distributions are declared and recorded on the ex-dividend date. Income dividends and capital gain distributions are declared separately for each class. Income and capital gain distributions are determined in accordance with income tax regulations, which may differ from GAAP. In addition, the fund claimed a portion of the payment made to redeeming shareholders as a distribution for income tax purposes.
Capital accounts within the financial statements are adjusted for permanent book-tax differences. These adjustments have no impact on net assets or the results of operations. Temporary book-tax differences will reverse in a subsequent period.
Annual Report
Fidelity Emerging Markets Discovery Fund
Notes to Financial Statements - continued
3. Significant Accounting Policies - continued
Income Tax Information and Distributions to Shareholders - continued
Book-tax differences are primarily due to foreign currency transactions, certain foreign taxes, passive foreign investment companies (PFIC) and losses deferred due to wash sales.
The federal tax cost of investment securities and unrealized appreciation (depreciation) as of period end were as follows:
Gross unrealized appreciation | $ 7,324,813 |
Gross unrealized depreciation | (6,582,719) |
Net unrealized appreciation (depreciation) on securities and other investments | $ 742,094 |
| |
Tax Cost | $ 106,636,517 |
The tax-based components of distributable earnings as of period end were as follows:
Undistributed ordinary income | $ 648,420 |
Undistributed long-term capital gain | $ 2,513,282 |
Net unrealized appreciation (depreciation) | $ 738,896 |
The tax character of distributions paid was as follows:
| October 31, 2013 | October 31, 2012 |
Ordinary Income | $ 1,201,159 | $ 7,760 |
Short-Term Trading (Redemption) Fees. Shares held by investors in the Fund less than 90 days may have been subject to a redemption fee equal to 2.00% of the net asset value of shares redeemed. All redemption fees, which reduce the proceeds of the shareholder redemption, are retained by the Fund and accounted for as an addition to paid in capital.
4. Purchases and Sales of Investments.
Purchases and sales of securities, other than short-term securities, aggregated $247,560,295 and $189,920,365, respectively.
Annual Report
5. Fees and Other Transactions with Affiliates.
Management Fee. FMR and its affiliates provide the Fund with investment management related services for which the Fund pays a monthly management fee. The management fee is the sum of an individual fund fee rate that is based on an annual rate of .60% of the Fund's average net assets and an annualized group fee rate that averaged .25% during the period. The group fee rate is based upon the average net assets of all the mutual funds advised by FMR, including any mutual funds previously advised by FMR that are currently advised by Fidelity SelectCo, LLC, an affiliate of FMR. The group fee rate decreases as assets under management increase and increases as assets under management decrease. For the reporting period, the total annual management fee rate was .86% of the Fund's average net assets.
Distribution and Service Plan Fees. In accordance with Rule 12b-1 of the 1940 Act, the Fund has adopted separate Distribution and Service Plans for each class of shares. Certain classes pay Fidelity Distributors Corporation (FDC), an affiliate of FMR, separate Distribution and Service Fees, each of which is based on an annual percentage of each class' average net assets. In addition, FDC may pay financial intermediaries for selling shares of the Fund and providing shareholder support services. For the period, the Distribution and Service Fee rates, total fees and amounts retained by FDC were as follows:
| Distribution
Fee | Service
Fee | Total Fees | Retained
by FDC |
Class A | -% | .25% | $ 11,370 | $ 640 |
Class T | .25% | .25% | 10,003 | 706 |
Class C | .75% | .25% | 30,603 | 12,100 |
| | | $ 51,976 | $ 13,446 |
Sales Load. FDC may receive a front-end sales charge of up to 5.75% for selling Class A shares and 3.50% for selling Class T shares, some of which is paid to financial intermediaries for selling shares of the Fund. Depending on the holding period, FDC may receive contingent deferred sales charges levied on Class A, Class T and Class C redemptions. The deferred sales charges range from 1.00% for Class C shares, 1.00% for certain purchases of Class A shares and .25% for certain purchases of Class T shares.
For the period, sales charge amounts retained by FDC were as follows:
| Retained
by FDC |
Class A | $ 8,180 |
Class T | 2,075 |
Class C* | 942 |
| $ 11,197 |
* When Class C shares are initially sold, FDC pays commissions from its own resources to financial intermediaries through which the sales are made.
Annual Report
Fidelity Emerging Markets Discovery Fund
Notes to Financial Statements - continued
5. Fees and Other Transactions with Affiliates - continued
Transfer Agent Fees. Fidelity Investments Institutional Operations Company, Inc., (FIIOC), an affiliate of FMR, is the transfer, dividend disbursing and shareholder servicing agent for each class of the Fund. FIIOC receives account fees and asset-based fees that vary according to the account size and type of account of the shareholders of the respective classes of the Fund. FIIOC pays for typesetting, printing and mailing of shareholder reports, except proxy statements.
For the period, transfer agent fees for each class were as follows:
| Amount | % of
Average
Net Assets |
Class A | $ 13,166 | .29 |
Class T | 6,485 | .32 |
Class C | 7,570 | .25 |
Emerging Markets Discovery | 245,715 | .24 |
Institutional Class | 6,000 | .22 |
| $ 278,936 | |
Accounting and Security Lending Fees. Fidelity Service Company, Inc. (FSC), an affiliate of FMR, maintains the Fund's accounting records. The accounting fee is based on the level of average net assets for each month. Under a separate contract, FSC administers the security lending program. The security lending fee is based on the number and duration of lending transactions.
Brokerage Commissions. The Fund placed a portion of its portfolio transactions with brokerage firms which are affiliates of the investment adviser. Brokerage commissions are included in net realized gain (loss) and change in net unrealized appreciation (depreciation) in the Statement of Operations. The commissions paid to these affiliated firms were $334 for the period.
6. Committed Line of Credit.
The Fund participates with other funds managed by FMR or an affiliate in a $4.25 billion credit facility (the "line of credit") to be utilized for temporary or emergency purposes to fund shareholder redemptions or for other short-term liquidity purposes. The Fund has agreed to pay commitment fees on its pro-rata portion of the line of credit, which amounted to $232 and is reflected in Miscellaneous expenses on the Statement of Operations. During the period, there were no borrowings on this line of credit.
Annual Report
7. Security Lending.
The Fund lends portfolio securities through a lending agent from time to time in order to earn additional income. For equity securities, a lending agent is used and may loan securities to certain qualified borrowers, including Fidelity Capital Markets (FCM), a broker-dealer affiliated with the Fund. On the settlement date of the loan, the Fund receives collateral (in the form of U.S. Treasury obligations, letters of credit and/or cash) against the loaned securities and maintains collateral in an amount not less than 100% of the market value of the loaned securities during the period of the loan. The market value of the loaned securities is determined at the close of business of the Fund and any additional required collateral is delivered to the Fund on the next business day. If the borrower defaults on its obligation to return the securities loaned because of insolvency or other reasons, the Fund may apply collateral received from the borrower against the obligation. The Fund may experience delays and costs in recovering the securities loaned. Any cash collateral received is invested in the Fidelity Securities Lending Cash Central Fund. At period end, there were no security loans outstanding. Security lending income represents the income earned on investing cash collateral, less rebates paid to borrowers and any lending agent fees associated with the loan, plus any premium payments received for lending certain types of securities. Security lending income is presented in the Statement of Operations as a component of income from Fidelity Central Funds. Total security lending income during the period amounted to $3,614. During the period, there were no securities loaned to FCM.
8. Expense Reductions.
FMR contractually agreed to reimburse each class to the extent annual operating expenses exceeded certain levels of average net assets as noted in the table below. This reimbursement will remain in place through December 31, 2014. Some expenses, for example interest expense, including commitment fees, are excluded from this reimbursement.
The following classes were in reimbursement during the period:
| Expense
Limitations | Reimbursement |
| | |
Class A | 1.70% | $ 7,621 |
Class T | 1.95% | 4,856 |
Class C | 2.45% | 7,439 |
Emerging Markets Discovery | 1.45% | 124,923 |
Institutional Class | 1.45% | 4,058 |
| | $ 148,897 |
Annual Report
Fidelity Emerging Markets Discovery Fund
Notes to Financial Statements - continued
8. Expense Reductions - continued
In addition, FMR reimbursed a portion of the Fund's operating expenses during the period in the amount of $970.
Commissions paid to certain brokers with whom FMR, or its affiliates, places trades on behalf of the Fund include an amount in addition to trade execution, which may be rebated back to the Fund to offset certain expenses. This amount totaled $64,929 for the period.
9. Distributions to Shareholders.
Distributions to shareholders of each class were as follows:
Years ended October 31, | 2013 | 2012 A |
From net investment income | | |
Class A | $ 7,274 | $ 435 |
Class T | 5,643 | 203 |
Class C | 1,195 | - |
Emerging Markets Discovery | 259,277 | 6,522 |
Institutional Class | 12,904 | 600 |
Total | $ 286,293 | $ 7,760 |
From net realized gain | | |
Class A | $ 33,559 | $ - |
Class T | 33,691 | - |
Class C | 30,324 | - |
Emerging Markets Discovery | 778,518 | - |
Institutional Class | 38,774 | - |
Total | $ 914,866 | $ - |
A For the period November 1, 2011 (commencement of operations) to October 31, 2012.
Annual Report
10. Share Transactions.
Transactions for each class of shares were as follows:
| Shares | Dollars |
Years ended October 31, | 2013 | 2012 A | 2013 | 2012 A |
Class A | | | | |
Shares sold | 646,803 | 197,037 | $ 8,039,936 | $ 2,112,904 |
Reinvestment of distributions | 3,013 | 46 | 36,310 | 435 |
Shares redeemed | (384,660) | (56,598) | (4,712,072) | (637,589) |
Net increase (decrease) | 265,156 | 140,485 | $ 3,364,174 | $ 1,475,750 |
Class T | | | | |
Shares sold | 157,097 | 182,780 | $ 1,931,892 | $ 1,990,143 |
Reinvestment of distributions | 3,232 | 22 | 38,882 | 203 |
Shares redeemed | (149,702) | (39,546) | (1,831,906) | (451,707) |
Net increase (decrease) | 10,627 | 143,256 | $ 138,868 | $ 1,538,639 |
Class C | | | | |
Shares sold | 428,945 | 161,266 | $ 5,224,843 | $ 1,743,293 |
Reinvestment of distributions | 2,629 | - | 31,519 | - |
Shares redeemed | (387,768) | (36,511) | (4,776,955) | (415,821) |
Net increase (decrease) | 43,806 | 124,755 | $ 479,407 | $ 1,327,472 |
Emerging Markets Discovery | | | | |
Shares sold | 12,245,350 | 4,074,333 | $ 152,132,821 | $ 44,757,138 |
Reinvestment of distributions | 72,226 | 681 | 871,750 | 6,419 |
Shares redeemed | (7,876,995) | (791,760) | (96,541,547) | (8,744,517) |
Net increase (decrease) | 4,440,581 | 3,283,254 | $ 56,463,024 | $ 36,019,040 |
Institutional Class | | | | |
Shares sold | 231,788 | 199,001 | $ 2,857,278 | $ 2,149,513 |
Reinvestment of distributions | 3,612 | 64 | 43,597 | 600 |
Shares redeemed | (302,585) | (45,956) | (3,657,178) | (524,544) |
Net increase (decrease) | (67,185) | 153,109 | $ (756,303) | $ 1,625,569 |
A For the period November 1, 2011 (commencement of operations) to October 31, 2012.
11. Other.
The Fund's organizational documents provide former and current trustees and officers with a limited indemnification against liabilities arising in connection with the performance of their duties to the Fund. In the normal course of business, the Fund may also enter into contracts that provide general indemnifications. The Fund's maximum exposure under these arrangements is unknown as this would be dependent on future claims that may be made against the Fund. The risk of material loss from such claims is considered remote.
Annual Report
To the Trustees of Fidelity Investment Trust and the Shareholders of Fidelity Emerging Markets Discovery Fund:
In our opinion, the accompanying statement of assets and liabilities, including the schedule of investments, and the related statements of operations and of changes in net assets and the financial highlights present fairly, in all material respects, the financial position of Fidelity Emerging Markets Discovery Fund (a fund of Fidelity Investment Trust) at October 31, 2013, the results of its operations for the year then ended, the changes in its net assets for the period indicated and the financial highlights for each of the periods indicated, in conformity with accounting principles generally accepted in the United States of America. These financial statements and financial highlights (hereafter referred to as "financial statements") are the responsibility of the Fidelity Emerging Markets Discovery Fund's management. Our responsibility is to express an opinion on these financial statements based on our audits. We conducted our audits of these financial statements in accordance with the standards of the Public Company Accounting Oversight Board (United States). Those standards require that we plan and perform the audit to obtain reasonable assurance about whether the financial statements are free of material misstatement. An audit includes examining, on a test basis, evidence supporting the amounts and disclosures in the financial statements, assessing the accounting principles used and significant estimates made by management, and evaluating the overall financial statement presentation. We believe that our audits, which included confirmation of securities at October 31, 2013 by correspondence with the custodian and brokers, provide a reasonable basis for our opinion.
PricewaterhouseCoopers LLP
Boston, Massachusetts
December 17, 2013
Annual Report
The Trustees, Member of the Advisory Board, and executive officers of the trust and fund, as applicable, are listed below. The Board of Trustees governs the fund and is responsible for protecting the interests of shareholders. The Trustees are experienced executives who meet periodically throughout the year to oversee the fund's activities, review contractual arrangements with companies that provide services to the fund, oversee management of the risks associated with such activities and contractual arrangements, and review the fund's performance. Except for James C. Curvey, Ned C. Lautenbach, Ronald P. O'Hanley, and William S. Stavropoulos, each of the Trustees oversees 171 funds. Mr. Curvey oversees 394 funds. Mr. Lautenbach, Mr. O'Hanley, and Mr. Stavropoulos each oversees 245 funds.
The Trustees hold office without limit in time except that (a) any Trustee may resign; (b) any Trustee may be removed by written instrument, signed by at least two-thirds of the number of Trustees prior to such removal; (c) any Trustee who requests to be retired or who has become incapacitated by illness or injury may be retired by written instrument signed by a majority of the other Trustees; and (d) any Trustee may be removed at any special meeting of shareholders by a two-thirds vote of the outstanding voting securities of the trust. Each Trustee who is not an interested person of the trust and the fund (as defined in the 1940 Act) (Independent Trustee), shall retire not later than the last day of the calendar year in which his or her 75th birthday occurs. The Independent Trustees may waive this mandatory retirement age policy with respect to individual Trustees. The executive officers and Advisory Board Member hold office without limit in time, except that any officer and Advisory Board Member may resign or may be removed by a vote of a majority of the Trustees at any regular meeting or any special meeting of the Trustees. Except as indicated, each individual has held the office shown or other offices in the same company for the past five years.
Experience, Skills, Attributes, and Qualifications of the Fund's Trustees. The Governance and Nominating Committee has adopted a statement of policy that describes the experience, qualifications, attributes, and skills that are necessary and desirable for potential Independent Trustee candidates (Statement of Policy). The Board believes that each Trustee satisfied at the time he or she was initially elected or appointed a Trustee, and continues to satisfy, the standards contemplated by the Statement of Policy. The Governance and Nominating Committee also engages professional search firms to help identify potential Independent Trustee candidates who have the experience, qualifications, attributes, and skills consistent with the Statement of Policy. From time to time, additional criteria based on the composition and skills of the current Independent Trustees, as well as experience or skills that may be appropriate in light of future changes to board composition, business conditions, and regulatory or other developments, have also been considered by the professional search firms and the Governance and Nominating Committee. In addition, the Board takes into account the Trustees' commitment and participation in Board and committee meetings, as well as their leadership of standing and ad hoc committees throughout their tenure.
Annual Report
Trustees and Officers - continued
In determining that a particular Trustee was and continues to be qualified to serve as a Trustee, the Board has considered a variety of criteria, none of which, in isolation, was controlling. The Board believes that, collectively, the Trustees have balanced and diverse experience, qualifications, attributes, and skills, which allow the Board to operate effectively in governing the fund and protecting the interests of shareholders. Information about the specific experience, skills, attributes, and qualifications of each Trustee, which in each case led to the Board's conclusion that the Trustee should serve (or continue to serve) as a trustee of the fund, is provided below.
Board Structure and Oversight Function. James C. Curvey is an interested person (as defined in the 1940 Act) and currently serves as Chairman. The Trustees have determined that an interested Chairman is appropriate and benefits shareholders because an interested Chairman has a personal and professional stake in the quality and continuity of services provided to the fund. Independent Trustees exercise their informed business judgment to appoint an individual of their choosing to serve as Chairman, regardless of whether the Trustee happens to be independent or a member of management. The Independent Trustees have determined that they can act independently and effectively without having an Independent Trustee serve as Chairman and that a key structural component for assuring that they are in a position to do so is for the Independent Trustees to constitute a substantial majority for the Board. The Independent Trustees also regularly meet in executive session. Ned C. Lautenbach serves as Chairman of the Independent Trustees and as such (i) acts as a liaison between the Independent Trustees and management with respect to matters important to the Independent Trustees and (ii) with management prepares agendas for Board meetings.
Fidelity funds are overseen by different Boards of Trustees. The fund's Board oversees Fidelity's equity and high income funds and another Board oversees Fidelity's investment-grade bond, money market, and asset allocation funds. The asset allocation funds may invest in Fidelity funds overseen by the fund's Board. The use of separate Boards, each with its own committee structure, allows the Trustees of each group of Fidelity funds to focus on the unique issues of the funds they oversee, including common research, investment, and operational issues. On occasion, the separate Boards establish joint committees to address issues of overlapping consequences for the Fidelity funds overseen by each Board.
The Trustees operate using a system of committees to facilitate the timely and efficient consideration of all matters of importance to the Trustees, the fund, and fund shareholders and to facilitate compliance with legal and regulatory requirements and oversight of the fund's activities and associated risks. The Board, acting through its committees, has charged FMR and its affiliates with (i) identifying events or circumstances the occurrence of which could have demonstrably adverse effects on the fund's business and/or reputation; (ii) implementing processes and controls to lessen the possibility that such events or circumstances occur or to mitigate the effects of such events or circumstances if they do occur; and (iii) creating and maintaining a system designed to evaluate continuously business and market conditions in order to facilitate the identification and implementation processes described in (i) and (ii) above. Because the day-to-day operations and activities of the fund are carried out by or through FMR, its affiliates and other service providers, the fund's exposure to risks is mitigated but not eliminated by the processes overseen by the Trustees. While each of the Board's committees has responsibility for overseeing different aspects of the fund's activities, oversight is exercised primarily through the Operations, Audit, and Compliance Committees. In addition, the Independent Trustees have worked with FMR to enhance the Board's oversight of investment and financial risks, legal and regulatory risks, technology risks, and operational risks, including the development of additional risk reporting to the Board. For example, a working group comprised of Independent Trustees and FMR has worked and continues to work to review the Fidelity funds' valuation-related activities, reporting and risk management. Appropriate personnel, including but not limited to the fund's Chief Compliance Officer (CCO), FMR's internal auditor, the independent accountants, the fund's Treasurer and portfolio management personnel, make periodic reports to the Board's committees, as appropriate, including an annual review of FMR's risk management program for the Fidelity funds. The responsibilities of each standing committee, including their oversight responsibilities, are described further under "Standing Committees of the Fund's Trustees."
Annual Report
The fund's Statement of Additional Information (SAI) includes more information about the Trustees. To request a free copy, call Fidelity at 1-877-208-0098.
Interested Trustees*:
Correspondence intended for each Trustee who is an interested person may be sent to Fidelity Investments, 245 Summer Street, Boston, Massachusetts 02210.
Name, Year of Birth; Principal Occupations and Other Relevant Experience+ |
James C. Curvey (1935) |
Year of Election or Appointment: 2007 Trustee Chairman of the Board of Trustees |
| Mr. Curvey also serves as Trustee of other Fidelity funds. Mr. Curvey is a Director of Fidelity Investments Money Management, Inc. (2009-present), Director of Fidelity Research & Analysis Co. (2009-present) and Director of FMR and FMR Co., Inc. (2007-present). Mr. Curvey is also Vice Chairman (2007-present) and Director of FMR LLC. In addition, Mr. Curvey serves as an Overseer for the Boston Symphony Orchestra and a member of the Trustees of Villanova University. Previously, Mr. Curvey was the Vice Chairman (2006-2007) and Director (2000-2007) of FMR Corp. |
Ronald P. O'Hanley (1957) |
Year of Election or Appointment: 2011 Trustee |
| Mr. O'Hanley also serves as Trustee of other Fidelity funds. He is Director of Fidelity SelectCo, LLC (2013-present), FMR Co., Inc. (2010-present), Director of Fidelity Investments Money Management, Inc. (2010-present), Director of Fidelity Research & Analysis Company (2010-present), President of Fidelity Asset Management and Corporate Services and a Member of Fidelity's Executive Committee (2010-present). Previously, Mr. O'Hanley served as President and Chief Executive Officer of BNY Mellon Asset Management (2007-2010). Mr. O'Hanley also served as Vice Chairman of Bank New York Mellon Corp. and a member of that firm's Executive Committee. Prior to the 2007 merger of The Bank of New York and Mellon Financial Corporation, he was Vice Chairman of Mellon Financial Corporation and President and Chief Executive Officer of Mellon Asset Management. He joined Mellon in February 1997. Mr. O'Hanley currently serves as Chairman of the Boston Public Library Foundation Board of Directors and sits on the Board of Directors of Beth Israel Deaconess Medical Center, the Board of Trustees of the Marine Biological Laboratory and the Advisory Board of the Maxwell School of Citizenship and Public Administration at Syracuse University. Mr. O'Hanley also chairs the Council on Asset Management for the Financial Services Roundtable and is a member of the Board of Directors of Institutional Investor's U.S. Institute. |
* Trustees have been determined to be "Interested Trustees" by virtue of, among other things, their affiliation with the trust or various entities under common control with FMR.
+ The information above includes each Trustee's principal occupation during the last five years and other information relating to the experience, attributes, and skills relevant to each Trustee's qualifications to serve as a Trustee, which led to the conclusion that each Trustee should serve as a Trustee for the fund.
Annual Report
Independent Trustees:
Correspondence intended for each Independent Trustee (that is, the Trustees other than the Interested Trustees) may be sent to Fidelity Investments, P.O. Box 55235, Boston, Massachusetts 02205-5235.
Name, Year of Birth; Principal Occupations and Other Relevant Experience+ |
Dennis J. Dirks (1948) |
Year of Election or Appointment: 2005 Trustee |
| Mr. Dirks also serves as Trustee of other Fidelity funds. Prior to his retirement in May 2003, Mr. Dirks was Chief Operating Officer and a member of the Board of The Depository Trust & Clearing Corporation (DTCC). He also served as President, Chief Operating Officer, and Board member of The Depository Trust Company (DTC) and President and Board member of the National Securities Clearing Corporation (NSCC). In addition, Mr. Dirks served as Chief Executive Officer and Board member of the Government Securities Clearing Corporation, Chief Executive Officer and Board member of the Mortgage-Backed Securities Clearing Corporation, as a Trustee and a member of the Finance Committee of Manhattan College (2005-2008), and as a Trustee and a member of the Finance Committee of AHRC of Nassau County (2006-2008). Mr. Dirks is a member of the Independent Directors Council (IDC) Governing Council (2010-present) and Board of Directors for The Brookville Center for Children's Services, Inc. (2009-present). |
Alan J. Lacy (1953) |
Year of Election or Appointment: 2008 Trustee |
| Mr. Lacy also serves as Trustee of other Fidelity funds. Mr. Lacy serves as Senior Adviser (2007-present) of Oak Hill Capital Partners, L.P. (private equity). Mr. Lacy also served as Chief Executive Officer (2000-2005) and Vice Chairman (2005-2006) of Sears Holdings Corporation and Sears, Roebuck and Co. (retail). In addition, Mr. Lacy serves as a member of the Board of Directors of Dave & Buster's Entertainment, Inc. (restaurant and entertainment complexes, 2010-present), Earth Fare, Inc. (retail grocery, 2012-present), The Hillman Companies, Inc. (hardware wholesalers, 2010-present), and Bristol-Myers Squibb Company (global pharmaceuticals, 2008-present). Mr. Lacy is a member of the Board of Trustees of The National Parks Conservation Association (2006-present). Previously, Mr. Lacy served as Chairman of the Board of Trustees of the National Parks Conservation Association (2008-2011) and as a member of the Board of Directors for the Western Union Company (global money transfer, 2006-2011). |
Ned C. Lautenbach (1944) |
Year of Election or Appointment: 2000 Trustee Chairman of the Independent Trustees |
| Mr. Lautenbach also serves as Trustee of other Fidelity funds. Mr. Lautenbach currently serves as the Lead Director of the Eaton Corporation Board of Directors (diversified industrial, 1997-present). Mr. Lautenbach is Chairman of the Board of Directors of the Philharmonic Center for the Arts in Naples, Florida (2012-present) and a member of the Council on Foreign Relations (1994-present). Previously, Mr. Lautenbach was a Partner/Advisory Partner at Clayton, Dubilier & Rice, LLC (private equity investment, 1998-2010), as well as a Director of Sony Corporation (2006-2007). |
Joseph Mauriello (1944) |
Year of Election or Appointment: 2008 Trustee |
| Mr. Mauriello also serves as Trustee of other Fidelity funds. Prior to his retirement in January 2006, Mr. Mauriello served in numerous senior management positions including Deputy Chairman and Chief Operating Officer (2004-2005), and Vice Chairman of Financial Services (2002-2004) of KPMG LLP US (professional services, 1965-2005). Mr. Mauriello currently serves as a member of the Board of Directors of XL Group plc. (global insurance and re-insurance, 2006-present). Previously, Mr. Mauriello served as a Director of the Hamilton Funds of the Bank of New York (2006-2007) and of Arcadia Resources Inc. (health care services and products, 2007-2012). |
Robert W. Selander (1950) |
Year of Election or Appointment: 2011 Trustee |
| Mr. Selander also serves as Trustee of other Fidelity funds. Previously, Mr. Selander served as a Member of the Advisory Board of other Fidelity funds (2011), and Executive Vice Chairman (2010), Chief Executive Officer (2009-2010), and President and Chief Executive Officer (1997-2009) of Mastercard, Inc. |
Cornelia M. Small (1944) |
Year of Election or Appointment: 2005 Trustee |
| Ms. Small also serves as Trustee of other Fidelity funds. Ms. Small is a member of the Board of Directors (2009-present) and Chair of the Investment Committee (2010-present) of the Teagle Foundation. Ms. Small also serves on the Investment Committee of the Berkshire Taconic Community Foundation (2008-present). Previously, Ms. Small served as Chairperson (2002-2008) and a member of the Investment Committee and Chairperson (2008-2012) and a member of the Board of Trustees of Smith College. In addition, Ms. Small served as Chief Investment Officer, Director of Global Equity Investments, and a member of the Board of Directors of Scudder, Stevens & Clark and Scudder Kemper Investments. |
William S. Stavropoulos (1939) |
Year of Election or Appointment: 2002 Trustee Vice Chairman of the Independent Trustees |
| Mr. Stavropoulos also serves as Trustee of other Fidelity funds. Mr. Stavropoulos serves as President and Founder of the Michigan Baseball Foundation, the Great Lakes Loons (2007-present). Mr. Stavropoulos is Chairman Emeritus of the Board of Directors of The Dow Chemical Company, where he previously served in numerous senior management positions, including President, CEO (1995-2000; 2002-2004), Chairman of the Executive Committee (2000-2006), and as a member of the Board of Directors (1990-2006). Currently, Mr. Stavropoulos is Chairman of the Board of Directors of Univar Inc. (global distributor of commodity and specialty chemicals), a Director of Teradata Corporation (data warehousing and technology solutions), and Maersk Inc. (industrial conglomerate), and a member of the Advisory Board for Metalmark Capital LLC (private equity investment, 2005-present). Mr. Stavropoulos is an operating advisor to Clayton, Dubilier & Rice, LLC (private equity investment). In addition, Mr. Stavropoulos is a member of the University of Notre Dame Advisory Council for the College of Science, a Trustee of the Rollin L. Gerstacker Foundation, and a Director of the Naples Philharmonic Center for the Arts. Previously, Mr. Stavropoulos served as a Director of Chemical Financial Corporation (bank holding company, 1993-2012) and Tyco International, Ltd. (multinational manufacturing and services, 2007-2012). |
David M. Thomas (1949) |
Year of Election or Appointment: 2008 Trustee |
| Mr. Thomas also serves as Trustee of other Fidelity funds. Mr. Thomas serves as Non-Executive Chairman of the Board of Directors of Fortune Brands Home and Security (home and security products, 2011-present), and as a member of the Board of Directors of Interpublic Group of Companies, Inc. (marketing communication, 2004-present). Previously, Mr. Thomas served as Executive Chairman (2005-2006) and Chairman and Chief Executive Officer (2000-2005) of IMS Health, Inc. (pharmaceutical and healthcare information solutions), and a Director of Fortune Brands, Inc. (consumer products, 2000-2011). |
+ The information above includes each Trustee's principal occupation during the last five years and other information relating to the experience, attributes, and skills relevant to each Trustee's qualifications to serve as a Trustee, which led to the conclusion that each Trustee should serve as a Trustee for the fund.
Advisory Board Member and Executive Officers:
Correspondence intended for each executive officer and Peter S. Lynch may be sent to Fidelity Investments, 245 Summer Street, Boston, Massachusetts 02210. Executive officers appear below in alphabetical order.
Name, Year of Birth; Principal Occupation |
Peter S. Lynch (1944) |
Year of Election or Appointment: 2003 Member of the Advisory Board |
| Mr. Lynch also serves as Member of the Advisory Board of other Fidelity funds. Mr. Lynch is Vice Chairman and a Director of FMR and FMR Co., Inc. In addition, Mr. Lynch serves as a Trustee of Boston College and as the Chairman of the Inner-City Scholarship Fund. Previously, Mr. Lynch served on the Special Olympics International Board of Directors (1997-2006). |
Elizabeth Paige Baumann (1968) |
Year of Election or Appointment: 2012 Anti-Money Laundering (AML) Officer |
| Ms. Baumann also serves as AML Officer of other funds. She is Chief AML Officer of FMR LLC (2012-present) and is an employee of Fidelity Investments. Previously, Ms. Baumann served as Vice President and Deputy Anti-Money Laundering Officer (2007-2012). |
William C. Coffey (1969) |
Year of Election or Appointment: 2009 Assistant Secretary |
| Mr. Coffey also serves as Assistant Secretary of other funds. He is Senior Vice President and Deputy General Counsel of FMR LLC (2010-present), and is an employee of Fidelity Investments. Previously, Mr. Coffey served as Vice President and Associate General Counsel of FMR LLC (2005-2009). |
Jonathan Davis (1968) |
Year of Election or Appointment: 2010 Assistant Treasurer |
| Mr. Davis also serves as Assistant Treasurer of other funds. Mr. Davis is an employee of Fidelity Investments. Previously, Mr. Davis served as Vice President and Associate General Counsel of FMR LLC (2003-2010). |
Adrien E. Deberghes (1967) |
Year of Election or Appointment: 2008 Deputy Treasurer |
| Mr. Deberghes also serves as an officer of other funds. He is an employee of Fidelity Investments (2008-present). Prior to joining Fidelity Investments, Mr. Deberghes was Senior Vice President of Mutual Fund Administration at State Street Corporation (2007-2008), Senior Director of Mutual Fund Administration at Investors Bank & Trust (2005-2007), and Director of Finance for Dunkin' Brands (2000-2005). |
Stephanie J. Dorsey (1969) |
Year of Election or Appointment: 2010 Assistant Treasurer |
| Ms. Dorsey also serves as an officer of other funds. She is an employee of Fidelity Investments (2008-present) and has served in other fund officer roles. Prior to joining Fidelity Investments, Ms. Dorsey served as Treasurer (2004-2008) of the JPMorgan Mutual Funds and Vice President (2004-2008) of JPMorgan Chase Bank. |
Scott C. Goebel (1968) |
Year of Election or Appointment: 2008 Secretary and Chief Legal Officer (CLO) |
| Mr. Goebel serves as Secretary and CLO of other funds. Mr. Goebel also serves as Secretary of Fidelity Investments Money Management, Inc. (FIMM) (2010-present) and Fidelity Research and Analysis Company (FRAC) (2010-present); General Counsel, Secretary, and Senior Vice President of FMR (2008-present) and FMR Co., Inc. (2008-present); Chief Legal Officer of Fidelity Management & Research (Hong Kong) Limited (2008-present) and Assistant Secretary of Fidelity Management & Research (Japan) Inc. (2008-present), and Fidelity Management & Research (U.K.) Inc. (2008-present). Previously, Mr. Goebel served as Secretary and CLO of other Fidelity funds (2008-2013), Assistant Secretary of FIMM (2008-2010), FRAC (2008-2010), and certain funds (2007-2008); and as Vice President and Secretary of Fidelity Distributors Corporation (FDC) (2005-2007). Mr. Goebel has been employed by FMR LLC or an affiliate since 2001. |
Joseph A. Hanlon (1968) |
Year of Election or Appointment: 2012 Chief Compliance Officer |
| Mr. Hanlon also serves as Chief Compliance Officer of other funds. Mr. Hanlon serves as Compliance Officer of FMR, FMR Co., Inc., Fidelity Investments Money Management, Inc. (FIMM), Fidelity Research and Analysis Company (FRAC), and Fidelity Management & Research (Hong Kong) (2009-present), as Senior Vice President of the Fidelity Asset Management Division (2009-present), and is an employee of Fidelity Investments. Previously, Mr. Hanlon served as Compliance Officer of Fidelity Management & Research (Japan) Inc. (2009-2013), Strategic Advisers, Inc. (2009-2013), and Fidelity Management & Research (U.K.) Inc. (2009-2013). |
Bruce T. Herring (1965) |
Year of Election or Appointment: 2006 Vice President of certain Equity Funds |
| Mr. Herring also serves as Vice President of other funds. He serves as Chief Investment Officer of Fidelity Global Asset Allocation (GAA) (2013-present), Chief Investment Officer and Director of Fidelity Management & Research (U.K.) Inc. (2010-present), Group Chief Investment Officer of FMR, and President of Fidelity Research & Analysis Company (2010-present). Previously, Mr. Herring served as Vice President (2005-2006) and Senior Vice President (2006-2007) of Fidelity Management & Research Company, Vice President of FMR Co., Inc. (2001-2007), and as a portfolio manager for Fidelity U.S. Equity Funds. |
Brian B. Hogan (1964) |
Year of Election or Appointment: 2009 Vice President |
| Mr. Hogan also serves as Vice President of other funds. Mr. Hogan serves as President of FMR's Equity Division (2009-present). Previously, Mr. Hogan served as Senior Vice President, Equity Research of FMR (2006-2009) and as a portfolio manager. |
Chris Maher (1972) |
Year of Election or Appointment: 2013 Assistant Treasurer |
| Mr. Maher serves as Assistant Treasurer of other funds. Mr. Maher is Vice President of Valuation Oversight and is an employee of Fidelity Investments. Previously, Mr. Maher served as Vice President of Asset Management Compliance (2013), Vice President of FMR's Program Management Group (2010-2013), and Vice President of Valuation Oversight (2008-2010). |
Christine Reynolds (1958) |
Year of Election or Appointment: 2008 Chief Financial Officer |
| Ms. Reynolds also serves as Chief Financial Officer of other funds. Ms. Reynolds became President of Fidelity Pricing and Cash Management Services (FPCMS) in August 2008. Ms. Reynolds served as Chief Operating Officer of FPCMS (2007-2008). Previously, Ms. Reynolds served as President, Treasurer, and Anti-Money Laundering officer of the Fidelity funds (2004-2007). |
Kenneth B. Robins (1969) |
Year of Election or Appointment: 2008 President and Treasurer |
| Mr. Robins also serves as an officer of other funds. Mr. Robins serves as Executive Vice President of Fidelity Investments Money Management, Inc. (FIMM) (2013-present) and is an employee of Fidelity Investments (2004-present). Previously, Mr. Robins served in other fund officer roles. |
Gary W. Ryan (1958) |
Year of Election or Appointment: 2005 Assistant Treasurer |
| Mr. Ryan also serves as Assistant Treasurer of other funds. Mr. Ryan is an employee of Fidelity Investments and has served in other fund officer roles. Previously, Mr. Ryan served as Vice President of Fund Reporting in Fidelity Pricing and Cash Management Services (FPCMS) (1999-2005). |
Stephen Sadoski (1971) |
Year of Election or Appointment: 2012 Deputy Treasurer |
| Mr. Sadoski also serves as Deputy Treasurer of other funds. He is an employee of Fidelity Investments (2012-present) and has served in another fund officer role. Prior to joining Fidelity Investments, Mr. Sadoski served as an assistant chief accountant in the Division of Investment Management of the Securities and Exchange Commission (SEC) (2009-2012) and as a senior manager at Deloitte & Touche LLP (1997-2009). |
Stacie M. Smith (1974) |
Year of Election or Appointment: 2013 Deputy Treasurer |
| Ms. Smith also serves as an officer of other funds. She is an employee of Fidelity Investments (2009-present) and has served in other fund officer roles. Prior to joining Fidelity Investments, Ms. Smith served as Senior Audit Manager of Ernst & Young LLP (1996-2009). |
Renee Stagnone (1975) |
Year of Election or Appointment: 2013 Deputy Treasurer |
| Ms. Stagnone also serves as Deputy Treasurer of other funds. Ms. Stagnone is an employee of Fidelity Investments. |
Joseph F. Zambello (1957) |
Year of Election or Appointment: 2011 Deputy Treasurer |
| Mr. Zambello also serves as Deputy Treasurer of other funds. Mr. Zambello is an employee of Fidelity Investments. Previously, Mr. Zambello served as Vice President of FMR's Program Management Group (2009-2011) and Vice President of the Transfer Agent Oversight Group (2005-2009). |
Annual Report
The Board of Trustees of Fidelity Advisor Emerging Markets Discovery Fund voted to pay to shareholders of record at the opening of business on record date, the following distributions per share derived from capital gains realized from sales of portfolio securities and dividends derived from net investment income:
| Pay Date | Record Date | Dividends | Capital Gains |
Institutional Class | 12/09/13 | 12/06/13 | $0.055 | $0.30 |
The fund hereby designates as a capital gain dividend with respect to the taxable year ended October 31, 2013, $2,657,028, or, if subsequently determined to be different, the net capital gain of such year.
A percentage of the dividends distributed during the fiscal year for the following funds may be taken into account as a dividend for purposes of the maximum rate under section 1(h)(11) of the Internal Revenue Code:
| December 7, 2012 | December 27, 2012 |
Institutional Class | 17% | 100% |
The amounts per share which represent income derived from sources within, and taxes paid to, foreign countries or possessions of the United States are as follows:
| Pay Date | Income | Taxes |
Institutional Class | 12/10/12 | $0.095 | $0.0134 |
| 12/28/12 | $0.002 | $0.0000 |
The fund will notify shareholders in January 2014 of amounts for use in preparing 2013 income tax returns.
Annual Report
Board Approval of Investment Advisory Contracts and Management Fees
Fidelity Emerging Markets Discovery Fund
Each year, the Board of Trustees, including the Independent Trustees (together, the Board), votes on the renewal of the management contract and sub-advisory agreements (together, the Advisory Contracts) for the fund. The Board, assisted by the advice of fund counsel and Independent Trustees' counsel, requests and considers a broad range of information relevant to the renewal of the Advisory Contracts throughout the year.
The Board meets regularly and, at each of its meetings, covers an extensive agenda of topics and materials and considers factors that are relevant to its annual consideration of the renewal of the fund's Advisory Contracts, including the services and support provided to the fund and its shareholders. The Board has established various standing committees, each composed of and chaired by Independent Trustees with varying backgrounds, to which the Board has assigned specific subject matter responsibilities in order to enhance effective decision-making by the Board. The Board, acting directly and through its Committees, requests and receives information concerning the annual consideration of the renewal of the fund's Advisory Contracts. The Board also meets as needed to consider matters specifically related to the Board's annual consideration of the renewal of Advisory Contracts. Members of the Board may also meet with trustees of other Fidelity funds through ad hoc joint committees to discuss certain matters relevant to the Fidelity funds.
At its July 2013 meeting, the Board, including the Independent Trustees, unanimously determined to renew the fund's Advisory Contracts. In reaching its determination, the Board considered all factors it believed relevant, including (i) the nature, extent, and quality of the services to be provided to the fund and its shareholders (including the investment performance of the fund); (ii) the competitiveness of the fund's management fee and total expense ratio relative to peer funds; (iii) the total costs of the services to be provided by and the profits to be realized by Fidelity from its relationship with the fund; (iv) the extent to which economies of scale exist and would be realized as the fund grows; and (v) whether fee levels reflect these economies of scale, if any, for the benefit of fund shareholders.
In considering whether to renew the Advisory Contracts for the fund, the Board reached a determination, with the assistance of fund counsel and Independent Trustees' counsel and through the exercise of its business judgment, that the renewal of the Advisory Contracts was in the best interests of the fund and its shareholders and that the compensation payable under the Advisory Contracts was fair and reasonable. The Board's decision to renew the Advisory Contracts was not based on any single factor, but rather was based on a comprehensive consideration of all the information provided to the Board at its meetings throughout the year. The Board, in reaching its determination to renew the Advisory Contracts, was aware that shareholders in the fund have a broad range of investment choices available to them, including a wide choice among mutual funds offered by Fidelity's competitors, and that the fund's shareholders, who have the opportunity to review and weigh the disclosure provided by the fund in its prospectus and other public disclosures, have chosen to invest in this fund, which is a part of the Fidelity family of funds.
Annual Report
Nature, Extent, and Quality of Services Provided. The Board considered the staffing within the investment adviser, Fidelity Management & Research Company (FMR), and the sub-advisers (together, the Investment Advisers) as it relates to the fund, including the backgrounds of the fund's investment personnel, and also considered the fund's investment objective, strategies, and related investment philosophy. The Independent Trustees also had discussions with senior management of Fidelity's investment operations and investment groups. The Board considered the structure of the portfolio manager compensation program and whether this structure provides appropriate incentives to act in the best interests of the fund.
Resources Dedicated to Investment Management and Support Services. The Board and the Fund Oversight and Research Committees reviewed the general qualifications and capabilities of the Investment Advisers' investment staff, including its size, education, experience, and resources, as well as the Investment Advisers' approach to recruiting, training, managing, and compensating investment personnel. The Board noted that FMR has continued to increase the resources devoted to non-U.S. offices, including expansion of Fidelity's global investment organization. The Board also noted that Fidelity's analysts have extensive resources, tools and capabilities that allow them to conduct sophisticated quantitative and fundamental analysis, as well as credit analysis of issuers, counterparties and guarantors. Further, the Board believes that Fidelity's investment professionals have sufficient access to global information and data so as to provide competitive investment results over time, and that those professionals also have access to sophisticated tools that permit them to assess portfolio construction and risk and performance attribution characteristics continuously, as well as to transmit new information and research conclusions rapidly around the world. Additionally, in its deliberations, the Board considered the Investment Advisers' trading and risk management capabilities and resources, which are an integral part of the investment management process.
Shareholder and Administrative Services. The Board considered (i) the nature, extent, quality, and cost of advisory, administrative, and shareholder services performed by the Investment Advisers and their affiliates under the Advisory Contracts and under separate agreements covering transfer agency, pricing and bookkeeping, and securities lending services for the fund; (ii) the nature and extent of the supervision of third party service providers, principally custodians and subcustodians; and (iii) the resources devoted to, and the record of compliance with, the fund's compliance policies and procedures. The Board also reviewed the allocation of fund brokerage, including allocations to brokers affiliated with the Investment Advisers, the use of brokerage commissions to pay fund expenses, and the use of "soft" commission dollars to pay for research services.
Annual Report
Board Approval of Investment Advisory Contracts and
Management Fees - continued
The Board noted that the growth of fund assets over time across the complex allows Fidelity to reinvest in the development of services designed to enhance the value or convenience of the Fidelity funds as investment vehicles. These services include 24-hour access to account information and market information through telephone representatives and over the Internet, investor education materials and asset allocation tools, and the expanded availability of Fidelity Investor Centers.
Investment in a Large Fund Family. The Board considered the benefits to shareholders of investing in a Fidelity fund, including the benefits of investing in a fund that is part of a large family of funds offering a variety of investment disciplines and providing a large variety of mutual fund investor services. The Board noted that Fidelity had taken, or had made recommendations that resulted in the Fidelity funds taking, a number of actions over the previous year that benefited particular funds, including (i) continuing to dedicate additional resources to investment research and to the support of the senior management team that oversees asset management; (ii) persisting in efforts to enhance Fidelity's global research capabilities; (iii) launching new funds and making other enhancements to meet client needs for global and income-oriented solutions; (iv) continuing to launch dedicated lower cost underlying funds to meet portfolio construction needs related to expanding underlying fund options for Fidelity funds of funds, specifically for the Freedom Fund product lines; (v) rationalizing product lines and gaining increased efficiencies through the mergers of several funds into other funds; (vi) strengthening Fidelity's index fund offerings by reducing investment minimums and adopting or lowering existing expense caps for certain funds and classes; (vii) enhancing Global Asset Allocation product offerings by launching new funds and strategies, including "open architecture" target date funds that utilize affiliated and unaffiliated sub-advisers; (viii) modifying the eligibility criteria for Institutional Class shares of Advisor funds to increase their marketability to a portion of the defined contribution plan market; (ix) creating a new low-cost retirement share class for certain Advisor funds to appeal to large retirement plans; (x) transitioning the management of certain Fidelity commodity funds to Geode Capital Management LLC, a registered commodity pool operator, while retaining administrative responsibilities for the funds; (xi) reorganizing a number of funds; and (xii) taking steps toward establishing a new Fidelity adviser to manage sector-based funds and products.
Investment Performance. The Board considered whether the fund has operated in accordance with its investment objective, as well as its record of compliance with its investment restrictions and its performance history.
The Board took into account discussions with the Investment Advisers about fund investment performance that occur at Board meetings throughout the year. In this regard the Board noted that as part of regularly scheduled fund reviews and other reports to the Board on fund performance, the Board periodically considers annualized return information for the fund, for different time periods, measured against a securities market index ("benchmark index") and a peer group of mutual funds with similar objectives ("peer group"). In its evaluation of fund investment performance, the Board gave particular attention to information indicating changes in performance of certain Fidelity funds for specific time periods and the Investment Advisers' explanations for any overperformance or underperformance.
Annual Report
In addition to reviewing absolute and relative fund performance, the Independent Trustees periodically consider the appropriateness of fund performance metrics in evaluating the results achieved. In general, the Independent Trustees believe that fund performance should be evaluated based on net performance (after fees and expenses) of both the highest performing and lowest performing classes, where applicable, compared to appropriate benchmark indices, over appropriate time periods which may include full market cycles, and compared to peer groups, as applicable, over the same periods, taking into account relevant factors including the following: general market conditions; issuer-specific information; tactical opportunities for investment; and fund cash flows and other factors.
The Independent Trustees recognize that shareholders evaluate performance on a net basis over their own holding periods, for which one-, three-, and five-year periods are used as a proxy. For this reason, the performance information reviewed by the Board also included net cumulative calendar year total return information for the fund and an appropriate benchmark index and peer group for the most recent one-year period, as shown below. Returns are shown compared to the 25th percentile (top of box) and 75th percentile (bottom of box) of the peer universe.
Annual Report
Board Approval of Investment Advisory Contracts and
Management Fees - continued
Fidelity Emerging Markets Discovery Fund

Based on its review, the Board concluded that the nature, extent, and quality of services provided to the fund under the Advisory Contracts should benefit the fund's shareholders.
Competitiveness of Management Fee and Total Expense Ratio. The Board considered the fund's management fee and total expense ratio compared to "mapped groups" of competitive funds and classes. Fidelity creates "mapped groups" by combining similar Lipper investment objective categories that have comparable management fee characteristics. Combining Lipper investment objective categories aids the Board's management fee and total expense ratio comparisons by broadening the competitive group used for comparison and by reducing the number of universes to which various Fidelity funds are compared.
Management Fee. The Board considered two proprietary management fee comparisons for the 12-month (or shorter) periods shown in the chart below. The group of Lipper funds used by the Board for management fee comparisons is referred to below as the "Total Mapped Group." The Total Mapped Group comparison focuses on a fund's standing in terms of gross management fees before expense reimbursements or caps relative to the total universe of funds with comparable investment mandates, regardless of whether their management fee structures also are comparable. Funds with comparable investment mandates offer exposure to similar types of securities. Funds with comparable management fee structures have similar management fee contractual arrangements (e.g., flat rate charged for advisory services, all-inclusive fee rate, etc.). "TMG %" represents the percentage of funds in the Total Mapped Group that had management fees that were lower than the fund's. For example, a TMG % of 19% means that 81% of the funds in the Total Mapped Group had higher management fees than the fund. The "Asset-Size Peer Group" (ASPG) comparison focuses on a fund's standing relative to a subset of non-Fidelity funds within the Total Mapped Group that are similar in size and management fee structure. The ASPG represents at least 15% of the funds in the Total Mapped Group with comparable asset size and management fee structures, subject to a minimum of 50 funds (or all funds in the Total Mapped Group if fewer than 50). Additional information, such as the ASPG quartile in which the fund's management fee ranked, is also included in the chart and considered by the Board.
Annual Report
Fidelity Emerging Markets Discovery Fund

The Board noted that the fund's management fee ranked below the median of its Total Mapped Group and below the median of its ASPG for 2012.
Based on its review, the Board concluded that the fund's management fee is fair and reasonable in light of the services that the fund receives and the other factors considered.
Total Expense Ratio. In its review of each class's total expense ratio, the Board considered the fund's management fee as well as other fund or class expenses, as applicable, such as transfer agent fees, pricing and bookkeeping fees, fund-paid 12b-1 fees, and custodial, legal, and audit fees. The Board also noted the effects of any waivers and reimbursements on fees and expenses. As part of its review, the Board also considered the current and historical total expense ratios of each class of the fund compared to competitive fund median expenses. Each class of the fund is compared to those funds and classes in the Total Mapped Group (used by the Board for management fee comparisons) that have a similar sales load structure.
Annual Report
Board Approval of Investment Advisory Contracts and
Management Fees - continued
The Board noted that the total expense ratio of each of Class A and the retail class ranked below its competitive median for 2012 and the total expense ratio of each of Class T, Class C, and Institutional Class ranked above its competitive median for 2012. The Board considered that, in general, various factors can affect total expense ratios. The Board noted that the total expense ratio of Class T was above the competitive median primarily because of higher 12b-1 fees on Class T. Class T has a higher 12b-1 fee, but a lower front-end sales charge, than traditionally priced front-end sales charge classes. The Board considered that Class T is primarily sold load-waived in the retirement plan market where its 0.50% 12b-1 fee is comparable to competing no-load, higher 12b-1 fee classes designed specifically for retirement plans. The Board noted that the fund offers multiple classes, each of which has a different sales load and 12b-1 fee structure, and that the multiple structures are intended to offer a range of pricing options for the intermediary market. The Board also noted that the total expense ratios of the classes vary primarily by the level of their 12b-1 fees, although differences in transfer agent fees may also cause expenses to vary from class to class.
The Board further considered that FMR contractually agreed to reimburse Class A, Class T, Class C, Institutional Class, and the retail class of the fund to the extent that total operating expenses (excluding interest, taxes, certain securities lending costs, brokerage commissions, extraordinary expenses, and acquired fund fees and expenses, if any), as a percentage of their respective average net assets, exceed 1.70%, 1.95%, 2.45%, 1.45%, and 1.45% through December 31, 2013.
Fees Charged to Other Fidelity Clients. The Board also considered Fidelity fee structures and other information with respect to clients of FMR and its affiliates, such as other mutual funds advised or subadvised by FMR or its affiliates, pension plan clients, and other institutional clients. The Board noted the findings of the 2013 ad hoc joint committee (created with the board of other Fidelity funds), which reviewed and compared Fidelity's institutional investment advisory business with its business of providing services to the Fidelity funds, including the differences in services provided, fees charged, and costs incurred, as well as competition in their respective marketplaces.
Based on its review of total expense ratios and fees charged to other Fidelity clients, the Board concluded that the total expense ratio of each class of the fund was reasonable, although in some cases above the median of the universe presented for comparison, in light of the services that the fund and its shareholders receive and the other factors considered.
Costs of the Services and Profitability. The Board considered the revenues earned and the expenses incurred by Fidelity in conducting the business of developing, marketing, distributing, managing, administering and servicing the fund and servicing the fund's shareholders. The Board also considered the level of Fidelity's profits in respect of all the Fidelity funds.
Annual Report
On an annual basis, FMR presents to the Board Fidelity's profitability for the fund. Fidelity calculates the profitability for each fund, as well as aggregate profitability for groups of Fidelity funds and all Fidelity funds, using a series of detailed revenue and cost allocation methodologies which originate with the books and records of Fidelity on which Fidelity's audited financial statements are based. The Audit Committee of the Board reviews any significant changes from the prior year's methodologies.
PricewaterhouseCoopers LLP (PwC), independent registered public accounting firm and auditor to Fidelity and certain Fidelity funds, has been engaged annually by the Board as part of the Board's assessment of Fidelity's profitability analysis. PwC's engagement includes the review and assessment of the methodologies used by Fidelity in determining the revenues and expenses attributable to Fidelity's mutual fund business, and completion of agreed-upon procedures surrounding the mathematical accuracy of fund profitability and its conformity to allocation methodologies. After considering PwC's reports issued under the engagement and information provided by Fidelity, the Board concluded that while other allocation methods may also be reasonable, Fidelity's profitability methodologies are reasonable in all material respects.
The Board also reviewed Fidelity's non-fund businesses and fall-out benefits related to the mutual fund business as well as cases where Fidelity's affiliates may benefit from or be related to the fund's business.
The Board considered the costs of the services provided by and the profits realized by Fidelity in connection with the operation of the fund and was satisfied that the profitability was not excessive in the circumstances.
Economies of Scale. The Board considered whether there have been economies of scale in respect of the management of the Fidelity funds, whether the Fidelity funds (including the fund) have appropriately benefited from any such economies of scale, and whether there is potential for realization of any further economies of scale. The Board considered the extent to which the fund will benefit from economies of scale through increased services to the fund, through waivers or reimbursements, or through fee or expense reductions. The Board also noted that in 2009, it and the board of other Fidelity funds created an ad hoc committee (the Economies of Scale Committee) to analyze whether FMR attains economies of scale in respect of the management and servicing of the Fidelity funds, whether the Fidelity funds have appropriately benefited from such economies of scale, and whether there is potential for realization of any further economies of scale.
The Board recognized that the fund's management contract incorporates a "group fee" structure, which provides for lower group fee rates as total fund assets under FMR's management increase, and for higher group fee rates as total fund assets under FMR's management decrease. FMR calculates the group fee rates based on a tiered asset "breakpoint" schedule that varies based on asset class. The Board considered that the group fee is designed to deliver the benefits of economies of scale to fund shareholders when total Fidelity fund assets increase, even if assets of any particular fund are unchanged or have declined, because some portion of Fidelity's costs are attributable to services provided to all Fidelity funds, and all funds benefit if those costs can be allocated among more assets. The Board concluded that, given the group fee structure, fund shareholders will benefit from lower management fees as assets under FMR's management increase at the fund complex level, regardless of whether Fidelity achieves any such economies of scale.
Annual Report
Board Approval of Investment Advisory Contracts and
Management Fees - continued
The Board concluded, taking into account the analysis of the Economies of Scale Committee, that economies of scale, if any, are being appropriately shared between fund shareholders and Fidelity.
Amendment to Description of Group Fee Rate. At its July 2013 meeting, the Board voted to approve an amendment to the fund's management contract to modify the description of the "group fee rate" effective August 1, 2013. The Board noted that under the prior description in the contract, the group fee rate was based on the average net assets of all registered investment companies with which FMR has management contracts. Under the contract's tiered asset breakpoint schedule, the group fee rate is lower as total fund assets under FMR's management increase, and higher as total fund assets under FMR's management decrease. The Board considered that the prior description would have excluded the assets of 64 Fidelity sector funds from the group fee rate calculation once Fidelity SelectCo, LLC, an affiliate of FMR, assumed management responsibilities for those funds. The Board noted that modifying the description of the group fee rate to continue to include the assets of those 64 funds for purposes of determining group fee rate breakpoints would avoid an immediate adverse impact on the group fee rate for any fund.
Additional Information Requested by the Board. In order to develop fully the factual basis for consideration of the Fidelity funds' Advisory Contracts, the Board requested and received additional information on certain topics, including: (i) fund performance trends and Fidelity's long-term strategies for certain funds; (ii) the potential to further rationalize the Fidelity fund lineup with the possibility of achieving savings for the funds and Fidelity; (iii) the methodology with respect to competitive fund data and peer group classifications; (iv) the arrangements with, and performance of, certain sub-advisers on behalf of the Fidelity funds, as well as certain proposed participating affiliate arrangements; (v) the realization of fall-out benefits in certain Fidelity business units; (vi) Fidelity's group fee structures, including the rationale for the individual fee rates of certain categories of funds and the definition of group assets; (vii) trends regarding industry use of performance fee structures and the performance adjustment methodologies applicable to the Fidelity funds; (viii) additional competitive analysis regarding the total expenses for certain classes; and (ix) fund profitability methodology, including Fidelity's cost allocation methodology, and the impact of certain factors on fund profitability results.
Annual Report
Based on its evaluation of all of the conclusions noted above, and after considering all factors it believed relevant, the Board ultimately concluded that the advisory fee structures are fair and reasonable, and that the fund's Advisory Contracts should be renewed.
Annual Report
Investment Adviser
Fidelity Management & Research Company
Boston, MA
Investment Sub-Advisers
FMR Co., Inc.
Fidelity Management & Research
(U.K.) Inc.
Fidelity Management & Research
(Hong Kong) Limited
Fidelity Management & Research
(Japan) Inc.
FIL Investments (Japan) Limited
FIL Investment Advisors (UK) Limited
FIL Investment Advisors
General Distributor
Fidelity Distributors Corporation
Smithfield, RI
Transfer and Service Agents
Fidelity Investments Institutional Operations Company, Inc.
Boston, MA
Fidelity Service Company, Inc.
Boston, MA
Custodian
The Northern Trust Company
Chicago, IL
(Fidelity Investment logo)(registered trademark)
AEMDI-UANN-1213
1.931242.101
Fidelity®
Global Equity Income
Fund
Annual Report
October 31, 2013
(Fidelity Cover Art)
Contents
Performance | (Click Here) | How the fund has done over time. |
Management's Discussion of Fund Performance | (Click Here) | The Portfolio Manager's review of fund performance and strategy. |
Shareholder Expense Example | (Click Here) | An example of shareholder expenses. |
Investment Changes | (Click Here) | A summary of major shifts in the fund's investments over the past six months. |
Investments | (Click Here) | A complete list of the fund's investments with their market values. |
Financial Statements | (Click Here) | Statements of assets and liabilities, operations, and changes in net assets, as well as financial highlights. |
Notes | (Click Here) | Notes to the financial statements. |
Report of Independent Registered Public Accounting Firm | (Click Here) | |
Trustees and Officers | (Click Here) | |
Distributions | (Click Here) | |
Board Approval of Investment Advisory Contracts and Management Fees | (Click Here) | |
To view a fund's proxy voting guidelines and proxy voting record for the 12-month period ended June 30, visit http://www.fidelity.com/proxyvotingresults or visit the Securities and Exchange Commission's (SEC) web site at http://www.sec.gov. You may also call 1-800-544-8544 to request a free copy of the proxy voting guidelines.
Standard & Poor's, S&P and S&P 500 are registered service marks of The McGraw-Hill Companies, Inc. and have been licensed for use by Fidelity Distributors Corporation.
Other third-party marks appearing herein are the property of their respective owners.
All other marks appearing herein are registered or unregistered trademarks or service marks of FMR LLC or an affiliated company. © 2013 FMR LLC. All rights reserved.
Annual Report
This report and the financial statements contained herein are submitted for the general information of the shareholders of the fund. This report is not authorized for distribution to prospective investors in the fund unless preceded or accompanied by an effective prospectus.
A fund files its complete schedule of portfolio holdings with the SEC for the first and third quarters of each fiscal year on Form N-Q. Forms N-Q are available on the SEC's web site at http://www.sec.gov. A fund's Forms N-Q may be reviewed and copied at the SEC's Public Reference Room in Washington, DC. Information regarding the operation of the SEC's Public Reference Room may be obtained by calling 1-800-SEC-0330. For a complete list of a fund's portfolio holdings, view the most recent holdings listing, semiannual report, or annual report on Fidelity's web site at http://www.fidelity.com, http://www.advisor.fidelity.com, or http://www.401k.com, as applicable.
NOT FDIC INSURED • MAY LOSE VALUE • NO BANK GUARANTEE
Neither the fund nor Fidelity Distributors Corporation is a bank.
Annual Report
Average annual total return reflects the change in the value of an investment, assuming reinvestment of the fund's distributions from dividend income and capital gains (the profits earned upon the sale of securities that have grown in value, if any) and assuming a constant rate of performance each year. The $10,000 table and the fund's returns do not reflect the deduction of taxes that a shareholder would pay on fund distributions or the redemption of fund shares. During periods of reimbursement by Fidelity, a fund's total return will be greater than it would be had the reimbursement not occurred. How a fund did yesterday is no guarantee of how it will do tomorrow.
Average Annual Total Returns
Periods ended October 31, 2013 | Past 1
year | Life of fund A |
Fidelity® Global Equity Income | 22.73% | 16.36% |
A From May 2, 2012.
$10,000 Over Life of Fund
Let's say hypothetically that $10,000 was invested in Fidelity® Global Equity Income Fund, on May 2, 2012, when the fund started. The chart shows how the value of your investment would have changed, and also shows how the MSCI® ACWI® (All Country World Index) Index performed over the same period.
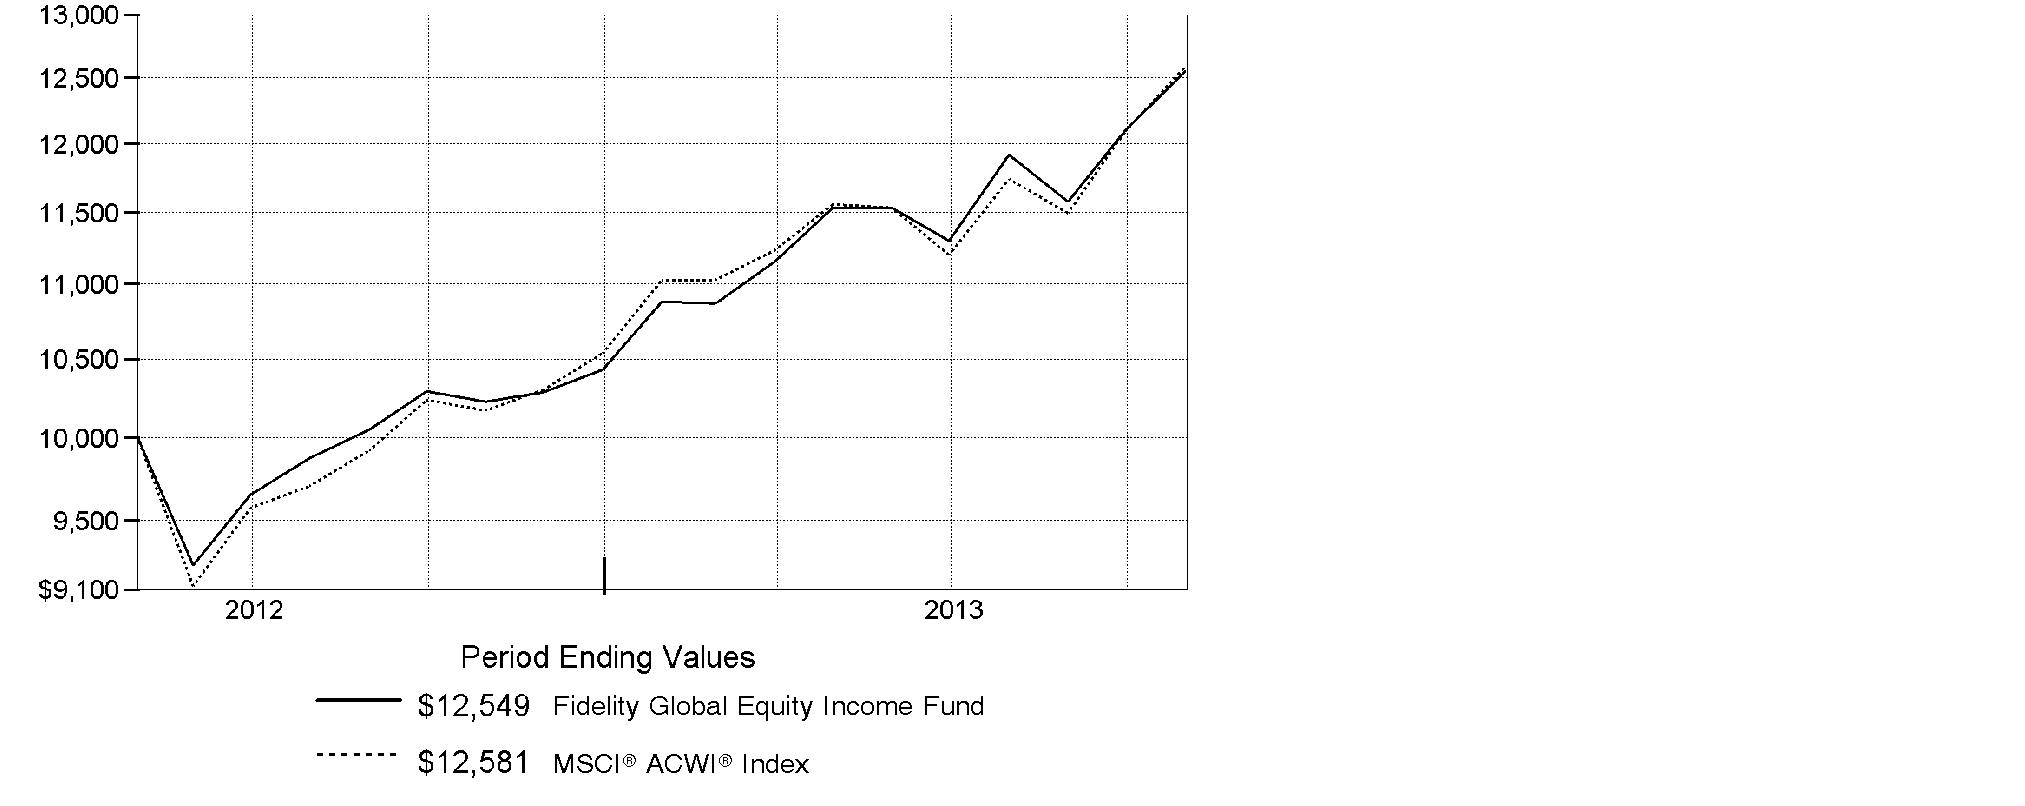
Annual Report
Market Recap: On balance, global equity markets remained upbeat for the 12-month period ending October 31, 2013. The MSCI® ACWI® (All Country World Index) Index gained 23.75% for the period, amid investor preference for higher-risk assets. The period was not without turbulence, however. In the spring and summer, central banks worldwide, especially in the U.S. and China, made clear their intentions to maintain accommodative monetary policies. That stance, combined with modest cyclical improvements around the globe and generally low valuations, underpinned the broad rally in equities. Europe (+32%) shone brightly, with most markets in the region - large and small - registering solid, index-beating gains. Another bright spot was Japan, which, despite a struggling yen and taking a second-half breather, posted a 34% result for the full year. The U.S. - by far the index's biggest constituent - also outperformed the global market with a roughly 28% advance. Meanwhile, Asia-Pacific ex Japan (+14%) lagged, hurt in part by a slowdown in Australia's mining industry as well as currency headwinds. Foreign-exchange and commodity weakness also curbed results in resource-heavy Canada and emerging markets (EM), both of which were up 7%. Country-level EM performance diverged meaningfully for the period, as evidenced by performance in Brazil (-1%), Russia (+12%), India (+1%) and China (+8%).
Comments from Ramona Persaud, Portfolio Manager of Fidelity® Global Equity Income Fund: For the year, the fund's Retail Class shares gained 22.73%, trailing the 23.75% advance of the MSCI® ACWI®. Despite lagging its benchmark, the fund's lower risk profile helped it outpace the index on a risk-adjusted basis. Versus the MSCI index, it hurt to overweight consumer electronics giant Apple, which struggled this period amid negative sentiment around the launch of its lower-priced products. I consider Apple a high-quality business with a rock-solid balance sheet and very cheap valuation, so I added to my position. Additionally, I was very valuation sensitive amid the rising market, not seeing the types of stocks I like to own at attractive prices, so the fund's modest cash stake detracted. On the positive side, increased exposure to the European market contributed, including a handful of high-quality, attractively priced income-producing stocks that fit my high-predictability and low-volatility criteria. Our top relative contributor was Intrum Justitia, a Swedish debt collector that benefited from European banks slowly rebuilding capital to absorb losses from selling bad debt. Netherlands-based industrial conglomerate Philips Electronics also helped, while Swedish bank Svenska Handelsbanken was another strong performer for the fund.
The views expressed above reflect those of the portfolio manager(s) only through the end of the period as stated on the cover of this report and do not necessarily represent the views of Fidelity or any other person in the Fidelity organization. Any such views are subject to change at any time based upon market or other conditions and Fidelity disclaims any responsibility to update such views. These views may not be relied on as investment advice and, because investment decisions for a Fidelity fund are based on numerous factors, may not be relied on as an indication of trading intent on behalf of any Fidelity fund.
Annual Report
Shareholder Expense Example
As a shareholder of the Fund, you incur two types of costs: (1) transaction costs, including redemption fees and (2) ongoing costs, including management fees and other Fund expenses. This Example is intended to help you understand your ongoing costs (in dollars) of investing in the Fund and to compare these costs with the ongoing costs of investing in other mutual funds.
The Example is based on an investment of $1,000 invested at the beginning of the period and held for the entire period (May 1, 2013 to October 31, 2013).
Actual Expenses
The first line of the accompanying table provides information about actual account values and actual expenses. You may use the information in this line, together with the amount you invested, to estimate the expenses that you paid over the period. Simply divide your account value by $1,000.00 (for example, an $8,600 account value divided by $1,000.00 = 8.6), then multiply the result by the number in the first line under the heading entitled "Expenses Paid During Period" to estimate the expenses you paid on your account during this period. A small balance maintenance fee of $12.00 that is charged once a year may apply for certain accounts with a value of less than $2,000. This fee is not included in the table below. If it was, the estimate of expenses you paid during the period would be higher, and your ending account value lower, by this amount. In addition, the Fund, as a shareholder in the underlying Fidelity Central Funds, will indirectly bear its pro-rata share of the fees and expenses incurred by the underlying Fidelity Central Funds. These fees and expenses are not included in the Fund's annualized expense ratio used to calculate the expense estimate in the table below.
Hypothetical Example for Comparison Purposes
The second line of the accompanying table provides information about hypothetical account values and hypothetical expenses based on the Fund's actual expense ratio and an assumed rate of return of 5% per year before expenses, which is not the Fund's actual return. The hypothetical account values and expenses may not be used to estimate the actual ending account balance or expenses you paid for the period. You may use this information to compare the ongoing costs of investing in the Fund and other funds. To do so, compare this 5% hypothetical example with the 5% hypothetical examples that appear in the shareholder reports of the other funds. A small balance maintenance fee of $12.00 that is charged once a year may apply for certain accounts with a value of less than $2,000. This fee is not included in the table below. If it was, the estimate of expenses you paid during the period would be higher, and your ending account value lower, by this amount. In addition, the Fund, as a shareholder in the underlying Fidelity Central Funds, will indirectly bear its pro-rata share of the fees and expenses incurred by the underlying Fidelity Central Funds. These fees and expenses are not included in the Fund's annualized expense ratio used to calculate the expense estimate in the table below.
Please note that the expenses shown in the table are meant to highlight your ongoing costs only and do not reflect any transaction costs. Therefore, the second line of the table is useful in comparing ongoing costs only, and will not help you determine the relative total costs of owning different funds. In addition, if these transactional costs were included, your costs would have been higher.
Annual Report
Shareholder Expense Example - continued
| Annualized
Expense Ratio B | Beginning
Account Value
May 1, 2013 | Ending
Account Value
October 31, 2013 | Expenses Paid
During Period*
May 1, 2013
to October 31, 2013 |
Actual | 1.20% | $ 1,000.00 | $ 1,088.00 | $ 6.32 |
Hypothetical A | | $ 1,000.00 | $ 1,019.16 | $ 6.11 |
A 5% return per year before expenses
B Annualized expense ratio reflects expenses net of applicable fee waivers.
* Expenses are equal to the Fund's annualized expense ratio, multiplied by the average account value over the period, multiplied by 184/365 (to reflect the one-half year period).
Annual Report
Investment Changes (Unaudited)
Geographic Diversification (% of fund's net assets) |
As of October 31, 2013 |
 | United States of America* 41.2% | |
 | United Kingdom 11.2% | |
 | Japan 5.7% | |
 | Sweden 4.8% | |
 | Canada 3.7% | |
 | Germany 3.6% | |
 | Ireland 3.1% | |
 | France 3.1% | |
 | Switzerland 2.7% | |
 | Other 20.9% | |

* Includes Short-Term Investments and Net Other Assets (Liabilities). |
Percentages are based on country or territory of incorporation and are adjusted for the effect of futures contracts, if applicable. |
As of April 30, 2013 |
| United States of America* 41.3% | |
| United Kingdom 13.1% | |
| Japan 4.6% | |
| Switzerland 3.7% | |
| Germany 3.6% | |
| France 3.4% | |
| Sweden 3.0% | |
| Netherlands 2.9% | |
| Ireland 2.4% | |
| Other 22.0% | |

* Includes Short-Term Investments and Net Other Assets (Liabilities). |
Percentages are based on country or territory of incorporation and are adjusted for the effect of futures contracts, if applicable. |
Asset Allocation as of October 31, 2013 |
| % of fund's
net assets | % of fund's net assets
6 months ago |
Stocks | 96.3 | 94.3 |
Short-Term Investments and Net Other Assets (Liabilities) | 3.7 | 5.7 |
Top Ten Stocks as of October 31, 2013 |
| % of fund's
net assets | % of fund's net assets
6 months ago |
Apple, Inc. (United States of America, Computers & Peripherals) | 2.2 | 1.6 |
British American Tobacco PLC (United Kingdom) (United Kingdom, Tobacco) | 2.1 | 1.9 |
Wells Fargo & Co. (United States of America, Commercial Banks) | 1.9 | 1.7 |
Roche Holding AG (participation certificate) (Switzerland, Pharmaceuticals) | 1.8 | 1.6 |
General Electric Co. (United States of America, Industrial Conglomerates) | 1.8 | 1.9 |
Vodafone Group PLC (United Kingdom, Wireless Telecommunication Services) | 1.8 | 1.5 |
Svenska Handelsbanken AB (A Shares) (Sweden, Commercial Banks) | 1.7 | 1.5 |
Comcast Corp. Class A (United States of America, Media) | 1.6 | 1.5 |
Chevron Corp. (United States of America, Oil, Gas & Consumable Fuels) | 1.6 | 1.7 |
Japan Tobacco, Inc. (Japan, Tobacco) | 1.6 | 1.0 |
| 18.1 | |
Market Sectors as of October 31, 2013 |
| % of fund's
net assets | % of fund's net assets
6 months ago |
Financials | 19.9 | 18.6 |
Industrials | 14.6 | 12.2 |
Consumer Staples | 14.1 | 12.4 |
Consumer Discretionary | 12.7 | 10.7 |
Health Care | 10.4 | 12.0 |
Information Technology | 8.5 | 7.4 |
Telecommunication Services | 6.9 | 6.9 |
Energy | 5.8 | 8.2 |
Utilities | 2.7 | 3.3 |
Materials | 0.7 | 2.6 |
Annual Report
Investments October 31, 2013
Showing Percentage of Net Assets
Common Stocks - 94.8% |
| Shares | | Value |
Australia - 1.3% |
Australia & New Zealand Banking Group Ltd. | 9,398 | | $ 300,584 |
Telstra Corp. Ltd. | 48,616 | | 238,018 |
TOTAL AUSTRALIA | | 538,602 |
Bailiwick of Jersey - 1.2% |
Informa PLC | 25,084 | | 225,029 |
Wolseley PLC | 5,232 | | 281,954 |
TOTAL BAILIWICK OF JERSEY | | 506,983 |
Belgium - 0.7% |
Anheuser-Busch InBev SA NV | 3,000 | | 310,991 |
Canada - 3.7% |
Alimentation Couche-Tard, Inc. Class B (sub. vtg.) | 3,500 | | 237,059 |
Constellation Software, Inc. | 1,700 | | 309,690 |
Fairfax Financial Holdings Ltd. (sub. vtg.) | 641 | | 279,725 |
Loblaw Companies Ltd. | 5,500 | | 251,566 |
Power Corp. of Canada (sub. vtg.) | 9,400 | | 276,956 |
Suncor Energy, Inc. | 6,200 | | 225,309 |
TOTAL CANADA | | 1,580,305 |
Cayman Islands - 0.4% |
Springland International Holdings Ltd. | 306,000 | | 167,742 |
Chile - 0.9% |
Aguas Andinas SA | 362,531 | | 245,580 |
Inversiones La Construccion SA | 10,370 | | 155,677 |
TOTAL CHILE | | 401,257 |
Denmark - 0.6% |
Novo Nordisk A/S Series B | 1,400 | | 233,174 |
Finland - 0.8% |
Sampo Oyj (A Shares) | 6,800 | | 322,129 |
France - 3.1% |
Arkema SA | 2,400 | | 272,484 |
Edenred SA | 7,600 | | 258,230 |
Ipsos SA | 3,800 | | 160,278 |
Sanofi SA | 5,626 | | 599,862 |
TOTAL FRANCE | | 1,290,854 |
Common Stocks - continued |
| Shares | | Value |
Germany - 2.4% |
AURELIUS AG | 12,899 | | $ 440,292 |
Siemens AG | 4,410 | | 563,564 |
TOTAL GERMANY | | 1,003,856 |
Hong Kong - 0.6% |
HKT Trust / HKT Ltd. unit | 269,000 | | 249,466 |
Ireland - 3.1% |
Accenture PLC Class A | 6,490 | | 477,015 |
FBD Holdings PLC | 9,020 | | 194,726 |
Greencore Group PLC | 101,000 | | 291,660 |
Irish Continental Group PLC unit | 9,400 | | 329,473 |
TOTAL IRELAND | | 1,292,874 |
Israel - 1.1% |
Rami Levi Chain Stores Hashikma Marketing 2006 Ltd. | 8,896 | | 481,854 |
Japan - 5.7% |
Daito Trust Construction Co. Ltd. | 1,800 | | 183,787 |
Japan Retail Fund Investment Corp. | 154 | | 311,900 |
Japan Tobacco, Inc. | 18,900 | | 683,872 |
KDDI Corp. | 4,500 | | 243,704 |
Leopalace21 Corp. (a) | 38,600 | | 267,981 |
Nippon Telegraph & Telephone Corp. | 5,400 | | 280,694 |
Relo Holdings Corp. | 4,500 | | 208,636 |
Workman Co. Ltd. | 5,500 | | 215,542 |
TOTAL JAPAN | | 2,396,116 |
Kenya - 0.4% |
Safaricom Ltd. | 1,534,200 | | 169,867 |
Korea (South) - 1.0% |
Coway Co. Ltd. | 3,818 | | 218,011 |
LG Telecom Ltd. (a) | 16,990 | | 194,509 |
TOTAL KOREA (SOUTH) | | 412,520 |
Netherlands - 2.7% |
Exact Holdings NV | 8,600 | | 227,753 |
Koninklijke Philips Electronics NV | 18,116 | | 640,233 |
Unilever NV (Certificaten Van Aandelen) (Bearer) | 7,300 | | 289,412 |
TOTAL NETHERLANDS | | 1,157,398 |
Nigeria - 0.3% |
Nestle Foods Nigeria PLC | 18,526 | | 128,329 |
Common Stocks - continued |
| Shares | | Value |
Norway - 1.3% |
Gjensidige Forsikring ASA | 13,100 | | $ 244,481 |
Telenor ASA | 12,400 | | 297,864 |
TOTAL NORWAY | | 542,345 |
Panama - 1.3% |
Copa Holdings SA Class A | 3,760 | | 562,270 |
Russia - 0.6% |
Mobile TeleSystems OJSC | 25,400 | | 267,379 |
Singapore - 0.6% |
United Overseas Bank Ltd. | 14,000 | | 234,874 |
South Africa - 2.2% |
Astral Foods Ltd. | 42,660 | | 429,203 |
Lewis Group Ltd. | 27,800 | | 194,209 |
Reunert Ltd. | 44,800 | | 314,621 |
TOTAL SOUTH AFRICA | | 938,033 |
Spain - 1.8% |
Grifols SA ADR | 17,881 | | 539,291 |
Inditex SA | 1,430 | | 234,931 |
TOTAL SPAIN | | 774,222 |
Sweden - 4.8% |
Intrum Justitia AB | 20,683 | | 550,585 |
Nordea Bank AB | 43,490 | | 557,044 |
Svenska Handelsbanken AB (A Shares) | 15,980 | | 724,027 |
Swedish Match Co. AB | 5,780 | | 190,703 |
TOTAL SWEDEN | | 2,022,359 |
Switzerland - 2.7% |
Roche Holding AG (participation certificate) | 2,786 | | 771,304 |
UBS AG | 20,145 | | 389,626 |
TOTAL SWITZERLAND | | 1,160,930 |
Taiwan - 0.8% |
Chipbond Technology Corp. | 75,000 | | 151,350 |
Far EasTone Telecommunications Co. Ltd. | 80,000 | | 183,455 |
TOTAL TAIWAN | | 334,805 |
United Kingdom - 11.2% |
British American Tobacco PLC (United Kingdom) | 15,900 | | 877,239 |
Dunelm Group PLC | 13,000 | | 184,471 |
Ensco PLC Class A | 4,573 | | 263,633 |
Common Stocks - continued |
| Shares | | Value |
United Kingdom - continued |
GlaxoSmithKline PLC | 19,400 | | $ 511,430 |
Hilton Food Group PLC | 67,100 | | 460,477 |
Imperial Tobacco Group PLC | 6,288 | | 234,814 |
Reckitt Benckiser Group PLC | 4,552 | | 353,840 |
Royal Dutch Shell PLC Class A (United Kingdom) | 8,983 | | 299,177 |
Royal Mail PLC | 2,900 | | 26,039 |
The Restaurant Group PLC | 44,278 | | 408,933 |
Vodafone Group PLC | 205,520 | | 752,771 |
WH Smith PLC | 25,252 | | 364,806 |
TOTAL UNITED KINGDOM | | 4,737,630 |
United States of America - 37.5% |
AbbVie, Inc. | 6,420 | | 311,049 |
American Tower Corp. | 5,400 | | 428,490 |
Amgen, Inc. | 4,500 | | 522,000 |
Apple, Inc. | 1,750 | | 914,111 |
Applied Industrial Technologies, Inc. | 5,845 | | 276,527 |
Cedar Fair LP (depositary unit) | 7,700 | | 353,045 |
Chevron Corp. | 5,735 | | 687,971 |
Comcast Corp. Class A | 14,550 | | 692,289 |
Community Trust Bancorp, Inc. | 7,180 | | 305,796 |
ConocoPhillips Co. | 5,200 | | 381,160 |
CVB Financial Corp. | 21,580 | | 313,773 |
Dr. Pepper Snapple Group, Inc. | 10,261 | | 485,858 |
Dun & Bradstreet Corp. | 1,950 | | 212,141 |
Eli Lilly & Co. | 4,510 | | 224,688 |
General Electric Co. | 29,290 | | 765,641 |
H&R Block, Inc. | 6,510 | | 185,144 |
Hubbell, Inc. Class B | 5,102 | | 548,669 |
IBM Corp. | 2,375 | | 425,624 |
ITC Holdings Corp. | 4,587 | | 461,406 |
Johnson & Johnson | 5,927 | | 548,899 |
JPMorgan Chase & Co. | 9,180 | | 473,137 |
L Brands, Inc. | 3,750 | | 234,788 |
Lakeland Financial Corp. | 2,900 | | 103,211 |
Liberty Media Corp. Interactive Series A (a) | 14,240 | | 383,910 |
Lorillard, Inc. | 4,800 | | 244,848 |
MasterCard, Inc. Class A | 380 | | 272,498 |
Microsoft Corp. | 16,980 | | 600,243 |
National Penn Bancshares, Inc. | 27,870 | | 289,012 |
ONEOK, Inc. | 2,210 | | 124,865 |
Psychemedics Corp. | 11,020 | | 154,170 |
Common Stocks - continued |
| Shares | | Value |
United States of America - continued |
Sempra Energy | 3,220 | | $ 293,471 |
Tesoro Logistics LP | 1,990 | | 106,863 |
The Williams Companies, Inc. | 8,470 | | 302,464 |
TransDigm Group, Inc. | 1,280 | | 186,125 |
U.S. Bancorp | 15,880 | | 593,277 |
United Technologies Corp. | 6,150 | | 653,438 |
VF Corp. | 2,640 | | 567,600 |
Visa, Inc. Class A | 1,160 | | 228,137 |
Wells Fargo & Co. | 18,337 | | 782,807 |
Western Gas Partners LP | 3,470 | | 208,582 |
TOTAL UNITED STATES OF AMERICA | | 15,847,727 |
TOTAL COMMON STOCKS (Cost $33,777,062) |
40,066,891
|
Nonconvertible Preferred Stocks - 1.5% |
| | | |
Brazil - 0.3% |
Alpargatas Sa (PN) | 21,900 | | 151,527 |
Germany - 1.2% |
Volkswagen AG | 1,940 | | 493,091 |
TOTAL NONCONVERTIBLE PREFERRED STOCKS (Cost $519,814) |
644,618
|
Money Market Funds - 3.5% |
| | | |
Fidelity Cash Central Fund, 0.09% (b)
(Cost $1,468,005) | 1,468,005 | |
1,468,005
|
TOTAL INVESTMENT PORTFOLIO - 99.8% (Cost $35,764,881) | | 42,179,514 |
NET OTHER ASSETS (LIABILITIES) - 0.2% | | 91,686 |
NET ASSETS - 100% | $ 42,271,200 |
Legend |
(a) Non-income producing |
(b) Affiliated fund that is generally available only to investment companies and other accounts managed by Fidelity Investments. The rate quoted is the annualized seven-day yield of the fund at period end. A complete unaudited listing of the fund's holdings as of its most recent quarter end is available upon request. In addition, each Fidelity Central Fund's financial statements, which are not covered by the Fund's Report of Independent Registered Public Accounting Firm, are available on the SEC's website or upon request. |
Affiliated Central Funds |
Information regarding fiscal year to date income earned by the Fund from investments in Fidelity Central Funds is as follows: |
Fund | Income earned |
Fidelity Cash Central Fund | $ 2,266 |
Fidelity Securities Lending Cash Central Fund | 8,819 |
Total | $ 11,085 |
Other Information |
Categorizations in the Schedule of Investments are based on country or territory of incorporation. |
The following is a summary of the inputs used, as of October 31, 2013, involving the Fund's assets and liabilities carried at fair value. The inputs or methodology used for valuing securities may not be an indication of the risk associated with investing in those securities. For more information on valuation inputs, and their aggregation into the levels used in the tables below, please refer to the Investment Valuation section in the accompanying Notes to Financial Statements. |
Valuation Inputs at Reporting Date: |
Description | Total | Level 1 | Level 2 | Level 3 |
Investments in Securities: | | | | |
Equities: | | | | |
Consumer Discretionary | $ 5,435,346 | $ 5,219,804 | $ 215,542 | $ - |
Consumer Staples | 5,951,725 | 3,790,211 | 2,161,514 | - |
Energy | 2,475,159 | 2,175,982 | 299,177 | - |
Financials | 8,381,948 | 7,020,018 | 1,361,930 | - |
Health Care | 4,415,867 | 3,071,401 | 1,344,466 | - |
Industrials | 6,169,510 | 4,965,713 | 1,203,797 | - |
Information Technology | 3,606,421 | 3,606,421 | - | - |
Materials | 272,484 | 272,484 | - | - |
Telecommunication Services | 2,877,727 | 1,600,558 | 1,277,169 | - |
Utilities | 1,125,322 | 1,125,322 | - | - |
Money Market Funds | 1,468,005 | 1,468,005 | - | - |
Total Investments in Securities: | $ 42,179,514 | $ 34,315,919 | $ 7,863,595 | $ - |
The following is a summary of transfers between Level 1 and Level 2 for the period ended October 31, 2013. Transfers are assumed to have occurred at the beginning of the period, and are primarily attributable to the valuation techniques used for foreign equity securities, as discussed in the accompanying Notes to Financial Statements: |
Transfers | Total |
Level 1 to Level 2 | $ 817,282 |
Level 2 to Level 1 | $ 0 |
See accompanying notes which are an integral part of the financial statements.
Annual Report
Statement of Assets and Liabilities
| October 31, 2013 |
| | |
Assets | | |
Investment in securities, at value - See accompanying schedule: Unaffiliated issuers (cost $34,296,876) | $ 40,711,509 | |
Fidelity Central Funds (cost $1,468,005) | 1,468,005 | |
Total Investments (cost $35,764,881) | | $ 42,179,514 |
Receivable for investments sold | | 426,939 |
Receivable for fund shares sold | | 99,290 |
Dividends receivable | | 72,900 |
Distributions receivable from Fidelity Central Funds | | 76 |
Prepaid expenses | | 161 |
Other receivables | | 575 |
Total assets | | 42,779,455 |
| | |
Liabilities | | |
Payable for investments purchased | $ 399,497 | |
Payable for fund shares redeemed | 31,680 | |
Accrued management fee | 25,824 | |
Audit fees payable | 41,149 | |
Other affiliated payables | 8,388 | |
Other payables and accrued expenses | 1,717 | |
Total liabilities | | 508,255 |
| | |
Net Assets | | $ 42,271,200 |
Net Assets consist of: | | |
Paid in capital | | $ 34,954,557 |
Accumulated undistributed net realized gain (loss) on investments and foreign currency transactions | | 901,435 |
Net unrealized appreciation (depreciation) on investments and assets and liabilities in foreign currencies | | 6,415,208 |
Net Assets, for 3,465,742 shares outstanding | | $ 42,271,200 |
Net Asset Value, offering price and redemption price per share ($42,271,200 ÷ 3,465,742 shares) | | $ 12.20 |
See accompanying notes which are an integral part of the financial statements.
Annual Report
Statement of Operations
| Year ended October 31, 2013 |
| | |
Investment Income | | |
Dividends | | $ 1,132,730 |
Income from Fidelity Central Funds | | 11,085 |
Income before foreign taxes withheld | | 1,143,815 |
Less foreign taxes withheld | | (57,794) |
Total income | | 1,086,021 |
| | |
Expenses | | |
Management fee | $ 243,403 | |
Transfer agent fees | 71,534 | |
Accounting and security lending fees | 17,949 | |
Custodian fees and expenses | 12,820 | |
Independent trustees' compensation | 189 | |
Registration fees | 33,680 | |
Audit | 62,680 | |
Legal | 69 | |
Miscellaneous | 162 | |
Total expenses before reductions | 442,486 | |
Expense reductions | (30,183) | 412,303 |
Net investment income (loss) | | 673,718 |
Realized and Unrealized Gain (Loss) Net realized gain (loss) on: | | |
Investment securities: | | |
Unaffiliated issuers | 1,092,633 | |
Foreign currency transactions | (11,167) | |
Total net realized gain (loss) | | 1,081,466 |
Change in net unrealized appreciation (depreciation) on: Investment securities | 5,340,687 | |
Assets and liabilities in foreign currencies | 1,224 | |
Total change in net unrealized appreciation (depreciation) | | 5,341,911 |
Net gain (loss) | | 6,423,377 |
Net increase (decrease) in net assets resulting from operations | | $ 7,097,095 |
See accompanying notes which are an integral part of the financial statements.
Annual Report
Financial Statements - continued
Statement of Changes in Net Assets
| Year ended
October 31,
2013 | For the period
May 2, 2012
(commencement of
operations) to
October 31, 2012 |
Increase (Decrease) in Net Assets | | |
Operations | | |
Net investment income (loss) | $ 673,718 | $ 133,764 |
Net realized gain (loss) | 1,081,466 | 16,921 |
Change in net unrealized appreciation (depreciation) | 5,341,911 | 1,073,297 |
Net increase (decrease) in net assets resulting
from operations | 7,097,095 | 1,223,982 |
Distributions to shareholders from net investment income | (655,660) | (140,159) |
Distributions to shareholders from net realized gain | (75,040) | - |
Total distributions | (730,700) | (140,159) |
Share transactions
Proceeds from sales of shares | 22,544,863 | 27,834,579 |
Reinvestment of distributions | 683,107 | 131,259 |
Cost of shares redeemed | (14,167,602) | (2,214,390) |
Net increase (decrease) in net assets resulting from share transactions | 9,060,368 | 25,751,448 |
Redemption fees | 6,232 | 2,934 |
Total increase (decrease) in net assets | 15,432,995 | 26,838,205 |
| | |
Net Assets | | |
Beginning of period | 26,838,205 | - |
End of period (including undistributed net investment income of $0 and distributions in excess of net investment income of $9, respectively) | $ 42,271,200 | $ 26,838,205 |
Other Information Shares | | |
Sold | 2,028,428 | 2,850,222 |
Issued in reinvestment of distributions | 62,848 | 12,874 |
Redeemed | (1,267,633) | (220,997) |
Net increase (decrease) | 823,643 | 2,642,099 |
See accompanying notes which are an integral part of the financial statements.
Annual Report
Financial Highlights
Years ended October 31, | 2013 | 2012 G |
Selected Per-Share Data | | |
Net asset value, beginning of period | $ 10.16 | $ 10.00 |
Income from Investment Operations | | |
Net investment income (loss) D | .22 | .08 |
Net realized and unrealized gain (loss) | 2.06 | .15 |
Total from investment operations | 2.28 | .23 |
Distributions from net investment income | (.21) | (.07) |
Distributions from net realized gain | (.03) | - |
Total distributions | (.24) | (.07) |
Redemption fees added to paid in capital D, I | - | - |
Net asset value, end of period | $ 12.20 | $ 10.16 |
Total Return B, C | 22.73% | 2.25% |
Ratios to Average Net Assets E, H | | |
Expenses before reductions | 1.28% | 2.18% A |
Expenses net of fee waivers, if any | 1.20% | 1.20% A |
Expenses net of all reductions | 1.19% | 1.17% A |
Net investment income (loss) | 1.94% | 1.62% A |
Supplemental Data | | |
Net assets, end of period (000 omitted) | $ 42,271 | $ 26,838 |
Portfolio turnover rate F | 66% | 33% J |
A Annualized
B Total returns for periods of less than one year are not annualized.
C Total returns would have been lower if certain expenses had not been reduced during the applicable periods shown.
D Calculated based on average shares outstanding during the period.
E Fees and expenses of any underlying Fidelity Central Funds are not included in the Fund's expense ratio. The Fund indirectly bears its proportionate share of the expenses of any underlying Fidelity Central Funds.
F Amount does not include the portfolio activity of any underlying Fidelity Central Funds.
G For the period May 2, 2012 (commencement of operations) to October 31, 2012.
H Expense ratios reflect operating expenses of the Fund. Expenses before reductions do not reflect amounts reimbursed by the investment adviser or reductions from brokerage service arrangements or reductions from other expense offset arrangements and do not represent the amount paid by the Fund during periods when reimbursements or reductions occur. Expense ratios before reductions for start-up periods may not be representative of longer term operating periods. Expenses net of fee waivers reflect expenses after reimbursement by the investment adviser but prior to reductions from brokerage service arrangements or other expense offset arrangements. Expenses net of all reductions represent the net expenses paid by the Fund.
I Amount represents less than $.01 per share.
J Amount not annualized.
See accompanying notes which are an integral part of the financial statements.
Annual Report
Notes to Financial Statements
For the period ended October 31, 2013
1. Organization.
Fidelity Global Equity Income Fund (the Fund) is a fund of Fidelity Investment Trust (the Trust) and is authorized to issue an unlimited number of shares. The Trust is registered under the Investment Company Act of 1940, as amended (the 1940 Act), as an open-end management investment company organized as a Massachusetts business trust.
2. Investments in Fidelity Central Funds.
The Fund invests in Fidelity Central Funds, which are open-end investment companies generally available only to other investment companies and accounts managed by Fidelity Management & Research Company (FMR) and its affiliates. The Fund's Schedule of Investments lists each of the Fidelity Central Funds held as of period end, if any, as an investment of the Fund, but does not include the underlying holdings of each Fidelity Central Fund. As an Investing Fund, the Fund indirectly bears its proportionate share of the expenses of the underlying Fidelity Central Funds.
The Money Market Central Funds seek preservation of capital and current income and are managed by Fidelity Investments Money Management, Inc. (FIMM), an affiliate of FMR.
A complete unaudited list of holdings for each Fidelity Central Fund is available upon request or at the Securities and Exchange Commission (the SEC) website at www.sec.gov. In addition, the financial statements of the Fidelity Central Funds, which are not covered by the Fund's Report of Independent Registered Public Accounting Firm, are available on the SEC website or upon request.
3. Significant Accounting Policies.
The financial statements have been prepared in conformity with accounting principles generally accepted in the United States of America (GAAP), which require management to make certain estimates and assumptions at the date of the financial statements. Actual results could differ from those estimates. Subsequent events, if any, through the date that the financial statements were issued have been evaluated in the preparation of the financial statements. The following summarizes the significant accounting policies of the Fund:
Investment Valuation. Investments are valued as of 4:00 p.m. Eastern time on the last calendar day of the period. In accordance with valuation policies and procedures approved by the Board of Trustees (the Board), the Fund attempts to obtain prices from one or more third party pricing vendors or brokers to value its investments. When current market prices, quotations or currency exchange rates are not readily available or
Annual Report
3. Significant Accounting Policies - continued
Investment Valuation - continued
reliable, investments will be fair valued in good faith by the FMR Fair Value Committee (the Committee), in accordance with procedures adopted by the Board. Factors used in determining fair value vary by investment type and may include market or investment specific events. The frequency with which these procedures are used cannot be predicted and they may be utilized to a significant extent. The Committee oversees the Fund's valuation policies and procedures and is responsible for approving and reporting to the Board all fair value determinations.
The Fund categorizes the inputs to valuation techniques used to value its investments into a disclosure hierarchy consisting of three levels as shown below:
Level 1 - quoted prices in active markets for identical investments
Level 2 - other significant observable inputs (including quoted prices for similar investments, interest rates, prepayment speeds, etc.)
Level 3 - unobservable inputs (including the Fund's own assumptions based on the best information available)
Valuation techniques used to value the Fund's investments by major category are as follows:
Equity securities, including restricted securities, for which market quotations are readily available, are valued at the last reported sale price or official closing price as reported by a third party pricing vendor on the primary market or exchange on which they are traded and are categorized as Level 1 in the hierarchy. In the event there were no sales during the day or closing prices are not available, securities are valued at the last quoted bid price or may be valued using the last available price and are generally categorized as Level 2 in the hierarchy. For foreign equity securities, when market or security specific events arise, comparisons to the valuation of American Depositary Receipts (ADRs), futures contracts, Exchange-Traded Funds (ETFs) and certain indexes as well as quoted prices for similar securities may be used and would be categorized as Level 2 in the hierarchy. Utilizing these techniques may result in transfers between Level 1 and Level 2. For equity securities, including restricted securities, where observable inputs are limited, assumptions about market activity and risk are used and these securities may be categorized as Level 3 in the hierarchy.
Investments in open-end mutual funds, including the Fidelity Central Funds, are valued at their closing net asset value (NAV) each business day and are categorized as Level 1 in the hierarchy.
Annual Report
Notes to Financial Statements - continued
3. Significant Accounting Policies - continued
Investment Valuation - continued
Changes in valuation techniques may result in transfers in or out of an assigned level within the disclosure hierarchy. The aggregate value of investments by input level, as of October 31, 2013, including information on transfers between Levels 1 and 2 is included at the end of Fund's Schedule of Investments.
Foreign Currency. The Fund may use foreign currency contracts to facilitate transactions in foreign-denominated securities. Gains and losses from these transactions may arise from changes in the value of the foreign currency or if the counterparties do not perform under the contracts' terms.
Foreign-denominated assets, including investment securities, and liabilities are translated into U.S. dollars at the exchange rates at period end. Purchases and sales of investment securities, income and dividends received and expenses denominated in foreign currencies are translated into U.S. dollars at the exchange rate in effect on the transaction date.
The effects of exchange rate fluctuations on investments are included with the net realized and unrealized gain (loss) on investment securities. Other foreign currency transactions resulting in realized and unrealized gain (loss) are disclosed separately.
Investment Transactions and Income. For financial reporting purposes, the Fund's investment holdings and NAV include trades executed through the end of the last business day of the period. The NAV per share for processing shareholder transactions is calculated as of the close of business of the New York Stock Exchange (NYSE), normally 4:00 p.m. Eastern time and includes trades executed through the end of the prior business day. Gains and losses on securities sold are determined on the basis of identified cost. Dividend income is recorded on the ex-dividend date, except for certain dividends from foreign securities where the ex-dividend date may have passed, which are recorded as soon as the Fund is informed of the ex-dividend date. Non-cash dividends included in dividend income, if any, are recorded at the fair market value of the securities received. Distributions received on securities that represent a return of capital or capital gain are recorded as a reduction of cost of investments and/or as a realized gain. Subsequent to ex-dividend date the Fund determines the components of these distributions, based upon receipt of tax filings or other correspondence relating to the underlying investment. Interest income and distributions from the Fidelity Central Funds are accrued as earned. Investment income is recorded net of foreign taxes withheld where recovery of such taxes is uncertain.
Annual Report
3. Significant Accounting Policies - continued
Expenses. Expenses directly attributable to a fund are charged to that fund. Expenses attributable to more than one fund are allocated among the respective funds on the basis of relative net assets or other appropriate methods. Expense estimates are accrued in the period to which they relate and adjustments are made when actual amounts are known.
Income Tax Information and Distributions to Shareholders. Each year, the Fund intends to qualify as a regulated investment company under Subchapter M of the Internal Revenue Code, including distributing substantially all of its taxable income and realized gains. As a result, no provision for U.S. Federal income taxes is required. As of October 31, 2013, the Fund did not have any unrecognized tax benefits in the financial statements; nor is the Fund aware of any tax positions for which it is reasonably possible that the total amounts of unrecognized tax benefits will significantly change in the next twelve months. The Fund files a U.S. federal tax return, in addition to state and local tax returns as required. The Fund's federal income tax returns are subject to examination by the Internal Revenue Service (IRS) for a period of three fiscal years after they are filed. State and local tax returns may be subject to examination for an additional fiscal year depending on the jurisdiction. Foreign taxes are provided for based on the Fund's understanding of the tax rules and rates that exist in the foreign markets in which it invests.
Distributions are declared and recorded on the ex-dividend date. Income and capital gain distributions are determined in accordance with income tax regulations, which may differ from GAAP. In addition, the fund claimed a portion of the payment made to redeeming shareholders as a distribution for income tax purposes.
Capital accounts within the financial statements are adjusted for permanent book-tax differences. These adjustments have no impact on net assets or the results of operations. Temporary book-tax differences will reverse in a subsequent period.
Book-tax differences are primarily due to foreign currency transactions, equity-debt classifications, passive foreign investment companies (PFIC), partnerships and losses deferred due to wash sales.
The federal tax cost of investment securities and unrealized appreciation (depreciation) as of period end were as follows:
Gross unrealized appreciation | $ 6,697,965 |
Gross unrealized depreciation | (371,230) |
Net unrealized appreciation (depreciation) on securities and other investments | $ 6,326,735 |
| |
Tax Cost | $ 35,852,779 |
Annual Report
Notes to Financial Statements - continued
3. Significant Accounting Policies - continued
Income Tax Information and Distributions to Shareholders - continued
The tax-based components of distributable earnings as of period end were as follows:
Undistributed ordinary income | $ 522,545 |
Undistributed long-term capital gain | $ 466,788 |
Net unrealized appreciation (depreciation) | $ 6,327,310 |
The tax character of distributions paid was as follows:
| October 31, 2013 | October 31, 2012 |
Ordinary Income | $ 730,700 | $ 140,159 |
Short-Term Trading (Redemption) Fees. Shares held by investors in the Fund less than 30 days may have been subject to a redemption fee equal to 1.00% of the net asset value of shares redeemed. All redemption fees, which reduce the proceeds of the shareholder redemption, are retained by the Fund and accounted for as an addition to paid in capital.
4. Purchases and Sales of Investments.
Purchases and sales of securities, other than short-term securities, aggregated $30,350,855 and $21,702,595, respectively.
5. Fees and Other Transactions with Affiliates.
Management Fee. FMR and its affiliates provide the Fund with investment management related services for which the Fund pays a monthly management fee. The management fee is the sum of an individual fund fee rate that is based on an annual rate of .45% of the Fund's average net assets and an annualized group fee rate that averaged .25% during the period. The group fee rate is based upon the average net assets of all the mutual funds advised by FMR, including any mutual funds previously advised by FMR that are currently advised by Fidelity SelectCo, LLC, an affiliate of FMR. The group fee rate decreases as assets under management increase and increases as assets under management decrease. For the reporting period, the total annual management fee rate was .70% of the Fund's average net assets.
Transfer Agent Fees. Fidelity Investments Institutional Operations Company, Inc. (FIIOC), an affiliate of FMR, is the Fund's transfer, dividend disbursing and shareholder servicing agent. FIIOC receives account fees and asset-based fees that vary according to account size and type of account. FIIOC pays for typesetting, printing and mailing of shareholder reports, except proxy statements. For the period, the transfer agent fees were equivalent to an annual rate of .21% of average net assets.
Annual Report
5. Fees and Other Transactions with Affiliates - continued
Accounting and Security Lending Fees. Fidelity Service Company, Inc. (FSC), an affiliate of FMR, maintains the Fund's accounting records. The accounting fee is based on the level of average net assets for each month. Under a separate contract, FSC administers the security lending program. The security lending fee is based on the number and duration of lending transactions.
Brokerage Commissions. The Fund placed a portion of its portfolio transactions with brokerage firms which are affiliates of the investment adviser. Brokerage commissions are included in net realized gain (loss) and change in net unrealized appreciation (depreciation) in the Statement of Operations. The commissions paid to these affiliated firms were $290 for the period.
6. Committed Line of Credit.
The Fund participates with other funds managed by FMR or an affiliate in a $4.25 billion credit facility (the "line of credit") to be utilized for temporary or emergency purposes to fund shareholder redemptions or for other short-term liquidity purposes. The Fund has agreed to pay commitment fees on its pro-rata portion of the line of credit, which amounted to $39 and is reflected in Miscellaneous expenses on the Statement of Operations. During the period, there were no borrowings on this line of credit.
7. Security Lending.
The Fund lends portfolio securities through a lending agent from time to time in order to earn additional income. For equity securities, a lending agent is used and may loan securities to certain qualified borrowers, including Fidelity Capital Markets (FCM), a broker-dealer affiliated with the Fund. On the settlement date of the loan, the Fund receives collateral (in the form of U.S. Treasury obligations, letters of credit and/or cash) against the loaned securities and maintains collateral in an amount not less than 100% of the market value of the loaned securities during the period of the loan. The market value of the loaned securities is determined at the close of business of the Fund and any additional required collateral is delivered to the Fund on the next business day. If the borrower defaults on its obligation to return the securities loaned because of insolvency or other reasons, the Fund may apply collateral received from the borrower against the obligation. The Fund may experience delays and costs in recovering the securities loaned. Any cash collateral received is invested in the Fidelity Securities Lending Cash Central Fund. At period end, there were no security loans outstanding. Security lending income represents the income earned on investing cash collateral, less rebates paid to borrowers, plus any premium payments received for lending certain types of securities. Security lending income is presented in the Statement of Operations as a component of income from Fidelity Central Funds. Total security lending income during the period amounted to $8,819. During the period, there were no securities loaned to FCM.
Annual Report
Notes to Financial Statements - continued
8. Expense Reductions.
FMR contractually agreed to reimburse the Fund to the extent annual operating expenses exceeded 1.20% of average net assets. This reimbursement will remain in place through December 31, 2014. Some expenses, for example interest expense, including commitment fees, are excluded from this reimbursement. During the period this reimbursement reduced the Fund's expenses by $25,594.
Commissions paid to certain brokers with whom FMR, or its affiliates, places trades on behalf of the Fund include an amount to the Fund in addition to trade execution, which may be rebated back to the Fund to offset certain expenses. This amount totaled $4,580 for the period.
In addition, through arrangements with the Fund's custodian, credits realized as a result of uninvested cash balances were used to reduce the Fund's expenses. During the period, these credits reduced the Fund's custody expense by $9.
9. Other.
The Fund's organizational documents provide former and current trustees and officers with a limited indemnification against liabilities arising in connection with the performance of their duties to the Fund. In the normal course of business, the Fund may also enter into contracts that provide general indemnifications. The Fund's maximum exposure under these arrangements is unknown as this would be dependent on future claims that may be made against the Fund. The risk of material loss from such claims is considered remote.
Annual Report
To the Trustees of Fidelity Investment Trust and Shareholders of Fidelity Global Equity Income Fund:
We have audited the accompanying statement of assets and liabilities of Fidelity Global Equity Income Fund (the Fund), a fund of Fidelity Investment Trust, including the schedule of investments, as of October 31, 2013, and the related statement of operations for the year then ended, and the statement of changes in net assets and the financial highlights for the year ended October 31, 2013 and for the period from May 2, 2012 (commencement of operations) to October 31, 2012. These financial statements and financial highlights are the responsibility of the Fund's management. Our responsibility is to express an opinion on these financial statements and financial highlights based on our audits.
We conducted our audits in accordance with the standards of the Public Company Accounting Oversight Board (United States). Those standards require that we plan and perform the audit to obtain reasonable assurance about whether the financial statements and financial highlights are free of material misstatement. The Fund is not required to have, nor were we engaged to perform, an audit of its internal control over financial reporting. Our audits included consideration of internal control over financial reporting as a basis for designing audit procedures that are appropriate in the circumstances, but not for the purpose of expressing an opinion on the effectiveness of the Fund's internal control over financial reporting. Accordingly, we express no such opinion. An audit also includes examining, on a test basis, evidence supporting the amounts and disclosures in the financial statements, assessing the accounting principles used and significant estimates made by management, as well as evaluating the overall financial statement presentation. Our procedures included confirmation of securities owned as of October 31, 2013, by correspondence with the custodians and brokers; where replies were not received from brokers, we performed other auditing procedures. We believe that our audits provide a reasonable basis for our opinion.
In our opinion, the financial statements and financial highlights referred to above present fairly, in all material respects, the financial position of Fidelity Global Equity Income Fund as of October 31, 2013, the results of its operations for the year then ended, and the changes in its net assets and the financial highlights for the year ended October 31, 2013 and for the period from May 2, 2012 (commencement of operations) to October 31, 2012, in conformity with accounting principles generally accepted in the United States of America.
DELOITTE & TOUCHE LLP
Boston, Massachusetts
December 12, 2013
Annual Report
The Trustees, Member of the Advisory Board, and executive officers of the trust and fund, as applicable, are listed below. The Board of Trustees governs the fund and is responsible for protecting the interests of shareholders. The Trustees are experienced executives who meet periodically throughout the year to oversee the fund's activities, review contractual arrangements with companies that provide services to the fund, oversee management of the risks associated with such activities and contractual arrangements, and review the fund's performance. Except for James C. Curvey, Ned C. Lautenbach, Ronald P. O'Hanley, and William S. Stavropoulos, each of the Trustees oversees 171 funds. Mr. Curvey oversees 394 funds. Mr. Lautenbach, Mr. O'Hanley, and Mr. Stavropoulos each oversees 245 funds.
The Trustees hold office without limit in time except that (a) any Trustee may resign; (b) any Trustee may be removed by written instrument, signed by at least two-thirds of the number of Trustees prior to such removal; (c) any Trustee who requests to be retired or who has become incapacitated by illness or injury may be retired by written instrument signed by a majority of the other Trustees; and (d) any Trustee may be removed at any special meeting of shareholders by a two-thirds vote of the outstanding voting securities of the trust. Each Trustee who is not an interested person of the trust and the fund (as defined in the 1940 Act) (Independent Trustee), shall retire not later than the last day of the calendar year in which his or her 75th birthday occurs. The Independent Trustees may waive this mandatory retirement age policy with respect to individual Trustees. The executive officers and Advisory Board Member hold office without limit in time, except that any officer and Advisory Board Member may resign or may be removed by a vote of a majority of the Trustees at any regular meeting or any special meeting of the Trustees. Except as indicated, each individual has held the office shown or other offices in the same company for the past five years.
Experience, Skills, Attributes, and Qualifications of the Fund's Trustees. The Governance and Nominating Committee has adopted a statement of policy that describes the experience, qualifications, attributes, and skills that are necessary and desirable for potential Independent Trustee candidates (Statement of Policy). The Board believes that each Trustee satisfied at the time he or she was initially elected or appointed a Trustee, and continues to satisfy, the standards contemplated by the Statement of Policy. The Governance and Nominating Committee also engages professional search firms to help identify potential Independent Trustee candidates who have the experience, qualifications, attributes, and skills consistent with the Statement of Policy. From time to time, additional criteria based on the composition and skills of the current Independent Trustees, as well as experience or skills that may be appropriate in light of future changes to board composition, business conditions, and regulatory or other developments, have also been considered by the professional search firms and the Governance and Nominating Committee. In addition, the Board takes into account the Trustees' commitment and participation in Board and committee meetings, as well as their leadership of standing and ad hoc committees throughout their tenure.
Annual Report
Trustees and Officers - continued
In determining that a particular Trustee was and continues to be qualified to serve as a Trustee, the Board has considered a variety of criteria, none of which, in isolation, was controlling. The Board believes that, collectively, the Trustees have balanced and diverse experience, qualifications, attributes, and skills, which allow the Board to operate effectively in governing the fund and protecting the interests of shareholders. Information about the specific experience, skills, attributes, and qualifications of each Trustee, which in each case led to the Board's conclusion that the Trustee should serve (or continue to serve) as a trustee of the fund, is provided below.
Board Structure and Oversight Function. James C. Curvey is an interested person (as defined in the 1940 Act) and currently serves as Chairman. The Trustees have determined that an interested Chairman is appropriate and benefits shareholders because an interested Chairman has a personal and professional stake in the quality and continuity of services provided to the fund. Independent Trustees exercise their informed business judgment to appoint an individual of their choosing to serve as Chairman, regardless of whether the Trustee happens to be independent or a member of management. The Independent Trustees have determined that they can act independently and effectively without having an Independent Trustee serve as Chairman and that a key structural component for assuring that they are in a position to do so is for the Independent Trustees to constitute a substantial majority for the Board. The Independent Trustees also regularly meet in executive session. Ned C. Lautenbach serves as Chairman of the Independent Trustees and as such (i) acts as a liaison between the Independent Trustees and management with respect to matters important to the Independent Trustees and (ii) with management prepares agendas for Board meetings.
Fidelity funds are overseen by different Boards of Trustees. The fund's Board oversees Fidelity's equity and high income funds and another Board oversees Fidelity's investment-grade bond, money market, and asset allocation funds. The asset allocation funds may invest in Fidelity funds overseen by the fund's Board. The use of separate Boards, each with its own committee structure, allows the Trustees of each group of Fidelity funds to focus on the unique issues of the funds they oversee, including common research, investment, and operational issues. On occasion, the separate Boards establish joint committees to address issues of overlapping consequences for the Fidelity funds overseen by each Board.
The Trustees operate using a system of committees to facilitate the timely and efficient consideration of all matters of importance to the Trustees, the fund, and fund shareholders and to facilitate compliance with legal and regulatory requirements and oversight of the fund's activities and associated risks. The Board, acting through its committees, has charged FMR and its affiliates with (i) identifying events or circumstances the occurrence of which could have demonstrably adverse effects on the fund's business and/or reputation; (ii) implementing processes and controls to lessen the possibility that such events or circumstances occur or to mitigate the effects of such events or circumstances if they do occur; and (iii) creating and maintaining a system designed to evaluate continuously business and market conditions in order to facilitate the identification and implementation processes described in (i) and (ii) above. Because the day-to-day operations and activities of the fund are carried out by or through FMR, its affiliates and other service providers, the fund's exposure to risks is mitigated but not eliminated by the processes overseen by the Trustees. While each of the Board's committees has responsibility for overseeing different aspects of the fund's activities, oversight is exercised primarily through the Operations, Audit, and Compliance Committees. In addition, the Independent Trustees have worked with FMR to enhance the Board's oversight of investment and financial risks, legal and regulatory risks, technology risks, and operational risks, including the development of additional risk reporting to the Board. For example, a working group comprised of Independent Trustees and FMR has worked and continues to work to review the Fidelity funds' valuation-related activities, reporting and risk management. Appropriate personnel, including but not limited to the fund's Chief Compliance Officer (CCO), FMR's internal auditor, the independent accountants, the fund's Treasurer and portfolio management personnel, make periodic reports to the Board's committees, as appropriate, including an annual review of FMR's risk management program for the Fidelity funds. The responsibilities of each standing committee, including their oversight responsibilities, are described further under "Standing Committees of the Fund's Trustees."
Annual Report
The fund's Statement of Additional Information (SAI) includes more information about the Trustees. To request a free copy, call Fidelity at 1-800-544-8544.
Interested Trustees*:
Correspondence intended for each Trustee who is an interested person may be sent to Fidelity Investments, 245 Summer Street, Boston, Massachusetts 02210.
Name, Year of Birth; Principal Occupations and Other Relevant Experience+ |
James C. Curvey (1935) |
Year of Election or Appointment: 2007 Trustee Chairman of the Board of Trustees |
| Mr. Curvey also serves as Trustee of other Fidelity funds. Mr. Curvey is a Director of Fidelity Investments Money Management, Inc. (2009-present), Director of Fidelity Research & Analysis Co. (2009-present) and Director of FMR and FMR Co., Inc. (2007-present). Mr. Curvey is also Vice Chairman (2007-present) and Director of FMR LLC. In addition, Mr. Curvey serves as an Overseer for the Boston Symphony Orchestra and a member of the Trustees of Villanova University. Previously, Mr. Curvey was the Vice Chairman (2006-2007) and Director (2000-2007) of FMR Corp. |
Ronald P. O'Hanley (1957) |
Year of Election or Appointment: 2011 Trustee |
| Mr. O'Hanley also serves as Trustee of other Fidelity funds. He is Director of Fidelity SelectCo, LLC (2013-present), FMR Co., Inc. (2010-present), Director of Fidelity Investments Money Management, Inc. (2010-present), Director of Fidelity Research & Analysis Company (2010-present), President of Fidelity Asset Management and Corporate Services and a Member of Fidelity's Executive Committee (2010-present). Previously, Mr. O'Hanley served as President and Chief Executive Officer of BNY Mellon Asset Management (2007-2010). Mr. O'Hanley also served as Vice Chairman of Bank New York Mellon Corp. and a member of that firm's Executive Committee. Prior to the 2007 merger of The Bank of New York and Mellon Financial Corporation, he was Vice Chairman of Mellon Financial Corporation and President and Chief Executive Officer of Mellon Asset Management. He joined Mellon in February 1997. Mr. O'Hanley currently serves as Chairman of the Boston Public Library Foundation Board of Directors and sits on the Board of Directors of Beth Israel Deaconess Medical Center, the Board of Trustees of the Marine Biological Laboratory and the Advisory Board of the Maxwell School of Citizenship and Public Administration at Syracuse University. Mr. O'Hanley also chairs the Council on Asset Management for the Financial Services Roundtable and is a member of the Board of Directors of Institutional Investor's U.S. Institute. |
* Trustees have been determined to be "Interested Trustees" by virtue of, among other things, their affiliation with the trust or various entities under common control with FMR.
+ The information above includes each Trustee's principal occupation during the last five years and other information relating to the experience, attributes, and skills relevant to each Trustee's qualifications to serve as a Trustee, which led to the conclusion that each Trustee should serve as a Trustee for the fund.
Annual Report
Independent Trustees:
Correspondence intended for each Independent Trustee (that is, the Trustees other than the Interested Trustees) may be sent to Fidelity Investments, P.O. Box 55235, Boston, Massachusetts 02205-5235.
Name, Year of Birth; Principal Occupations and Other Relevant Experience+ |
Dennis J. Dirks (1948) |
Year of Election or Appointment: 2005 Trustee |
| Mr. Dirks also serves as Trustee of other Fidelity funds. Prior to his retirement in May 2003, Mr. Dirks was Chief Operating Officer and a member of the Board of The Depository Trust & Clearing Corporation (DTCC). He also served as President, Chief Operating Officer, and Board member of The Depository Trust Company (DTC) and President and Board member of the National Securities Clearing Corporation (NSCC). In addition, Mr. Dirks served as Chief Executive Officer and Board member of the Government Securities Clearing Corporation, Chief Executive Officer and Board member of the Mortgage-Backed Securities Clearing Corporation, as a Trustee and a member of the Finance Committee of Manhattan College (2005-2008), and as a Trustee and a member of the Finance Committee of AHRC of Nassau County (2006-2008). Mr. Dirks is a member of the Independent Directors Council (IDC) Governing Council (2010-present) and Board of Directors for The Brookville Center for Children's Services, Inc. (2009-present). |
Alan J. Lacy (1953) |
Year of Election or Appointment: 2008 Trustee |
| Mr. Lacy also serves as Trustee of other Fidelity funds. Mr. Lacy serves as Senior Adviser (2007-present) of Oak Hill Capital Partners, L.P. (private equity). Mr. Lacy also served as Chief Executive Officer (2000-2005) and Vice Chairman (2005-2006) of Sears Holdings Corporation and Sears, Roebuck and Co. (retail). In addition, Mr. Lacy serves as a member of the Board of Directors of Dave & Buster's Entertainment, Inc. (restaurant and entertainment complexes, 2010-present), Earth Fare, Inc. (retail grocery, 2012-present), The Hillman Companies, Inc. (hardware wholesalers, 2010-present), and Bristol-Myers Squibb Company (global pharmaceuticals, 2008-present). Mr. Lacy is a member of the Board of Trustees of The National Parks Conservation Association (2006-present). Previously, Mr. Lacy served as Chairman of the Board of Trustees of the National Parks Conservation Association (2008-2011) and as a member of the Board of Directors for the Western Union Company (global money transfer, 2006-2011). |
Ned C. Lautenbach (1944) |
Year of Election or Appointment: 2000 Trustee Chairman of the Independent Trustees |
| Mr. Lautenbach also serves as Trustee of other Fidelity funds. Mr. Lautenbach currently serves as the Lead Director of the Eaton Corporation Board of Directors (diversified industrial, 1997-present). Mr. Lautenbach is Chairman of the Board of Directors of the Philharmonic Center for the Arts in Naples, Florida (2012-present) and a member of the Council on Foreign Relations (1994-present). Previously, Mr. Lautenbach was a Partner/Advisory Partner at Clayton, Dubilier & Rice, LLC (private equity investment, 1998-2010), as well as a Director of Sony Corporation (2006-2007). |
Joseph Mauriello (1944) |
Year of Election or Appointment: 2008 Trustee |
| Mr. Mauriello also serves as Trustee of other Fidelity funds. Prior to his retirement in January 2006, Mr. Mauriello served in numerous senior management positions including Deputy Chairman and Chief Operating Officer (2004-2005), and Vice Chairman of Financial Services (2002-
2004) of KPMG LLP US (professional services, 1965-2005). Mr. Mauriello currently serves as a member of the Board of Directors of XL Group plc. (global insurance and re-insurance, 2006-present). Previously, Mr. Mauriello served as a Director of the Hamilton Funds of the Bank of New York (2006-2007) and of Arcadia Resources Inc. (health care services and products, 2007-2012). |
Robert W. Selander (1950) |
Year of Election or Appointment: 2011 Trustee |
| Mr. Selander also serves as Trustee of other Fidelity funds. Previously, Mr. Selander served as a Member of the Advisory Board of other Fidelity funds (2011), and Executive Vice Chairman (2010), Chief Executive Officer (2009-2010), and President and Chief Executive Officer (1997-2009) of Mastercard, Inc. |
Cornelia M. Small (1944) |
Year of Election or Appointment: 2005 Trustee |
| Ms. Small also serves as Trustee of other Fidelity funds. Ms. Small is a member of the Board of Directors (2009-present) and Chair of the Investment Committee (2010-present) of the Teagle Foundation. Ms. Small also serves on the Investment Committee of the Berkshire Taconic Community Foundation (2008-present). Previously, Ms. Small served as Chairperson (2002-2008) and a member of the Investment Committee and Chairperson (2008-2012) and a member of the Board of Trustees of Smith College. In addition, Ms. Small served as Chief Investment Officer, Director of Global Equity Investments, and a member of the Board of Directors of Scudder, Stevens & Clark and Scudder Kemper Investments. |
William S. Stavropoulos (1939) |
Year of Election or Appointment: 2001 Trustee Vice Chairman of the Independent Trustees |
| Mr. Stavropoulos also serves as Trustee of other Fidelity funds. Mr. Stavropoulos serves as President and Founder of the Michigan Baseball Foundation, the Great Lakes Loons (2007-present). Mr. Stavropoulos is Chairman Emeritus of the Board of Directors of The Dow Chemical Company, where he previously served in numerous senior management positions, including President, CEO (1995-2000; 2002-2004), Chairman of the Executive Committee (2000-2006), and as a member of the Board of Directors (1990-2006). Currently, Mr. Stavropoulos is Chairman of the Board of Directors of Univar Inc. (global distributor of commodity and specialty chemicals), a Director of Teradata Corporation (data warehousing and technology solutions), and Maersk Inc. (industrial conglomerate), and a member of the Advisory Board for Metalmark Capital LLC (private equity investment, 2005-present). Mr. Stavropoulos is an operating advisor to Clayton, Dubilier & Rice, LLC (private equity investment). In addition, Mr. Stavropoulos is a member of the University of Notre Dame Advisory Council for the College of Science, a Trustee of the Rollin L. Gerstacker Foundation, and a Director of the Naples Philharmonic Center for the Arts. Previously, Mr. Stavropoulos served as a Director of Chemical Financial Corporation (bank holding company, 1993-2012) and Tyco International, Ltd. (multinational manufacturing and services, 2007-2012). |
David M. Thomas (1949) |
Year of Election or Appointment: 2008 Trustee |
| Mr. Thomas also serves as Trustee of other Fidelity funds. Mr. Thomas serves as Non-Executive Chairman of the Board of Directors of Fortune Brands Home and Security (home and security products, 2011-present), and as a member of the Board of Directors of Interpublic Group of Companies, Inc. (marketing communication, 2004-present). Previously, Mr. Thomas served as Executive Chairman (2005-2006) and Chairman and Chief Executive Officer (2000-2005) of IMS Health, Inc. (pharmaceutical and healthcare information solutions), and a Director of Fortune Brands, Inc. (consumer products, 2000-2011). |
+ The information above includes each Trustee's principal occupation during the last five years and other information relating to the experience, attributes, and skills relevant to each Trustee's qualifications to serve as a Trustee, which led to the conclusion that each Trustee should serve as a Trustee for the fund.
Advisory Board Member and Executive Officers:
Correspondence intended for each executive officer and Peter S. Lynch may be sent to Fidelity Investments, 245 Summer Street, Boston, Massachusetts 02210. Executive officers appear below in alphabetical order.
Name, Year of Birth; Principal Occupation |
Peter S. Lynch (1944) |
Year of Election or Appointment: 2003 Member of the Advisory Board |
| Mr. Lynch also serves as Member of the Advisory Board of other Fidelity funds. Mr. Lynch is Vice Chairman and a Director of FMR and FMR Co., Inc. In addition, Mr. Lynch serves as a Trustee of Boston College and as the Chairman of the Inner-City Scholarship Fund. Previously, Mr. Lynch served on the Special Olympics International Board of Directors (1997-2006). |
Elizabeth Paige Baumann (1968) |
Year of Election or Appointment: 2012 Anti-Money Laundering (AML) Officer |
| Ms. Baumann also serves as AML Officer of other funds. She is Chief AML Officer of FMR LLC (2012-present) and is an employee of Fidelity Investments. Previously, Ms. Baumann served as Vice President and Deputy Anti-Money Laundering Officer (2007-2012). |
William C. Coffey (1969) |
Year of Election or Appointment: 2009 Assistant Secretary |
| Mr. Coffey also serves as Assistant Secretary of other funds. He is Senior Vice President and Deputy General Counsel of FMR LLC (2010-
present), and is an employee of Fidelity Investments. Previously, Mr. Coffey served as Vice President and Associate General Counsel of FMR LLC (2005-2009). |
Jonathan Davis (1968) |
Year of Election or Appointment: 2010 Assistant Treasurer |
| Mr. Davis also serves as Assistant Treasurer of other funds. Mr. Davis is an employee of Fidelity Investments. Previously, Mr. Davis served as Vice President and Associate General Counsel of FMR LLC (2003-2010). |
Adrien E. Deberghes (1967) |
Year of Election or Appointment: 2008 Deputy Treasurer |
| Mr. Deberghes also serves as an officer of other funds. He is an employee of Fidelity Investments (2008-present). Prior to joining Fidelity Investments, Mr. Deberghes was Senior Vice President of Mutual Fund Administration at State Street Corporation (2007-2008), Senior Director of Mutual Fund Administration at Investors Bank & Trust (2005-2007), and Director of Finance for Dunkin' Brands (2000-2005). |
Stephanie J. Dorsey (1969) |
Year of Election or Appointment: 2010 Assistant Treasurer |
| Ms. Dorsey also serves as an officer of other funds. She is an employee of Fidelity Investments (2008-present) and has served in other fund officer roles. Prior to joining Fidelity Investments, Ms. Dorsey served as Treasurer (2004-2008) of the JPMorgan Mutual Funds and Vice President (2004-2008) of JPMorgan Chase Bank. |
Scott C. Goebel (1968) |
Year of Election or Appointment: 2008 Secretary and Chief Legal Officer (CLO) |
| Mr. Goebel serves as Secretary and CLO of other funds. Mr. Goebel also serves as Secretary of Fidelity Investments Money Management, Inc. (FIMM) (2010-present) and Fidelity Research and Analysis Company (FRAC) (2010-present); General Counsel, Secretary, and Senior Vice President of FMR (2008-present) and FMR Co., Inc. (2008-present); Chief Legal Officer of Fidelity Management & Research (Hong Kong) Limited (2008-present) and Assistant Secretary of Fidelity Management & Research (Japan) Inc. (2008-present), and Fidelity Management & Research (U.K.) Inc. (2008-present). Previously, Mr. Goebel served as Secretary and CLO of other Fidelity funds (2008-2013), Assistant Secretary of FIMM (2008-2010), FRAC (2008-2010), and certain funds (2007-2008); and as Vice President and Secretary of Fidelity Distributors Corporation (FDC) (2005-2007). Mr. Goebel has been employed by FMR LLC or an affiliate since 2001. |
Joseph A. Hanlon (1968) |
Year of Election or Appointment: 2012 Chief Compliance Officer |
| Mr. Hanlon also serves as Chief Compliance Officer of other funds. Mr. Hanlon serves as Compliance Officer of FMR, FMR Co., Inc., Fidelity Investments Money Management, Inc. (FIMM), Fidelity Research and Analysis Company (FRAC), and Fidelity Management & Research (Hong Kong) (2009-present), as Senior Vice President of the Fidelity Asset Management Division (2009-present), and is an employee of Fidelity Investments. Previously, Mr. Hanlon served as Compliance Officer of Fidelity Management & Research (Japan) Inc. (2009-2013), Strategic Advisers, Inc. (2009-2013), and Fidelity Management & Research (U.K.) Inc. (2009-2013). |
Bruce T. Herring (1965) |
Year of Election or Appointment: 2006 Vice President of certain Equity Funds |
| Mr. Herring also serves as Vice President of other funds. He serves as Chief Investment Officer of Fidelity Global Asset Allocation (GAA) (2013-present), Chief Investment Officer and Director of Fidelity Management & Research (U.K.) Inc. (2010-present), Group Chief Investment Officer of FMR, and President of Fidelity Research & Analysis Company (2010-present). Previously, Mr. Herring served as Vice President (2005-
2006) and Senior Vice President (2006-2007) of Fidelity Management & Research Company, Vice President of FMR Co., Inc. (2001-2007), and as a portfolio manager for Fidelity U.S. Equity Funds. |
Brian B. Hogan (1964) |
Year of Election or Appointment: 2009 Vice President |
| Mr. Hogan also serves as Vice President of other funds. Mr. Hogan serves as President of FMR's Equity Division (2009-present). Previously, Mr. Hogan served as Senior Vice President, Equity Research of FMR (2006-2009) and as a portfolio manager. |
Chris Maher (1972) |
Year of Election or Appointment: 2013 Assistant Treasurer |
| Mr. Maher serves as Assistant Treasurer of other funds. Mr. Maher is Vice President of Valuation Oversight and is an employee of Fidelity Investments. Previously, Mr. Maher served as Vice President of Asset Management Compliance (2013), Vice President of FMR's Program Management Group (2010-2013), and Vice President of Valuation Oversight (2008-2010). |
Christine Reynolds (1958) |
Year of Election or Appointment: 2008 Chief Financial Officer |
| Ms. Reynolds also serves as Chief Financial Officer of other funds. Ms. Reynolds became President of Fidelity Pricing and Cash Management Services (FPCMS) in August 2008. Ms. Reynolds served as Chief Operating Officer of FPCMS (2007-2008). Previously, Ms. Reynolds served as President, Treasurer, and Anti-Money Laundering officer of the Fidelity funds (2004-2007). |
Kenneth B. Robins (1969) |
Year of Election or Appointment: 2008 President and Treasurer |
| Mr. Robins also serves as an officer of other funds. Mr. Robins serves as Executive Vice President of Fidelity Investments Money Management, Inc. (FIMM) (2013-present) and is an employee of Fidelity Investments (2004-present). Previously, Mr. Robins served in other fund officer roles. |
Gary W. Ryan (1958) |
Year of Election or Appointment: 2005 Assistant Treasurer |
| Mr. Ryan also serves as Assistant Treasurer of other funds. Mr. Ryan is an employee of Fidelity Investments and has served in other fund officer roles. Previously, Mr. Ryan served as Vice President of Fund Reporting in Fidelity Pricing and Cash Management Services (FPCMS) (1999-2005). |
Stephen Sadoski (1971) |
Year of Election or Appointment: 2012 Deputy Treasurer |
| Mr. Sadoski also serves as Deputy Treasurer of other funds. He is an employee of Fidelity Investments (2012-present) and has served in another fund officer role. Prior to joining Fidelity Investments, Mr. Sadoski served as an assistant chief accountant in the Division of Investment Management of the Securities and Exchange Commission (SEC) (2009-2012) and as a senior manager at Deloitte & Touche LLP (1997-2009). |
Stacie M. Smith (1974) |
Year of Election or Appointment: 2013 Deputy Treasurer |
| Ms. Smith also serves as an officer of other funds. She is an employee of Fidelity Investments (2009-present) and has served in other fund officer roles. Prior to joining Fidelity Investments, Ms. Smith served as Senior Audit Manager of Ernst & Young LLP (1996-2009). |
Renee Stagnone (1975) |
Year of Election or Appointment: 2013 Deputy Treasurer |
| Ms. Stagnone also serves as Deputy Treasurer of other funds. Ms. Stagnone is an employee of Fidelity Investments. |
Joseph F. Zambello (1957) |
Year of Election or Appointment: 2011 Deputy Treasurer |
| Mr. Zambello also serves as Deputy Treasurer of other funds. Mr. Zambello is an employee of Fidelity Investments. Previously, Mr. Zambello served as Vice President of FMR's Program Management Group (2009-2011) and Vice President of the Transfer Agent Oversight Group (2005-2009). |
Annual Report
The Board of Trustees of Fidelity Global Equity Income Fund voted to pay on December 09, 2013, to shareholders of record at the opening of business on December 06, 2013, a distribution of $0.282 per share derived from capital gains realized from sales of portfolio securities and a dividend of $0.023 per share from net investment income.
The fund hereby designates as a capital gain dividend with respect to the taxable year ended October 31, 2013, $466,788, or, if subsequently determined to be different, the net capital gain of such year.
A total of 0.07% of the dividends distributed during the fiscal year was derived from interest on U.S. Government securities which is generally exempt from state income tax.
A percentage of the dividends distributed during the fiscal year for the fund qualifies for the dividends-received deduction for corporate shareholders:
| Month | Percentage |
| 12/07/2012 | 40% |
| 12/27/2012 | 68% |
| 04/05/2013 | 50% |
| 07/05/2013 | 50% |
| 10/04/2013 | 50% |
A percentage of the dividends distributed during the fiscal year for the fund may be taken into account as a dividend for purposes of the maximum rate under section 1(h)(11) of the Internal Revenue Code.
| Month | Percentage |
| 12/07/2012 | 79% |
| 12/27/2012 | 100% |
| 04/05/2013 | 100% |
| 07/05/2013 | 100% |
| 10/04/2013 | 100% |
The amounts per share which represent income derived from sources within, and taxes paid to, foreign countries or possessions of the United States are as follows:
| Pay Date | Income | Taxes |
| 12/10/2012 | 0.028 | 0.0027 |
| 12/28/2012 | 0.002 | 0.0000 |
| 04/08/2013 | 0.012 | 0.0015 |
| 07/08/2013 | 0.024 | 0.0029 |
| 10/07/2013 | 0.007 | 0.0009 |
The fund will notify shareholders in January 2014 of amounts for use in preparing 2013 income tax returns.
Annual Report
Board Approval of Investment Advisory Contracts and Management Fees
Fidelity Global Equity Income Fund
Each year, the Board of Trustees, including the Independent Trustees (together, the Board), votes on the renewal of the management contract and sub-advisory agreements (together, the Advisory Contracts) for the fund. The Board, assisted by the advice of fund counsel and Independent Trustees' counsel, requests and considers a broad range of information relevant to the renewal of the Advisory Contracts throughout the year.
The Board meets regularly and, at each of its meetings, covers an extensive agenda of topics and materials and considers factors that are relevant to its annual consideration of the renewal of the fund's Advisory Contracts, including the services and support provided to the fund and its shareholders. The Board has established various standing committees, each composed of and chaired by Independent Trustees with varying backgrounds, to which the Board has assigned specific subject matter responsibilities in order to enhance effective decision-making by the Board. The Board, acting directly and through its Committees, requests and receives information concerning the annual consideration of the renewal of the fund's Advisory Contracts. The Board also meets as needed to consider matters specifically related to the Board's annual consideration of the renewal of Advisory Contracts. Members of the Board may also meet with trustees of other Fidelity funds through ad hoc joint committees to discuss certain matters relevant to the Fidelity funds.
At its July 2013 meeting, the Board, including the Independent Trustees, unanimously determined to renew the fund's Advisory Contracts. In reaching its determination, the Board considered all factors it believed relevant, including (i) the nature, extent, and quality of the services to be provided to the fund and its shareholders (including the investment performance of the fund); (ii) the competitiveness of the fund's management fee and total expense ratio relative to peer funds; (iii) the total costs of the services to be provided by and the profits to be realized by Fidelity from its relationship with the fund; (iv) the extent to which economies of scale exist and would be realized as the fund grows; and (v) whether fee levels reflect these economies of scale, if any, for the benefit of fund shareholders.
In considering whether to renew the Advisory Contracts for the fund, the Board reached a determination, with the assistance of fund counsel and Independent Trustees' counsel and through the exercise of its business judgment, that the renewal of the Advisory Contracts was in the best interests of the fund and its shareholders and that the compensation payable under the Advisory Contracts was fair and reasonable. The Board's decision to renew the Advisory Contracts was not based on any single factor, but rather was based on a comprehensive consideration of all the information provided to the Board at its meetings throughout the year. The Board, in reaching its determination to renew the Advisory Contracts, was aware that shareholders in the fund have a broad range of investment choices available to them, including a wide choice among mutual funds offered by Fidelity's competitors, and that the fund's shareholders, who have the opportunity to review and weigh the disclosure provided by the fund in its prospectus and other public disclosures, have chosen to invest in this fund, which is part of the Fidelity family of funds.
Annual Report
Board Approval of Investment Advisory Contracts and
Management Fees - continued
Nature, Extent, and Quality of Services Provided. The Board considered the staffing within the investment adviser, Fidelity Management & Research Company (FMR), and the sub-advisers (together, the Investment Advisers) as it relates to the fund, including the backgrounds of the fund's investment personnel, and also considered the fund's investment objective, strategies, and related investment philosophy. The Independent Trustees also had discussions with senior management of Fidelity's investment operations and investment groups. The Board considered the structure of the portfolio manager compensation program and whether this structure provides appropriate incentives to act in the best interests of the fund.
Resources Dedicated to Investment Management and Support Services. The Board and the Fund Oversight and Research Committees reviewed the general qualifications and capabilities of the Investment Advisers' investment staff, including its size, education, experience, and resources, as well as the Investment Advisers' approach to recruiting, training, managing, and compensating investment personnel. The Board noted that FMR has continued to increase the resources devoted to non-U.S. offices, including expansion of Fidelity's global investment organization. The Board also noted that Fidelity's analysts have extensive resources, tools and capabilities that allow them to conduct sophisticated quantitative and fundamental analysis, as well as credit analysis of issuers, counterparties and guarantors. Further, the Board believes that Fidelity's investment professionals have sufficient access to global information and data so as to provide competitive investment results over time, and that those professionals also have access to sophisticated tools that permit them to assess portfolio construction and risk and performance attribution characteristics continuously, as well as to transmit new information and research conclusions rapidly around the world. Additionally, in its deliberations, the Board considered the Investment Advisers' trading and risk management capabilities and resources, which are an integral part of the investment management process.
Shareholder and Administrative Services. The Board considered (i) the nature, extent, quality, and cost of advisory, administrative, and shareholder services performed by the Investment Advisers and their affiliates under the Advisory Contracts and under separate agreements covering transfer agency, pricing and bookkeeping, and securities lending services for the fund; (ii) the nature and extent of the supervision of third party service providers, principally custodians and subcustodians; and (iii) the resources devoted to, and the record of compliance with, the fund's compliance policies and procedures. The Board also reviewed the allocation of fund brokerage, including allocations to brokers affiliated with the Investment Advisers, the use of brokerage commissions to pay fund expenses, and the use of "soft" commission dollars to pay for research services.
The Board noted that the growth of fund assets over time across the complex allows Fidelity to reinvest in the development of services designed to enhance the value or convenience of the Fidelity funds as investment vehicles. These services include 24-hour access to account information and market information through telephone representatives and over the Internet, investor education materials and asset allocation tools, and the expanded availability of Fidelity Investor Centers.
Annual Report
Investment in a Large Fund Family. The Board considered the benefits to shareholders of investing in a Fidelity fund, including the benefits of investing in a fund that is part of a large family of funds offering a variety of investment disciplines and providing a large variety of mutual fund investor services. The Board noted that Fidelity had taken, or had made recommendations that resulted in the Fidelity funds taking, a number of actions over the previous year that benefited particular funds, including (i) continuing to dedicate additional resources to investment research and to the support of the senior management team that oversees asset management; (ii) persisting in efforts to enhance Fidelity's global research capabilities; (iii) launching new funds and making other enhancements to meet client needs for global and income-oriented solutions; (iv) continuing to launch dedicated lower cost underlying funds to meet portfolio construction needs related to expanding underlying fund options for Fidelity funds of funds, specifically for the Freedom Fund product lines; (v) rationalizing product lines and gaining increased efficiencies through the mergers of several funds into other funds; (vi) strengthening Fidelity's index fund offerings by reducing investment minimums and adopting or lowering existing expense caps for certain funds and classes; (vii) enhancing Global Asset Allocation product offerings by launching new funds and strategies, including "open architecture" target date funds that utilize affiliated and unaffiliated sub-advisers; (viii) modifying the eligibility criteria for Institutional Class shares of Advisor funds to increase their marketability to a portion of the defined contribution plan market; (ix) creating a new low-cost retirement share class for certain Advisor funds to appeal to large retirement plans; (x) transitioning the management of certain Fidelity commodity funds to Geode Capital Management LLC, a registered commodity pool operator, while retaining administrative responsibilities for the funds; (xi) reorganizing a number of funds; and (xii) taking steps toward establishing a new Fidelity adviser to manage sector-based funds and products.
Investment Performance. The Board considered whether the fund has operated in accordance with its investment objective, as well as its record of compliance with its investment restrictions. As the fund recently commenced operations, the Board did not believe that it was appropriate to assign significant weight to its limited investment performance.
Based on its review, the Board concluded that the nature, extent, and quality of services provided to the fund under the Advisory Contracts should benefit the fund's shareholders.
Competitiveness of Management Fee and Total Expense Ratio. The Board considered the fund's management fee and total expense ratio compared to "mapped groups" of competitive funds and classes. Fidelity creates "mapped groups" by combining similar Lipper investment objective categories that have comparable management fee characteristics. Combining Lipper investment objective categories aids the Board's management fee and total expense ratio comparisons by broadening the competitive group used for comparison and by reducing the number of universes to which various Fidelity funds are compared.
Annual Report
Board Approval of Investment Advisory Contracts and
Management Fees - continued
Management Fee. The Board considered two proprietary management fee comparisons for the period of the fund's operations shown in the chart below. The group of Lipper funds used by the Board for management fee comparisons is referred to below as the "Total Mapped Group." The Total Mapped Group comparison focuses on a fund's standing in terms of gross management fees before expense reimbursements or caps relative to the total universe of funds with comparable investment mandates, regardless of whether their management fee structures also are comparable. Funds with comparable investment mandates offer exposure to similar types of securities. Funds with comparable management fee structures have similar management fee contractual arrangements (e.g., flat rate charged for advisory services, all-inclusive fee rate, etc.). "TMG %" represents the percentage of funds in the Total Mapped Group that had management fees that were lower than the fund's. For example, a TMG % of 16% means that 84% of the funds in the Total Mapped Group had higher management fees than the fund. The "Asset-Size Peer Group" (ASPG) comparison focuses on a fund's standing relative to a subset of non-Fidelity funds within the Total Mapped Group that are similar in size and management fee structure. The ASPG represents at least 15% of the funds in the Total Mapped Group with comparable asset size and management fee structures, subject to a minimum of 50 funds (or all funds in the Total Mapped Group if fewer than 50).Additional information, such as the ASPG quartile in which the fund's management fee ranked, is also included in the chart and considered by the Board.
Fidelity Global Equity Income Fund
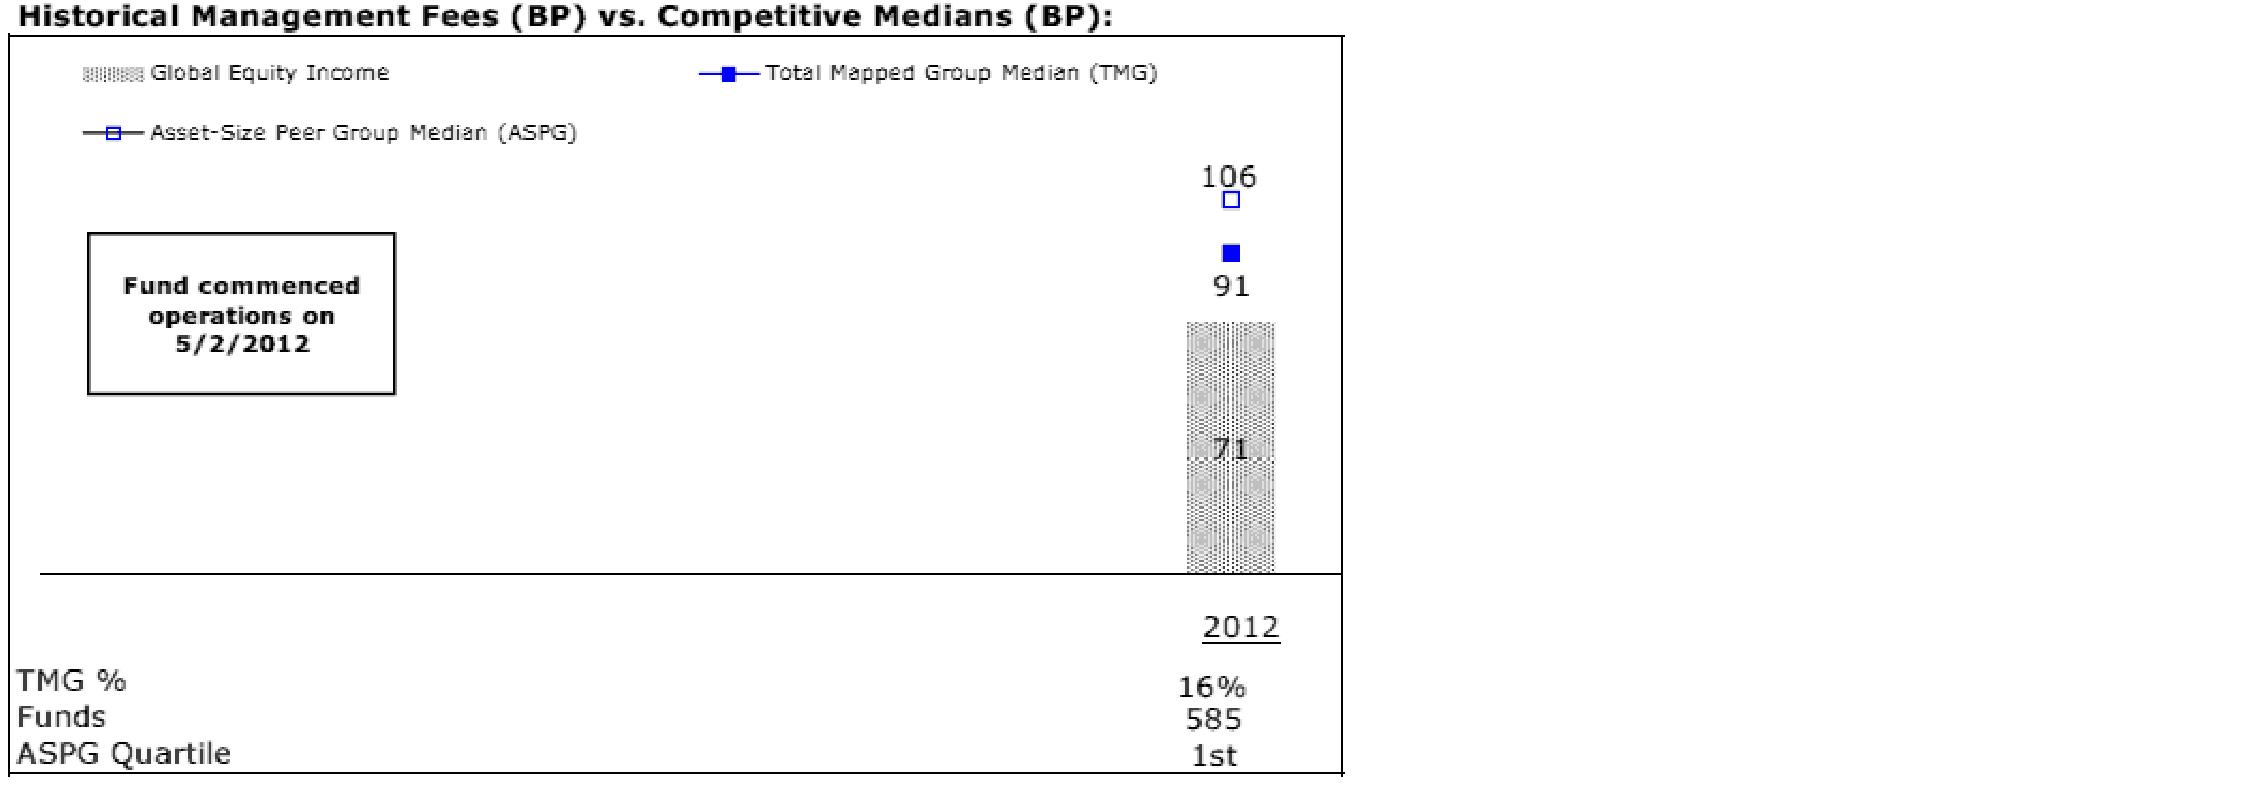
Annual Report
The Board noted that the fund's management fee ranked below the median of its Total Mapped Group and below the median of its ASPG for the period.
Based on its review, the Board concluded that the fund's management fee is fair and reasonable in light of the services that the fund receives and the other factors considered.
Total Expense Ratio. In its review of the fund's total expense ratio, the Board considered the fund's management fee as well as other fund expenses, such as transfer agent fees, pricing and bookkeeping fees, and custodial, legal, and audit fees. The Board also noted the effects of any waivers and reimbursements on fees and expenses. As part of its review, the Board also considered the current total expense ratios of the fund compared to competitive fund median expenses. The fund is compared to those funds and classes in the Total Mapped Group (used by the Board for management fee comparisons) that have a similar sales load structure.
The Board noted that the fund's total expense ratio ranked below its competitive median for the period.
The Board further considered that FMR contractually agreed to reimburse the fund to the extent that total expenses (excluding interest, taxes, certain securities lending costs, brokerage commissions, extraordinary expenses, and acquired fund fees and expenses, if any), as a percentage of average net assets, exceed 1.20% through December 31, 2013.
Fees Charged to Other Fidelity Clients. The Board also considered Fidelity fee structures and other information with respect to clients of FMR and its affiliates, such as other mutual funds advised or subadvised by FMR or its affiliates, pension plan clients, and other institutional clients. The Board noted the findings of the 2013 ad hoc joint committee (created with the board of other Fidelity funds), which reviewed and compared Fidelity's institutional investment advisory business with its business of providing services to the Fidelity funds, including the differences in services provided, fees charged, and costs incurred, as well as competition in their respective marketplaces.
Based on its review of total expense ratios and fees charged to other Fidelity clients, the Board concluded that the fund's total expense ratio was reasonable in light of the services that the fund and its shareholders receive and the other factors considered.
Costs of the Services and Profitability. The Board considered the revenues earned and the expenses incurred by Fidelity in conducting the business of developing, marketing, distributing, managing, administering and servicing the fund and servicing the fund's shareholders. The Board also considered the level of Fidelity's profits in respect of all the Fidelity funds.
On an annual basis, FMR presents to the Board Fidelity's profitability for the fund. Fidelity calculates the profitability for each fund, as well as aggregate profitability for groups of Fidelity funds and all Fidelity funds, using a series of detailed revenue and cost allocation methodologies which originate with the books and records of Fidelity on which Fidelity's audited financial statements are based. The Audit Committee of the Board reviews any significant changes from the prior year's methodologies.
Annual Report
Board Approval of Investment Advisory Contracts and
Management Fees - continued
PricewaterhouseCoopers LLP (PwC), independent registered public accounting firm and auditor to Fidelity and certain Fidelity funds, has been engaged annually by the Board as part of the Board's assessment of Fidelity's profitability analysis. PwC's engagement includes the review and assessment of the methodologies used by Fidelity in determining the revenues and expenses attributable to Fidelity's mutual fund business, and completion of agreed-upon procedures surrounding the mathematical accuracy of fund profitability and its conformity to allocation methodologies. After considering PwC's reports issued under the engagement and information provided by Fidelity, the Board concluded that while other allocation methods may also be reasonable, Fidelity's profitability methodologies are reasonable in all material respects.
The Board also reviewed Fidelity's non-fund businesses and fall-out benefits related to the mutual fund business as well as cases where Fidelity's affiliates may benefit from or be related to the fund's business.
The Board considered the costs of the services provided by and the profits realized by Fidelity in connection with the operation of the fund and was satisfied that the profitability was not excessive in the circumstances.
Economies of Scale. The Board considered whether there have been economies of scale in respect of the management of the Fidelity funds, whether the Fidelity funds (including the fund) have appropriately benefited from any such economies of scale, and whether there is potential for realization of any further economies of scale. The Board considered the extent to which the fund will benefit from economies of scale through increased services to the fund, through waivers or reimbursements, or through fee or expense reductions. The Board also noted that in 2009, it and the board of other Fidelity funds created an ad hoc committee (the Economies of Scale Committee) to analyze whether FMR attains economies of scale in respect of the management and servicing of the Fidelity funds, whether the Fidelity funds have appropriately benefited from such economies of scale, and whether there is potential for realization of any further economies of scale.
The Board recognized that the fund's management contract incorporates a "group fee" structure, which provides for lower group fee rates as total fund assets under FMR's management increase, and for higher group fee rates as total fund assets under FMR's management decrease. FMR calculates the group fee rates based on a tiered asset "breakpoint" schedule that varies based on asset class. The Board considered that the group fee is designed to deliver the benefits of economies of scale to fund shareholders when total Fidelity fund assets increase, even if assets of any particular fund are unchanged or have declined, because some portion of Fidelity's costs are attributable to services provided to all Fidelity funds, and all funds benefit if those costs can be allocated among more assets. The Board concluded that, given the group fee structure, fund shareholders will benefit from lower management fees as assets under FMR's management increase at the fund complex level, regardless of whether Fidelity achieves any such economies of scale.
Annual Report
The Board concluded, taking into account the analysis of the Economies of Scale Committee, that economies of scale, if any, are being appropriately shared between fund shareholders and Fidelity.
Amendment to Description of Group Fee Rate. At its July 2013 meeting, the Board voted to approve an amendment to the fund's management contract to modify the description of the "group fee rate" effective August 1, 2013. The Board noted that under the prior description in the contract, the group fee rate was based on the average net assets of all registered investment companies with which FMR has management contracts. Under the contract's tiered asset breakpoint schedule, the group fee rate is lower as total fund assets under FMR's management increase, and higher as total fund assets under FMR's management decrease. The Board considered that the prior description would have excluded the assets of 64 Fidelity sector funds from the group fee rate calculation once Fidelity SelectCo, LLC, an affiliate of FMR, assumed management responsibilities for those funds. The Board noted that modifying the description of the group fee rate to continue to include the assets of those 64 funds for purposes of determining group fee rate breakpoints would avoid an immediate adverse impact on the group fee rate for any fund.
Additional Information Requested by the Board. In order to develop fully the factual basis for consideration of the Fidelity funds' Advisory Contracts, the Board requested and received additional information on certain topics, including: (i) fund performance trends and Fidelity's long-term strategies for certain funds; (ii) the potential to further rationalize the Fidelity fund lineup with the possibility of achieving savings for the funds and Fidelity; (iii) the methodology with respect to competitive fund data and peer group classifications; (iv) the arrangements with, and performance of, certain sub-advisers on behalf of the Fidelity funds, as well as certain proposed participating affiliate arrangements; (v) the realization of fall-out benefits in certain Fidelity business units; (vi) Fidelity's group fee structures, including the rationale for the individual fee rates of certain categories of funds and the definition of group assets; (vii) trends regarding industry use of performance fee structures and the performance adjustment methodologies applicable to the Fidelity funds; (viii) additional competitive analysis regarding the total expenses for certain classes; and (ix) fund profitability methodology, including Fidelity's cost allocation methodology, and the impact of certain factors on fund profitability results.
Based on its evaluation of all of the conclusions noted above, and after considering all factors it believed relevant, the Board ultimately concluded that the advisory fee structures are fair and reasonable, and that the fund's Advisory Contracts should be renewed.
Annual Report
Investment Adviser
Fidelity Management & Research Company
Boston, MA
Investment Sub-Advisers
FMR Co., Inc.
Fidelity Management & Research
(U.K.) Inc.
Fidelity Management & Research
(Japan) Inc.
Fidelity Management & Research
(Hong Kong) Limited
FIL Investment Advisors (FIA)
FIL Investment Advisors (UK) Limited
(FIA(UK))
FIL Investments (Japan) Limited (FIJ)
General Distributor
Fidelity Distributors Corporation
Smithfield, RI
Transfer and Service Agents
Fidelity Investments Institutional
Operations Company, Inc.
Boston, MA
Fidelity Service Company, Inc.
Boston, MA
Custodian
Citibank, N.A.
New York, NY
The Fidelity Telephone Connection
Mutual Fund 24-Hour Service
Exchanges/Redemptions
and Account Assistance 1-800-544-6666
Product Information 1-800-544-6666
Retirement Accounts 1-800-544-4774
(8 a.m. - 9 p.m.)
TDD Service 1-800-544-0118
for the deaf and hearing impaired
(9 a.m. - 9 p.m. Eastern time)
Fidelity Automated Service
Telephone (FAST®)
1-800-544-5555
Automated line for quickest service
(Fidelity Investment logo)(registered trademark)
Corporate Headquarters
245 Summer St., Boston, MA 02210
www.fidelity.com
GED-UANN-1213
1.938161.101
Item 2. Code of Ethics
As of the end of the period, October 31, 2013, Fidelity Investment Trust (the trust) has adopted a code of ethics, as defined in Item 2 of Form N-CSR, that applies to its President and Treasurer and its Chief Financial Officer. A copy of the code of ethics is filed as an exhibit to this Form N-CSR.
Item 3. Audit Committee Financial Expert
The Board of Trustees of the trust has determined that Joseph Mauriello is an audit committee financial expert, as defined in Item 3 of Form N-CSR. Mr. Mauriello is independent for purposes of Item 3 of Form N-CSR.
Item 4. Principal Accountant Fees and Services
Fees and Services
The following table presents fees billed by Deloitte & Touche LLP, the member firms of Deloitte Touche Tohmatsu, and their respective affiliates (collectively, "Deloitte Entities") in each of the last two fiscal years for services rendered to Fidelity Emerging Europe, Middle East, Africa (EMEA) Fund, Fidelity Global Equity Income Fund, Fidelity International Small Cap Fund, Fidelity International Small Cap Opportunities Fund, Fidelity International Value Fund, Fidelity Series Emerging Markets Fund, Fidelity Series International Small Cap Fund, Fidelity Series International Value Fund, and Fidelity Total International Equity Fund (the "Funds"):
Services Billed by Deloitte Entities
October 31, 2013 FeesA
| Audit Fees | Audit-Related Fees | Tax Fees | All Other Fees |
Fidelity Emerging Europe, Middle East, Africa (EMEA) Fund | $50,000 | $- | $6,000 | $500 |
Fidelity Global Equity Income Fund | $46,000 | $- | $5,900 | $500 |
Fidelity International Small Cap Fund | $125,000 | $- | $6,900 | $600 |
Fidelity International Small Cap Opportunities Fund | $51,000 | $- | $5,800 | $600 |
Fidelity International Value Fund | $49,000 | $- | $5,800 | $500 |
Fidelity Series Emerging Markets Fund | $42,000 | $- | $6,900 | $1,600 |
Fidelity Series International Small Cap Fund | $45,000 | $- | $5,800 | $900 |
Fidelity Series International Value Fund | $45,000 | $- | $5,800 | $2,300 |
Fidelity Total International Equity Fund | $58,000 | $- | $6,700 | $600 |
October 31, 2012 FeesA, B
| Audit Fees | Audit-Related Fees | Tax Fees | All Other Fees |
Fidelity Emerging Europe, Middle East, Africa (EMEA) Fund | $50,000 | $- | $5,900 | $400 |
Fidelity Global Equity Income Fund | $34,000 | $- | $5,700 | $200 |
Fidelity International Small Cap Fund | $119,000 | $- | $6,800 | $500 |
Fidelity International Small Cap Opportunities Fund | $49,000 | $- | $5,700 | $400 |
Fidelity International Value Fund | $47,000 | $- | $5,700 | $400 |
Fidelity Series Emerging Markets Fund | $39,000 | $- | $6,800 | $1,000 |
Fidelity Series International Small Cap Fund | $43,000 | $- | $5,700 | $600 |
Fidelity Series International Value Fund | $43,000 | $- | $5,700 | $1,400 |
Fidelity Total International Equity Fund | $59,000 | $- | $6,600 | $400 |
A Amounts may reflect rounding.
B Fidelity Global Equity Income Fund commenced operations on May 2, 2012.
The following table presents fees billed by PricewaterhouseCoopers LLP ("PwC") in each of the last two fiscal years for services rendered to Fidelity Emerging Markets Discovery Fund, Fidelity Global Commodity Stock Fund, Fidelity International Discovery Fund, Fidelity International Growth Fund, Fidelity Series International Growth Fund, and Fidelity Total Emerging Markets Fund (the "Funds"):
Services Billed by PwC
October 31, 2013 FeesA
| Audit Fees | Audit-Related Fees | Tax Fees | All Other Fees |
Fidelity Emerging Markets Discovery Fund | $53,000 | $- | $5,200 | $1,500 |
Fidelity Global Commodity Stock Fund | $42,000 | $- | $2,700 | $1,700 |
Fidelity International Discovery Fund | $83,000 | $- | $11,000 | $5,000 |
Fidelity International Growth Fund | $59,000 | $- | $5,200 | $1,600 |
Fidelity Series International Growth Fund | $56,000 | $- | $5,900 | $5,100 |
Fidelity Total Emerging Markets Fund | $60,000 | $- | $4,400 | $1,500 |
October 31, 2012 FeesA
| Audit Fees | Audit-Related Fees | Tax Fees | All Other Fees |
Fidelity Emerging Markets Discovery Fund | $40,000 | $- | $5,100 | $1,400 |
Fidelity Global Commodity Stock Fund | $41,000 | $- | $2,900 | $1,800 |
Fidelity International Discovery Fund | $78,000 | $- | $9,600 | $4,900 |
Fidelity International Growth Fund | $54,000 | $- | $5,100 | $1,600 |
Fidelity Series International Growth Fund | $54,000 | $- | $5,100 | $4,900 |
Fidelity Total Emerging Markets Fund | $46,000 | $- | $4,300 | $1,400 |
A Amounts may reflect rounding.
The following table presents fees billed by PwC and Deloitte Entities that were required to be approved by the Audit Committee for services that relate directly to the operations and financial reporting of the Funds and that are rendered on behalf of Fidelity Management & Research Company ("FMR") and entities controlling, controlled by, or under common control with FMR (not including any sub-adviser whose role is primarily portfolio management and is subcontracted with or overseen by another investment adviser) that provide ongoing services to the Funds ("Fund Service Providers"):
Services Billed by Deloitte Entities
| October 31, 2013A | October 31, 2012A, B |
Audit-Related Fees | $1,010,000 | $720,000 |
Tax Fees | $- | $- |
All Other Fees | $800,000 | $1,305,000 |
A Amounts may reflect rounding.
B May include amounts billed prior to the Fidelity Global Equity Income Fund's commencement of operations.
Services Billed by PwC
| October 31, 2013A | October 31, 2012A, B |
Audit-Related Fees | $5,395,000 | $3,640,000 |
Tax Fees | $- | $- |
All Other Fees | $50,000 | $- |
A Amounts may reflect rounding.
"Audit-Related Fees" represent fees billed for assurance and related services that are reasonably related to the performance of the fund audit or the review of the fund's financial statements and that are not reported under Audit Fees.
"Tax Fees" represent fees billed for tax compliance, tax advice or tax planning that relate directly to the operations and financial reporting of the fund.
"All Other Fees" represent fees billed for services provided to the fund or Fund Service Provider, a significant portion of which are assurance related, that relate directly to the operations and financial reporting of the fund, excluding those services that are reported under Audit Fees, Audit-Related Fees or Tax Fees.
Assurance services must be performed by an independent public accountant.
* * *
The aggregate non-audit fees billed by PwC and Deloitte Entities for services rendered to the Funds, FMR (not including any sub-adviser whose role is primarily portfolio management and is subcontracted with or overseen by another investment adviser), and any Fund Service Provider for each of the last two fiscal years of the Funds are as follows:
Billed By | October 31, 2013 A,B | October 31, 2012 A,B |
PwC | $6,345,000 | $4,220,000 |
Deloitte Entities | $1,985,000 | $2,125,000 |
A Amounts may reflect rounding.
B May include amounts billed prior to the Fidelity Global Equity Income Fund's commencement of operations.
The trust's Audit Committee has considered non-audit services that were not pre-approved that were provided by PwC and Deloitte Entities to Fund Service Providers to be compatible with maintaining the independence of PwC and Deloitte Entities in their audits of the Funds, taking into account representations from PwC and Deloitte Entities, in accordance with Public Company Accounting Oversight Board rules, regarding their independence from the Funds and their related entities and FMR's review of the appropriateness and permissibility under applicable law of such non-audit services prior to their provision to the Fund Service Providers.
Audit Committee Pre-Approval Policies and Procedures
The trust's Audit Committee must pre-approve all audit and non-audit services provided by a fund's independent registered public accounting firm relating to the operations or financial reporting of the fund. Prior to the commencement of any audit or non-audit services to a fund, the Audit Committee reviews the services to determine whether they are appropriate and permissible under applicable law.
The Audit Committee has adopted policies and procedures to, among other purposes, provide a framework for the Committee's consideration of non-audit services by the audit firms that audit the Fidelity funds. The policies and procedures require that any non-audit service provided by a fund audit firm to a Fidelity fund and any non-audit service provided by a fund auditor to a Fund Service Provider that relates directly to the operations and financial reporting of a Fidelity fund ("Covered Service") are subject to approval by the Audit Committee before such service is provided.
All Covered Services must be approved in advance of provision of the service either: (i) by formal resolution of the Audit Committee, or (ii) by oral or written approval of the service by the Chair of the Audit Committee (or if the Chair is unavailable, such other member of the Audit Committee as may be designated by the Chair to act in the Chair's absence). The approval contemplated by (ii) above is permitted where the Treasurer determines that action on such an engagement is necessary before the next meeting of the Audit Committee.
Non-audit services provided by a fund audit firm to a Fund Service Provider that do not relate directly to the operations and financial reporting of a Fidelity fund are reported to the Audit Committee on a periodic basis.
Non-Audit Services Approved Pursuant to Rule 2-01(c)(7)(i)(C) and (ii) of Regulation S-X ("De Minimis Exception")
There were no non-audit services approved or required to be approved by the Audit Committee pursuant to the De Minimis Exception during the Funds' last two fiscal years relating to services provided to (i) the Funds or (ii) any Fund Service Provider that relate directly to the operations and financial reporting of the Funds.
Item 5. Audit Committee of Listed Registrants
Not applicable.
Item 6. Investments
(a) Not applicable.
(b) Not applicable
Item 7. Disclosure of Proxy Voting Policies and Procedures for Closed-End Management Investment Companies
Not applicable.
Item 8. Portfolio Managers of Closed-End Management Investment Companies
Not applicable.
Item 9. Purchase of Equity Securities by Closed-End Management Investment Company and Affiliated Purchasers
Not applicable.
Item 10. Submission of Matters to a Vote of Security Holders
There were no material changes to the procedures by which shareholders may recommend nominees to the trust's Board of Trustees.
Item 11. Controls and Procedures
(a)(i) The President and Treasurer and the Chief Financial Officer have concluded that the trust's disclosure controls and procedures (as defined in Rule 30a-3(c) under the Investment Company Act) provide reasonable assurances that material information relating to the trust is made known to them by the appropriate persons, based on their evaluation of these controls and procedures as of a date within 90 days of the filing date of this report.
(a)(ii) There was no change in the trust's internal control over financial reporting (as defined in Rule 30a-3(d) under the Investment Company Act) that occurred during the second fiscal quarter of the period covered by this report that has materially affected, or is reasonably likely to materially affect, the trust's internal control over financial reporting.
Item 12. Exhibits
(a) | (1) | Code of Ethics pursuant to Item 2 of Form N-CSR is filed and attached hereto as EX-99.CODE ETH. |
(a) | (2) | Certification pursuant to Rule 30a-2(a) under the Investment Company Act of 1940 (17 CFR 270.30a-2(a)) is filed and attached hereto as Exhibit 99.CERT. |
(a) | (3) | Not applicable. |
(b) | | Certification pursuant to Rule 30a-2(b) under the Investment Company Act of 1940 (17 CFR 270.30a-2(b)) is furnished and attached hereto as Exhibit 99.906CERT. |
SIGNATURES
Pursuant to the requirements of the Securities Exchange Act of 1934 and the Investment Company Act of 1940, the registrant has duly caused this report to be signed on its behalf by the undersigned, thereunto duly authorized.
Fidelity Investment Trust
By: | /s/Kenneth B. Robins |
| Kenneth B. Robins |
| President and Treasurer |
| |
Date: | December 26, 2013 |
Pursuant to the requirements of the Securities Exchange Act of 1934 and the Investment Company Act of 1940, this report has been signed below by the following persons on behalf of the registrant and in the capacities and on the dates indicated.
By: | /s/Kenneth B. Robins |
| Kenneth B. Robins |
| President and Treasurer |
| |
Date: | December 26, 2013 |
By: | /s/Christine Reynolds |
| Christine Reynolds |
| Chief Financial Officer |
| |
Date: | December 26, 2013 |